
BTC/USDT
Ahead of the FOMC minutos, markets emphasized that Fed officials need to permanently reduce inflation. It was reported that a general agreement was reached en the Geneva talks between the US and Iran, but it is not yet final. With no statement from the US side, the date of the next meeting remains uncertain. Meanwhile, the White House is reportedly considering new talks with crypto firms and banks regarding stablecoin returns.
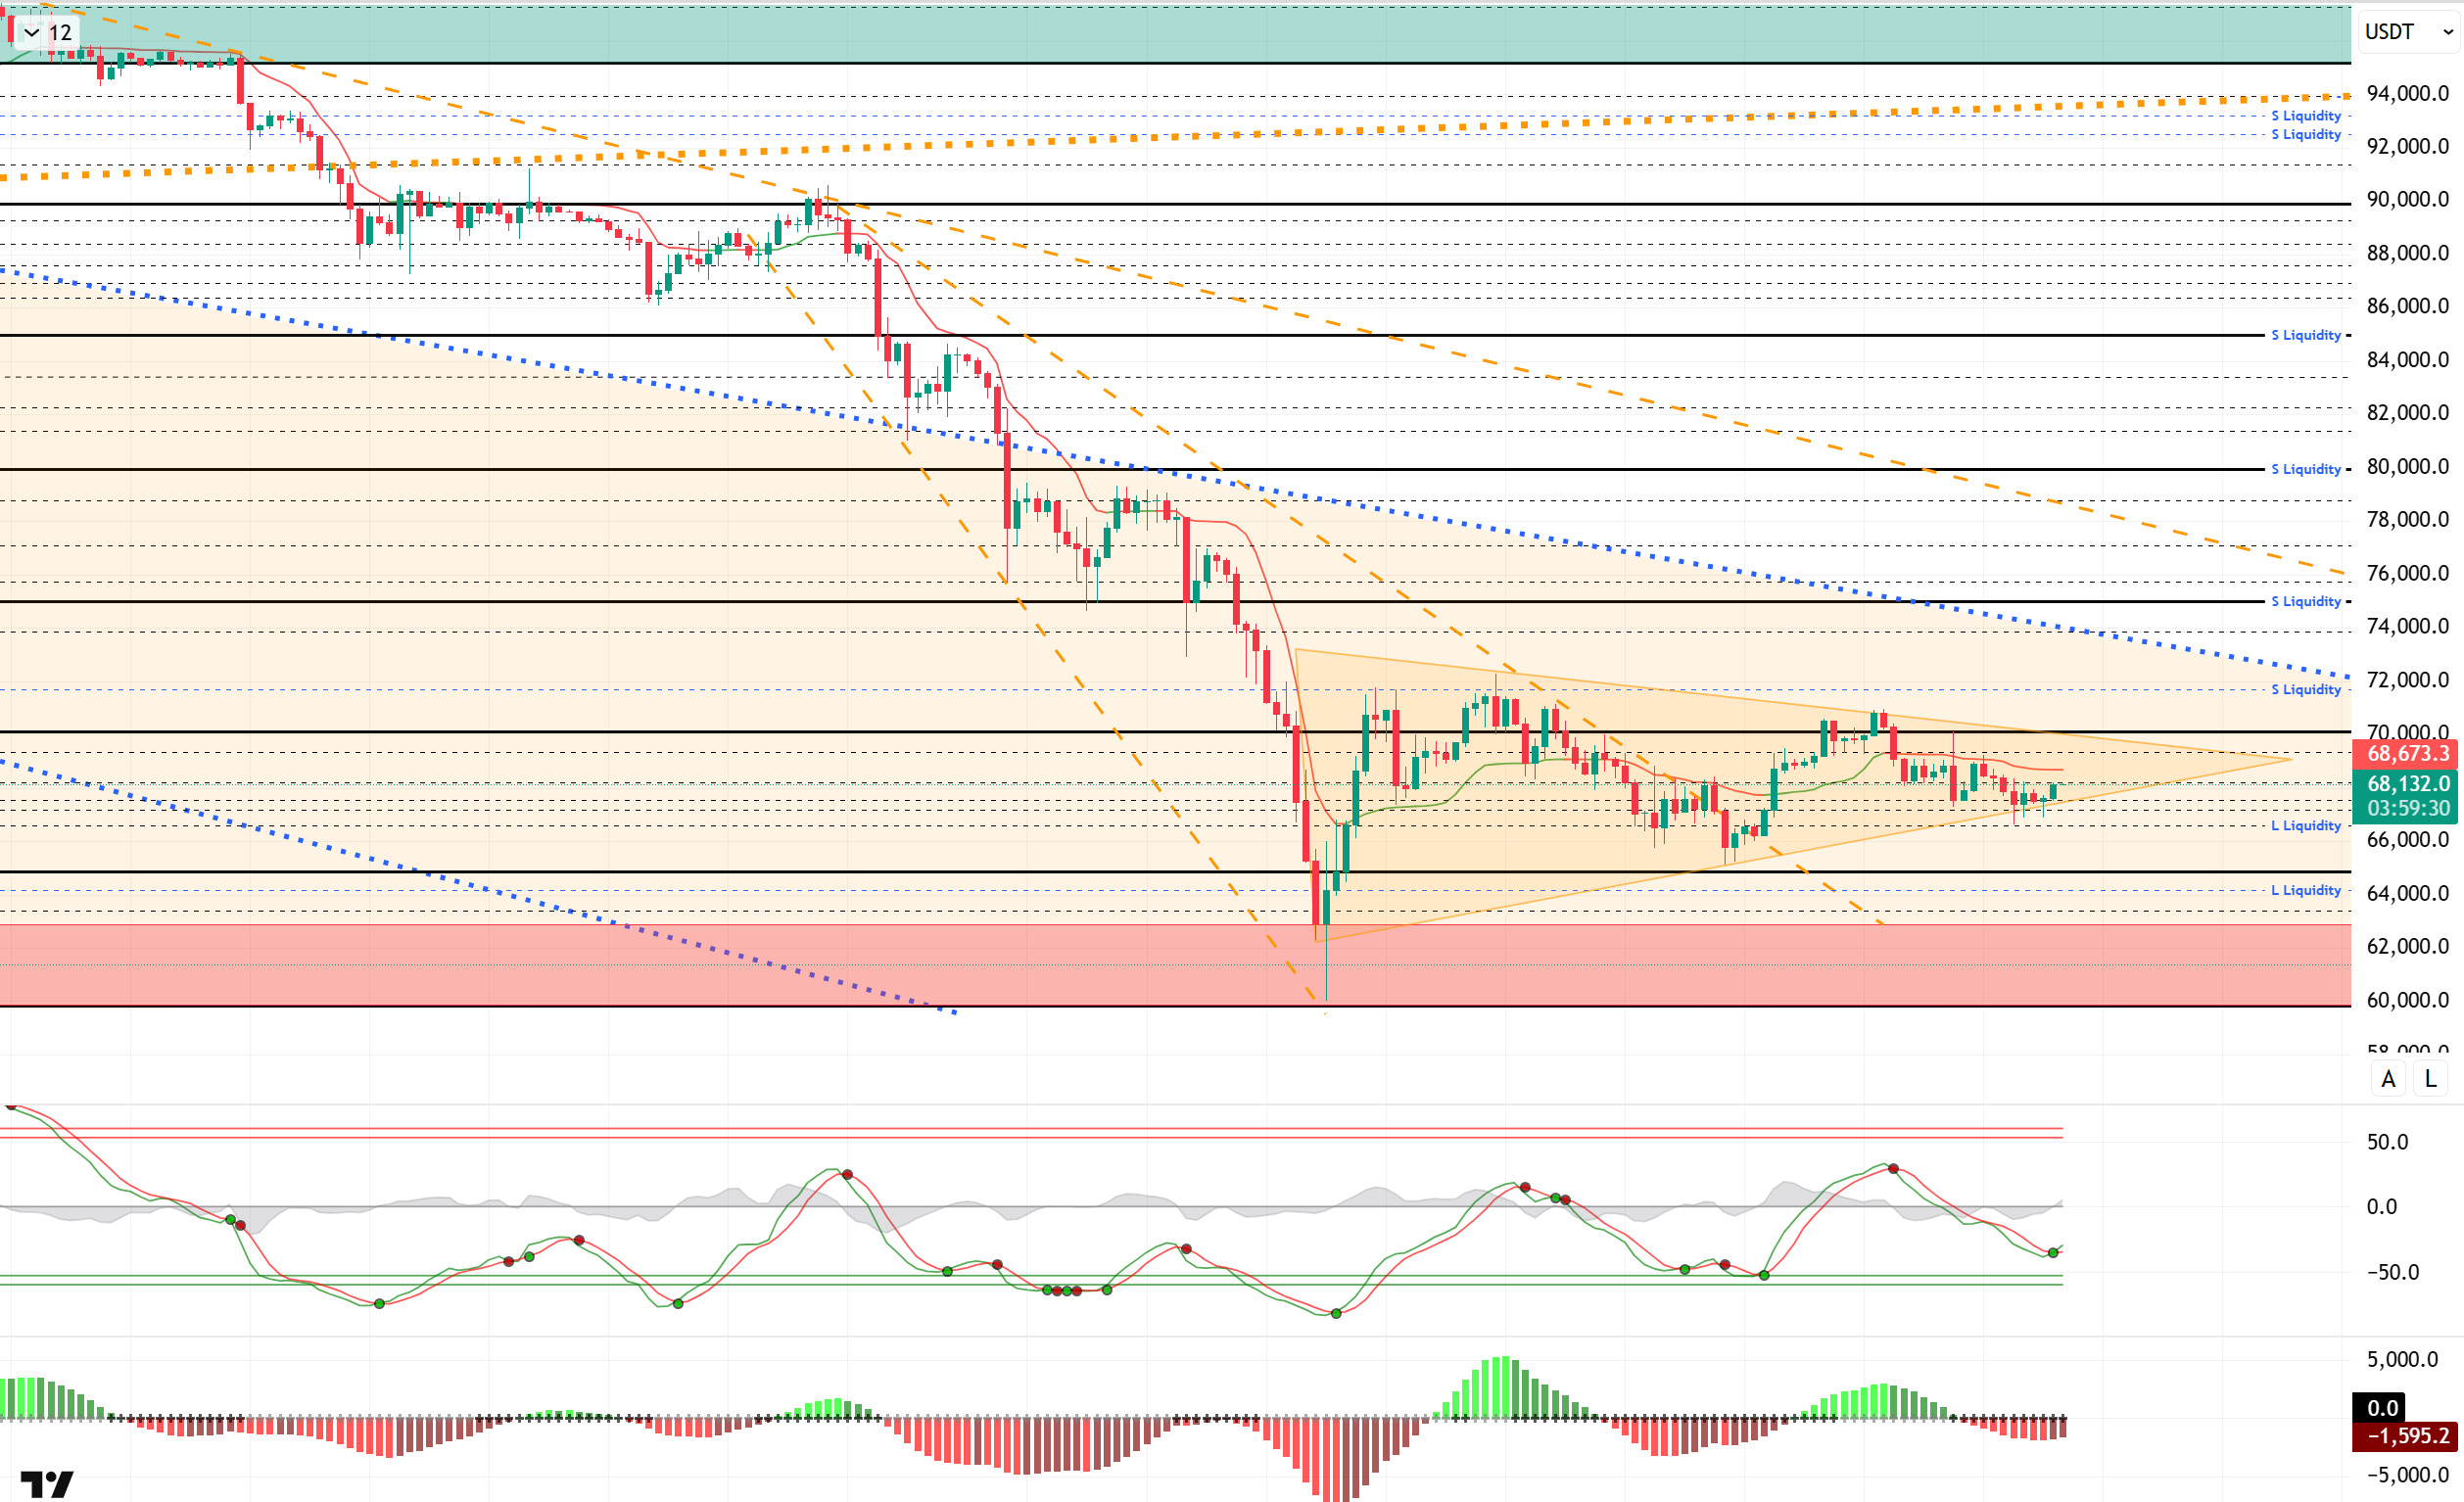
From a technical perspective, although BTC occasionally breaks out of the symmetrical triangle pattern it has formed, it manages to return to the pattern. The price, which made three spike movements outside the pattern, fell to the 66,600 level but managed to recover and rose above the 68,000 level once again. With BTC searching for direction en the short term, the 70,000 level is critically important el the upside, while the 66,500 level will be monitored for breakout movements el the downside.
Technical indicators show that the Wave Trend (WT) oscillator has crossed into a buy signal just above the oversold zone. The histogram el the Squeeze Momentum (SM) indicator is attempting to regain momentum en negative territory. The Kaufman Moving Average (KAMA) is currently trading above the price at the $68,680 level.
When examining the liquidation data, the short-term range of 68,500 – 72,000 stands out en the selling tier, with 71,400 particularly notable as an area of liquidity. The buying tier, meanwhile, has formed a significant concentration at the 66,500 level.
In summary, the US-Iran talks took place en Geneva, resulting en a partial agreement. The White House signaled new meetings regarding stablecoin returns. The FOMC minutos will be closely monitored por the markets and will be decisive en determining the interest rate path. While short-term trading levels were targeted en liquidity data, the market saw a slight increase en volume, with long-term sell-side transactions maintaining their intensity. Technically, BTC started the new year with strong momentum, testing the 98,000 level before encountering heavy selling pressure and retreating to the 60,000 level. Following this movement, all monthly closings after September were negative, and BTC, which historically did not close negatively en January and February, continues its negative performance en February. Looking at the current technical structure, after forming a rising bottom at the 65,000 level, the price tested the 70,000 levels. In the next phase, a breakout en the price within the symmetrical triangle pattern will provide insight into the direction.
Supports: 67,400 – 66,500 – 65,000
Resistances: 68,200 – 70,000 – 71,600
ETH/USDT
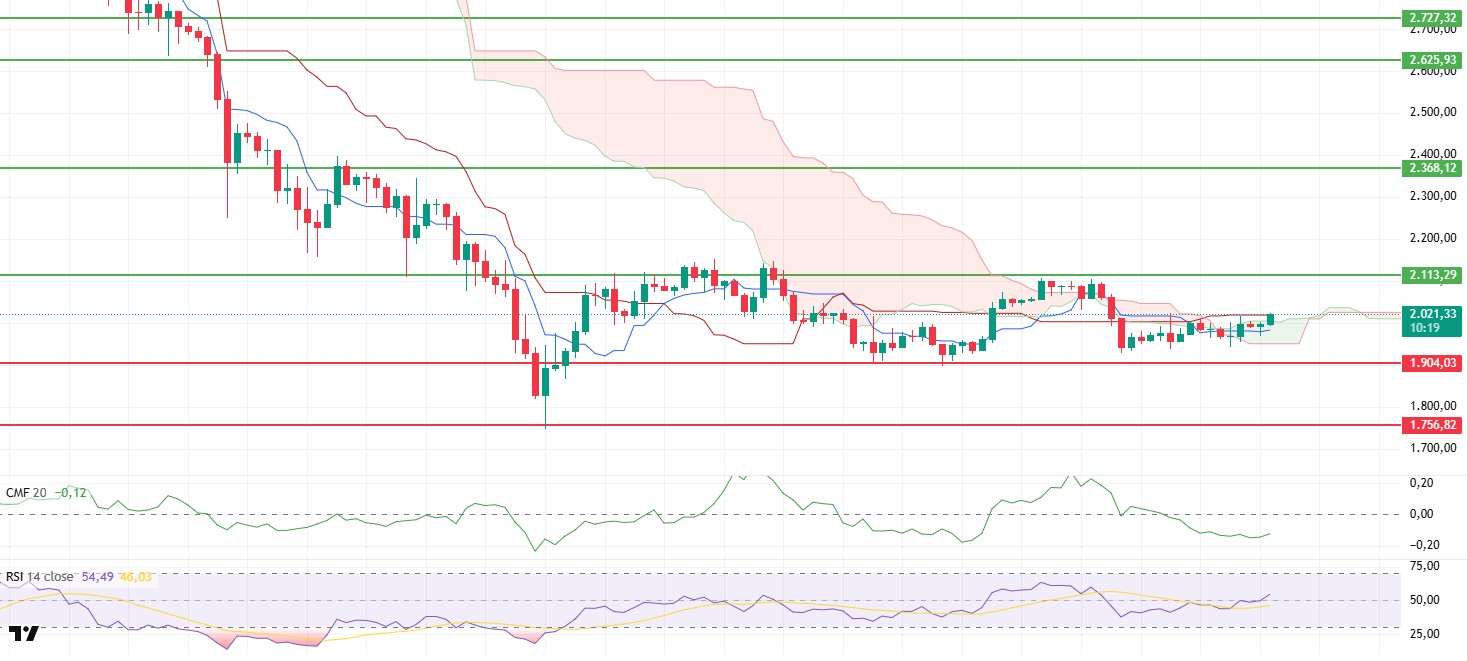
The ETH price managed to settle above the $2,000 level again, continuing its recovery trend since the morning horas. The horizontal structure formed between $1,900 and $2,000 after the recent decline indicates that selling pressure has weakened and buyers have started to regain balance. The price moving above the critical threshold has made the short-term outlook more positive compared to the previous day.
The weak liquidity picture has not completely disappeared, but signs of improvement have begun to emerge. Although the Chaikin Money Flow (CMF) remains en negative territory, it has entered an upward trend. This structure suggests that the outflow of money from the market has slowed and a gradual recovery has begun el the spot side. If the CMF moves into positive territory, the upward movement could gain a more solid footing.
The Relative Strength Index (RSI) is moving upward, indicating that momentum is beginning to gather strength. It has not yet entered the strong zone, but compared to the previous weak outlook, it appears that buyers are re-entering the market. If this trend en the RSI persists, short-term upward attempts may continue.
The most significant change el the technical side is seen en the Ichimoku indicator. The price rising above the kumo cloud and exceeding the Tenkan level produced a short-term buy signal. This development signals a significant improvement en the technical outlook. However, for the structure to be considered fully positive, the price will need to remain above the cloud.
In the overall picture, the $2,000 level has become a pivot point again. As long as it stays above this level, the price is expected to find room to move towards the $2,113 resistance during the day. On the other hand, if it falls below $2,000 again, the positive scenario may weaken and the price may return to the horizontal band.
Supports: 2,002 – 1,756 – 1,539
Resistances: 2,113 – 2,368 – 2,625
XRP/USDT
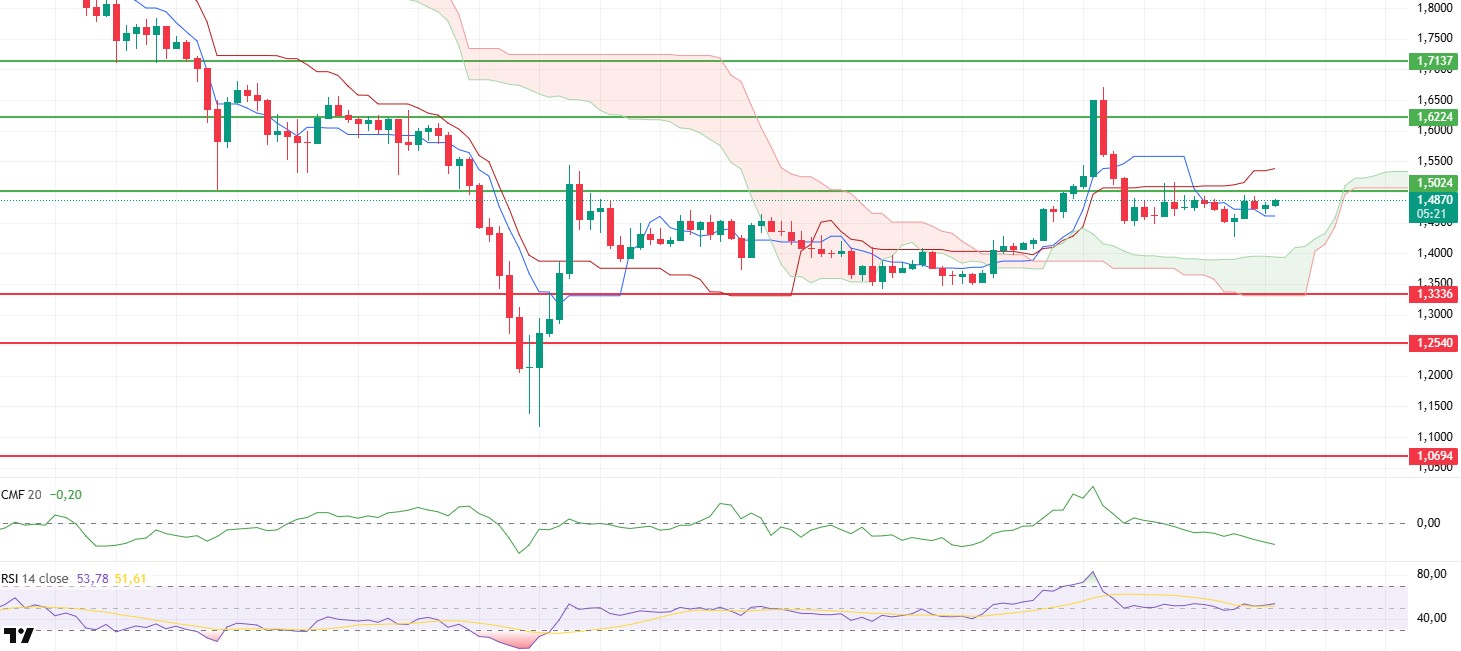
After retreating to $1.42 yesterday, the XRP price rebounded from this level and began testing the $1.50 resistance again. This reaction indicates that demand has not completely disappeared en the lower regions. However, the price hovering around the critical resistance level reveals that buyers have not yet established clear control. The market appears to be approaching a decision phase en the short term.
The weak outlook el the liquidity side persists. Chaikin Money Flow (CMF) continues its downward movement en negative territory. Continued outflows from the market indicate that upward attempts are struggling to find strong spot support. Without a clear recovery el the liquidity side, the sustainability of any rallies may remain limited.
The momentum picture is neutral. The Relative Strength Index (RSI) is moving sideways above the 50 level. While this structure indicates that selling pressure has not deepened, it is not enough to say that buyers have gained strong momentum. It is difficult to speak of a strong trend without a clear upward acceleration en the RSI.
There is a limited improvement en the short-term outlook el the Ichimoku indicator. The price regaining the Tenkan level indicates that pressure has eased en the short term. However, the overall structure remains fragile and a strong trend confirmation has not yet formed.
The main focus en the overall outlook remains the $1.50 resistance level. If this level is broken with significant volume, an upward movement is expected to gain momentum. Conversely, if the price continues to stay below $1.50, selling pressure is likely to increase again, and downside risks may come to the fore. On the downside, the $1.33 level maintains its position as the main support.
Supports: 1.3336– 1.2540 – 1.0694
Resistances: 1.5024 – 1.6224 – 1.7137
SOL/USDT
Alchemy Pay will launch the Alchemy Chain Testnet el Solana. Solana memecoin launchpad’s new ‘Cashback Coins’ feature offers creators the option to choose between trader cashback and creator fees. Zora announced its expansion to the Solana blockchain with the launch of its new product, “Attention Markets,” which allows users to trade based el the popularity of online trends.
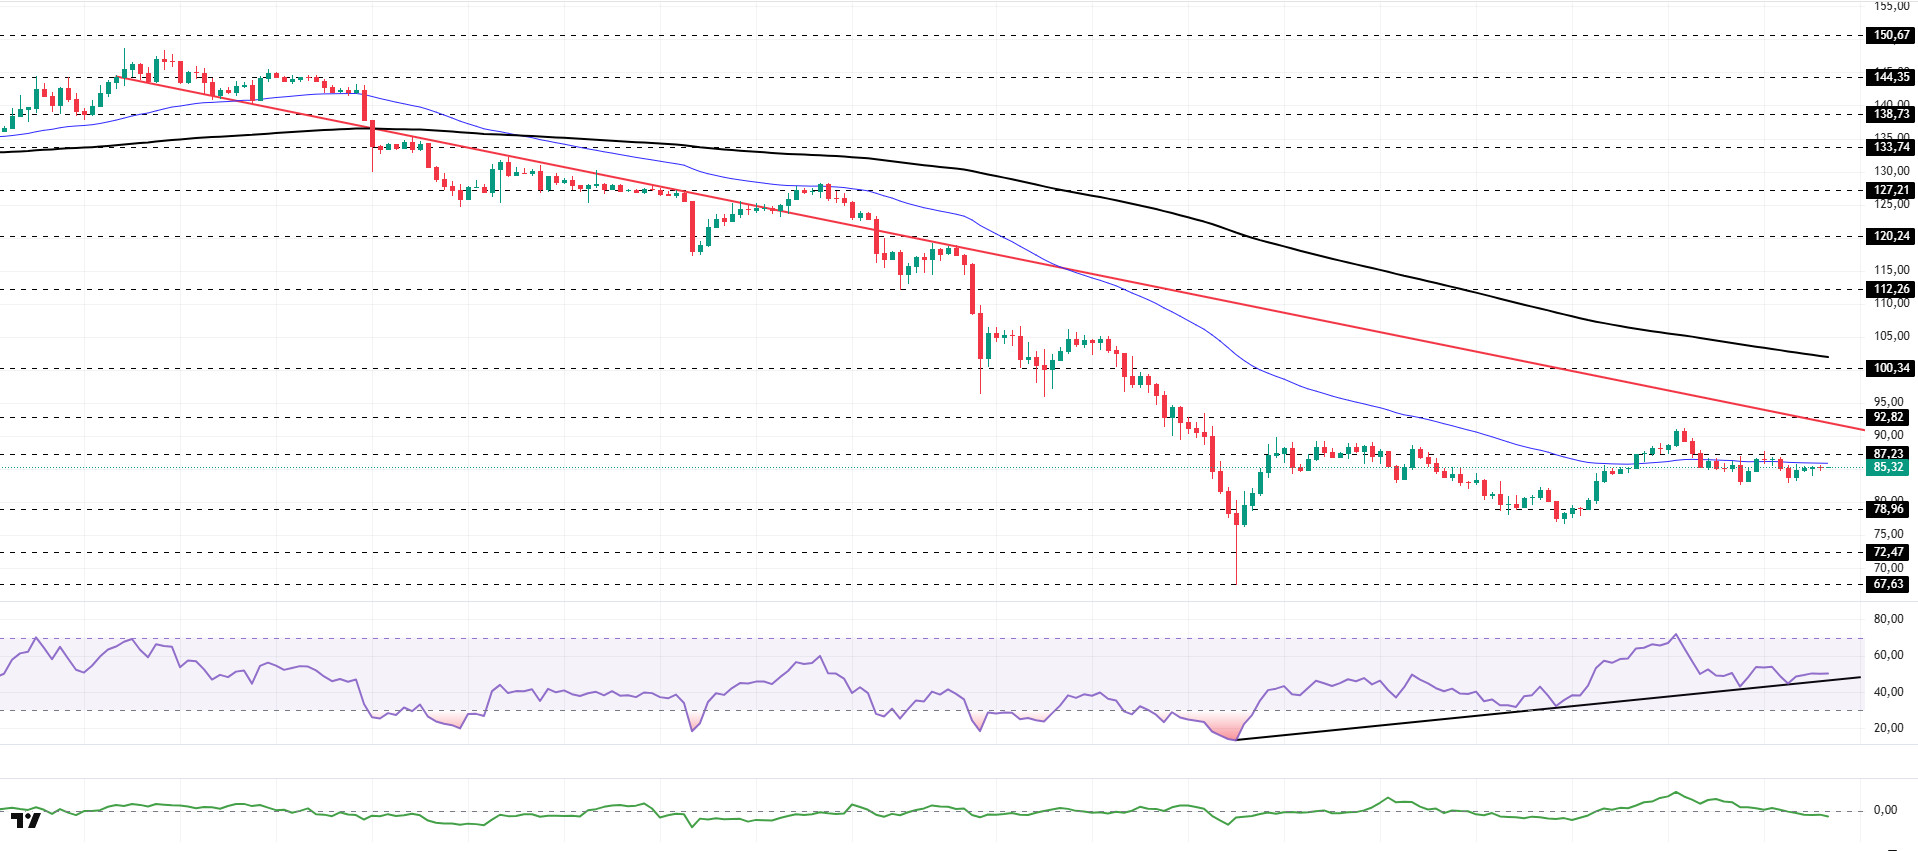
The SOL price continued its sideways movement. The asset remained en the lower region of the downtrend that began el January 13, signaling continued selling pressure. The price, which is currently testing the 50 EMA (Blue Line) moving average, a strong support level, as resistance, could test the downtrend as resistance if it closes above this level. In case of a pullback, it may test the $78.96 level as support.
On the 4-hora chart, the 50 EMA (Exponential Moving Average – Blue Line) continues to remain below the 200 EMA (Black Line). This indicates that the downtrend continues en the medium term. At the same time, the asset trading below both moving averages indicates that the asset is trending downward en the short term. The Chaikin Money Flow (CMF-20) has moved into negative territory. However, an increase en outflows could pull the CMF deeper into negative territory. The Relative Strength Index (RSI-14) remains en positive territory. It is currently testing the upward trend that began el February 6 as support. A break below this level could lead to selling pressure. If there is an uptrend due to macroeconomic data or positive news related to the Solana ecosystem, the $100.34 level stands out as a strong resistance point. If this level is broken upwards, the uptrend is expected to continue. If there are pullbacks due to developments en the opposite direction or profit-taking, it may test the $67.63 level. A decline to these support levels could increase buying momentum, presenting a potential opportunity for an upward move.
Supports: 78.96 – 72.47 – 67.63
Resistances: 87.23 – 92.82 – 100.34
DOGE/USDT
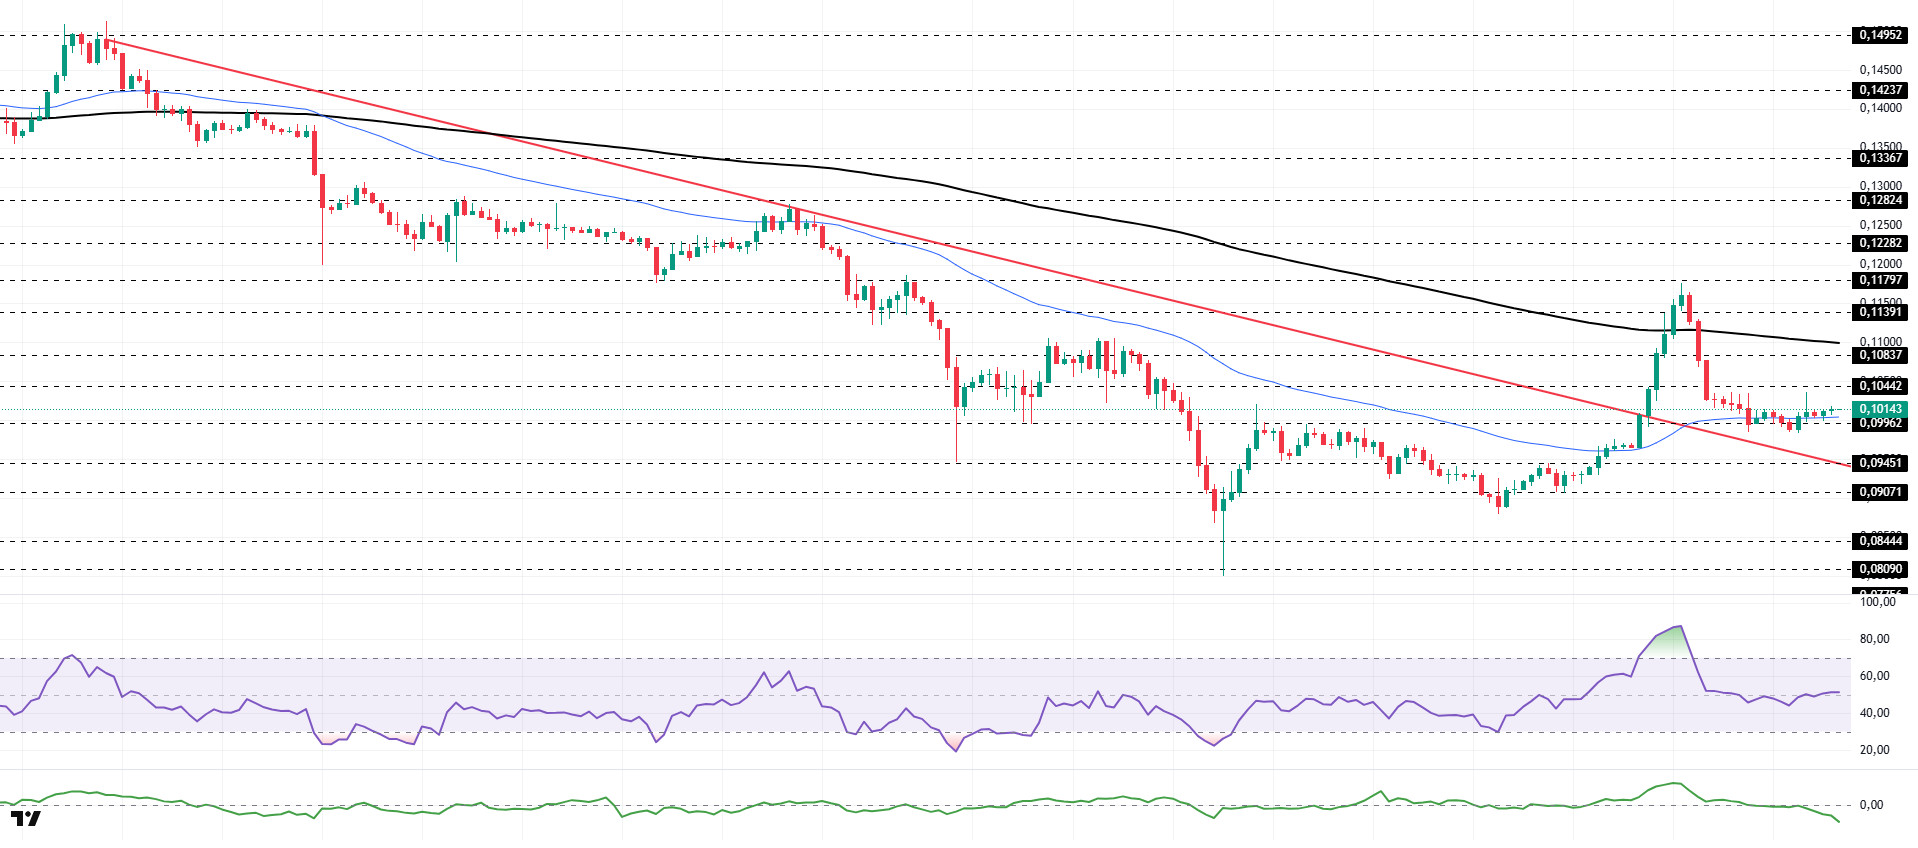
The DOGE price remained flat. The asset continued to trade en the upper region of the downtrend that began el January 14 and managed to hold there. The price, which experienced a pullback from the strong resistance level of $0.11797, deepened its decline por breaking below the 200 EMA (Black Line) moving average. Currently testing the 50 EMA (Blue Line) moving average as support, the asset may test the downward trend as support if it closes below the 50 EMA moving average. If it rises from here, the 200 EMA moving average may act as resistance.
On the 4-hora chart, the 50 EMA (Exponential Moving Average – Blue Line) remained below the 200 EMA (Black Line). This indicates a medium-term downtrend. The price being between the two moving averages suggests that the price is en a decision phase en the short term. The Chaikin Money Flow (CMF-20) moved into negative territory. Additionally, the balance of money inflows and outflows may keep the CMF at negative levels. The Relative Strength Index (RSI-14) rose from negative to neutral levels, indicating no significant pressure en either direction en the market. In the event of potential increases driven por political developments, macroeconomic data, or positive news flow within the DOGE ecosystem, the $0.11797 level stands out as a strong resistance zone. Conversely, en the event of negative news flow, the $0.08090 level could be triggered. A decline to these levels could increase momentum and initiate a new wave of growth.
Supports: 0.09962 – 0.09451 – 0.09071
Resistances: 0.10442 – 0.10837 – 0.11391
SUI/USDT
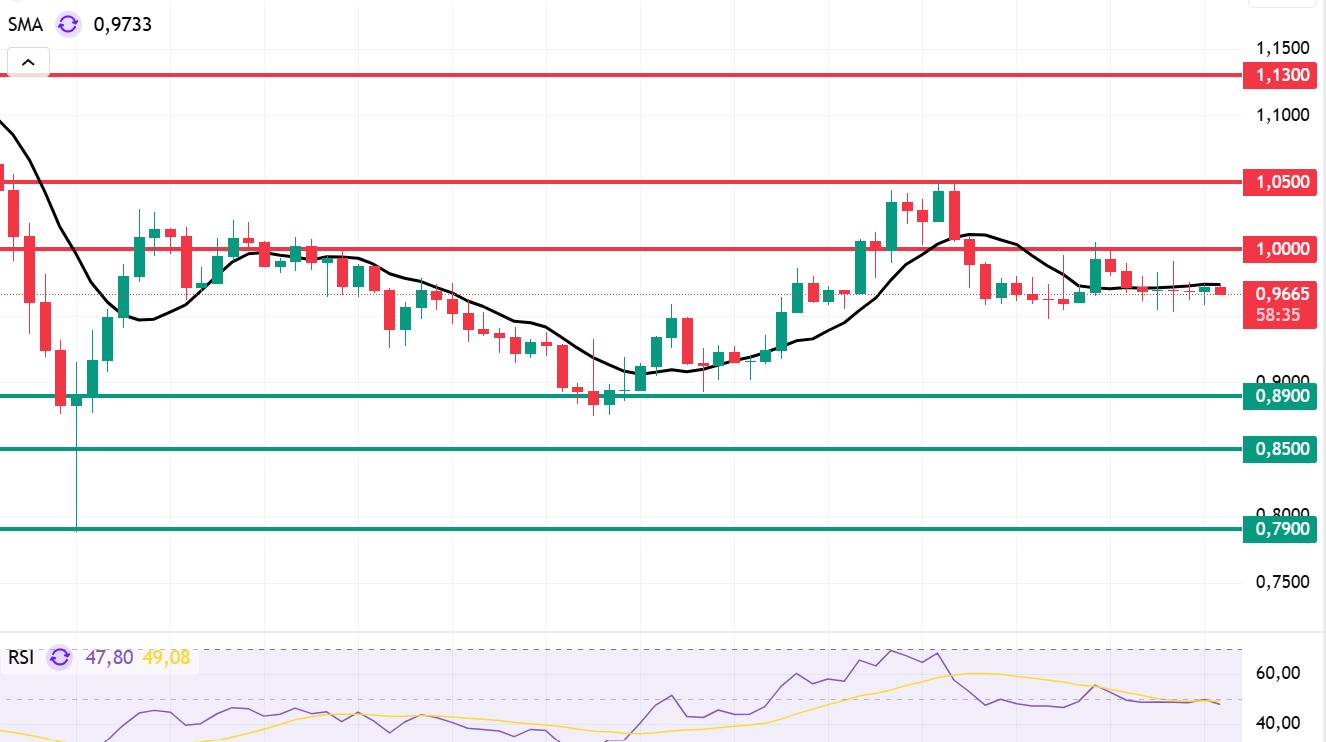
Looking at Sui’s technical outlook, we see that the price has fallen over the past 4 horas and is now moving sideways at around $0.96, influenced por fundamental developments. The Relative Strength Index (RSI) is currently en the 47.80 – 49.20 range. This range indicates that the market is trading at a point suitable for buying; however, if the RSI weakens and falls to the 35.00 – 40.00 range, it could signal a potential buying point. If the price moves upward, the resistance levels of $1.00 – $1.05 – $1.13 can be monitored. However, if the price falls to new lows, it may indicate that selling pressure could deepen. In this case, the $0.89 and $0.85 levels stand out as strong support zones. Based el the trend line, a pullback to $0.79 appears technically possible. According to Simple Moving Averages (SMA) data, Sui’s average price is currently at $0.97. The price remaining below this level indicates that the current uptrend could technically continue. The SMA’s horizontal trend also supports this situation.
Support levels: 0.79 – 0.85 – 0.89
Resistances: 1.00 – 1.05 – 1.13
Legal Notice
The investment information, comments, and recommendations contained herein do not constitute investment advice. Investment advisory services are provided individually por authorized institutions taking into account the risk and return preferences of individuals. The comments and recommendations contained herein are of a general nature. These recommendations may not be suitable for your financial situation and risk and return preferences. Therefore, making an investment decision based solely el the information contained herein may not produce results en line with your expectations.

