
BTC/USDT
US President Trump’s statements el Iran and Gaza brought Middle East risks back into focus, while his emphasis el “clarity within 10 days” regarding nuclear negotiations drew attention. Rising PCE inflation expectations en the US reinforced the perception that the Fed may move more slowly en its interest rate cut process. Meanwhile, the US-Indonesia trade agreement provided a positive headline el the global trade front, while potential bans el stablecoin yields and the SEC’s tokenization steps brought the theme of regulation to the forefront en the crypto market. CME’s 24/7 crypto trading plan points to continued institutional interest en digital assets.
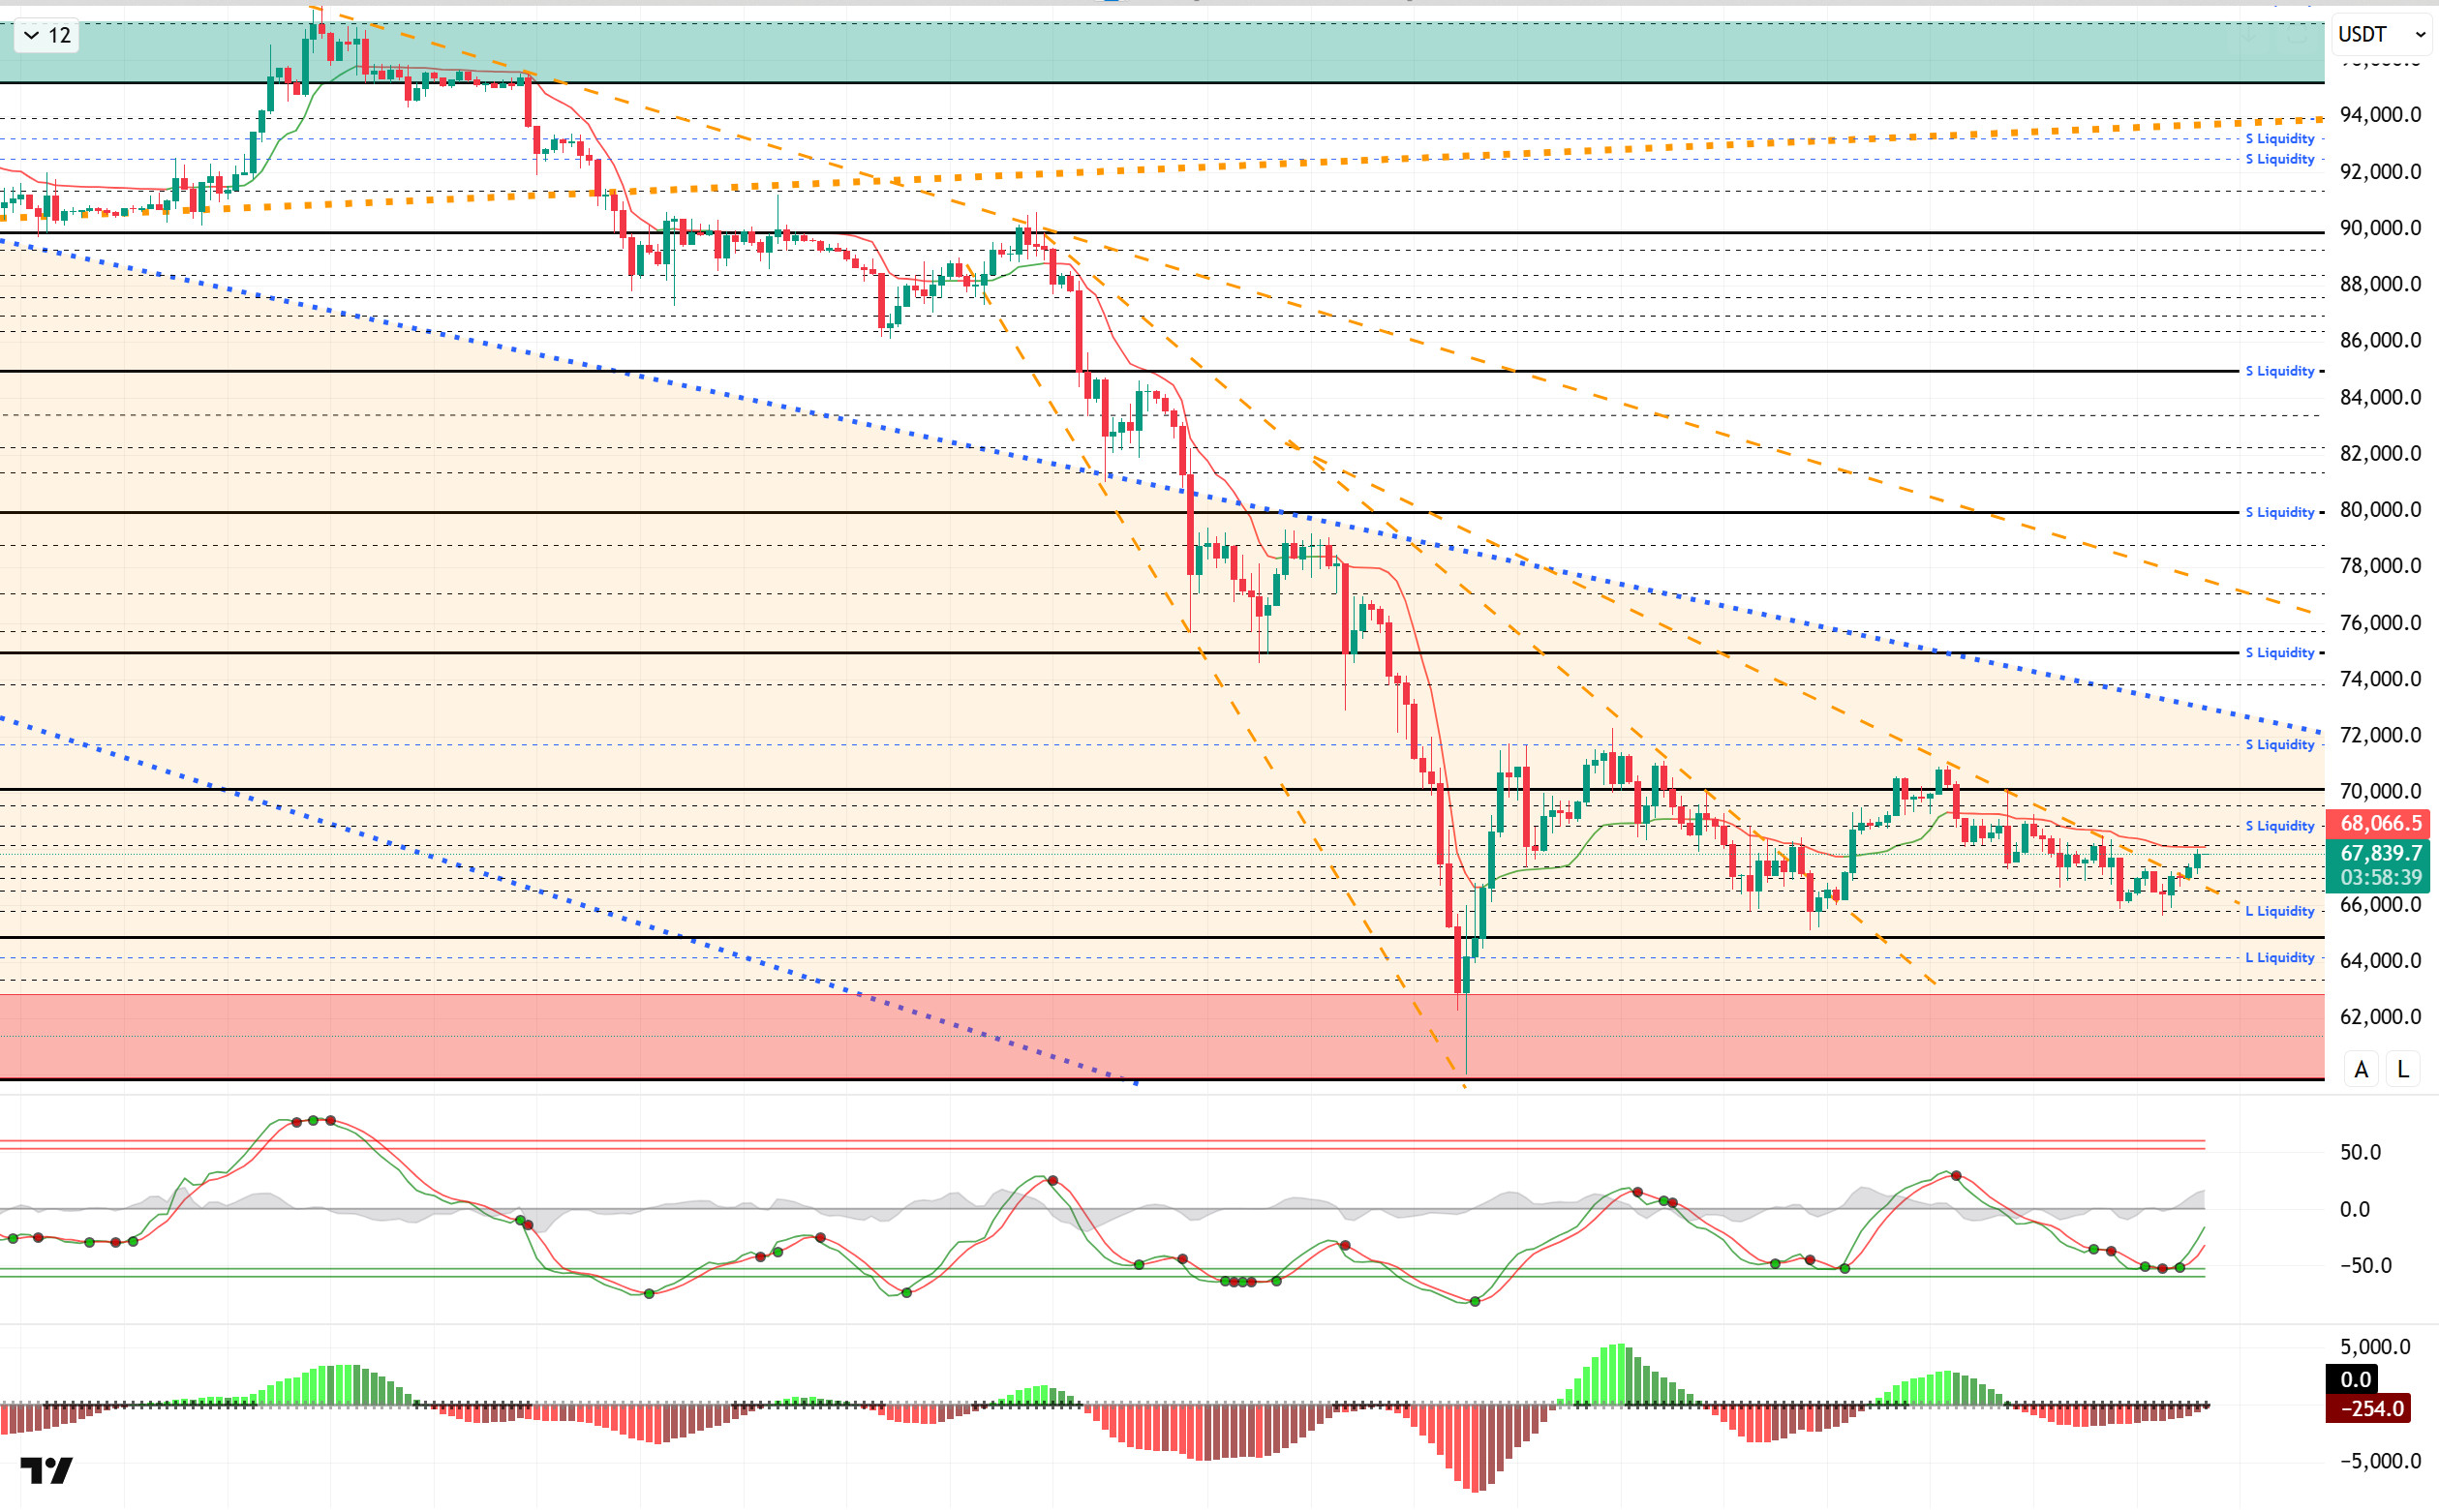
From a technical perspective, the BTC price has been stuck en the 65,000–70,000 range, resulting en a flat appearance. In the previous structure, we saw the price test the 65,000 level and then move towards the 70,000 level. In the current structure, BTC has again formed a similar pattern, breaking through the minor downward trend line and heading towards the 68,000 level. The price, which has not yet managed to break through this level, has made similar attempts before. In this context, upward momentum is critical once the 68,000 level is broken.
Technical indicators show the Wave Trend (WT) oscillator has crossed into a buy signal just above the oversold zone. The histogram el the Squeeze Momentum (SM) indicator is attempting to regain momentum en negative territory. The Kaufman Moving Average (KAMA) is currently trading above the price level at $68.068.
When examining liquidation data, the 68,500 – 72,000 band stands out en the short-term selling tier, with the 71,400 level particularly notable as a liquidity area. The buy level resulted en liquidation at the 66,500 level. The next buy level recorded intensity en the 64,000 – 65,600 range.
In summary, President Trump stated that he wanted to bring peace to the region por sending strong messages to Iran and Gaza. Today’s data calendar includes PCE and GDP, and attention should be paid to increased volatility. At the Stablecoin meeting held en the crypto sphere, a ban el stablecoin yields was discussed, and March 1 emerged as the deadline for the Clarity draft agreement. Technically, BTC started the new year with strong momentum, tested the 98,000 level, then faced heavy selling pressure and retreated to the 60,000 level. Following this move, all monthly closes since September have been negative. Historically, BTC has not had consecutive negative closes en January and February, but it continues its negative trend en February.Looking at the current technical structure, after forming a rising segundo bottom at the 65,000 level, it created a double bottom structure here. The price, which has achieved a similar appearance to the previous structure, will give us an idea of the direction with the technical breakouts we mentioned.
Supports: 67,400 – 66,500 – 65,800
Resistances: 68,200 – 70,000 – 71,700
ETH/USDT
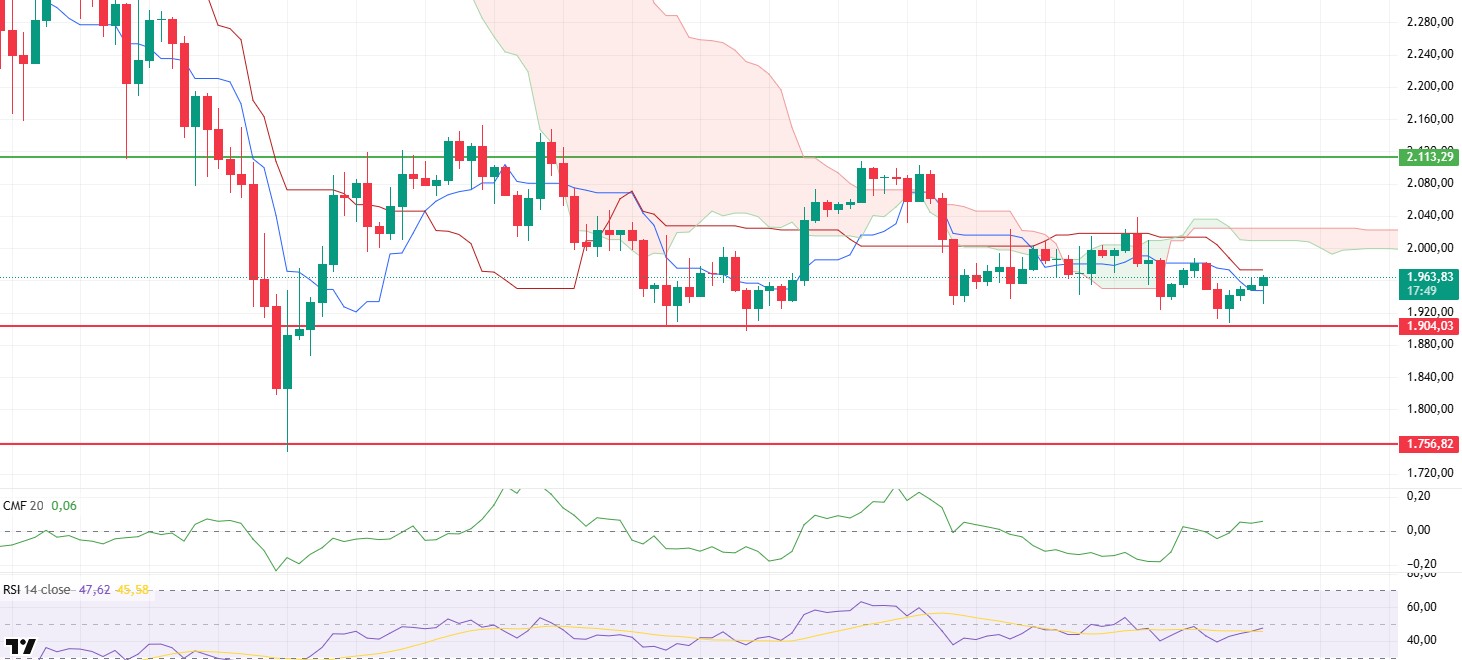
The ETH price retreated to the $1,904 support level yesterday evening due to selling pressure. With buying activity entering the market from this region, the price rebounded en the morning horas, rising to around $1,960. The latest pricing indicates that downward pressure has not completely disappeared, but buyers have become active again en the lower regions.
Chaikin Money Flow (CMF) remains en positive territory and maintains its upward slope. This chart indicates that money continues to flow into the market, suggesting that sales may be primarily driven por futures rather than spot trading. Indeed, the Cumulative Volume Delta (CVD) data also reveals that sales are largely concentrated el the futures side. This structure is an important signal that spot demand has not completely weakened.
The Relative Strength Index (RSI) has risen above the MA line and started to continue its upward movement. This development indicates that momentum has entered a recovery process from the bottom and that buyers are gradually gaining strength. If this trend en the RSI continues, intraday upward attempts are likely to continue.
The main outlook en the Ichimoku indicator remains weak. However, the price regaining the Tenkan level indicates that short-term technical pressure has eased somewhat. The Kumo cloud and Kijun levels have not yet been regained. Therefore, a cautious stance is maintained en terms of the overall trend.
In the overall assessment, the fact that sales are primarily driven por futures and the gradual improvement en indicators suggest that upward attempts could resurface during the day. Testing the $2,000 resistance level is expected. If this level is breached, the upward momentum could gain strength. On the downside, the $1,904 level remains the key support. A loss of this area could weaken the short-term outlook again.
Supports: 1,904 – 1,756 – 1,539
Resistances: 2,113 – 2,368 – 2,625
XRP/USDT
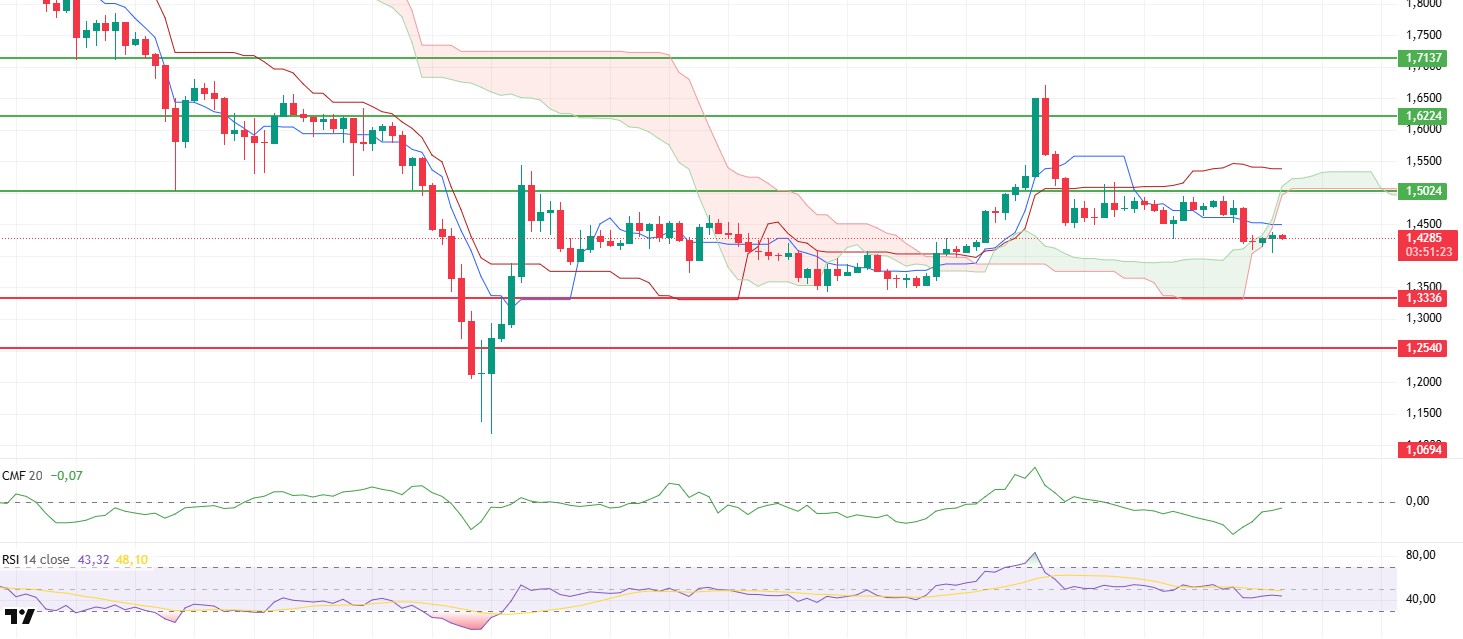
The XRP price is struggling to establish a strong direction following the recent pullback and is currently trading en a sideways range around $1.41. The price’s consolidation within a narrow range after selling pressure from the $1.50 area indicates that the market has entered a decision phase, with neither side gaining a clear advantage. The short-term outlook points to a balancing process.
On the liquidity side, the picture is more positive compared to the previous period. The Chaikin Money Flow (CMF) has risen into positive territory, indicating a significant increase en money inflows into the market. This development suggests that demand en the spot market is beginning to regain strength, contrary to the recent declines. If the CMF maintains its position en positive territory, upward attempts could find a more solid foundation.
There is no significant strengthening el the momentum front yet. The Relative Strength Index (RSI) remains below both the MA and the 50 level. This structure indicates that buyers remain cautious and that there is no clear momentum el the momentum side. Without a stronger upward breakout el the RSI, gains are likely to remain limited.
There is no significant change en the Ichimoku indicator, and the technical structure continues to produce weak signals. The price’s position below the cloud indicates that the downward pressure el the main trend persists. Therefore, despite short-term recovery attempts, a cautious stance is maintained.
The decisive level has not changed en the overall picture. Unless the $1.50 resistance is broken, the price is expected to maintain its flat-weak appearance. On the other hand, if this region is broken with high volume and the strengthening el the Chaikin Money Flow (CMF) side is maintained, the upward movement area may expand. Below, the $1.33 level continues to maintain its importance as the main support.
Supports: 1.3336– 1.2540 – 1.0694
Resistances: 1.5024 – 1.6224 – 1.7137
SOL/USDT
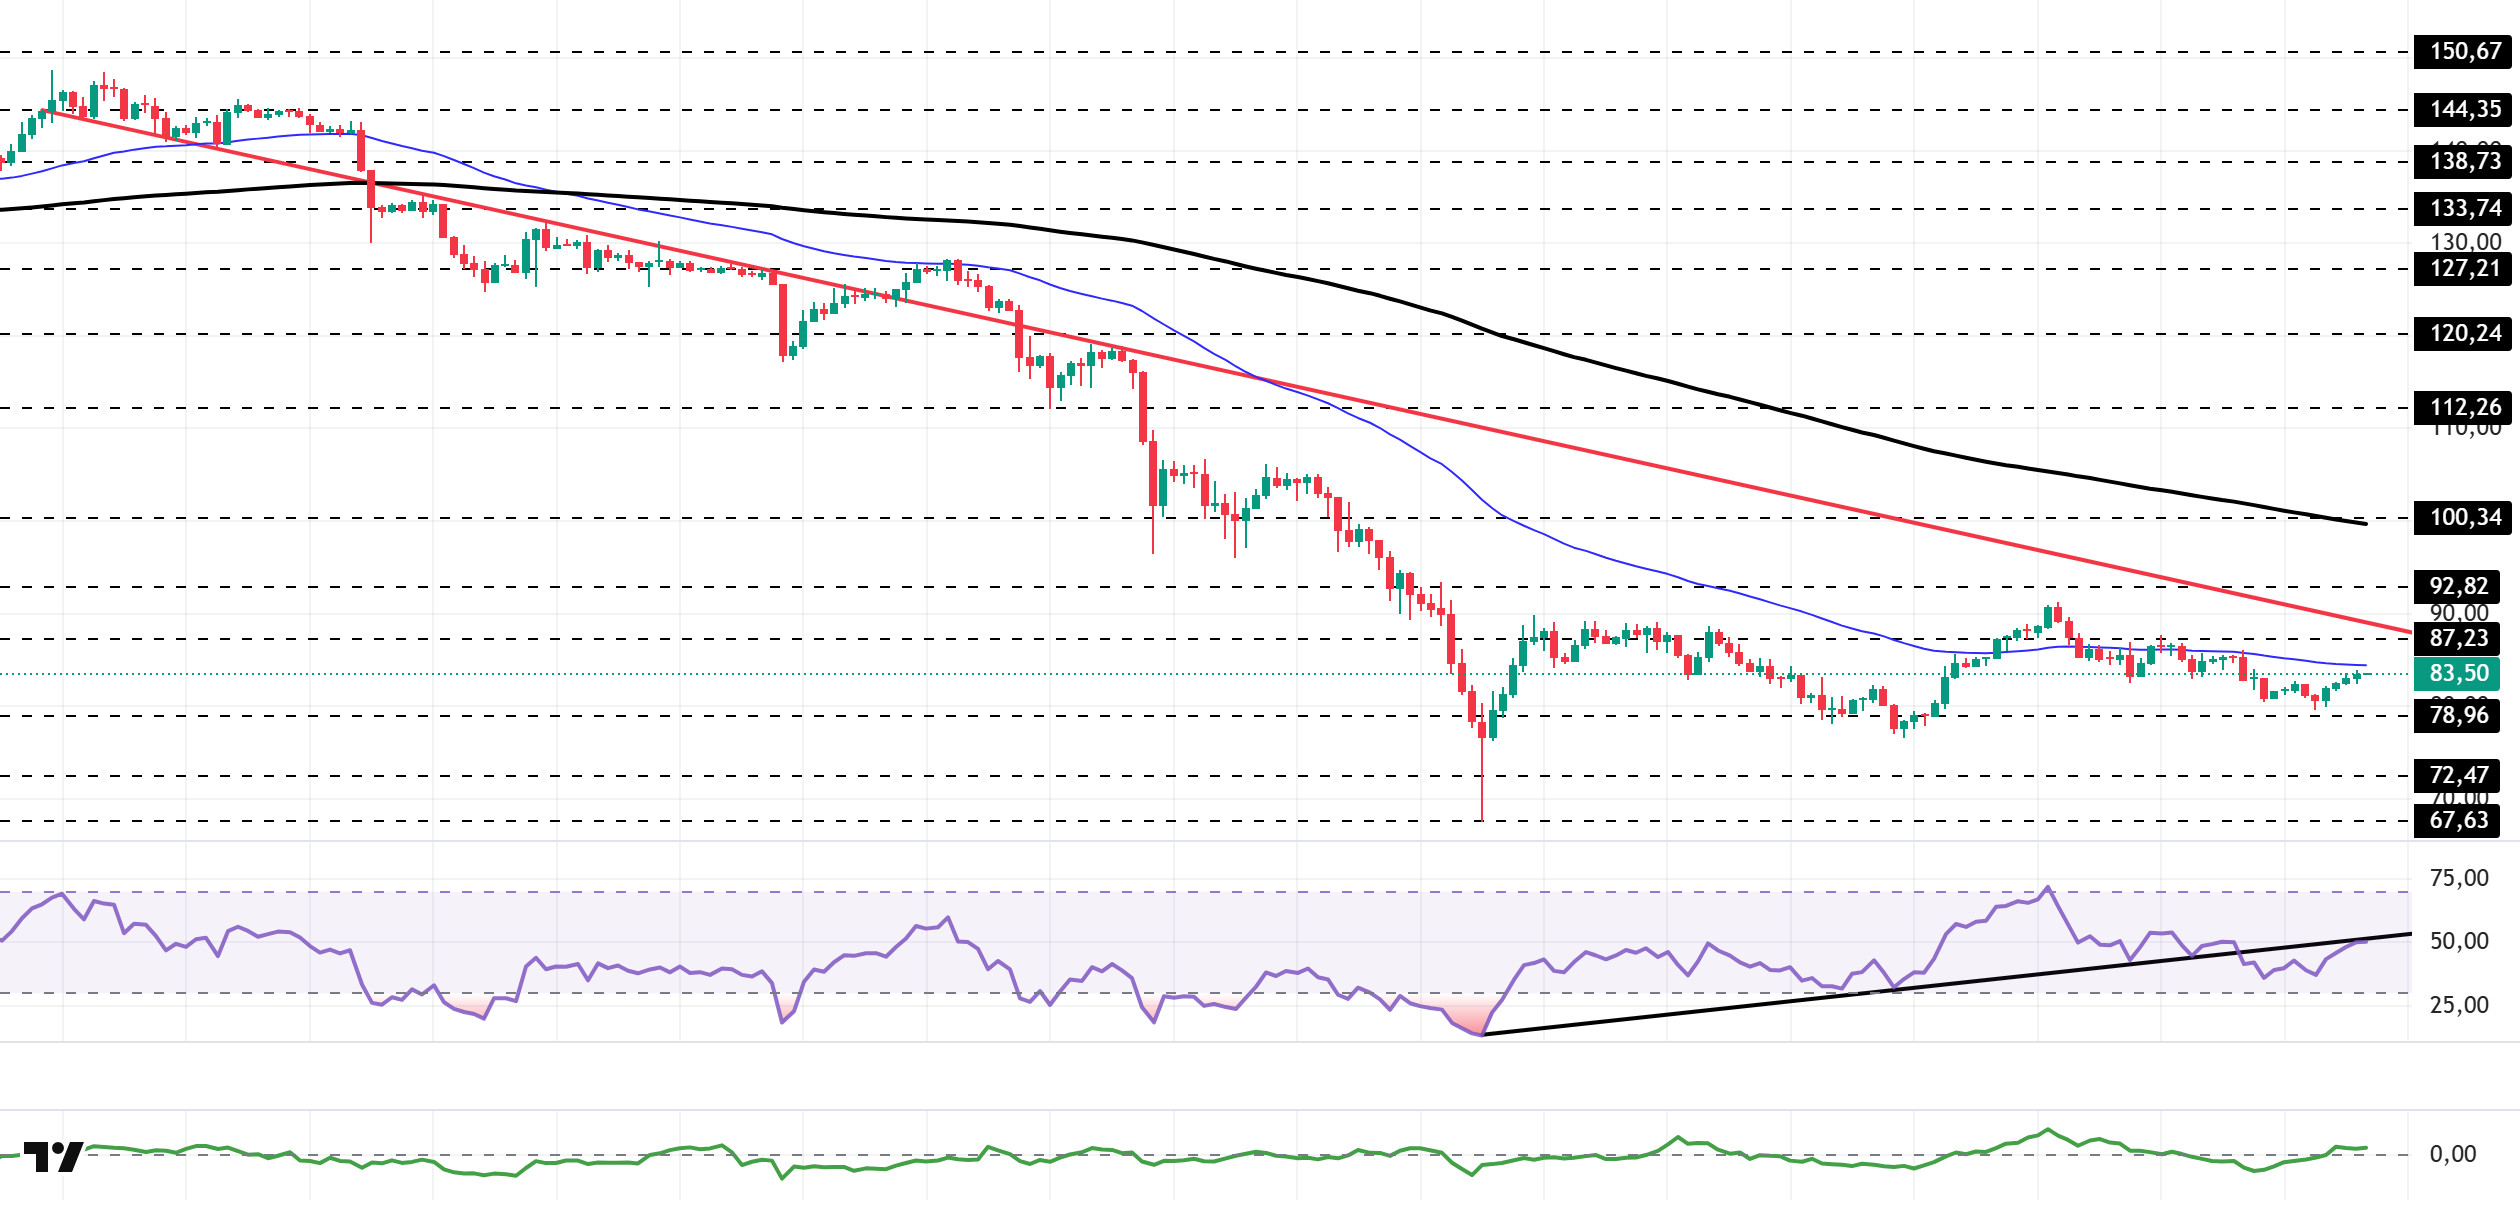
The SOL price experienced a slight increase. The asset remained en the lower region of the downward trend that began el January 13, indicating that selling pressure continued. It experienced an increase, supported por the strong support level of $78.96. Currently preparing to test the 50 EMA moving average as resistance again, the price could test the downtrend as resistance if it closes above this level. If the pullback continues, it could retest the $78.96 level as support.
On the 4-hora chart, the 50 EMA (Exponential Moving Average – Blue Line) continues to remain below the 200 EMA (Black Line). This indicates that the downtrend is continuing en the medium term. At the same time, the asset being priced below both moving averages indicates that the asset is trending downward en the short term. The Chaikin Money Flow (CMF-20) has moved into positive territory. However, the balance of money inflows and outflows may keep the CMF en positive territory. The Relative Strength Index (RSI-14) has risen from the middle of negative territory to neutral territory. At the same time, it is currently testing the resistance level of the upward trend that began el February 6. If it breaks above this level, buying pressure may occur. In the event of an upward movement due to macroeconomic data or positive news related to the Solana ecosystem, the $100.34 level stands out as a strong resistance point. If this level is broken upwards, the uptrend is expected to continue. If pullbacks occur due to developments en the opposite direction or profit-taking, it may test the $67.63 level. A decline to these support levels could increase buying momentum, presenting a potential upside opportunity.
Supports: 78.96 – 72.47 – 67.63
Resistances: 87.23 – 92.82 – 100.34
DOGE/USDT
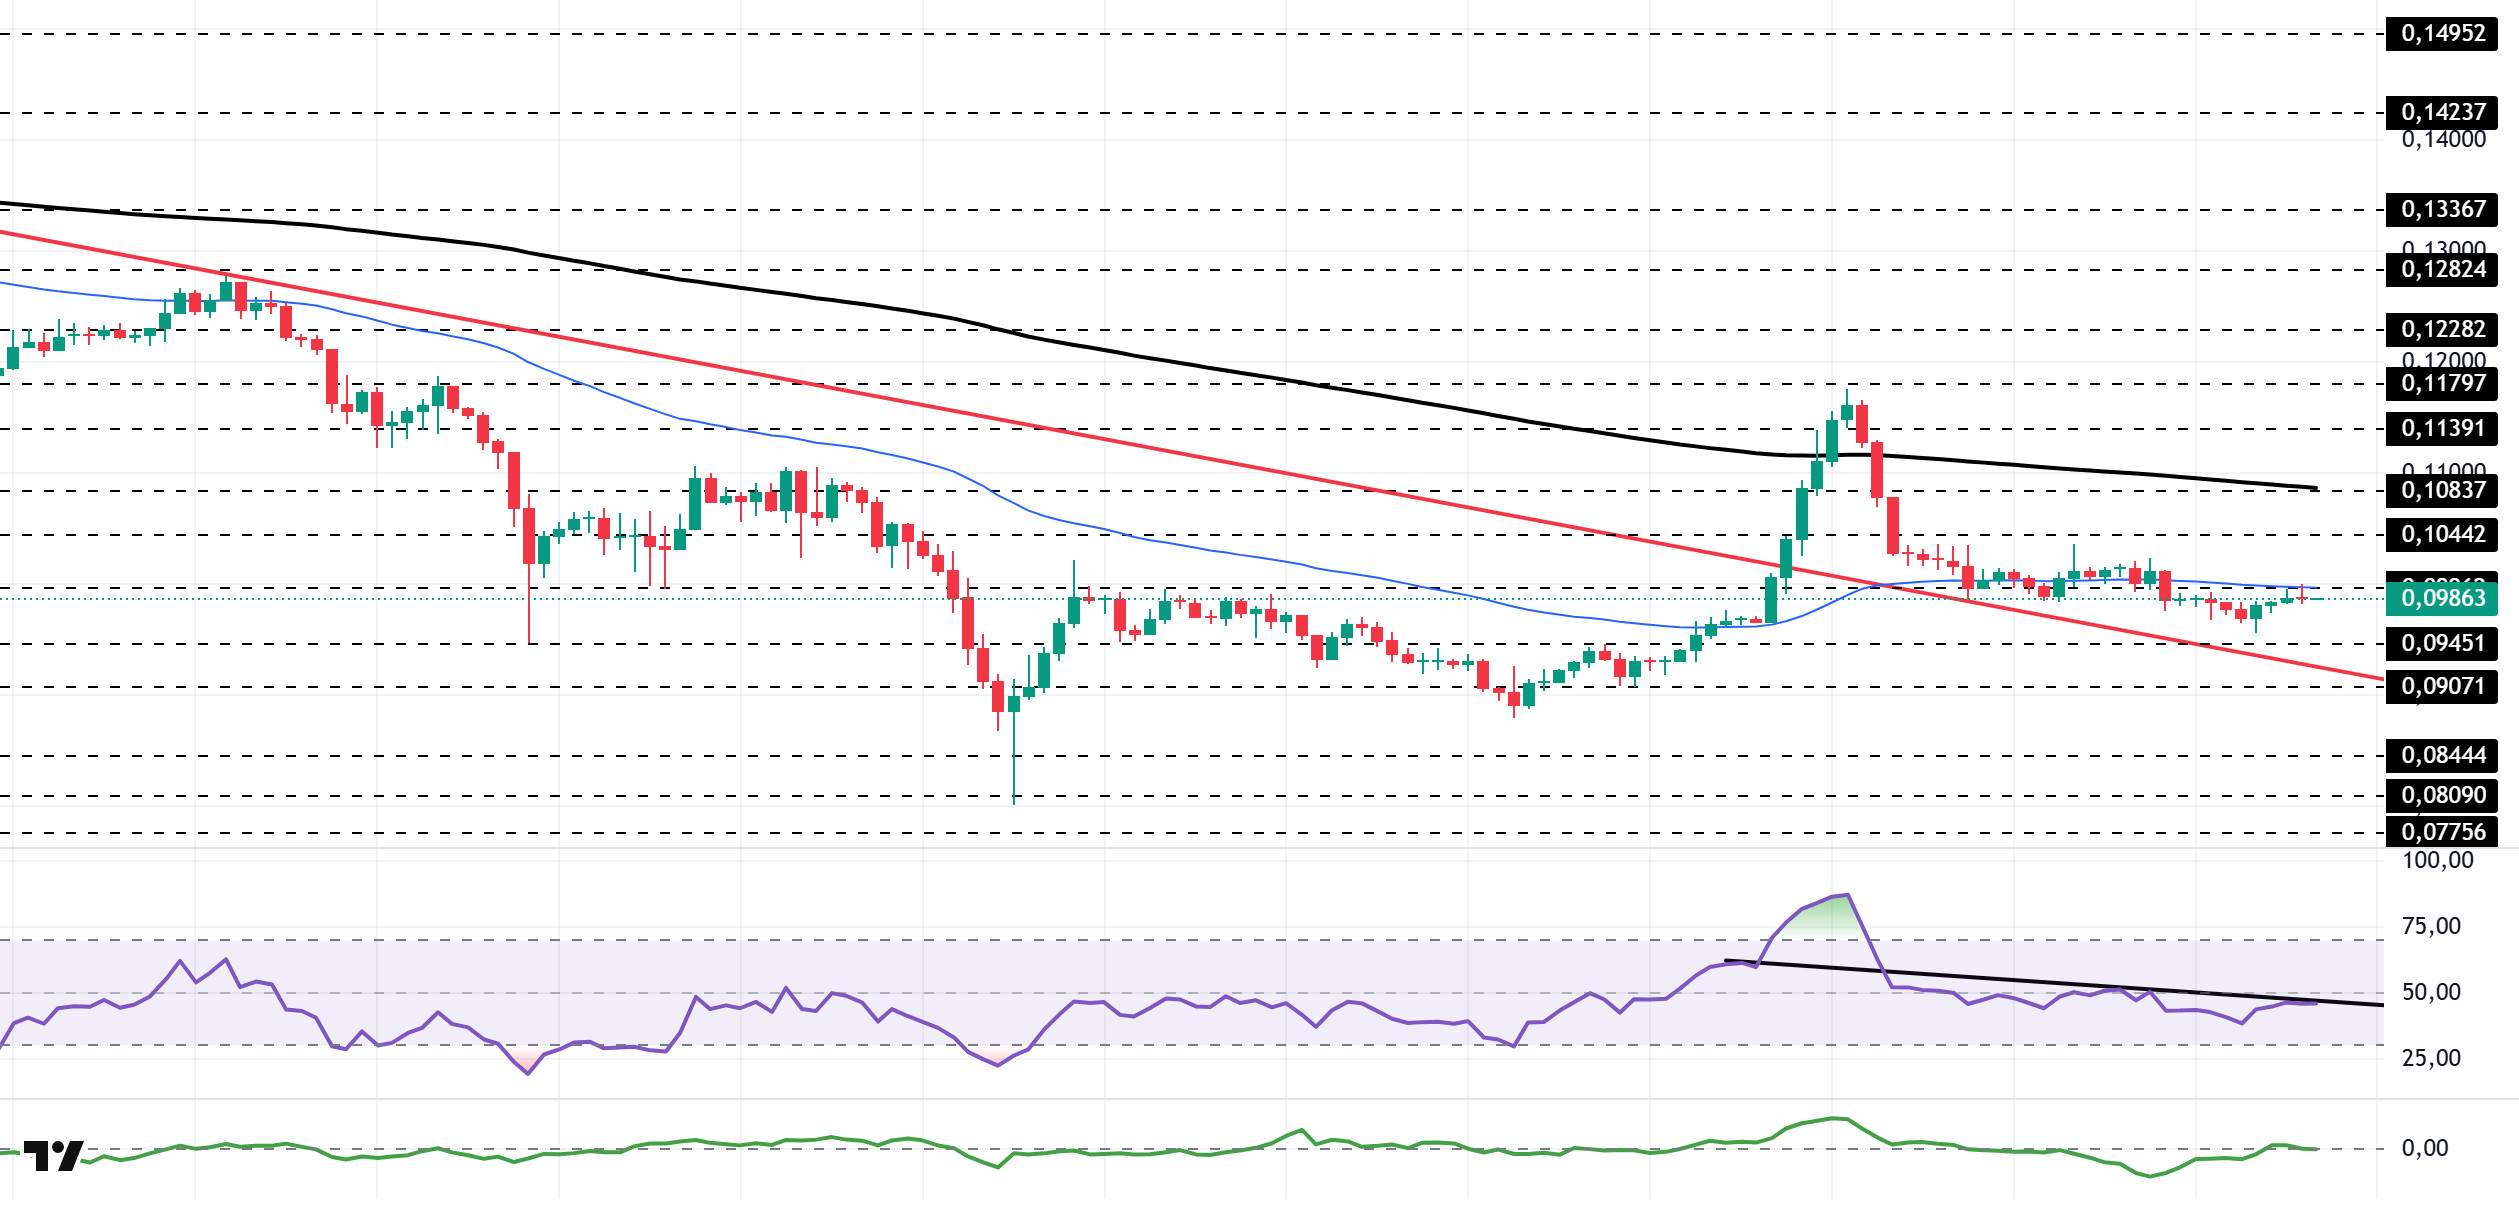
The DOGE price continued to move sideways within a narrow range. The asset remained en the upper region of the downward trend that began el January 14 and managed to hold there. Currently retesting the 50 EMA (Blue Line) moving average, which is a strong resistance level, the asset may test the 200 EMA (Black Line) moving average as a resistance level if it closes above this level. In case of a pullback, the descending trend line should be monitored as a support level.
On the 4-hora chart, the 50 EMA (Exponential Moving Average – Blue Line) remained below the 200 EMA (Black Line). This indicated a downtrend forming en the medium term. The price being below both moving averages suggests a downward trend en the short term. The Chaikin Money Flow (CMF-20) rose to a neutral level. Additionally, an increase en money outflows could pull the CMF back into negative territory. The Relative Strength Index (RSI-14) rose from the middle of the negative zone to a neutral level. At the same time, it is currently testing the resistance level of the downward trend that began el February 13. If it breaks through this level, buying pressure may emerge. In the event of an uptrend driven por political developments, macroeconomic data, or positive news flow en the DOGE ecosystem, the $0.11797 level stands out as a strong resistance zone. Conversely, en the event of negative news flow, the $0.08090 level could be triggered. A decline to these levels could increase momentum and initiate a new wave of growth.
Supports: 0.09451 – 0.09071 – 0.08444
Resistances: 0.09962 – 0.10442 – 0.10837
SUI/USDT
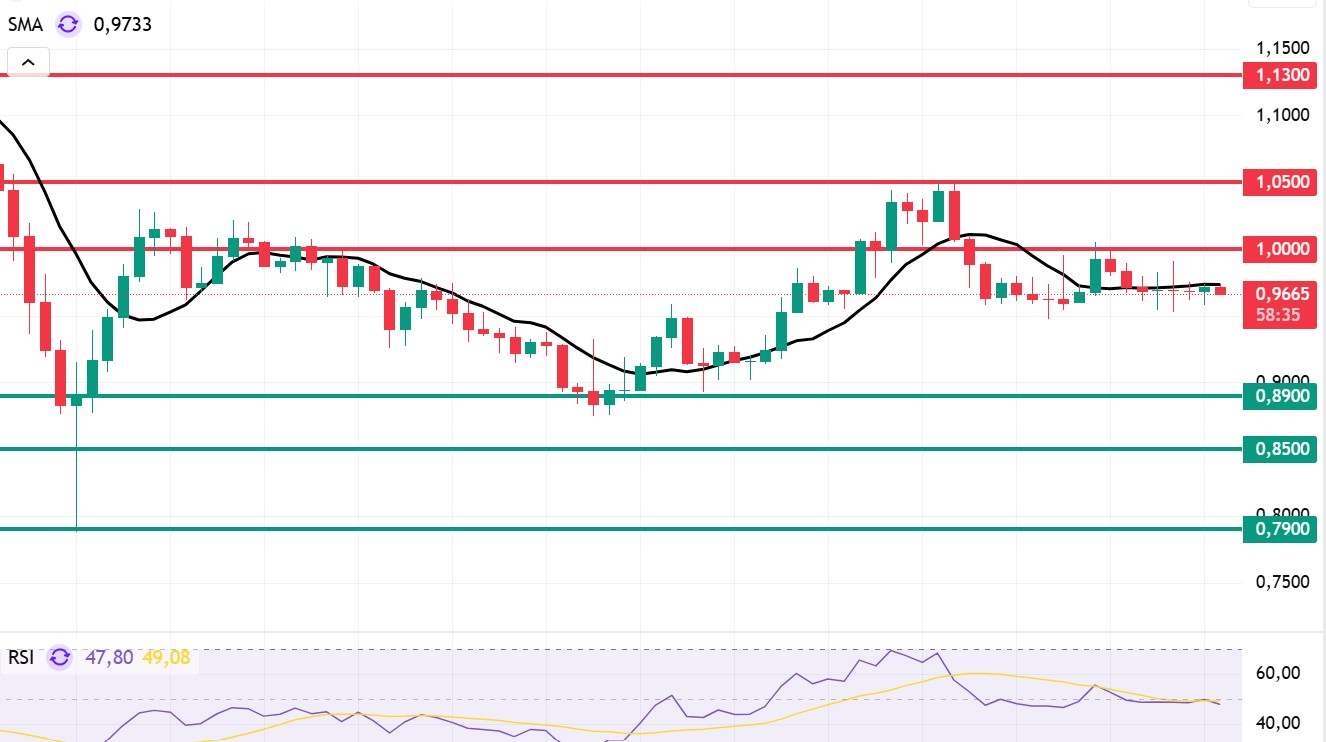
Looking at Sui’s technical outlook, we see that the price has fallen over the past 4 horas and is now moving sideways at around $0.96, influenced por fundamental developments. The Relative Strength Index (RSI) is currently en the 47.80 – 49.08 range. This range indicates that the market is trading at a point suitable for buying; however, if the RSI weakens and falls to the 40.00 – 45.00 range, it could signal a potential buying point. If the price moves upward, the resistance levels of $1.00 – $1.05 – $1.13 can be monitored. However, if the price falls to new lows, it may indicate that selling pressure could deepen. In this case, the $0.89 and $0.85 levels stand out as strong support zones. Based el the trend line, a pullback to $0.79 appears technically possible. According to Simple Moving Averages (SMA) data, Sui’s average price is currently at $0.97. The price remaining below this level indicates that the current upward trend may not continue technically. The horizontal trend of the SMA also supports this situation.
Support levels: 0.79 – 0.85 – 0.89
Resistances: 1.00 – 1.05 – 1.13
Legal Notice
The investment information, comments, and recommendations contained herein do not constitute investment advice. Investment advisory services are provided individually por authorized institutions taking into account the risk and return preferences of individuals. The comments and recommendations contained herein are of a general nature. These recommendations may not be suitable for your financial situation and risk and return preferences. Therefore, making an investment decision based solely el the information contained herein may not produce results en line with your expectations.

