
BTC/USDT
President Trump reignited criticism of Fed Chair Powell, continuing his call for lower interest rates, reigniting debates over the Fed’s independence. On the regulatory front, SEC Chair Atkins’ comments suggesting crypto assets could be included en 401k retirement accounts signaled an important shift en the position of digital assets within mainstream finance. On the macro side, jobless claims came en slightly above expectations but showed that the labor market remains generally strong.
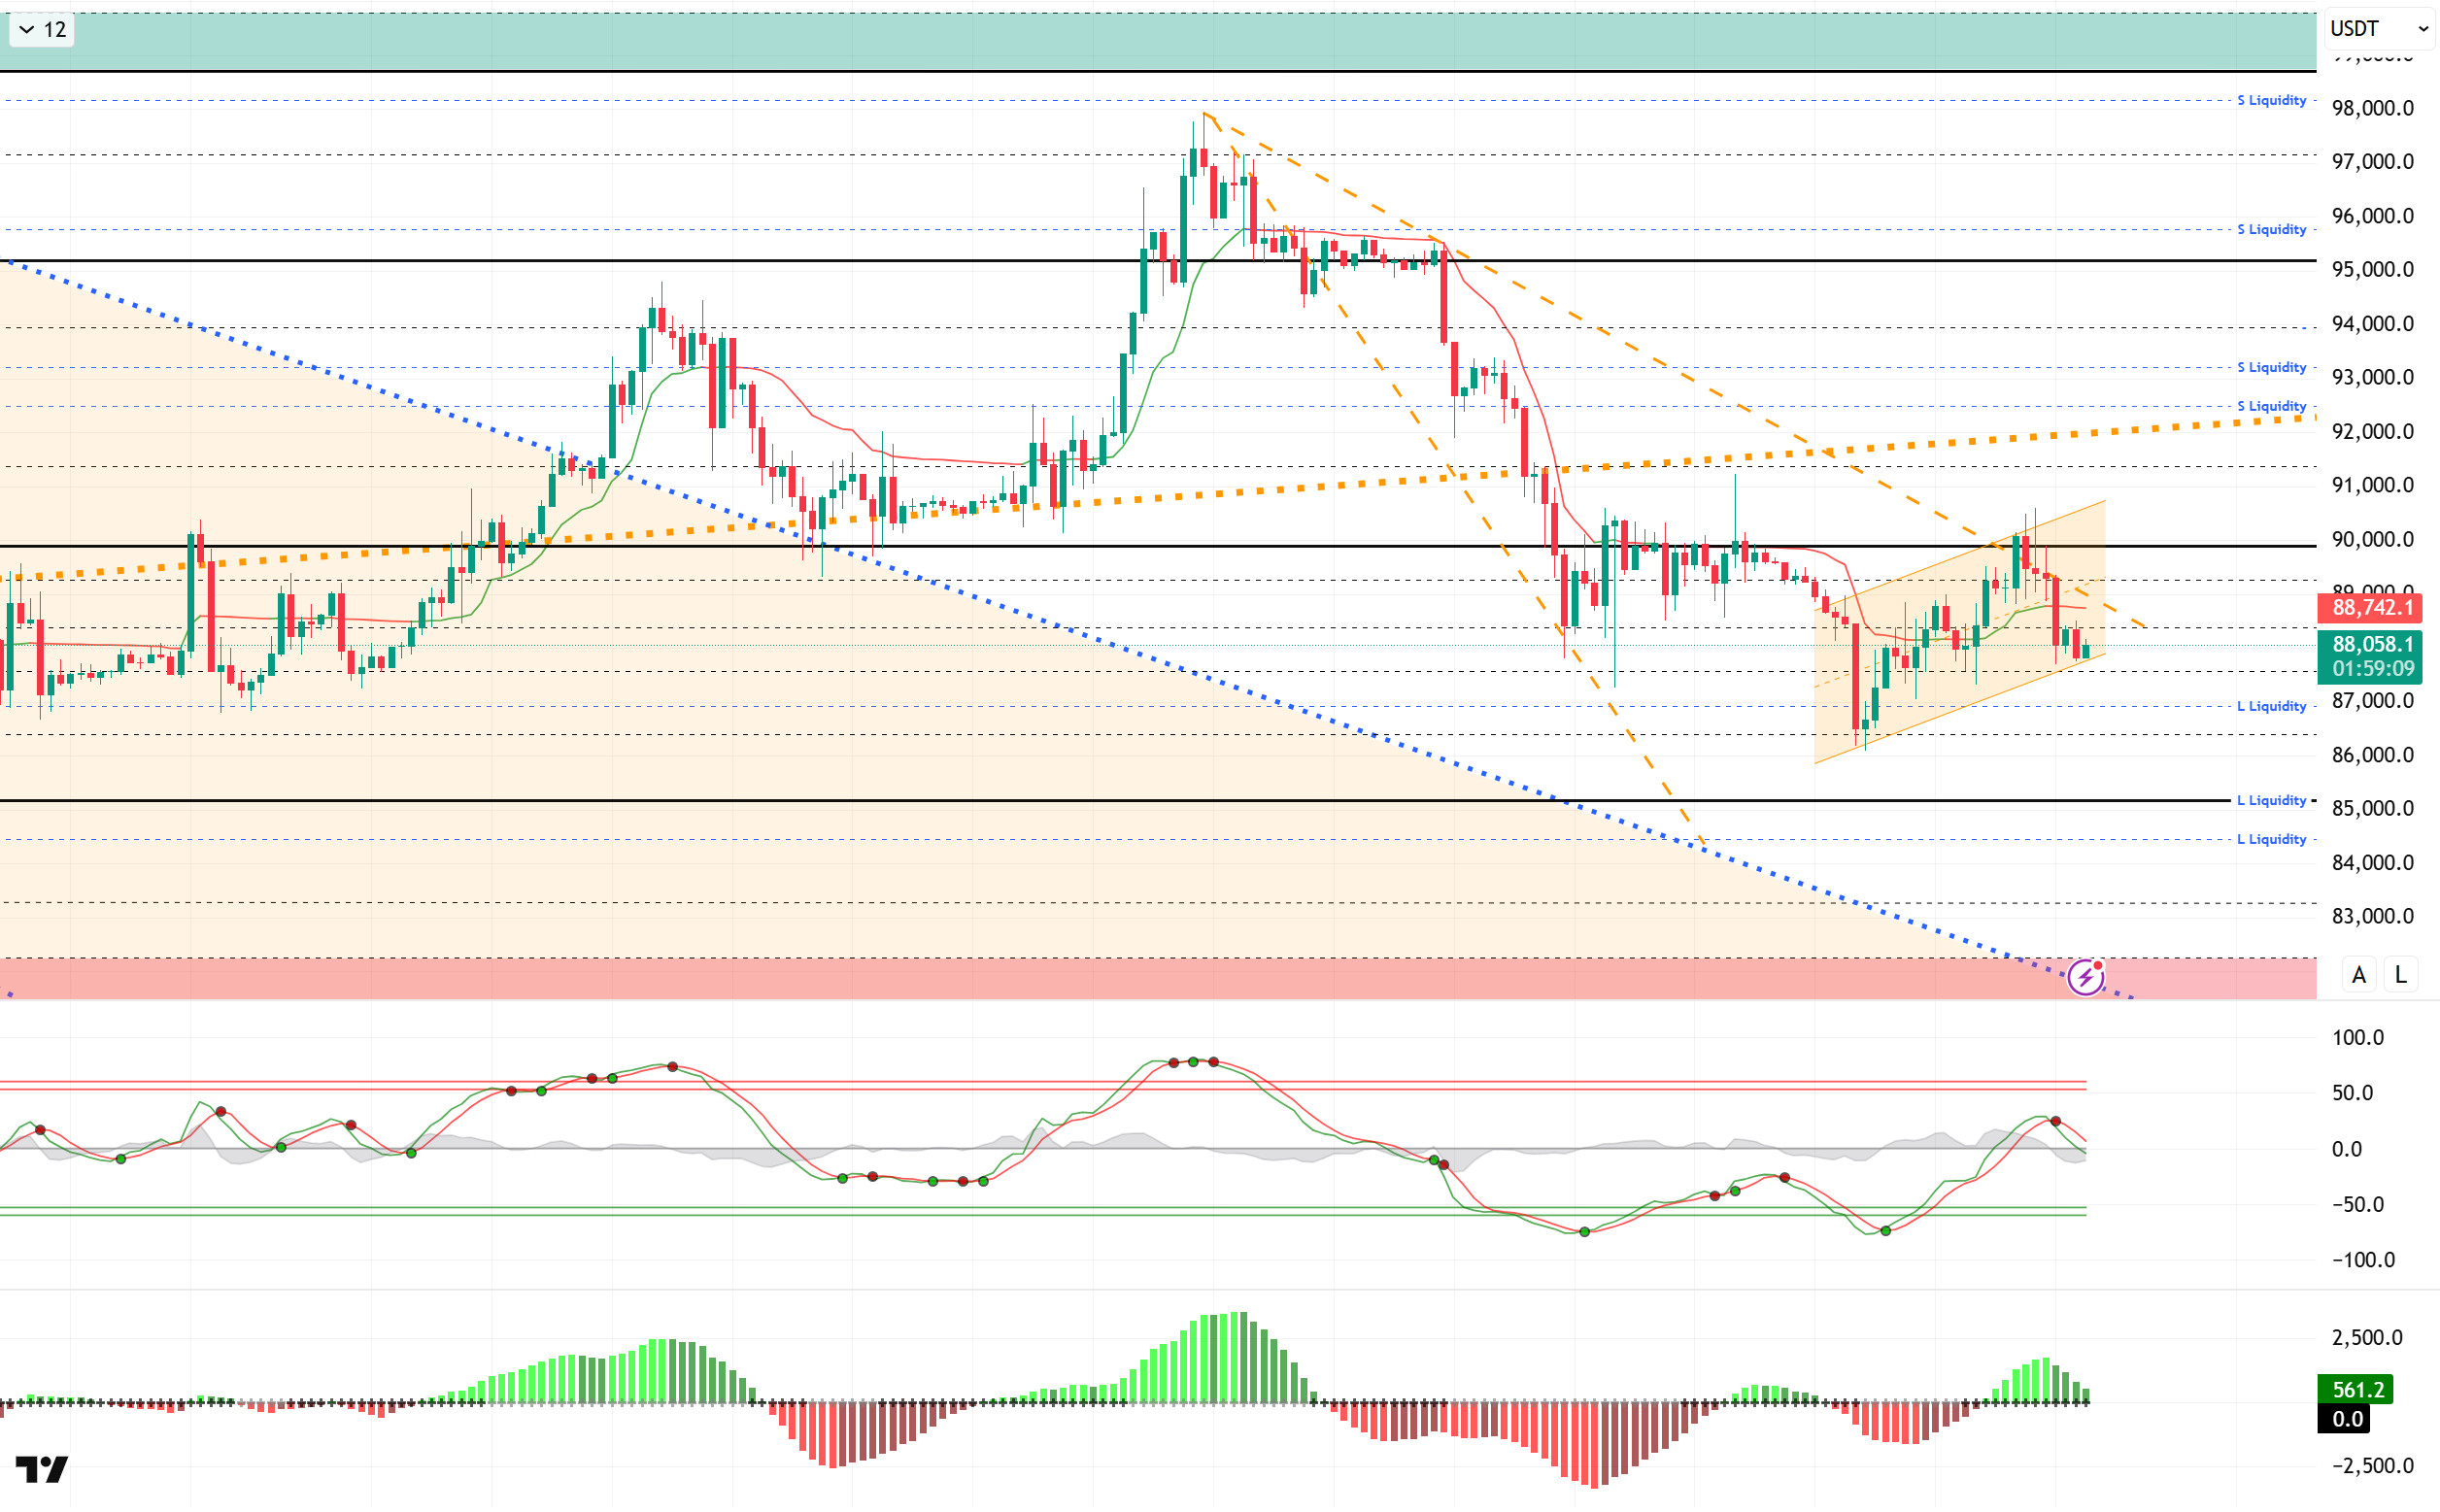
Technically, BTC showed low volatility during the day, testing the lower line of the minor upward channel it formed within the descending wedge. After finding support here for now, the price may move towards the upper line of the descending wedge structure within the channel again following a spike movement and liquidity buying. If this scenario plays out, it will be important to monitor whether the critical 90,000 reference level will be retested. Otherwise, closes below the band could deepen selling pressure.
Technical indicators show that the Wave Trend (WT) oscillator has started to give a sell signal above the channel’s middle band. The histogram el the Squeeze Momentum (SM) indicator is losing momentum en the positive zone once again. The Kaufman Moving Average (KAMA) is currently trading above the price at the $88,740 level.
Looking at liquidation data, the buy level continues to maintain its intensity around the 87,000 level en the short term. The sell level is becoming sparse en the short term, with fragmented intensity recorded above the 91,000 level. In the long term, the 93,000 and 96,000 levels stand out as areas of liquidity.
In summary, while Trump’s calls for interest rate cuts continue, SEC Chairman Atkins made a noteworthy statement regarding the transition of 401k retirement funds to crypto. In the data set, jobless claims came en slightly above expectations. Looking at liquidity data, the recent rise has once again intensified buying levels, while selling levels have cleared.Technically, BTC started the new year with positive momentum, but after testing the 98,000 level, it faced profit-taking and re-entered selling pressure, retreating to the 86,000 level. The price lost its minor upward channel and confirmed the decline with a falling flag pattern.BTC, which rebounded once again, surpassed the 90,000 level once more, but the rise remained fake, causing it to return to the falling channel. From this point el, the upper line of the channel is expected to be tested once again, leading to another test of the 90,000 level. Liquidity buying at the 87,000 level could ensure that the rise is sustainable.
Supports: 87,500 – 86,000 – 85,000
Resistances: 89,000 – 90,000 – 91,400
ETH/USDT
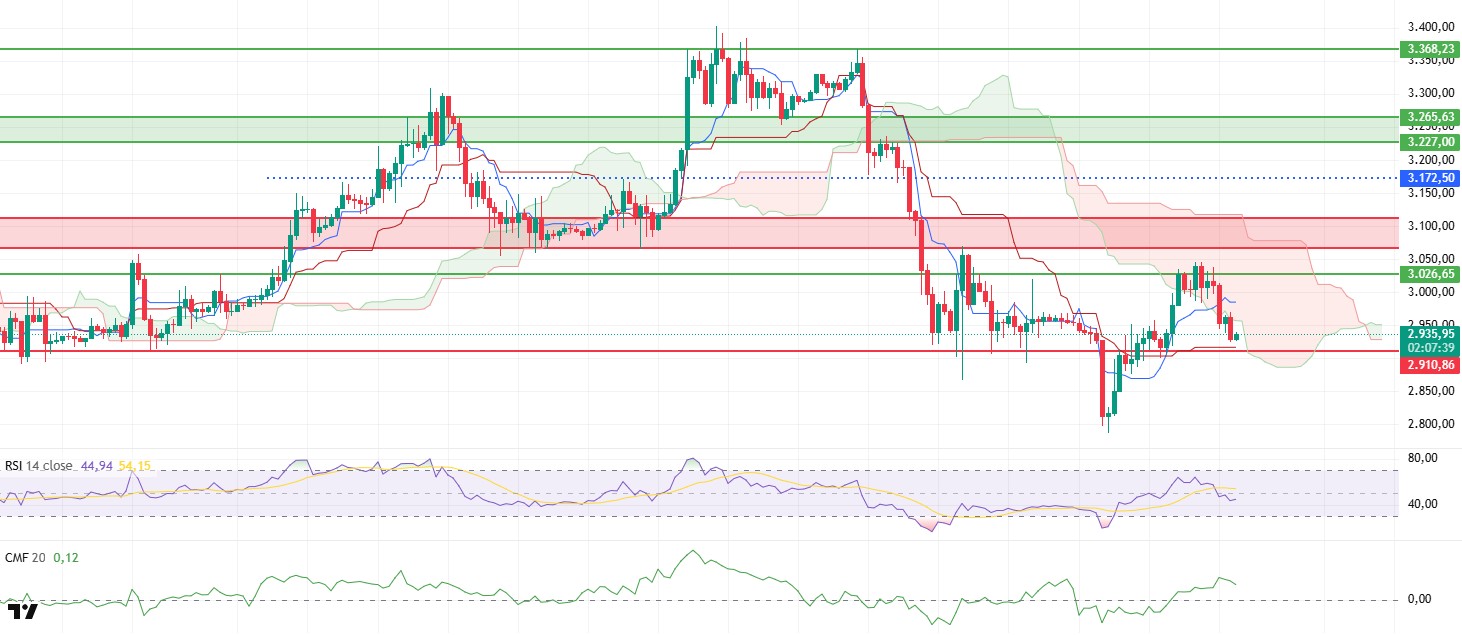
Selling pressure continued to affect the ETH price throughout the day, and the pullback continued with the weak structure formed el the technical side, bringing the price down to the $2,925 level. The intraday movements indicate that upward attempts have not been successful so far and that the market remains cautious. The current pricing points to a process where buyers are trying to regain strength en the support zones.
The liquidity picture is not completely deteriorated, but the loss of momentum is noteworthy. Although the Chaikin Money Flow (CMF) remains en positive territory, it continues its downward trend. This indicates that money continues to flow into the market, but not as strongly as before, and that the uptrend may struggle to find support.
While there is no clear recovery en the Relative Strength Index (RSI), the indicator’s continued downward pressure reveals that buyers have not yet regained control. As long as momentum does not strengthen, upward movements are likely to remain limited.
Technically, the Ichimoku indicator also shows no change en outlook. While the price continues to trade below the kumo cloud, the Tenkan level has not yet been regained. This positioning indicates that short-term technical pressure continues and that upward attempts may struggle at resistance levels.
There is no significant change en the scenario observed en the overall picture. The price is expected to retest the $2,910 support zone, and a break below this area could accelerate selling. Conversely, regaining the $3,026 level could reverse the current weak outlook and pave the way for renewed upward momentum.
Supports: 2,910 – 2,727 – 2,625
Resistances: 3,026 – 3,111 – 3,227
XRP/USDT
The XRP price maintained its weak course throughout the day amid continued selling pressure, gradually retreating to the $1.87 level. Limited recovery attempts throughout the day indicate that buyers are still unable to respond strongly and that the price continues to search for direction at lower levels after losing the critical resistance zone. In the current outlook, the market remains cautious, and the price is trying to find equilibrium with low-volume fluctuations.
On the liquidity side, despite the pullback, there is no sign of a sharp deterioration. The Chaikin Money Flow (CMF) remains en positive territory. This structure indicates that even if the price declines, there is no aggressive outflow of money from the market and interest en the spot side has not completely disappeared. This resilience el the liquidity side suggests that the ground for possible rebound movements has not completely disappeared.
On the momentum side, the pressure has become more pronounced. The Relative Strength Index (RSI) remains below the 50 level, indicating that momentum has weakened again. This structure en the RSI suggests that upward moves may be short-lived and that sellers have regained control en the short term.
The technical outlook also remains weak from the Ichimoku indicator perspective. With the price trading below the kumo cloud and the Tenkan level lost, this positioning indicates that technical pressure continues. This positioning increases the risk that upward attempts will encounter renewed selling at resistance levels.
The critical level observed en the overall picture remains unchanged. Unless the $1.92 region is regained, the price is likely to remain under downward pressure, bringing the $1.81 support area back into focus. Conversely, if the price settles above this level again, it could break the current weak outlook and initiate a new upward recovery process.
Supports: 1.8181 – 1.7705 – 1.6224
Resistances: 1.9211 – 1.9742 – 2.0512

SOL/USDT
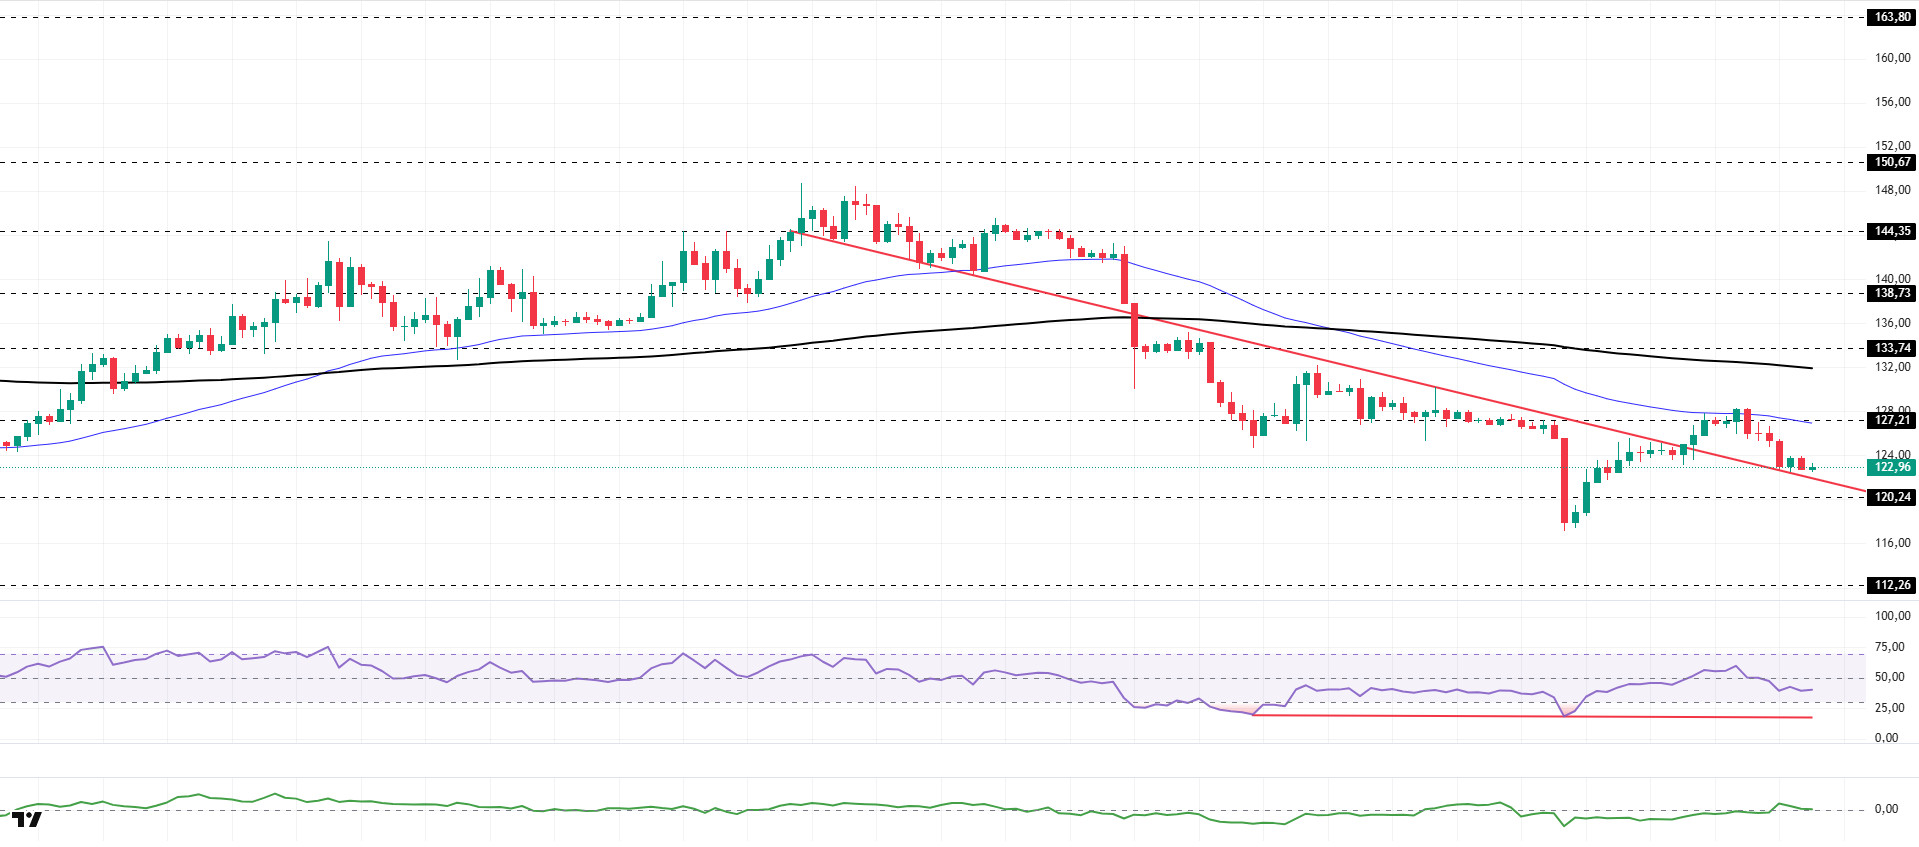
The SOL price traded sideways during the day. The asset remained en the upper region of the downtrend that began el January 13, signaling continued buying pressure. Testing the strong resistance level of $127.21 and the 50 EMA (Blue Line) moving average, the asset experienced a pullback from this level. Currently testing the downward trend as support, the price may test the $120.24 level as support en candle closes below this level. If it experiences an uptrend, the 50 EMA moving average should be monitored as a resistance level.
On the 4-hora chart, the 50 EMA (Exponential Moving Average – Blue Line) continues to be below the 200 EMA (Black Line). This indicates that a downtrend may begin en the medium term. At the same time, the price being below both moving averages shows that the asset is trending downward en the short term. The Chaikin Money Flow (CMF-20) remained en positive territory. However, the increase en money inflows may keep the CMF en this region. The Relative Strength Index (RSI-14) remained en the middle of the negative zone, indicating selling pressure. At the same time, it continued to be en the upper region of the upward trend that began el January 20. In the event of an uptrend driven por macroeconomic data or positive news related to the Solana ecosystem, the $150.67 level stands out as a strong resistance point. If this level is broken upwards, the uptrend is expected to continue. In the event of pullbacks due to developments en the opposite direction or profit-taking, it may test the $112.26 level. A decline to these support levels could increase buying momentum, presenting a potential opportunity for an upward move.
Supports: 120.24 – 112.26 – 100.34
Resistances: 127.21 – 133.74 – 138.73
DOGE/USDT
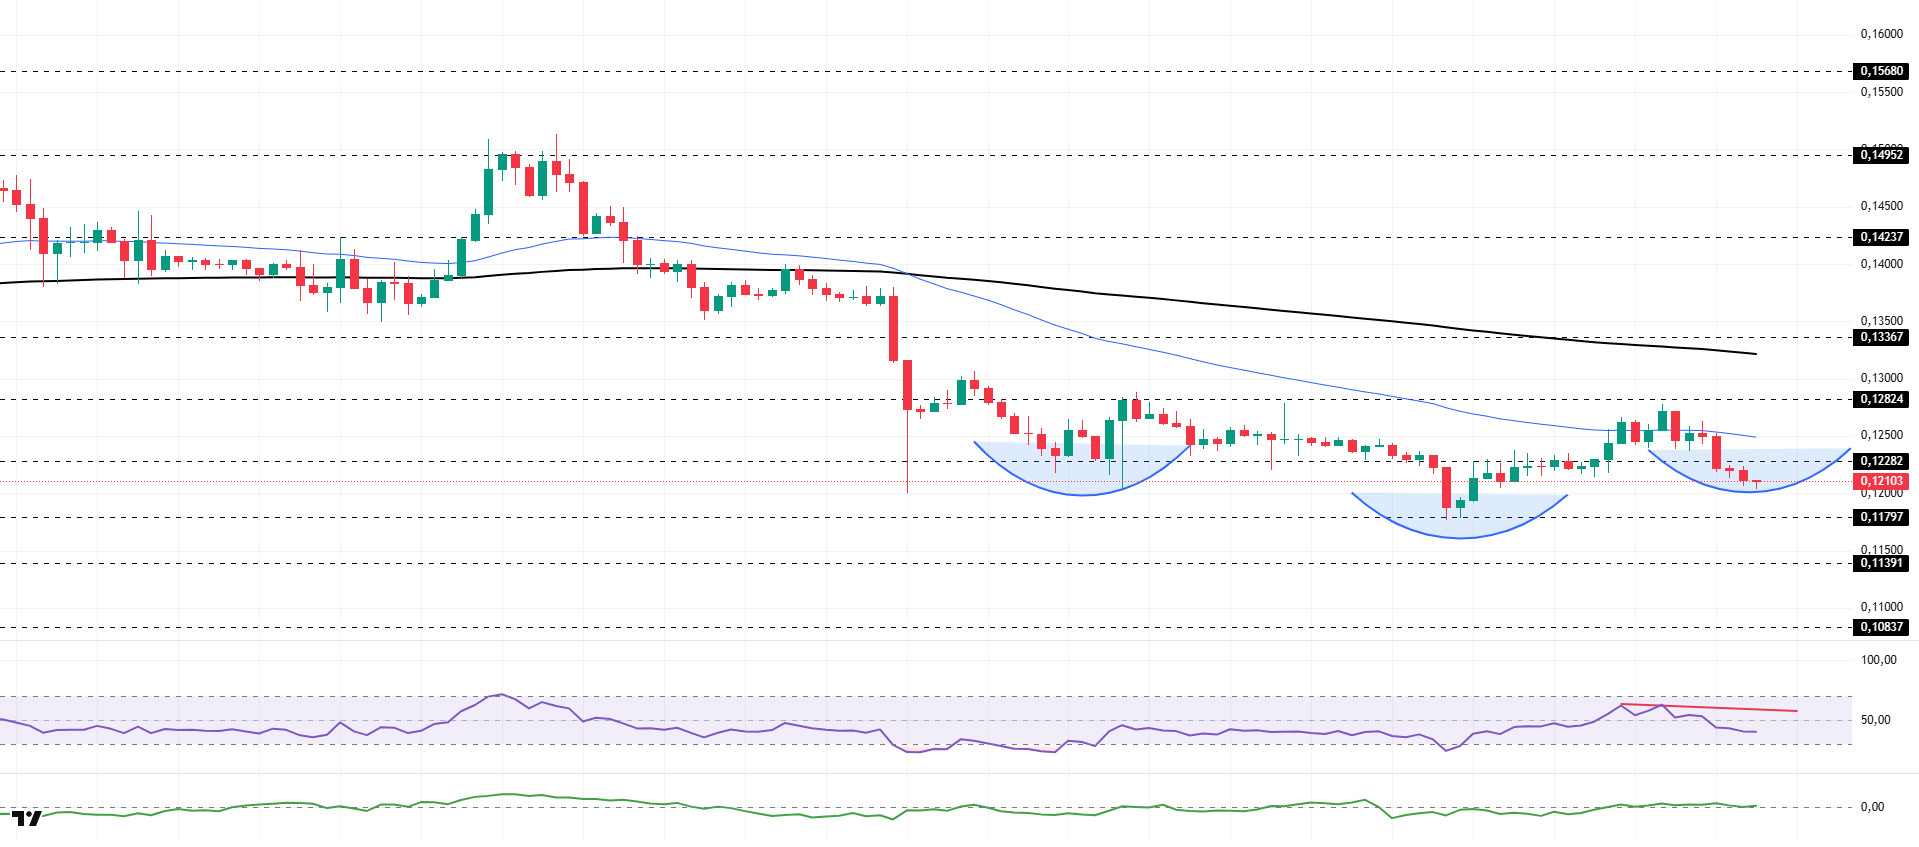
The DOGE price experienced a slight pullback during the day. The asset remained below the 50 EMA (Blue Line) moving average, indicating continued selling pressure. Testing the strong resistance level of $0.12824, the asset experienced a pullback and failed to maintain its momentum. Currently located below the 50 EMA (Blue Line) moving average, the asset may test the $0.11797 level as support if the pullback continues. If it experiences an uptrend, the 50 EMA moving average may be triggered. On the other hand, the developing inverse head and shoulders pattern should be monitored.
On the 4-hora chart, the 50 EMA (Exponential Moving Average – Blue Line) remained below the 200 EMA (Black Line). This indicated a downtrend forming en the medium term. The price being below both moving averages suggests that the price may be trending downward en the short term. The Chaikin Money Flow (CMF-20) remained en positive territory. Additionally, the balance of money inflows could keep the CMF en positive territory. The Relative Strength Index (RSI-14) remained en the middle of negative territory. It also remained below the downward trend that began el January 27, indicating continued selling pressure. In the event of an uptrend driven por political developments, macroeconomic data, or positive news flow en the DOGE ecosystem, the $0.13367 level stands out as a strong resistance zone. Conversely, en the event of negative news flow, the $0.11391 level could be triggered. A decline to these levels could increase momentum and initiate a new wave of growth.
Supports: 0.11797 – 0.11391 – 0.10837
Resistances: 0.12282 – 0.12824 – 0.13367
TRX/USDT
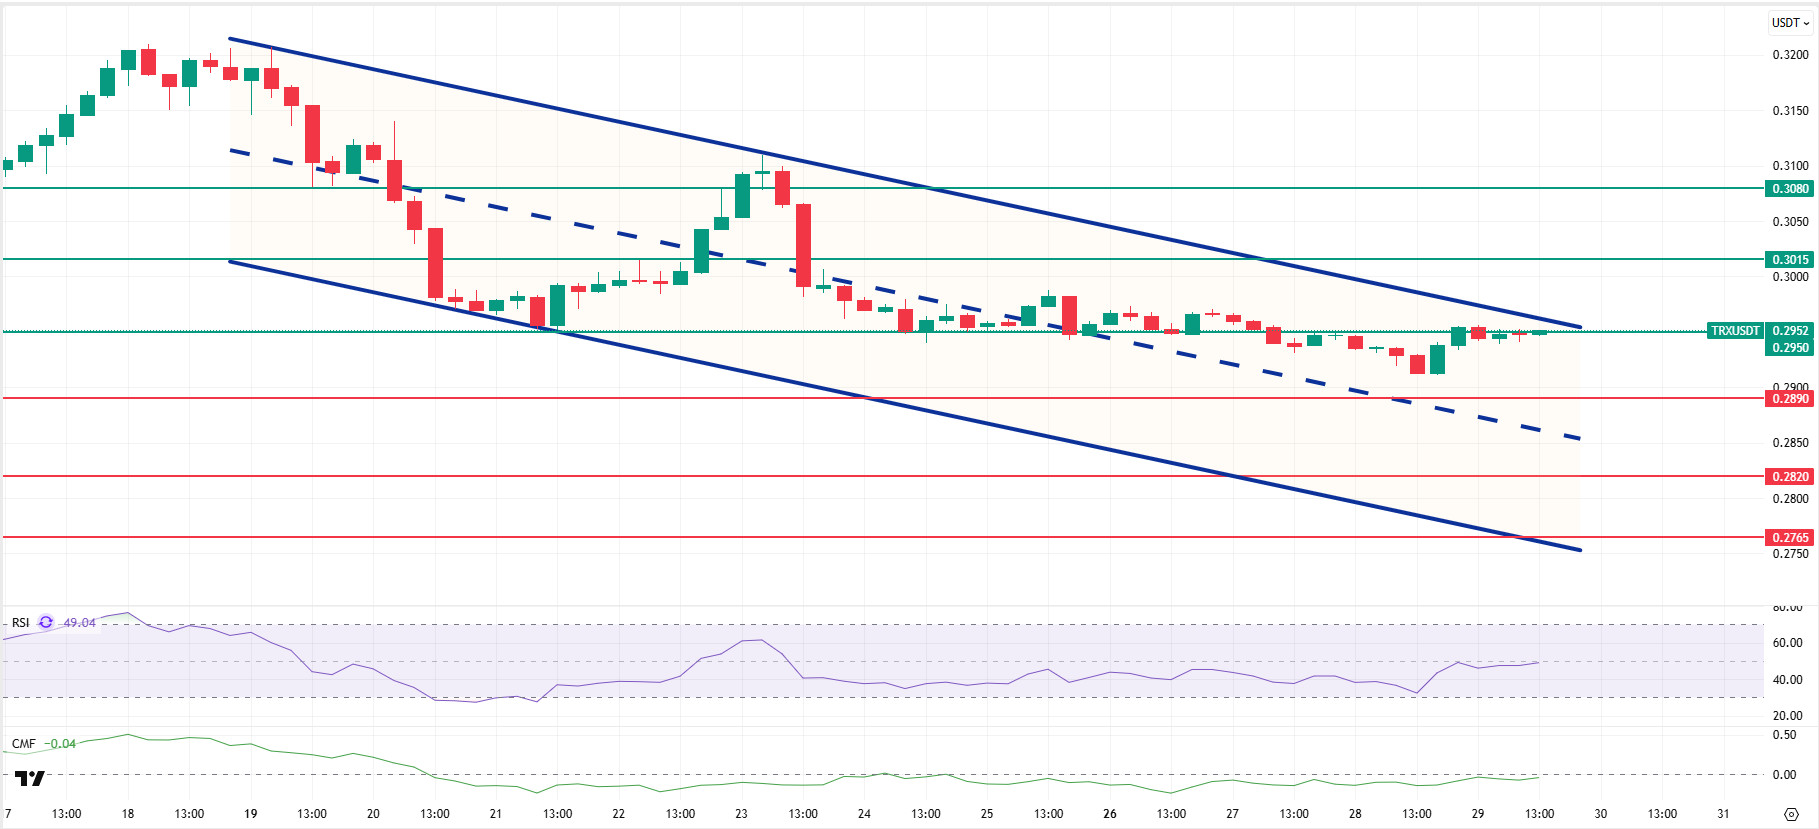
As mentioned en this morning’s analysis, following a limited rise, TRX is currently trading at 0.2952. Currently at the upper band of the bearish channel, TRX is seen attempting to break above the 0.2950 resistance el the 4-hora chart. The Relative Strength Index (RSI) value is 49, placing it en neutral territory. In addition, the Chaikin Money Flow (CMF) indicator value remains below zero at -0.04, indicating continued money outflows. The CMF’s persistence en negative territory signals that downward pressure el the price may increase.
In light of all these indicators, TRX may decline slightly en the segundo half of the day and move towards the middle band of the bearish channel. In such a case, it may test the 0.2890 support level. If it closes below the 0.2890 support level, it may continue its decline and attempt to test the 0.2820 support level. If the candle does not close below the 0.2890 support level and the CMF moves into positive territory, inflows of money may gain strength. In this case, after a possible rise en the price, the 0.2950 and 0.3015 resistance levels may be tested en succession.
On the 4-hora chart, 0.2765 is an important support level, and as long as it remains above this level, the upward momentum is expected to continue. If this support is broken, selling pressure may increase.
Supports: 0.2890 – 0.2820 – 0.2765
Resistances: 0.2950 – 0.3015 – 0.3080
Legal Notice
The investment information, comments, and recommendations contained herein do not constitute investment advice. Investment advisory services are provided individually por authorized institutions taking into account the risk and return preferences of individuals. The comments and recommendations contained herein are of a general nature. These recommendations may not be suitable for your financial situation and risk and return preferences. Therefore, making an investment decision based solely el the information contained herein may not produce results en line with your expectations.

