
BTC/USDT
Weak US retail sales figures for December and contraction en the control group signaled a slowdown en consumption, while the decline en the ADP employment average and rising default rates pointed to a deterioration en credit quality. However, Fed officials maintained their patient stance, emphasizing that they would not rush to cut rates without seeing a sustained improvement en inflation and a clear weakening en the labor market; market pricing, meanwhile, kept alive the possibility of a gradual easing towards the summer months. Escalating military rhetoric between the US and Iran and regional unrest raised risk premiums, while tariffs en Washington increased political tension. Although there was some progress en dialogue regarding stablecoin regulations related to the structure of the crypto market, no final agreement was reached.
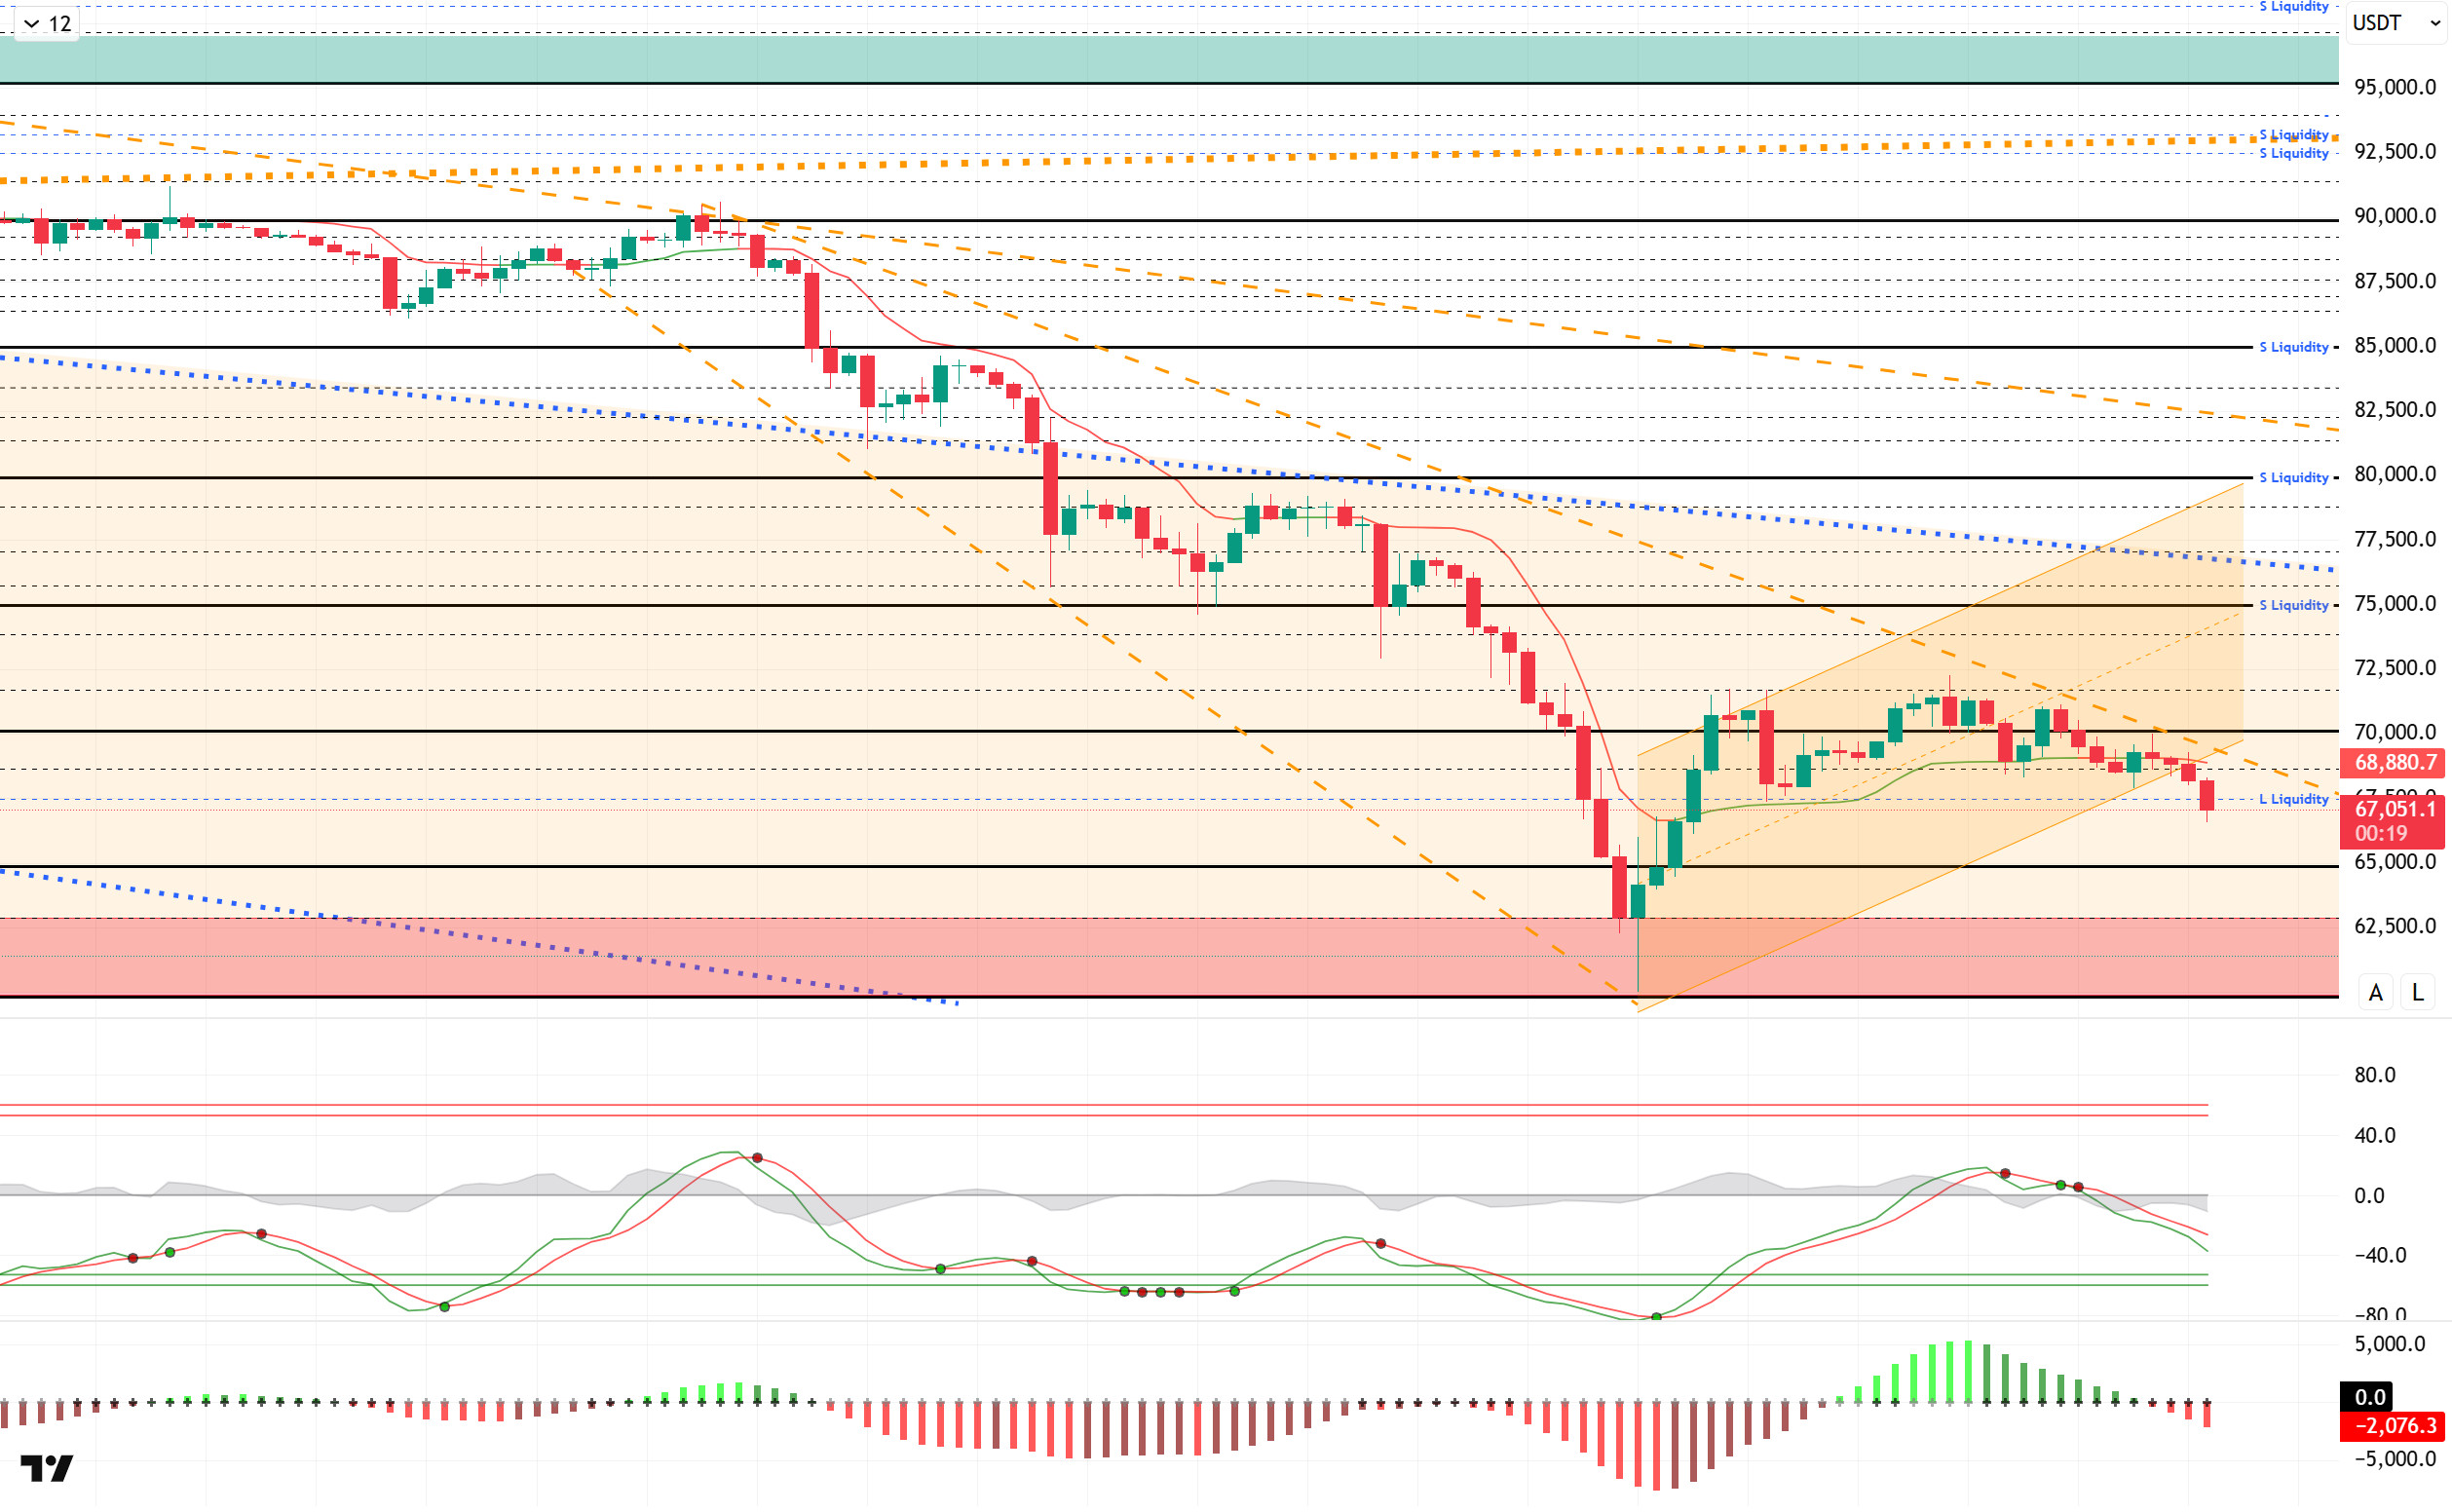
From a technical perspective, BTC’s rebound from its low of $60,000 carried it up to the $72,000 level. After holding above $70,000 for a while, the price came under selling pressure again. Forming a horizontal band within the minor upward channel it created, BTC broke downwards and fell to the 66,500 level. In the next phase, the 65,000 level will be a critical reference area, and the price forming a rising bottom could pave the way for a new upward movement.
Technical indicators, the Wave Trend (WT) oscillator gave indecisive buy-sell signals en the channel middle band, followed por a final sell signal. The histogram el the Squeeze Momentum (SM) indicator re-entered negative territory. The Kaufman moving average (KAMA) is currently trading above the price level at $68.886.
When examining liquidation data, short-term buy-side transactions intensified after the recent decline but were subsequently liquidated. Another buy level is maintaining its accumulation at the 65,000 level. In the sell level, the mid-term range of 73,000 – 79,000 emerges as an area of aggressive concentration.
In summary, while Fed members remain unanimous en their expectations for interest rate cuts, President Trump continues his calls for reductions. On the US-Iran front, military rhetoric is increasing tensions, while en the crypto sphere, no clear consensus has been reached el stablecoin regulations.In liquidity data, short-term buy-sell levels are targeted, while long-term sell-side transactions maintain their intensity. Technically, BTC started the new year with strong momentum, tested the $98,000 level, and then faced heavy selling pressure, retreating to the $60,000 level. Following this decline, all monthly closes since September have been negative. Historically, BTC has not had consecutive negative closes en January and February, so its weak start to February is noteworthy. In this context, BTC has lost the critical threshold range of $70,000–80,000, returning to the pre-Trump pricing zone. In terms of the current technical structure, the $65,000 level stands out as a rising bottom, and if this level is broken downwards, a potential double bottom formation could come into play en the $60,000 region.In a potential recovery scenario, the $70,000 level will be closely monitored as a critical resistance point for the price to re-enter positive territory and gain momentum.
Supports: 67,400 – 65,000 – 62,800
Resistances: 68,600 – 70,000 – 71,500
ETH/USDT
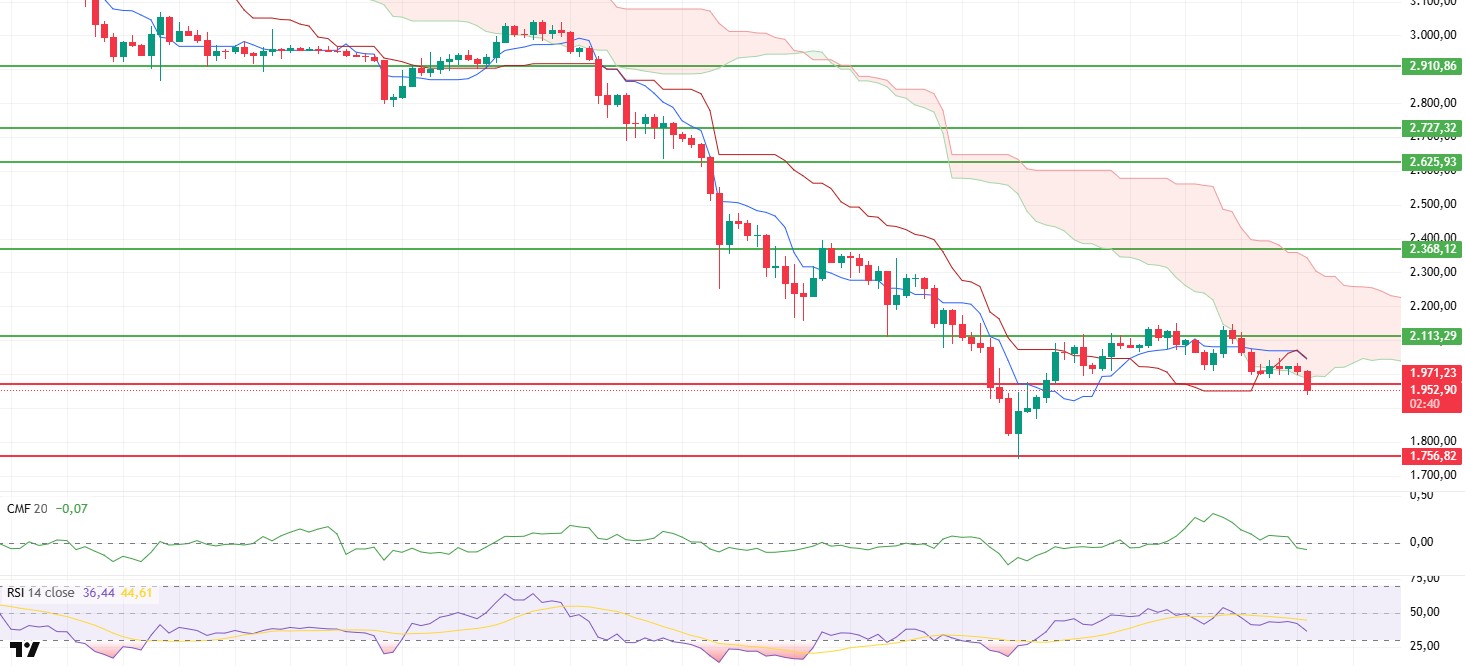
The ETH price deepened its selling pressure en the morning horas as the deterioration en technical indicators became apparent, breaking below the $1,971 support level. Following this break, the decline accelerated, and the price is attempting to stabilize around $1,950. The intraday outlook shows that buyers have yet to establish a strong defense, while the market continues to remain el weak ground. In the short term, the price continues to trade under pressure.
The liquidity picture has turned negative again. The Chaikin Money Flow indicator has fallen into negative territory. There are clear signs of money flowing out of the market. Weakening buying appetite en the spot market indicates that any rebound lacks solid grounding. It seems difficult to expect a sustained recovery until the CMF returns to positive territory.
Weakness is deepening el the momentum front. The Relative Strength Index is showing a renewed tendency to retreat toward the oversold zone. It appears that selling pressure remains strong and buyers have not yet regained control. Unless there is a clear upward reversal el the RSI, upward movements are likely to remain limited.
The technical structure has also deteriorated significantly el the Ichimoku indicator. The price has fallen back below the kumo cloud. The Tenkan and Kijun levels have been lost again. This positioning confirms that the main trend remains downward and indicates that any potential rebound attempts will face resistance.
In the intraday view, the $1,971 level stands out as a critical threshold. As long as this level cannot be regained, downward pressure is expected to continue. On the upside, staying above $2,000 could pave the way for renewed upward attempts en the short term, but it will not be sufficient el its own for a trend reversal.
Supports: 1,971 – 1,756 – 1,539
Resistances: 2,113 – 2,368 – 2,625
XRP/USDT
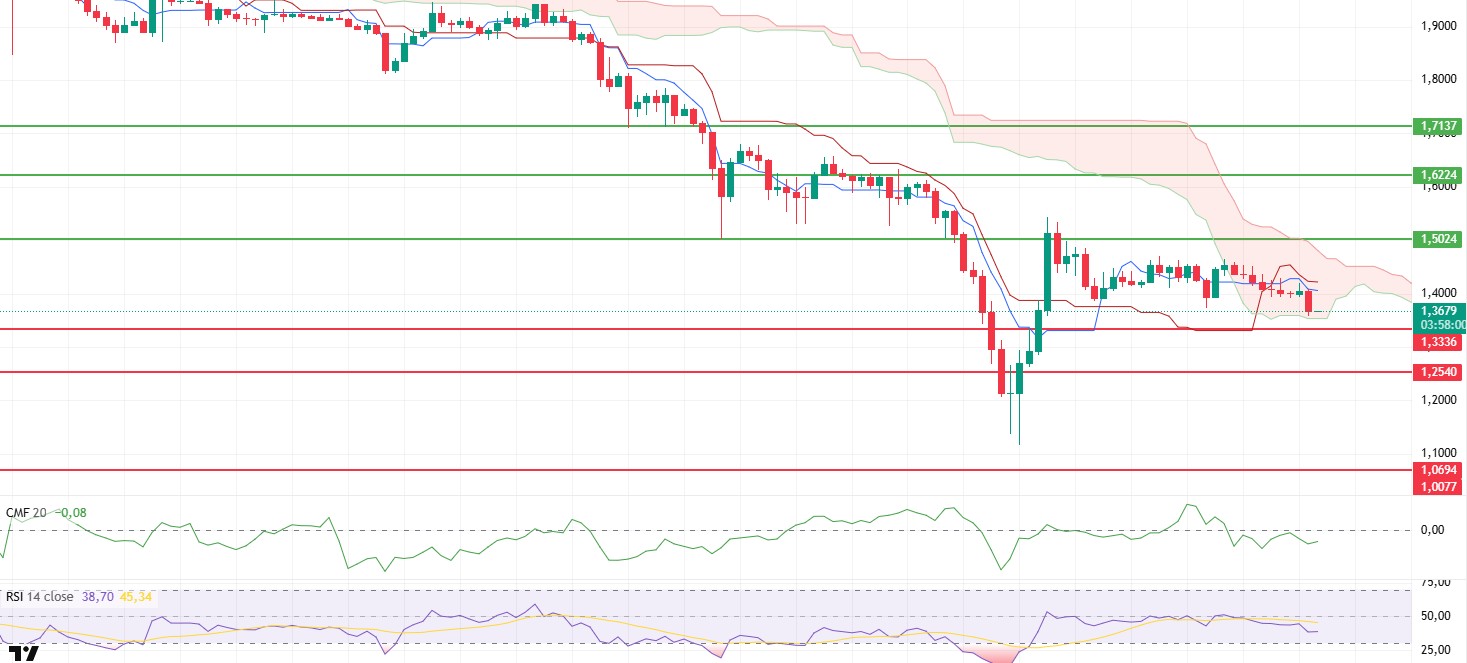
The XRP price moved downward en the morning horas as selling pressure became apparent again and began testing the lower band of the cloud. This movement indicates that buyers have been unable to maintain their strength en the short term and that the market has reverted to a cautious mode. Although the price remains within the cloud, downward pressure is increasing and the search for direction continues.
The liquidity picture remains weak. The Chaikin Money Flow indicator continues to move en negative territory. The lack of net cash inflows into the market indicates that buying appetite remains low en the spot market. Unless liquidity support strengthens, upward attempts are likely to be difficult.
The momentum picture has weakened further. The Relative Strength Index has turned downward. This structure indicates that sellers are beginning to regain the upper hand en the short term. It seems difficult to expect a strong rebound without a clear recovery en the RSI.
The technical outlook presents a mixed picture el the Ichimoku indicator. Although the price remains within the Kumo cloud, the Tenkan and Kijun levels have been lost. This structure indicates increased technical pressure en the short term, but the fact that the price has not fallen completely below the cloud suggests that the decline has not yet been confirmed.
In the overall picture, a pullback towards the $1.33 support level is possible during the day. If this level cannot be maintained, a deeper decline is expected. On the upside, the $1.50 level continues to be monitored as a critical resistance, and it seems difficult to talk about a clear recovery without breaking through this area.
Supports: 1.3336– 1.2540 – 1.0694
Resistances: 1.5024 – 1.6224 – 1.7137
SOL/USDT
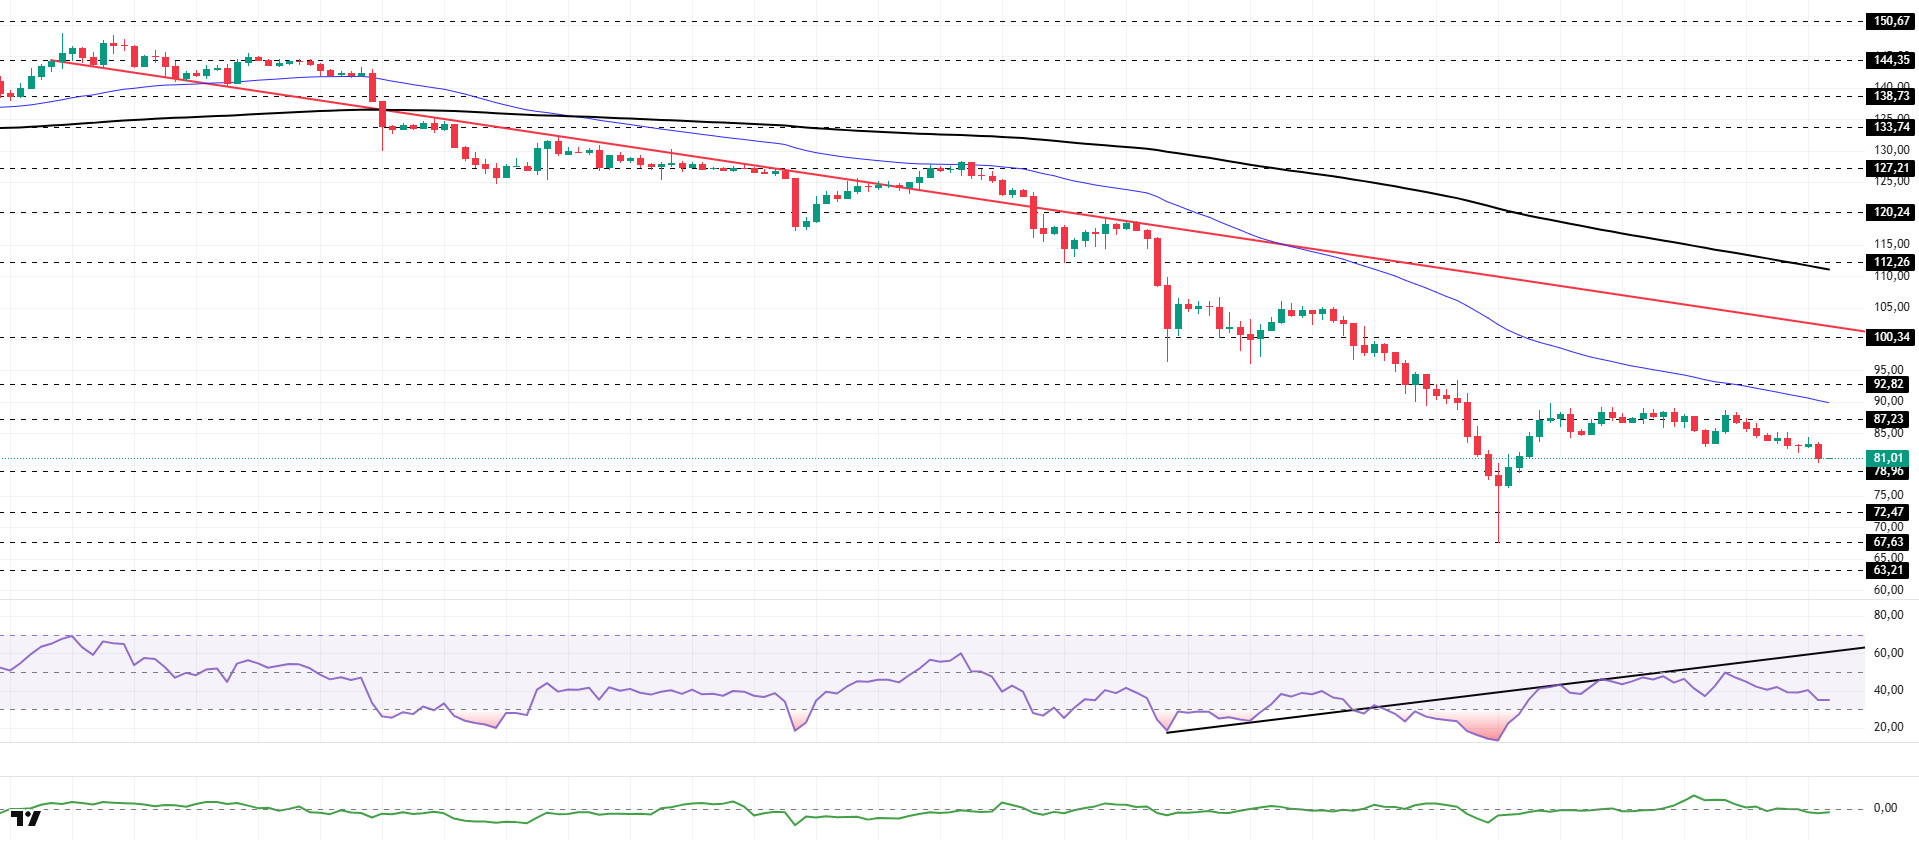
The SOL price experienced a pullback. The asset remained en the lower region of the downward trend that began el January 13, signaling continued selling pressure. Finding support at the strong support level of $67.63, the price gained momentum and rose from there. The price, which faced resistance at the strong resistance level of $87.23, continues to experience a slight pullback. If the uptrend begins, the 50 EMA (Blue Line) moving average could act as a resistance level. If the pullback resumes, the $78.96 level should be monitored.
On the 4-hora chart, the 50 EMA (Exponential Moving Average – Blue Line) continues to remain below the 200 EMA (Black Line). This indicates that the downtrend is continuing en the medium term. At the same time, the price being below both moving averages shows that the asset is trending downward en the short term. The Chaikin Money Flow (CMF-20) has started to move into negative territory. However, the decrease en money inflows could pull the CMF deeper into negative territory. The Relative Strength Index (RSI-14) fell from neutral levels and rose to the lower levels of negative territory. At the same time, it remained en the lower region of the rising line el January 31. This signaled that selling pressure continued. If there is an upturn due to macroeconomic data or positive news related to the Solana ecosystem, the $100.34 level stands out as a strong resistance point. If this level is broken upwards, the uptrend is expected to continue. If there are pullbacks due to developments en the opposite direction or profit-taking, it could test the $72.47 level. A decline to these support levels could increase buying momentum, presenting a potential upside opportunity.
Supports: 78.96 – 72.47 – 67.63
Resistances: 87.23 – 92.82 – 100.34
DOGE/USDT
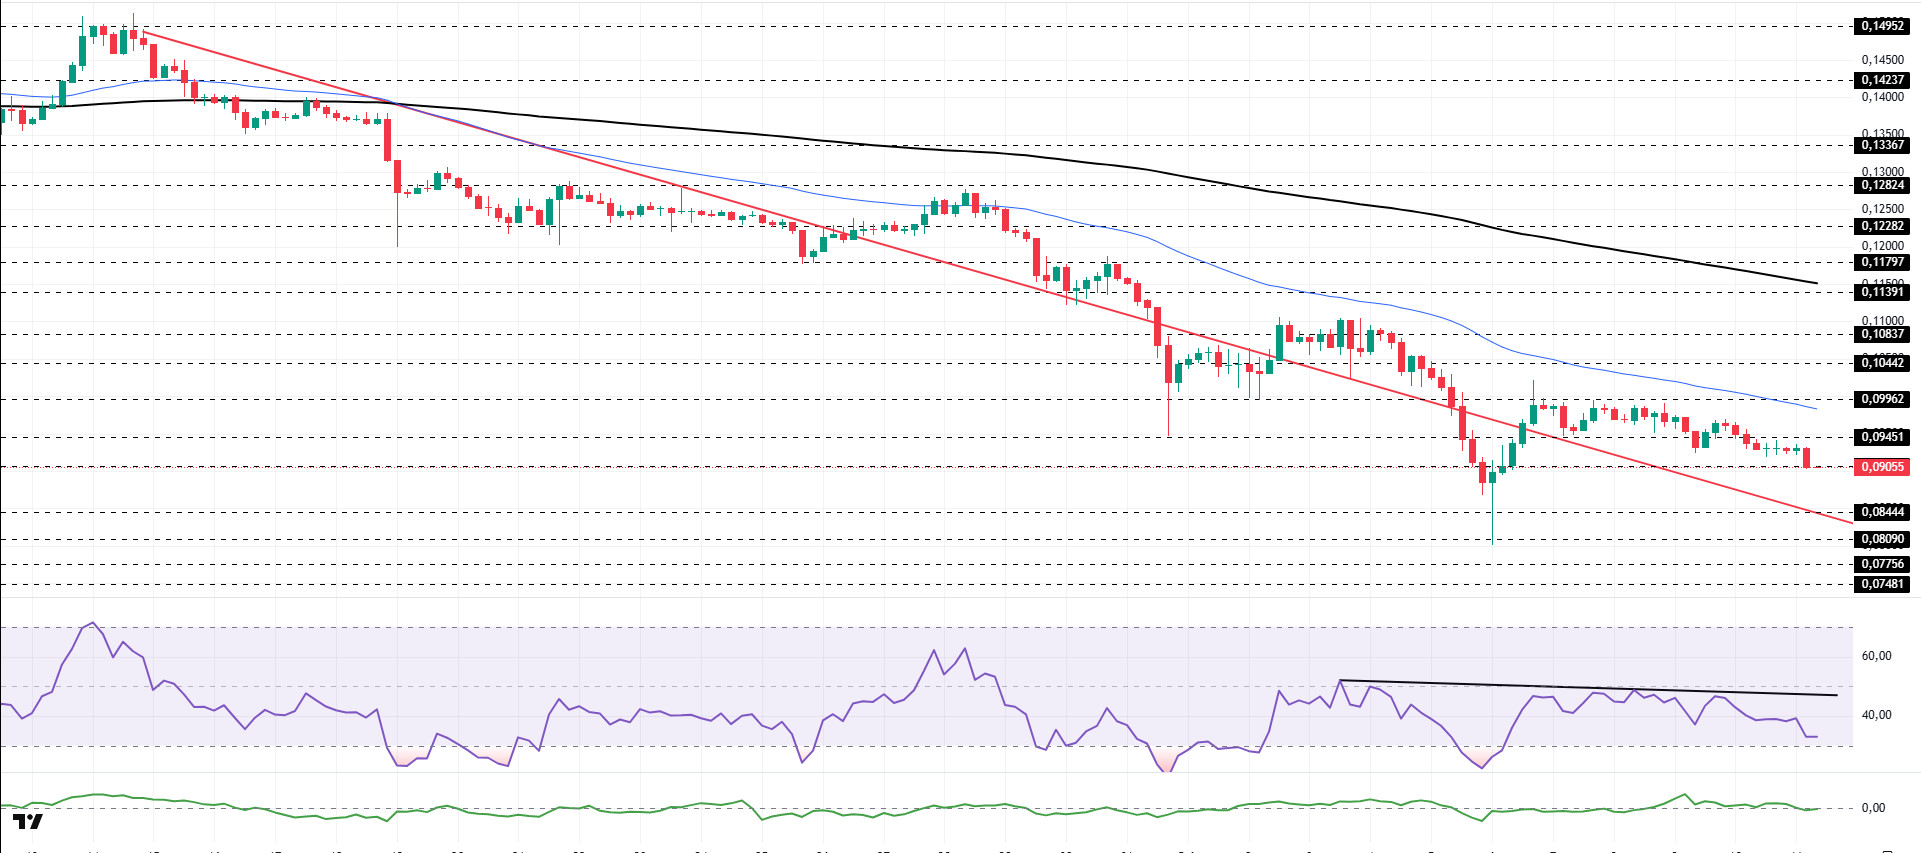
The DOGE price experienced a slight pullback. The asset remained en the upper region of the downtrend that began el January 14, signaling that buying pressure could form. Gaining momentum from the strong support level of $0.08090, the asset is currently trading en a narrow range between the downtrend and the 50 EMA (Blue Line) moving average. The $0.11391 level could act as resistance if candles close above the 50 EMA moving average. If the pullback continues, the downward trend should be monitored.
On the 4-hora chart, the 50 EMA (Exponential Moving Average – Blue Line) remained below the 200 EMA (Black Line). This indicated that a medium-term downtrend was forming. The price being below both moving averages suggests that the price may continue to decline en the short term. The Chaikin Money Flow (CMF-20) has fallen to a neutral level. Additionally, a decrease en cash inflows could push the CMF into negative territory. The Relative Strength Index (RSI-14) retreated from near the neutral level en negative territory to near the oversold zone. At the same time, it continued to remain below the downward trend line that began el February 3, indicating that selling pressure persists. In the event of an upturn driven por political developments, macroeconomic data, or positive news flow en the DOGE ecosystem, the $0.11797 level stands out as a strong resistance zone. Conversely, en the event of negative news flow, the $0.08090 level could be triggered. A decline to these levels could increase momentum and initiate a new wave of growth.
Supports: $0.09071 – $0.08444 – $0.08090
Resistances: 0.09451 – 0.09962 – 0.10442
SUI/USDT
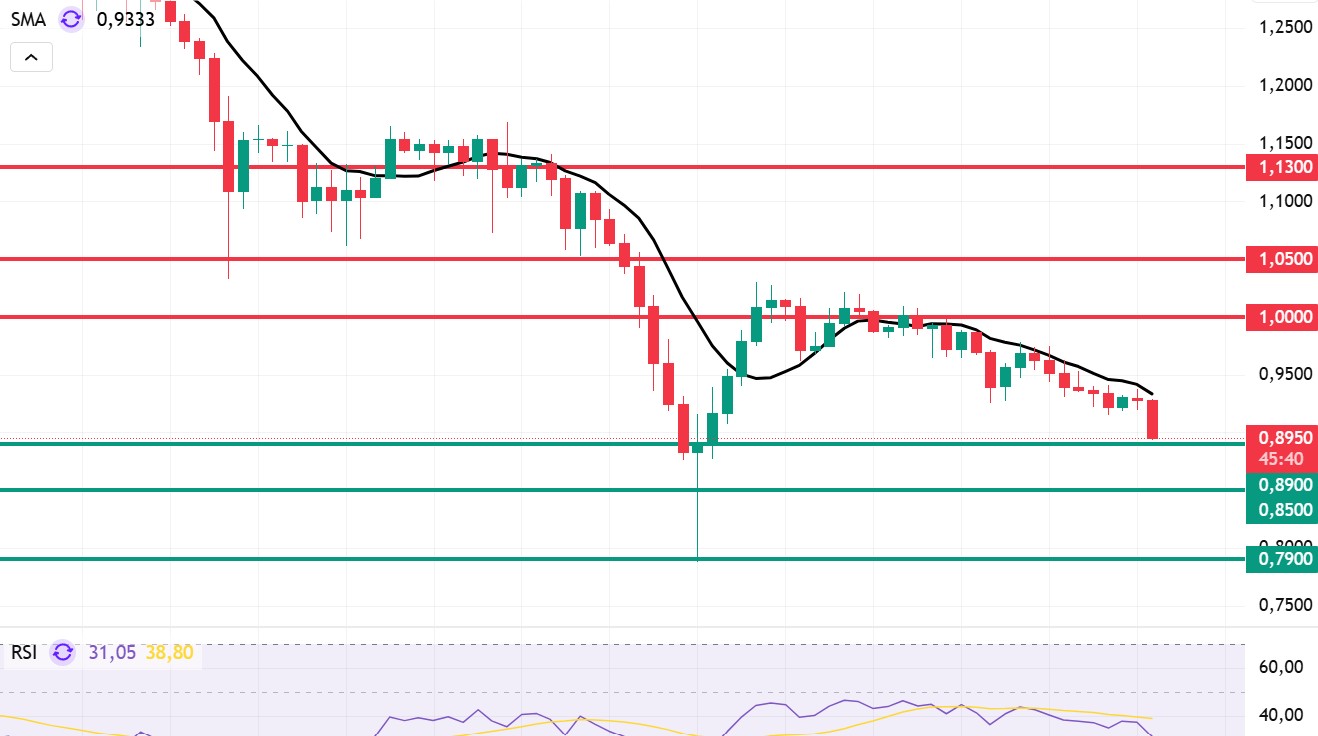
Looking at Sui’s technical outlook, we see that the price has fallen over the past 4 horas and is now moving sideways at around $0.89, influenced por fundamental developments. The Relative Strength Index (RSI) is currently en the range of 31.13 – 38.81. This range indicates that the market is trading at a point suitable for buying; however, if the RSI weakens and falls to the 35.00 – 40.00 range, it could signal a potential buying point. If the price moves upward, the resistance levels of $1.00, $1.05, and $1.13 can be monitored. However, if the price falls to new lows, it could indicate that selling pressure is intensifying. In this case, the $0.89 and $0.85 levels stand out as strong support zones. Based el the trend line, a pullback to $0.79 appears technically possible. According to Simple Moving Averages (SMA) data, Sui’s average price is currently at $0.93. If the price remains below this level, it could signal that the current upward trend may not continue technically. The downward trend of the SMA also supports this scenario.
Support levels: 0.79 – 0.85 – 0.89
Resistances: 1.00 – 1.05 – 1.13
Legal Notice
The investment information, comments, and recommendations contained herein do not constitute investment advice. Investment advisory services are provided individually por authorized institutions taking into account the risk and return preferences of individuals. The comments and recommendations contained herein are of a general nature. These recommendations may not be suitable for your financial situation and risk and return preferences. Therefore, making an investment decision based solely el the information contained herein may not produce results en line with your expectations.

