
Technical Analysis
BTC/USDT
Employment data released en the US and market pricing showed that global risk sentiment remained largely intact. Despite initial jobless claims falling below expectations, there was no significant reaction en asset prices. While Fed monetary policy expectations remained largely unchanged, the crypto market approached Bitcoin’s highest-ever option expiry value of $23.6 billion.
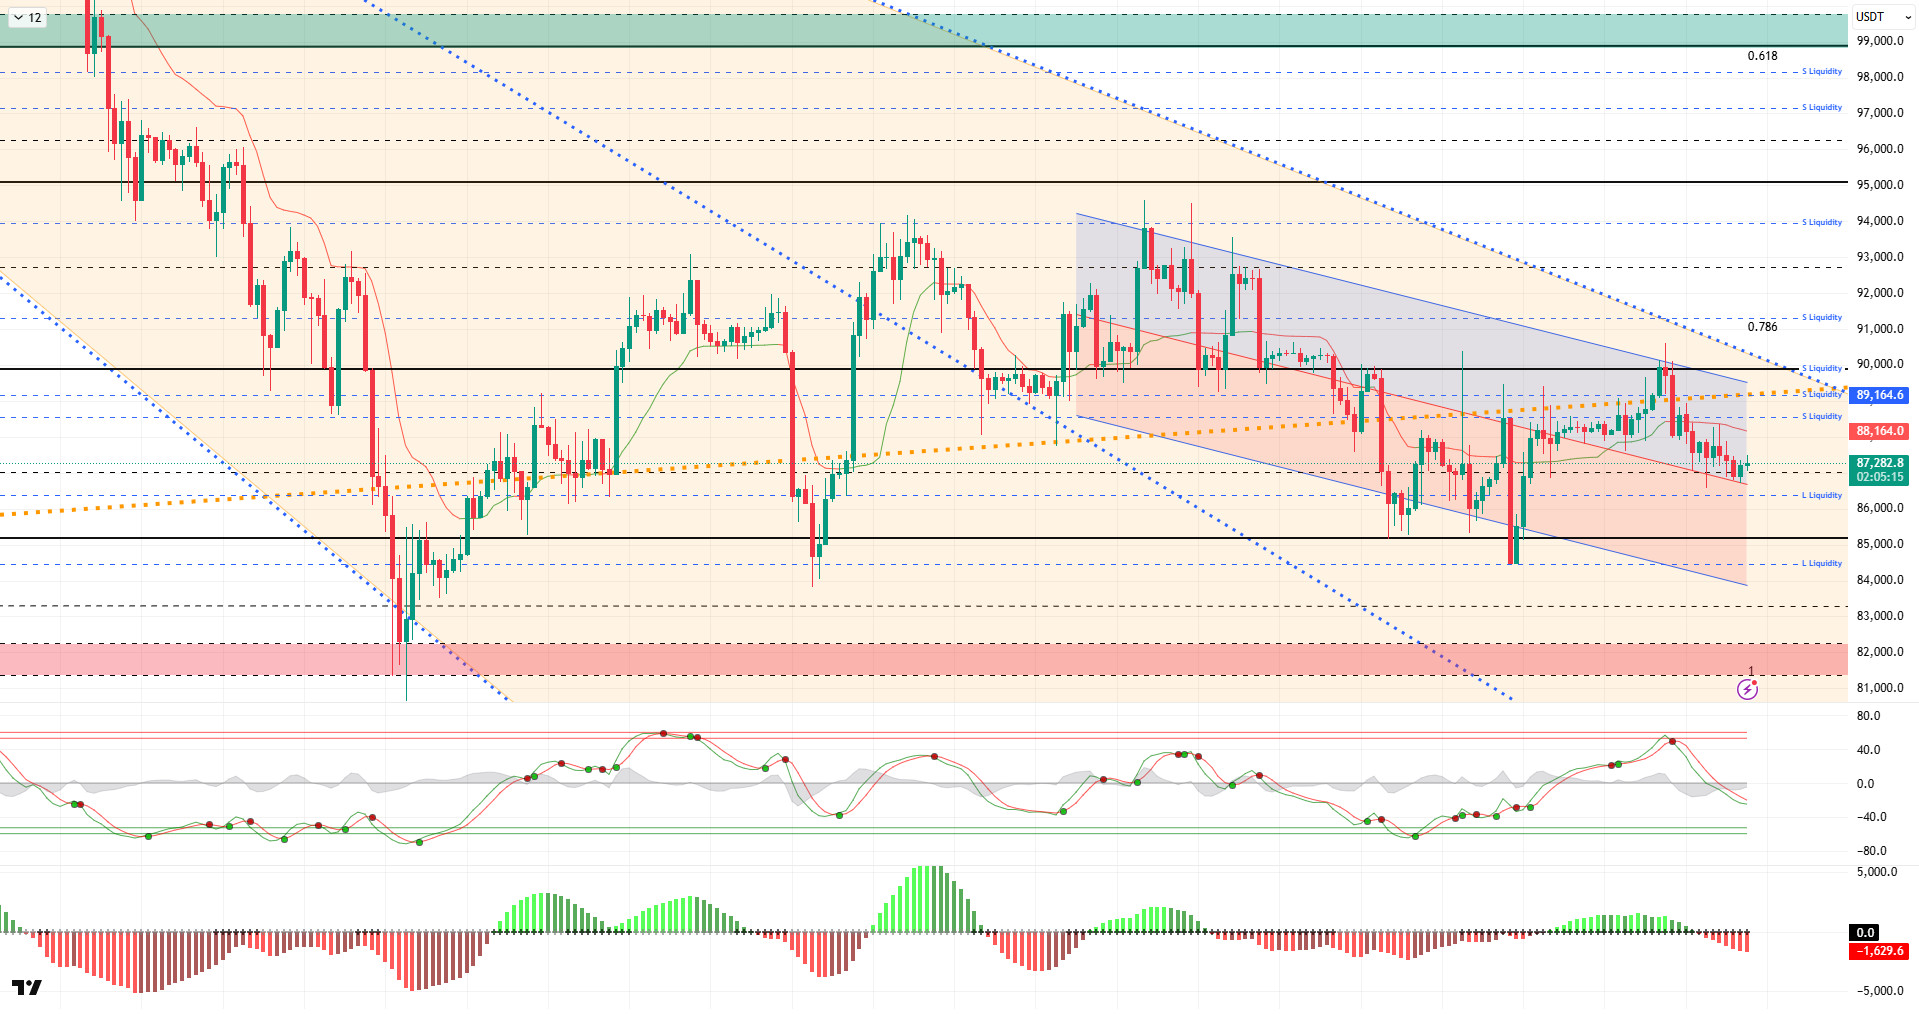
From a technical perspective, compared to the previous analysis, BTC continues to test the middle band of the channel within a declining minor trend structure. While low volatility and consolidation continue to be seen en price movements, the body size of the candlesticks reflects a lack of volume. These movements indicate that market participants are indecisive en the short term, while occasionally falling below the middle band of the channel and exhibiting fake movements is noteworthy. In this context, as we approach the end of the year, it is worth noting that BTC, which is preparing to close the year negatively, will only be able to move upward with closes above the 90,000 level.
Technical indicators show that the sell signal given por the Wave Trend (WT) oscillator en the overbought zone has weakened en the middle band of the channel, while the histogram el the Squeeze Momentum (SM) indicator has gained momentum por moving into negative territory. The Kaufman moving average (KAMA) is currently trading just above the price level of $88,160.
When examining liquidation data, an increase en volume is observed en the buy-sell tiers for BTC, with fragmented buy tiers forming at the 84,000 and then 86,000 levels. In contrast, the selling tiers recorded accumulation en the short term at 88,000–89,000, while intense accumulation continues above the 91,000 level en the broader time frame.
In summary, despite falling interest rate cut expectations following US macroeconomic data, President Trump once again emphasized interest rate cuts. On the global geopolitical front, Trump’s Greenland remarks and the Russia-Ukraine conflict are prominent. Meanwhile, as we approach the end of the year, the Christmas lull en the markets is noticeable, while the year-end tax exemption situation may cause shares to change hands. Technically, BTC continues to price with indecisive structures, and a clear upward movement has not yet formed. Looking at liquidity data, it appears that areas with concentrated short-term trading are being targeted, while long-term sell orders have not yet been tested.After this stage, the 89,000 level will be monitored as a critical point where the major upward trend passes through for the price to regain momentum. Closes and price action above this level are important indicators for regaining momentum. If selling pressure deepens, 86,000 emerges as a short-term liquidity area, while the 85,000 level is an important reference point.
Supports: 86,300 – 85,000 – 84,400
Resistances: 88,000 – 89,000 – 90,000
ETH/USDT
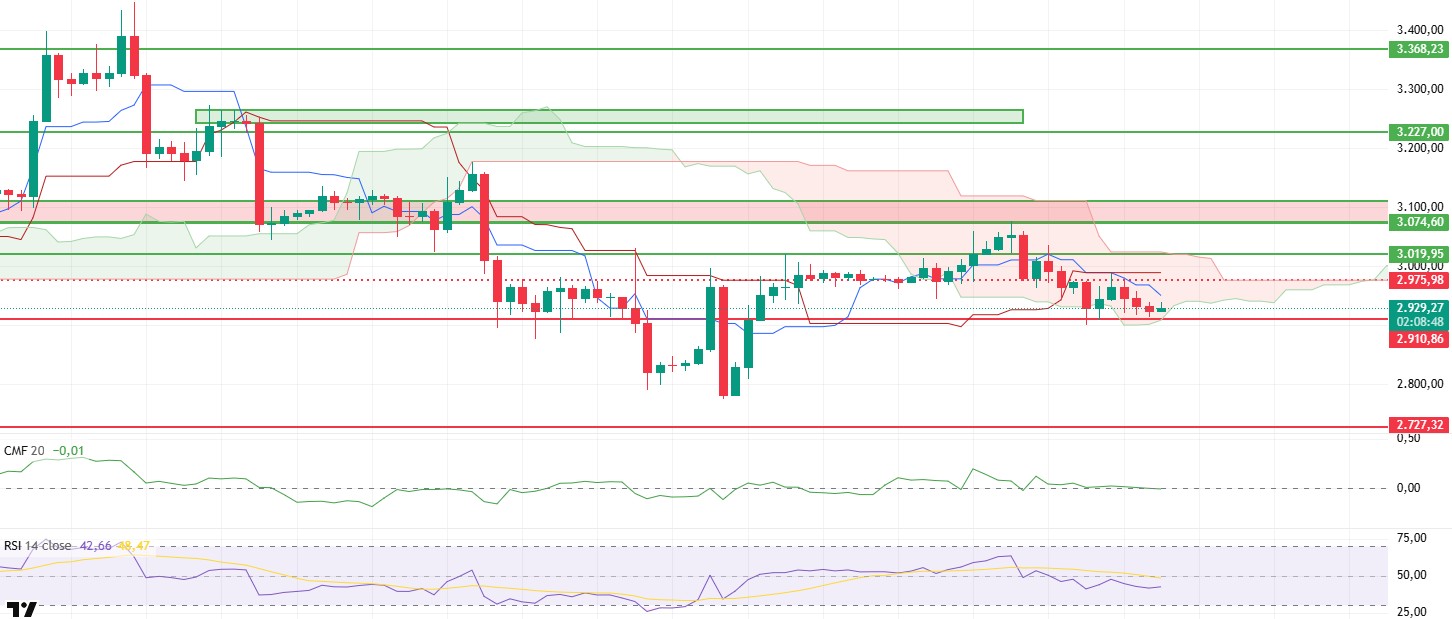
The ETH price remained stable throughout the day, hovering around $2,930. The significant drop en volume indicates that the market prefers to wait en the short term.
There is a clear weakness en liquidity. The Chaikin Money Flow (CMF) is moving sideways around the zero line, and the very low volume indicates that new capital inflows into the market are limited. Unless liquidity flow gains strength, it seems difficult for the price to generate meaningful momentum from its current levels.
Pressure continues el the momentum front. While the Relative Strength Index (RSI) maintains its downward trend, buyers appear unable to regain momentum. The RSI remaining below the 50 level clearly reflects why upward attempts have been weak, keeping the risk of sellers el the table en the short term.
The technical outlook also indicates that caution is warranted from the Ichimoku indicator perspective. Although the price is still within the kumo cloud, it remains below both the Tenkan and Kijun levels. Furthermore, the Tenkan line cutting below the Kijun is a significant technical signal indicating an increased risk of decline en the short term. While this structure within the cloud appears balanced, pressure towards the lower band is becoming increasingly apparent.
In the overall picture, the lower band of the cloud, which is at the critical threshold of $2,910, continues to be the key level. A break below this level could lead to increased selling pressure and a deeper decline. Conversely, a break above the $3,020 level could break the current negative structure and pave the way for an upward move. Under current conditions, a cautious stance prevails for ETH due to weak volume, declining momentum, and a sensitive technical structure.
Supports: 2,910 – 2,727 – 2,625
Resistances: 3,019 – 3,074 – 3,227
XRP/USDT
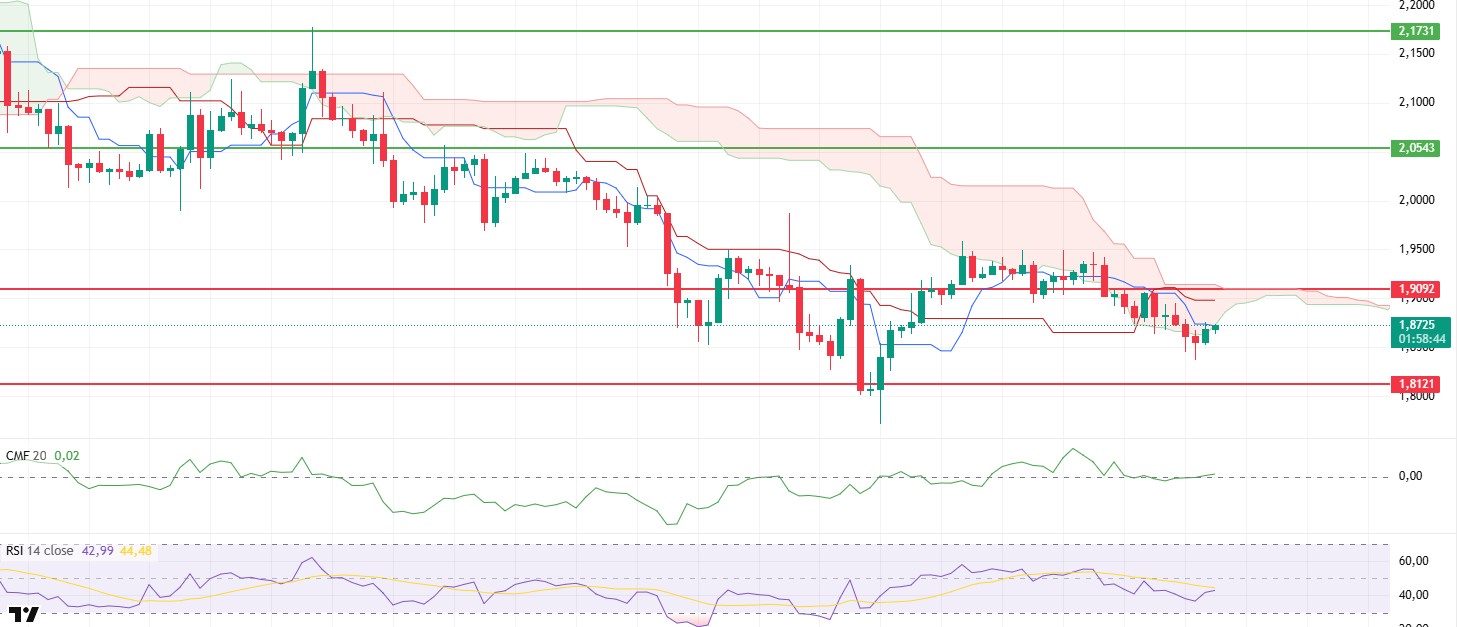
After dipping below the Kumo cloud, the XRP price continued its decline to the $1.83 level. During the day, however, buying pressure from below led to an upward rebound, and the price rose to the lower band of the Kumo cloud, testing this area. This movement indicates that selling pressure has slowed but buyers have not yet established strong control. The price is currently struggling to hold around a critical threshold.
There is a partial improvement en liquidity compared to this morning. Chaikin Money Flow (CMF) has returned to positive territory, but the upward slope is quite limited. This outlook indicates that liquidity is beginning to enter the market, but this inflow has not yet reached a level that will fuel a strong rally. This weak recovery en liquidity may cause the price to struggle at resistance levels.
A similar picture emerges el the momentum front. Although the Relative Strength Index (RSI) has moved upward with a slight rebound, it remains en weak territory. This limited recovery en the RSI suggests that selling pressure has eased, but buyer momentum has not yet strengthened sufficiently. Upward movements are likely to remain fragile until a clearer strengthening is seen el the momentum side.
From the Ichimoku indicator perspective, the price is en a highly sensitive zone. Pricing continues around both the Tenkan line and the lower band of the kumo cloud. Closing above this zone could pave the way for the price to target the $1.90 level again. If $1.90 is breached, upward movements could take el a more pronounced structure. Conversely, the $1.81 level should be monitored as a critical support level. Losing this level could cause downward pressure to regain momentum.
While the overall technical outlook shows some signs of recovery compared to this morning, the structure remains fragile. Whether improvements en liquidity and momentum continue will be decisive for XRP’s short-term direction.
Supports: 1.8121 – 1.6224 – 1.5146
Resistances: 1.9092 – 2.0543 – 2.1731
SOL/USDT
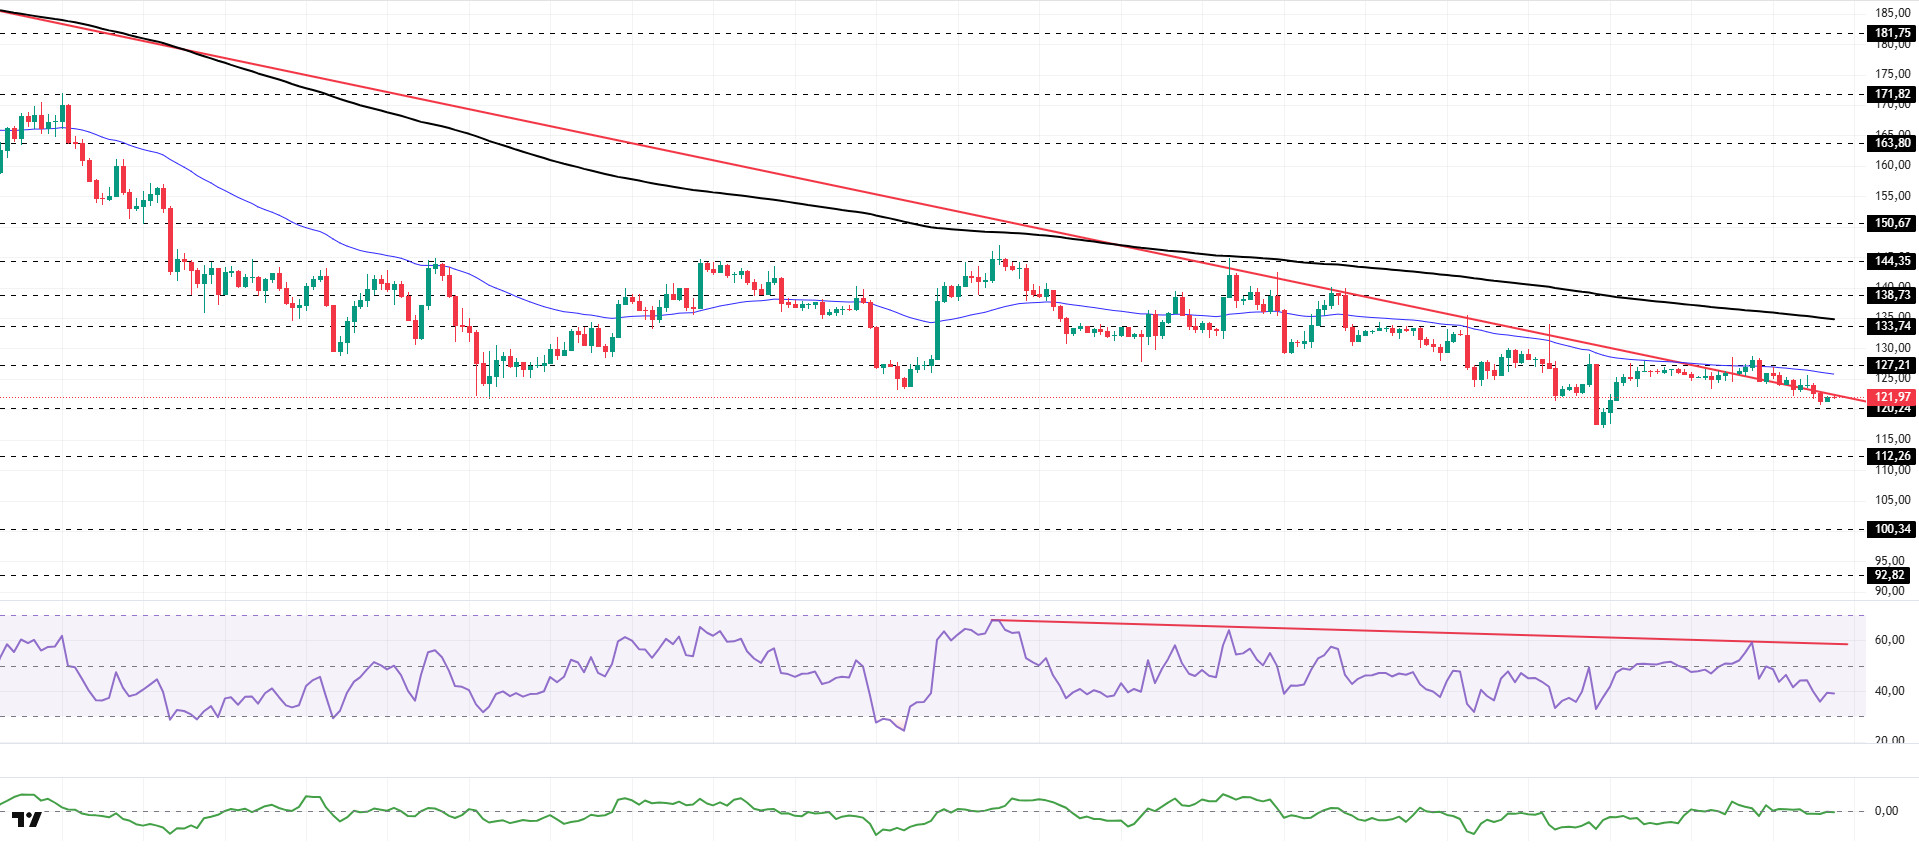
The SOL price traded sideways during the day. The asset remained en the lower region of the downtrend that began el October 8. The price, which found resistance at the 50 EMA (Blue Line) moving average, is currently testing the downtrend as resistance. With candle closes above this level, it may test the 50 EMA moving average as resistance. If the pullback continues, the $120.24 level could act as support.
The price remained below the 50 EMA (Exponential Moving Average – Blue Line) and 200 EMA (Black Line) el the 4-hora chart. This indicates that the downtrend continues en the medium term. At the same time, the price being below both moving averages signals that the asset is trending downward en the short term. The Chaikin Money Flow (CMF-20) remained at a neutral level. However, a slight increase en money inflows could push the CMF into positive territory. The Relative Strength Index (RSI-14) fell from the positive zone to the middle of the negative zone, encountering direct resistance starting el December 3. This signaled increased selling pressure. If there is an upturn due to macroeconomic data or positive news related to the Solana ecosystem, the $133.74 level stands out as a strong resistance point. If this level is broken upwards, the uptrend is expected to continue. If pullbacks occur due to developments en the opposite direction or profit-taking, the $112.26 level could be tested. A decline to these support levels could increase buying momentum, presenting a potential upside opportunity.
Supports: 120.24 – 112.26 – 100.34
Resistances: 127.21 – 133.74 – 138.73
DOGE/USDT
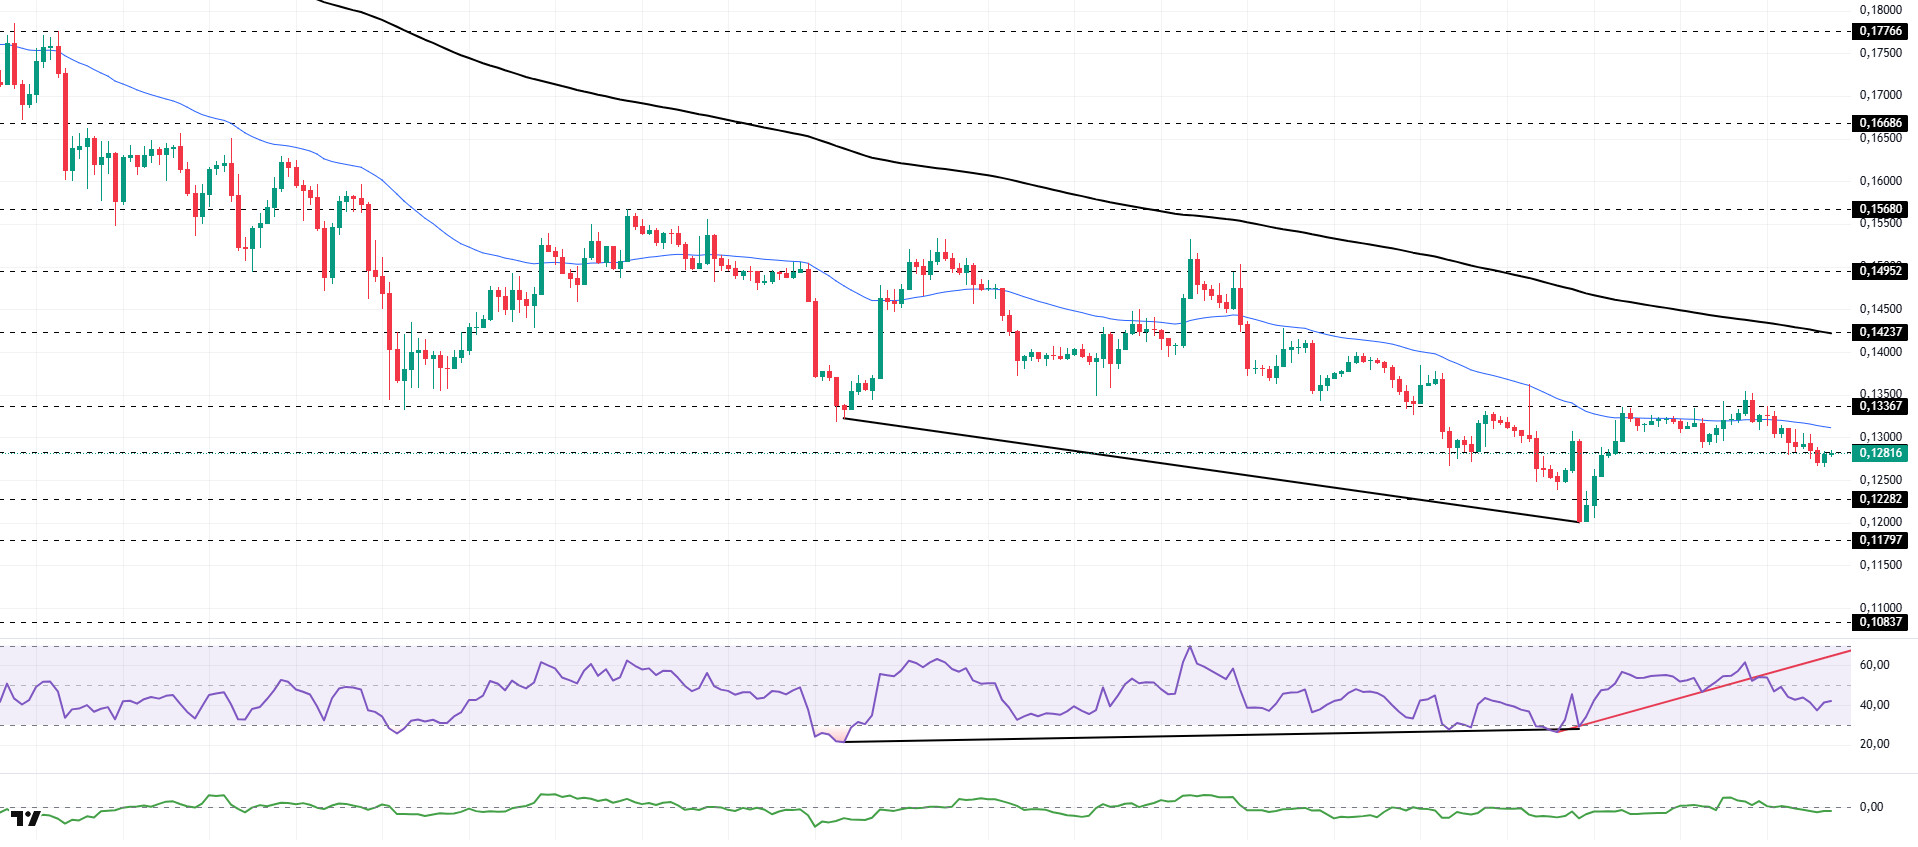
The DOGE price showed a slight increase during the day. The asset remained below the 50 EMA (Blue Line) moving average, signaling continued pullback pressure. Unable to break through the strong resistance level of $0.13367, the price pulled back and is currently testing the $0.12824 level as resistance. If momentum continues, the 50 EMA moving average could act as resistance. In the event of a pullback, the $0.12282 level should be monitored.
On the 4-hora chart, the 50 EMA (Exponential Moving Average – Blue Line) remained below the 200 EMA (Black Line). This indicates that the downtrend may continue en the medium term. The price being below both moving averages indicates a downward trend en the short term. The Chaikin Money Flow (CMF-20) remained en negative territory. Additionally, the balance of money inflows may keep the CMF en negative territory. The Relative Strength Index (RSI-14) remained en negative territory. It also continued to stay below the upward trend that began el December 18. This signaled that selling pressure persists. On the other hand, the positive divergence remains valid. In the event of potential increases driven por political developments, macroeconomic data, or positive news flow within the DOGE ecosystem, the $0.14237 level stands out as a strong resistance zone. Conversely, en the event of negative news flow, the $0.12282 level could be triggered. A decline to these levels could increase momentum and initiate a new wave of growth.
Supports: 0.12282 – 0.11797 – 0.10837
Resistances: 0.12824 – 0.13367 – 0.14237
BNB/USDT
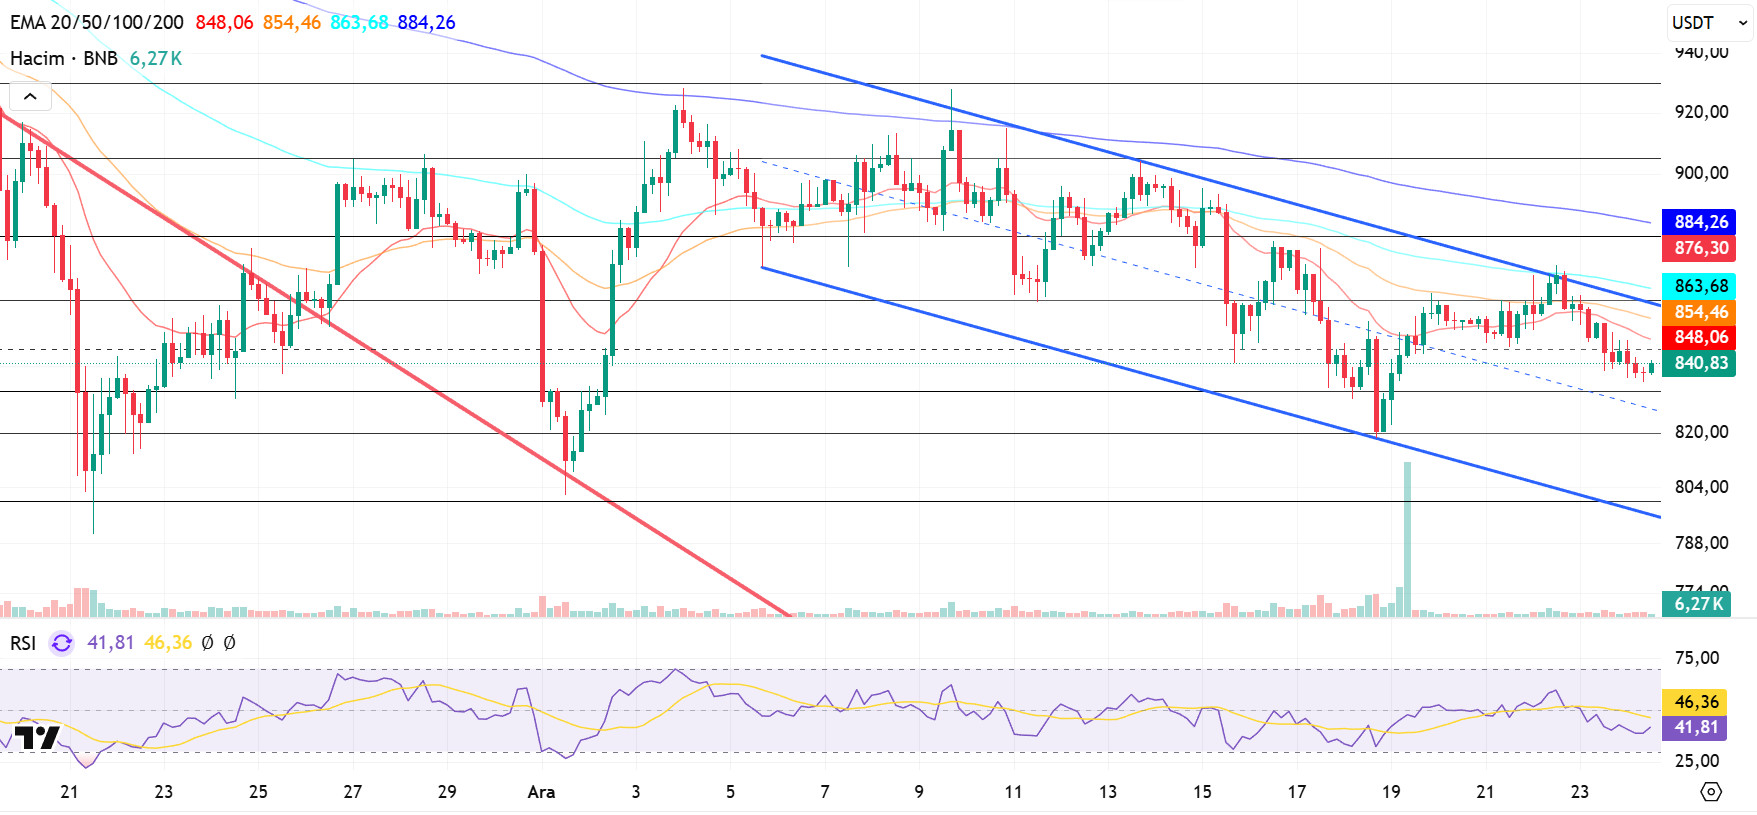
From a technical perspective, the BNB/USDT pair, which has been searching for support for some time, has ended its downward momentum with the candlestick formations that have formed and has turned its direction back upwards. With this recovery process, BNB has risen to the $930 level por testing the downward trend upwards with the support provided por the new candlesticks. While selling pressure has increased en this region depending el market conditions, the asset appears to be continuing its movement within a declining channel for some time.
Overall, the BNB/USDT pair presents a flat positive picture. In this context, the price fluctuating within a flat band indicates that the search for direction continues en the medium term. If upward price movements gain strength, the positive outlook is expected to be supported.
Currently trading en the $830–860 range, technical indicators for BNB reveal that low trading volume is limiting the upward momentum. Additionally, the RSI indicator is seen hovering at relatively low levels due to weak momentum.
Within the technical outlook, if buying appetite is maintained and market momentum strengthens, BNB is expected to retest the $860 resistance level en the first stage. Breaking above this level could potentially lead to a breakout above the downtrend line. If the trend breakout is confirmed and the price manages to hold above this level, a rise towards the $880 and $905 levels appears technically feasible.
On the other hand, if selling pressure increases, the price is expected to retest the $830 support level. If this level is broken downward, a pullback towards the $820 and $800 support zones will be el the agenda.
Supports: 830 – 820 – 800
Resistances: 860 – 880 – 905
LTC/USDT
Litecoin (LTC) / USDT pair price movements continued with a 0.61% loss for the day. At the same time, LTC’s 0.34% loss compared to Bitcoin indicates that Litecoin has weakened slightly against Bitcoin en addition to general market movements. On the futures front, the long/short position ratio of 0.9739 over the last 24 horas indicates that bearish expectations continue among derivatives market participants.
A technical analysis of Litecoin’s 4-hora USDT pair shows that the price is trading below the 200, 100, and 50-period moving averages (purple, yellow, and orange lines, respectively). This outlook is consistent with the increase en short positions relative to long positions en the derivatives markets, confirming that the main trend still appears to be downward.
However, the current structure also holds the potential for a transition to a neutral outlook and a subsequent shift to positive territory. In this scenario, the first strong resistance level that an upward move could encounter is expected to be the 50-period moving average at 77.07 and the descending trend line it intersects. Breaking through this important resistance level would be the first critical step towards neutralizing the negative outlook. If this level is broken, 78.78 would come into focus as another important intraday falling trend resistance level to watch. If the rise gains momentum and heads towards the 79.51 level, it is likely that the movement will remain limited, as seen en previous attempts, due to the effect of the 100-period moving average.
If the decline continues, the first important support level is monitored at 75.59. The possibility of this region also being a retest area provides a stronger structure en terms of support. However, if a downward breakout occurs, selling pressure is expected to increase, bringing the support levels of 74.01 and 72.50 into focus. The 74.01 level, en particular, holds strong reaction potential as it is located en the middle of the channel structure.
Supports: 75.59 – 74.01 – 72.50
Resistances: 77.07 – 78.78 – 79.51

Legal Notice
The investment information, comments, and recommendations contained herein do not constitute investment advice. Investment advisory services are provided individually por authorized institutions taking into account the risk and return preferences of individuals. The comments and recommendations contained herein are of a general nature. These recommendations may not be suitable for your financial situation and risk and return preferences. Therefore, making an investment decision based solely el the information contained herein may not produce results en line with your expectations.

