
BTC/USDT
As Trump’s rhetoric and actions towards Europe harden, the Greenland-centered debates are raising tensions el both trade and security fronts. In this process, while the EU is preparing to discuss possible countermeasures por convening an emergency summit, the economic and monetary policy agenda is also intensifying el the US side. While the Treasury Department sends strong messages of growth, Fed Chair Powell’s stance en the Cook case is bringing the debate over the independence of the Central Bank back to the forefront.
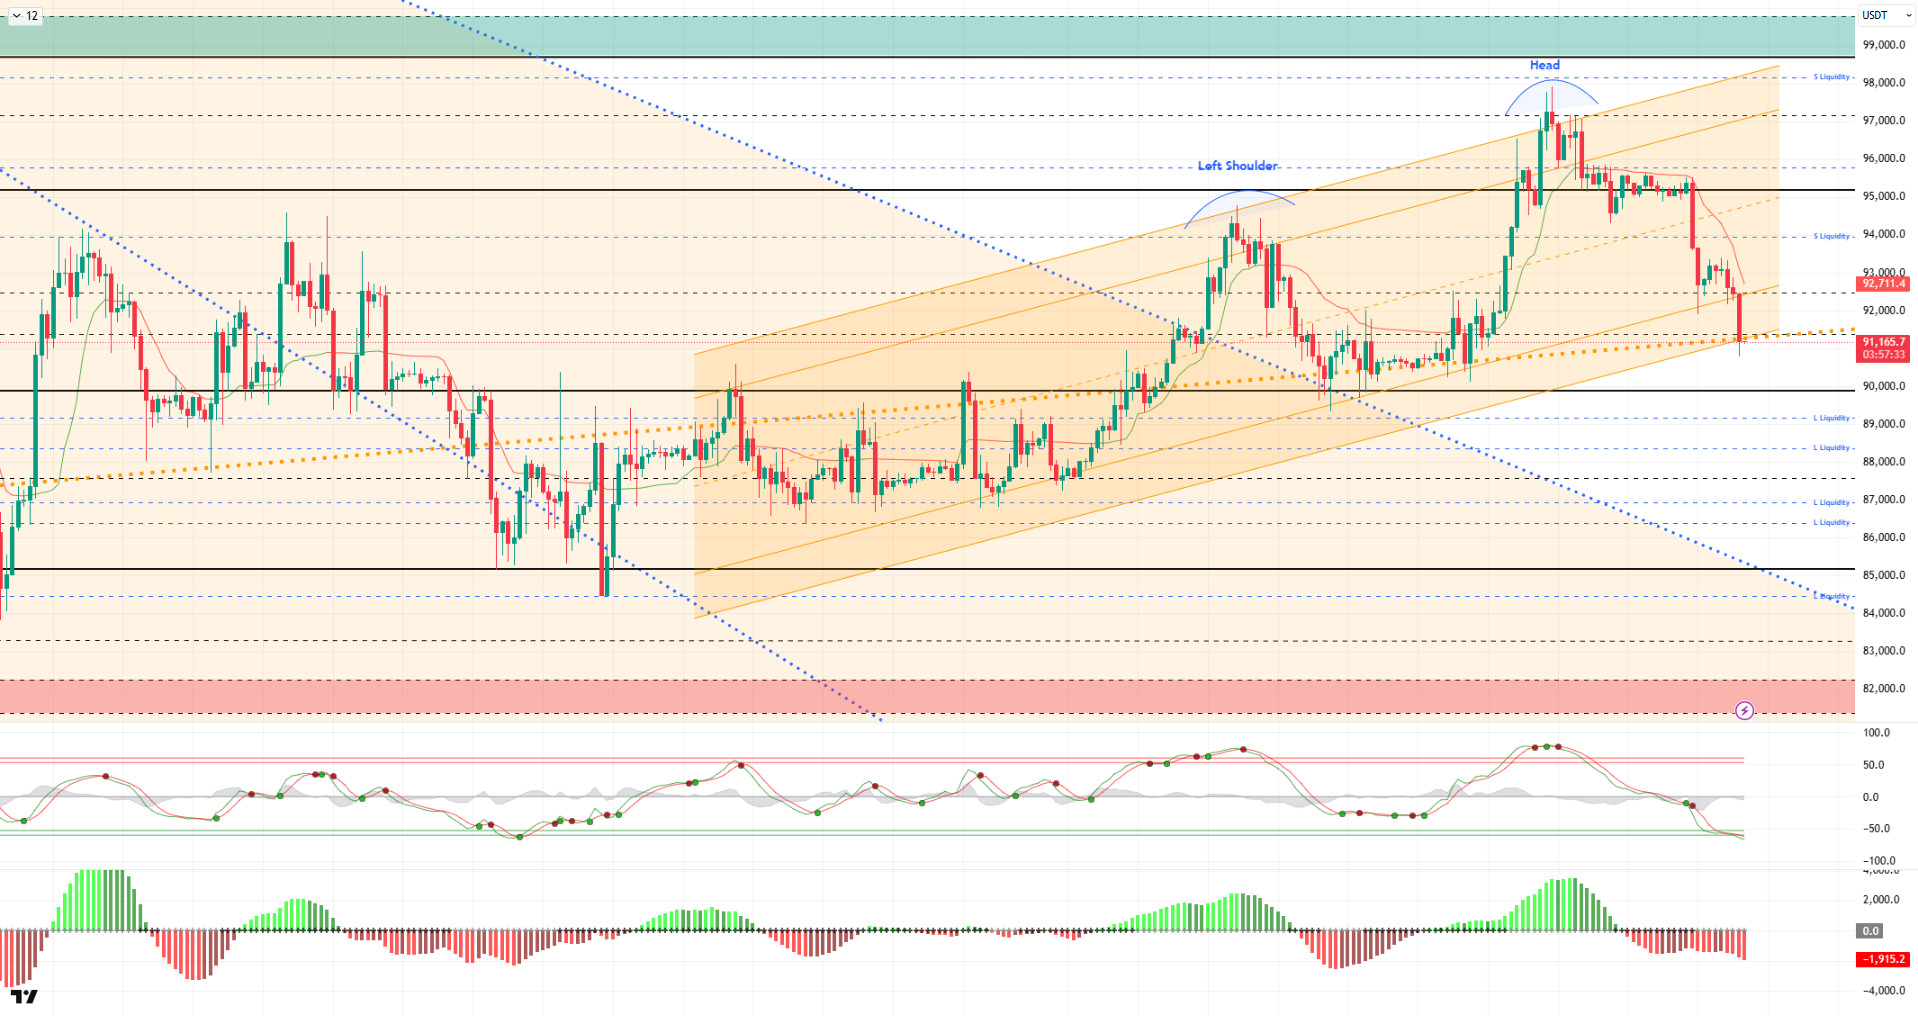
From a technical perspective, BTC failed to maintain the limited rise it recorded at the 93,450 level en the previous analysis. Breaking the lower line of the rising trend channel after several attempts amid increasing selling pressure, the price touched the major uptrend line and entered a trend extension. At the time of writing, BTC is testing the 91,400 support level and attempting to hold above it. A break below this level could result en a loss of the critical 90,000 level.
Technical indicators show that the Wave Trend (WT) oscillator is preparing to give a buy signal en the oversold zone, but has not yet produced a signal. The histogram el the Squeeze Momentum (SM) indicator has moved back into negative territory, confirming the downward trend. The Kaufman moving average (KAMA) is currently trading above the price at $93,181.
Upon examining liquidation data, the short-term buying level was liquidated at 93,300 with the recent decline. In a broader time frame, intense accumulation continues within the 88,000–90,000 band. In contrast, the selling level has formed intensity at 93,500 en the short term and 96,000 en the long term.
In summary, while President Trump’s insistence el Greenland continues, EU officials have decided to hold an emergency meeting to discuss possible countermeasures. In US domestic politics, while the Treasury Secretary sent messages of growth, Powell publicly announced his support for Cook. Technically, BTC started the new year with positive momentum, first reaching the 95,000 level and then continuing its parallel movement to the upward channel, rising to the 98,000 level. Facing short-term profit-taking at these levels, the price returned to the 95,000 reference area. After holding here for a while, BTC faced heavy selling pressure and fell below the trend line to the 90,800 level. After this stage, the price holding within the trend channel prepares the ground for a new upward movement, with 92,600 being monitored as the resistance area. In the event of a possible new selling pressure, the 90,000 level will again be monitored as a critical reference.
Supports: 91,400 – 90,000 – 89,000
Resistances: 92,600 – 94,000 – 95,000
ETH/USDT
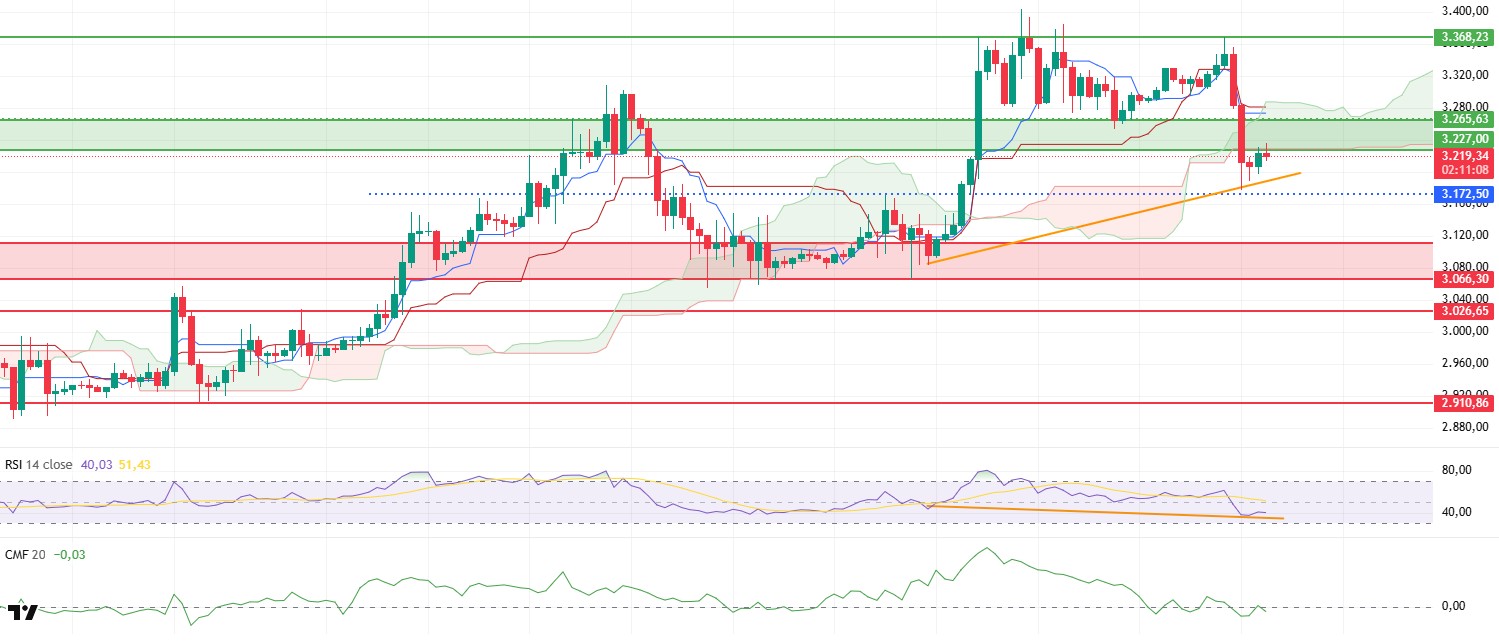
The ETH price retreated to the intermediate support level of $3,172 yesterday evening. With the loss of this support en the morning horas, selling pressure accelerated and the price fell back to the upper band of the critical support area. Currently, efforts to hold at the $3,125 level are prominent. Although there is a search for a reaction, buyers are not showing clear strength at this stage.
The liquidity picture has weakened. Chaikin Money Flow (CMF) has moved into negative territory with this decline. This outlook indicates that money is flowing out of the market at an accelerated pace and that the decline is supported not only por price action but also por weakness el the liquidity side. It would not be surprising if upward attempts remain short-lived until CMF recovers.
Pressure is more clearly felt el the momentum front. The Relative Strength Index (RSI) has fallen to the oversold zone. At present, there is no meaningful recovery signal el the RSI side, and momentum appears to remain weak. This structure makes it difficult for prices to move up easily, even if there are reactions during the day.
It is also quite weak from the Ichimoku indicator perspective. The price remains below the Kumo cloud, and the Tenkan and Kijun levels have not been regained. This positioning indicates that downward pressure will continue en the short term and that attempts to rise may encounter renewed selling at resistance levels.
In the overall assessment, the range between $3.066 and $3.119 stands out as a critical support band. It seems possible that the price will come under pressure towards this area during the day. Reactionary buying from this area should be considered normal. If the price falls below the $3.066 level, it is likely that selling will intensify and the decline will deepen.
Below the Form
Supports: 3,111 – 3,066 – 3,026
Resistances: 3,172 – 3,227 – 3,368
XRP/USDT
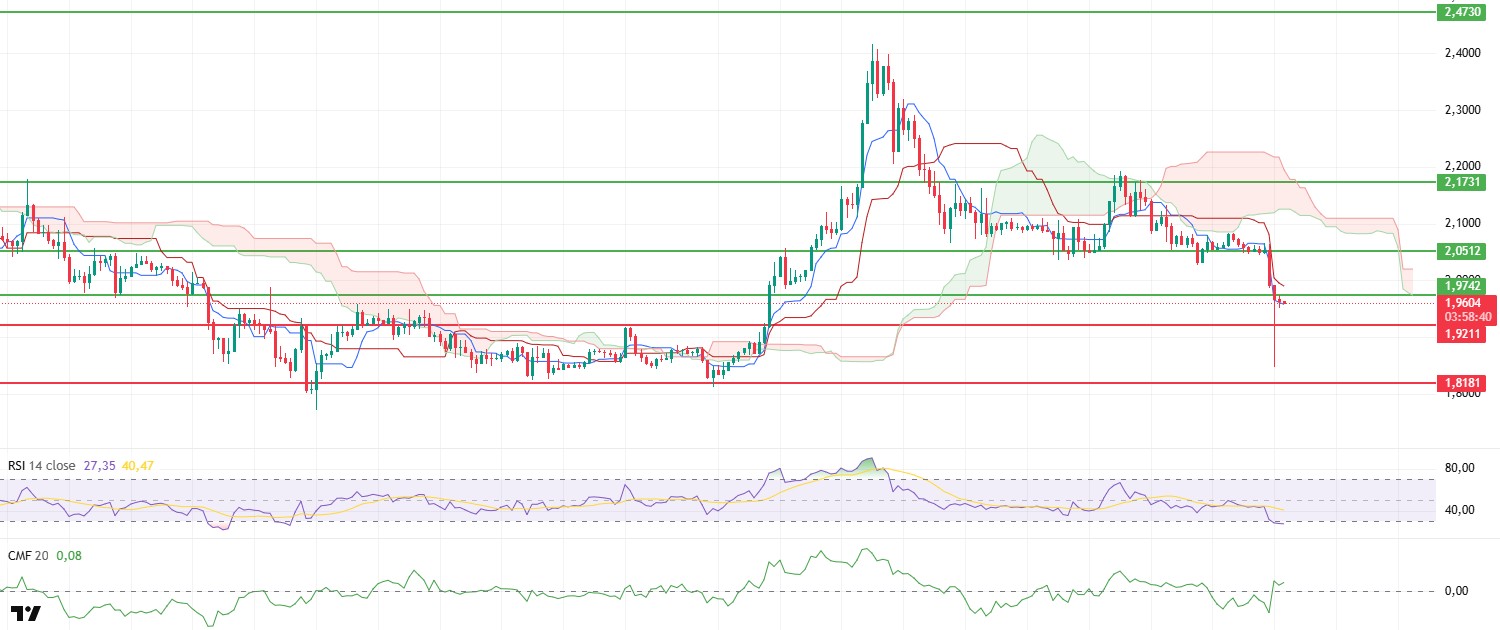
The XRP price attempted to recover to the $2.03 level yesterday evening. However, this rise was not sustainable, and with appetite weakening el the spot side, selling resumed. Following the pullback, the price dropped to around $1.95. The current outlook indicates that the rebound from the bottom is not yet complete, but buyers are still unable to confidently take the lead.
The liquidity picture is not completely deteriorated. Although the Chaikin Money Flow (CMF) has lost its previous strength, it remains en positive territory. This structure suggests that there has been no sharp outflow of money from the market and that sales are progressing en a controlled manner for now. The CMF remaining en positive territory continues to be one of the factors supporting the search for equilibrium around $1.95.
On the momentum front, the weakening has become apparent again. The Relative Strength Index (RSI) is retreating back towards the oversold zone. This movement en the RSI indicates that buyers are losing momentum and the price is struggling to make upward moves. Unless momentum recovers, attempts to rise may remain short-lived.
Pressure persists from the Ichimoku indicator. The price remains en a weak technical zone, and critical levels have not been regained. Since no recovery is seen el the Tenkan and Kijun sides, selling pressure is likely to resurface during upward attempts.
In general, the main level remains at the $2.05 range. As long as the XRP price fails to break through this area again, recovery attempts are likely to remain limited, and the price may face downward pressure. However, if the $2.05 level is clearly regained, the short-term outlook could improve, and the upward movement range could expand again.
Supports: 1.9211 – 1.8181 – 1.6224
Resistances: 1.9742 – 2.0512 – 2.1731
SOL/USDT
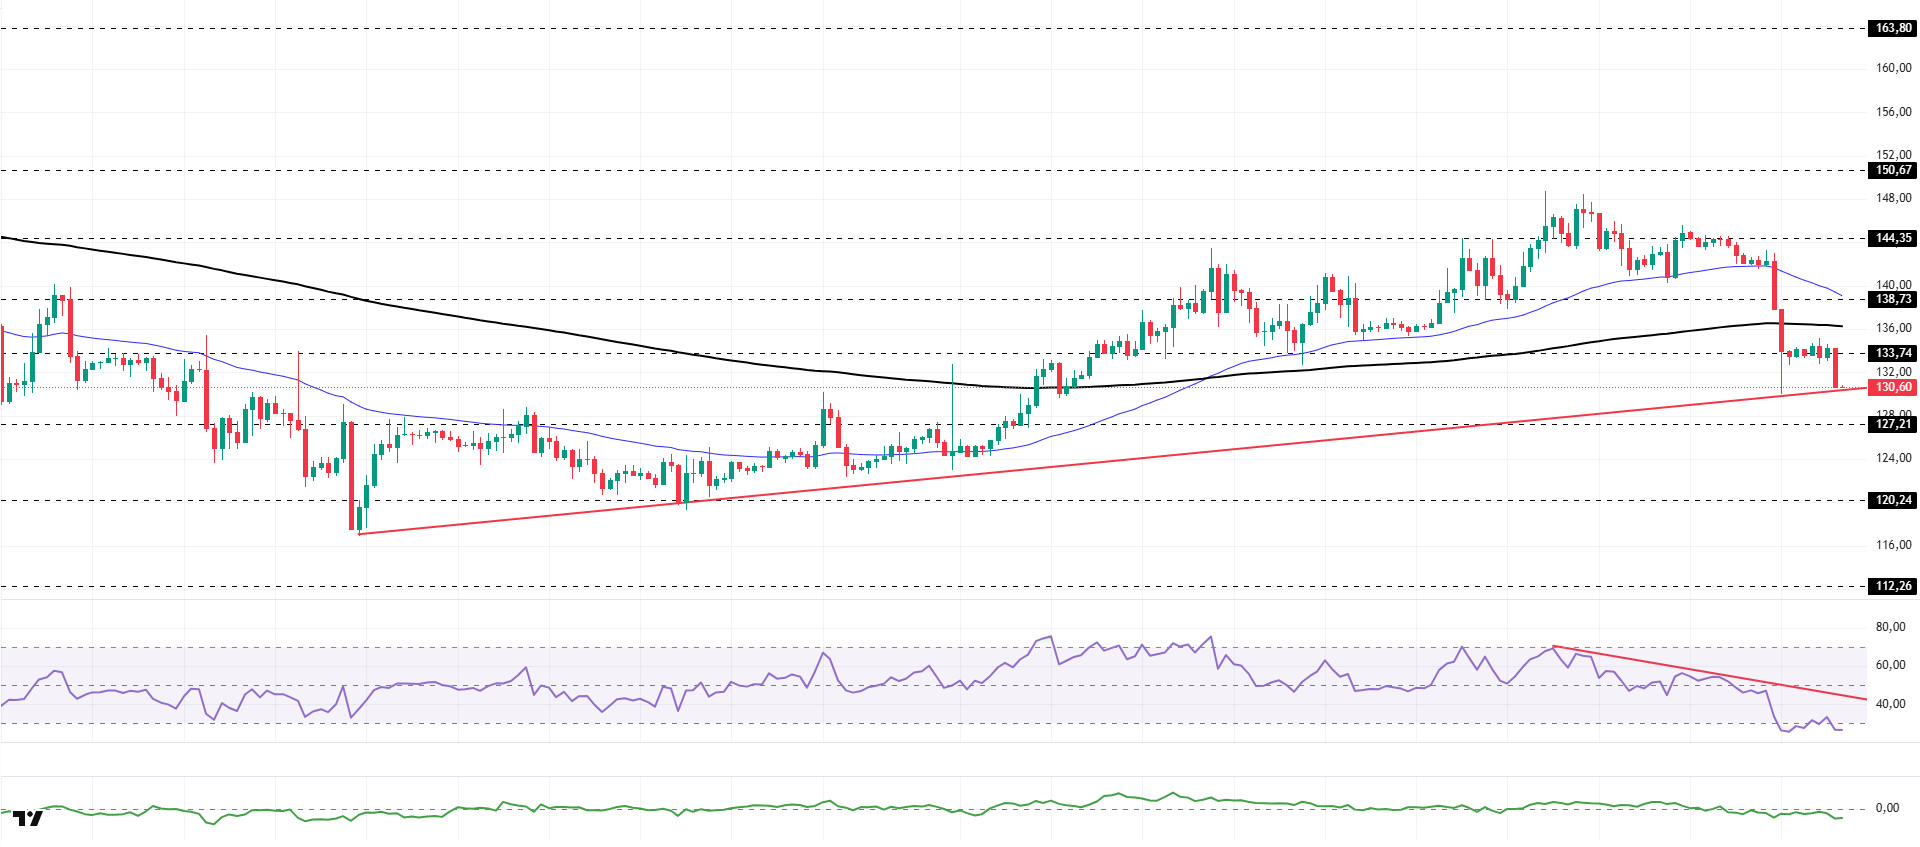
The SOL price continues to experience a pullback. The asset remained en the upper region of the rising line that began el December 18. Testing the 50 EMA (Blue Line) moving average and the 200 EMA (Black Line) moving average as support, the price broke below these levels, deepening its pullback. The asset, which gained momentum from the rising trend and showed a slight increase, lost this gain and is currently testing the rising trend as a support level again. If the price closes below this level, the $127.21 level could act as support. If the price rises, it could test the 200 EMA moving average as resistance.
On the 4-hora chart, the 50 EMA (Exponential Moving Average – Blue Line) remained above the 200 EMA (Black Line). This indicated that an uptrend could begin en the medium term. At the same time, the price being below both moving averages signaled that the asset was trending downward en the short term. The Chaikin Money Flow (CMF-20) remained en negative territory. However, the decrease en cash inflows and outflows could push the CMF deeper into negative territory. The Relative Strength Index (RSI-14) remained below the downward trend that began el January 14, indicating continued selling pressure. Currently en the oversold zone, the metric may show a slight increase if profit-taking occurs. If an uptrend occurs due to macroeconomic data or positive news related to the Solana ecosystem, the $150.67 level stands out as a strong resistance point. If this level is broken upwards, the uptrend is expected to continue. In the event of pullbacks due to developments en the opposite direction or profit-taking, it may test the $120.24 level. A decline to these support levels could increase buying momentum, presenting a potential upside opportunity.
Supports: 127.21 – 120.24 – 112.26
Resistances: 133.74 – 138.73 – 144.35
DOGE/USDT
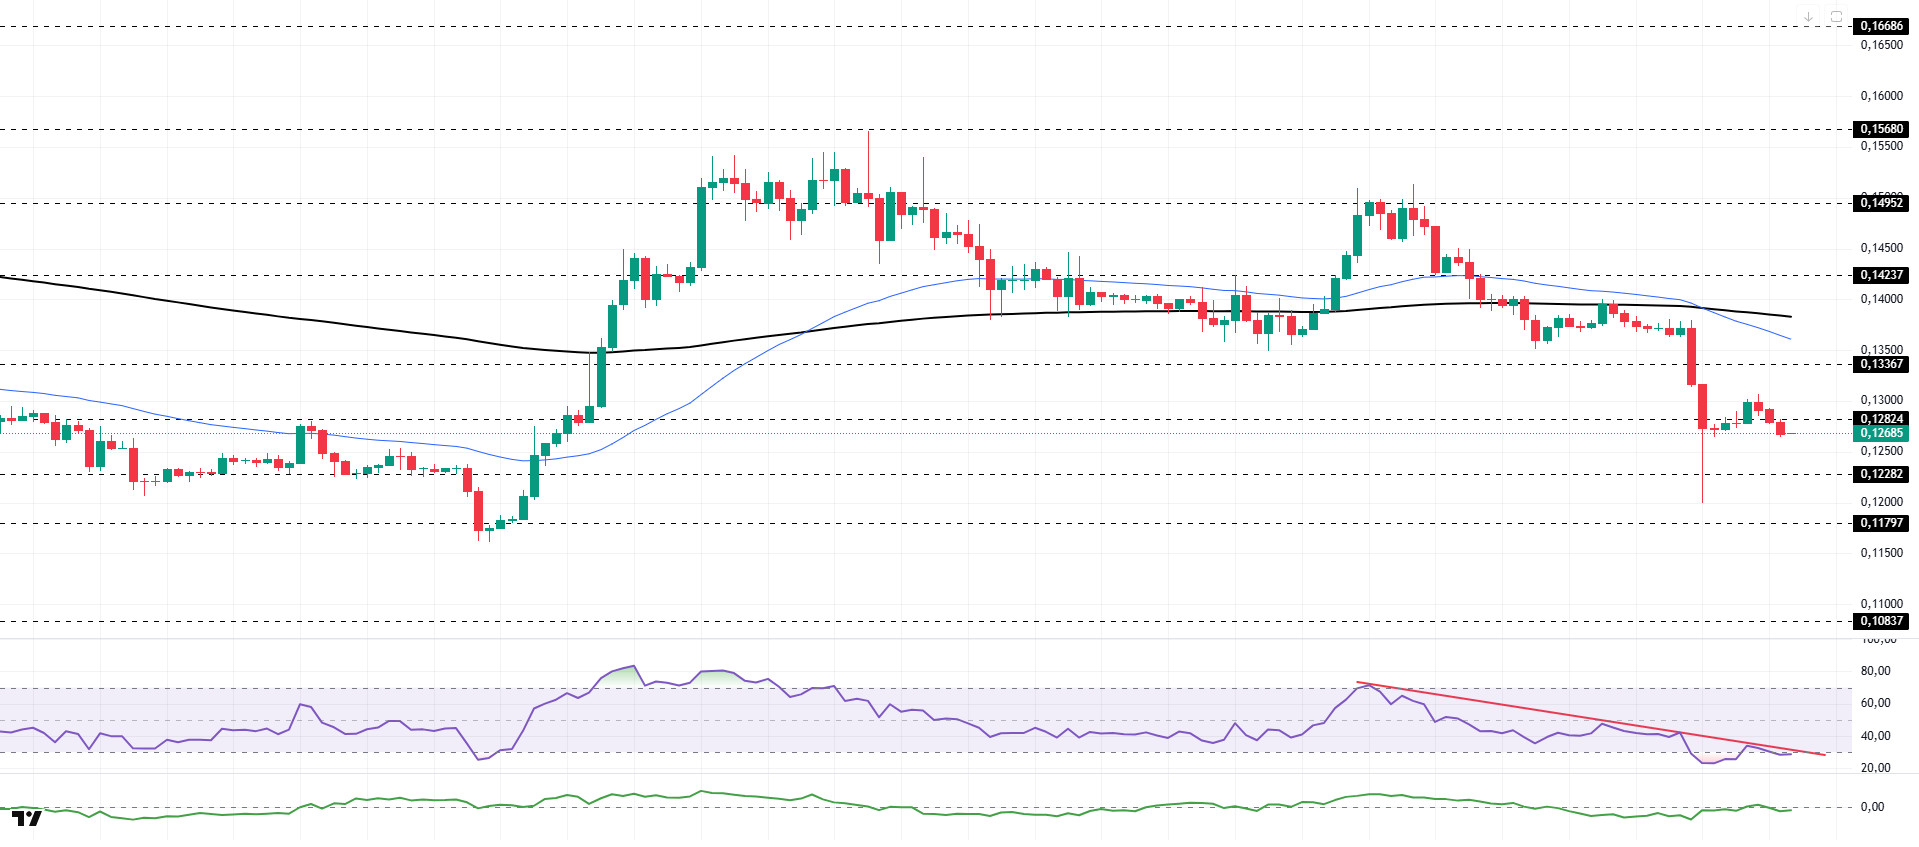
The DOGE price traded sideways. The asset crossed below the 200 EMA (Black Line) moving average and moved into the lower zone. After testing the strong support level of $0.12282 and seeing a reaction, the asset experienced a slight rise and is currently testing the $0.12824 level as resistance. If it closes above this level, it could test the $0.13367 level. If the pullback continues, the $0.12282 level should be monitored.
On the 4-hora chart, the 50 EMA (Exponential Moving Average – Blue Line) remained below the 200 EMA (Black Line). This indicated that a medium-term downtrend was forming. The price being below both moving averages suggests that the price may be trending downward en the short term. The Chaikin Money Flow (CMF-20) remained en negative territory. Additionally, a decrease en cash inflows could push the CMF deeper into negative territory. The Relative Strength Index (RSI-14) remained en the oversold zone. This could lead to a rebound due to profit-taking. It also continued to stay below the downward trend line that began el January 14. This signaled that selling pressure persisted. In the event of a rise due to political developments, macroeconomic data, or positive news flow en the DOGE ecosystem, the $0.14952 level stands out as a strong resistance zone. Conversely, en the event of negative news flow, the $0.11797 level could be triggered. A decline to these levels could increase momentum and start a new wave of growth.
Supports: 0.12282 – 0.11797 – 0.10837
Resistances: 0.12824 – 0.13367 – 0.14237
SHIB/USDT
The latest outlook for Shiba Inu shows that while stability is maintained el the infrastructure side, ecosystem capital is being positioned more selectively. Shibarium chain statistics confirm the network’s usage pace, indicating that the average block time remains around 5 segundos, the number of completed transactions has exceeded 165.9 million, and the number of addresses is progressing at around 56 million. In contrast, the total locked value declined from $737,139 to $652,099, recording an 11.54% drop. However, the limited short-term change suggests that the market is seeking a more cautious balance following this pullback. On the DEX side, although the weekly total volume rose to $112,434, indicating a strong increase and suggesting that the appetite for trading has not completely faded, the intraday volume remaining en the low band reveals that activity is still fragmented and opportunity-driven. On the burn front, the burning of 28,863,518 SHIB and the burn rate rising to 1,126.90% brought supply dynamics back to the agenda. The sustainability of this effect will be determined not por isolated spikes but por whether the burning gains continuity.
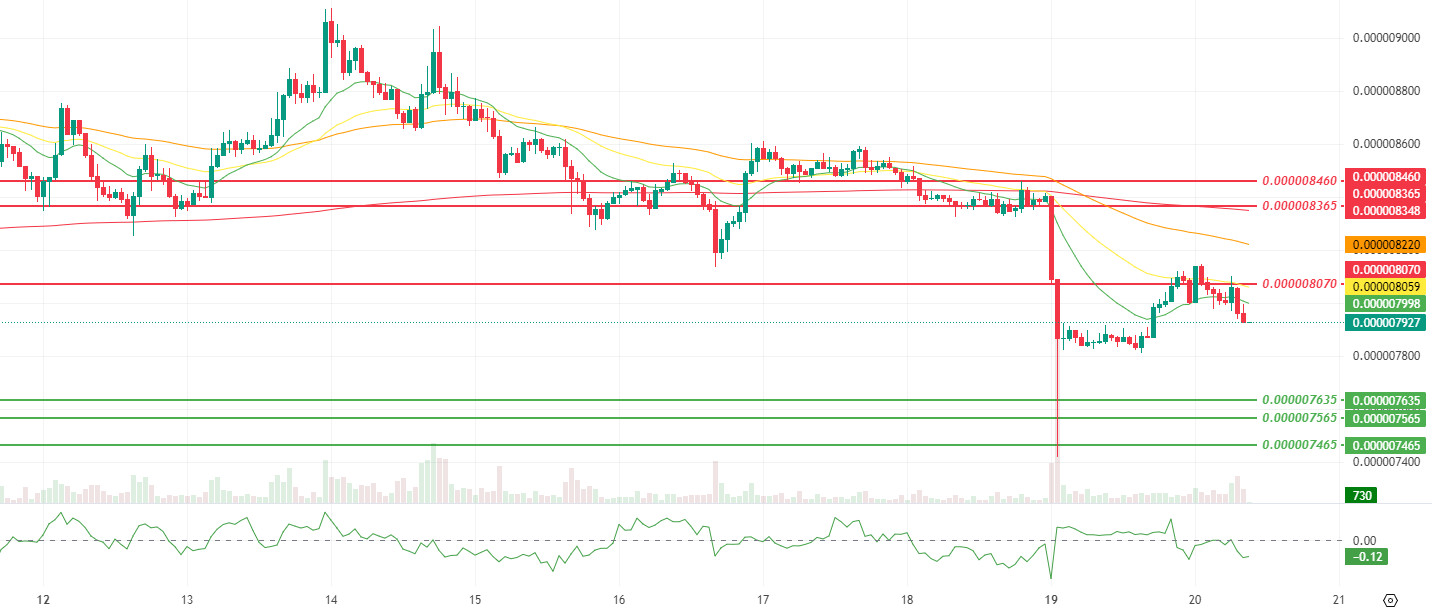
The technical picture shows that the bottom reaction formed at the $0.000007635 band after the sharp breakout briefly recovered the price, but it faced renewed selling pressure below the $0.000008070 level and failed to confirm the recovery por remaining below the Smoothed Moving Average (SMMA) periods. The recovery seen en momentum suggests that the technical reaction from the bottom region is still alive, while the decline en volume indicates that this upward attempt is not supported por strong participation. The limited increase en volatility indicates that, despite the reaction, volatility has risen again and that we have entered a more sensitive pricing environment where wicks could lengthen en the short term. The Chaikin Money Flow (CMF) indicator returning to negative territory is critical because it confirms that, despite the reaction, net capital flows remain el the selling side and that upward attempts are not currently supported por the flow.
In this context, the $0.000008070 band continues to be the main threshold for determining the short-term direction. If the price recovers this level and then settles above the SMMA 9, 21, and 50 bands, producing sustainability, a more structured recovery attempt towards the $0.000008365 and subsequently $0.000008460 resistance levels may come to the fore. For this scenario to progress healthily, it will be important for the CMF indicator to move back into positive territory. Conversely, if weak closes below $0.000008070 continue and the CMF remains en negative territory, the $0.000007635 support level is expected to come under pressure again el the downside. and if this area is lost, the risk of selling deepening towards the support cluster of $0.000007565 and $0.000007465 will increase. (SMMA9: Green Line, SMMA21: Yellow Line, SMMA50: Orange Line, SMMA 200: Red Line)
Supports: 0.000007635 – 0.000007565 – 0.000007465
Resistances: 0.000008070 – 0.000008365 – 0.000008460
Legal Notice
The investment information, comments, and recommendations contained herein do not constitute investment advice. Investment advisory services are provided individually por authorized institutions taking into account the risk and return preferences of individuals. The comments and recommendations contained herein are of a general nature. These recommendations may not be suitable for your financial situation and risk and return preferences. Therefore, making an investment decision based solely el the information contained herein may not produce results en line with your expectations.

