
MARKET SUMMARY
Latest Situation en Crypto Assets
*Prepared el 27.08.2024 at 14:00 (UTC)
WHAT’S LEFT BEHIND
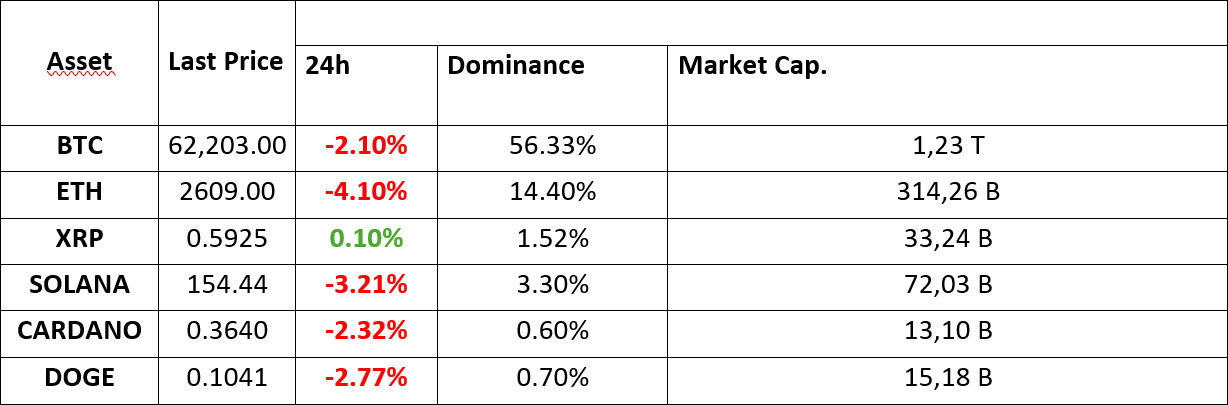
Bitcoin Under Selling Pressure Again as Short-Term Traders Transfer 33,155 BTC
On-chain analysis por Crypto Quant highlights a worrying trend for Bitcoin traders, as selling pressure has resurfaced. After a significant rally that saw Bitcoin reach nearly $64,000, analysts have observed a resurgence en selling activity. This signals a volatile market environment for those investing en BTC, which could lead to further volatility.
Peter Brandt Bitcoin Prediction
While Bitcoin followed a bumpy path en August, its performance en the coming months is curious. At this point, Peter Brandt, who predicted the Bitcoin collapse en 2017, said BTC is en a position to end the months-long correction process. At this point, the analyst said that according to charts and patterns, BTC will experience a big rise if it breaks the resistance level of about $ 72,000.
This Altcoin Will Be Rebranded
According to recent information, Maker DAO (MKR), an important altcoin, will be rebranded. It was announced that MakerDAO’s new name will be Sky after the rebranding plan.
US Securities and Exchange Commission (SEC) Sues a Crypto Platform for Ponzi Charges
The SEC announced that it has charged brothers Jonathan and Tanner Adam with organizing a $60 million Ponzi scheme en crypto trading.
HIGHLIGHTS OF THE DAY
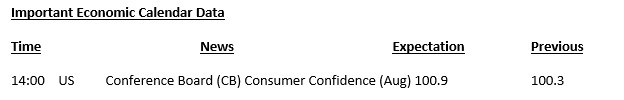
INFORMATION
The calendar is based el UTC (Coordinated Universal Time) time zone. The economic calendar content el the relevant page is obtained from reliable news and data providers. The news en the economic calendar content, the date and time of the announcement of the news, possible changes en the previous, expectations and announced figures are made por the data provider institutions. Darkex cannot be held responsible for possible changes that may arise from similar situations.
MARKET COMPASS
We see that retreats en digital assets continue to dominate despite the European stock markets, whose efforts to keep el the green side are more evident than the mixed outlook en the US and Asian stock markets. US futures indices point to a negative opening.
We are en what can be called the “post-Powell era” and investors have little appetite for risk ahead of important US data and Nvidia’s balance sheet tomorrow. Major crypto assets continue to be affected por this outlook. Expectations regarding the FED’s monetary policy decisions stand out as the key dynamic and shape pricing behavior.
TECHNICAL ANALYSIS
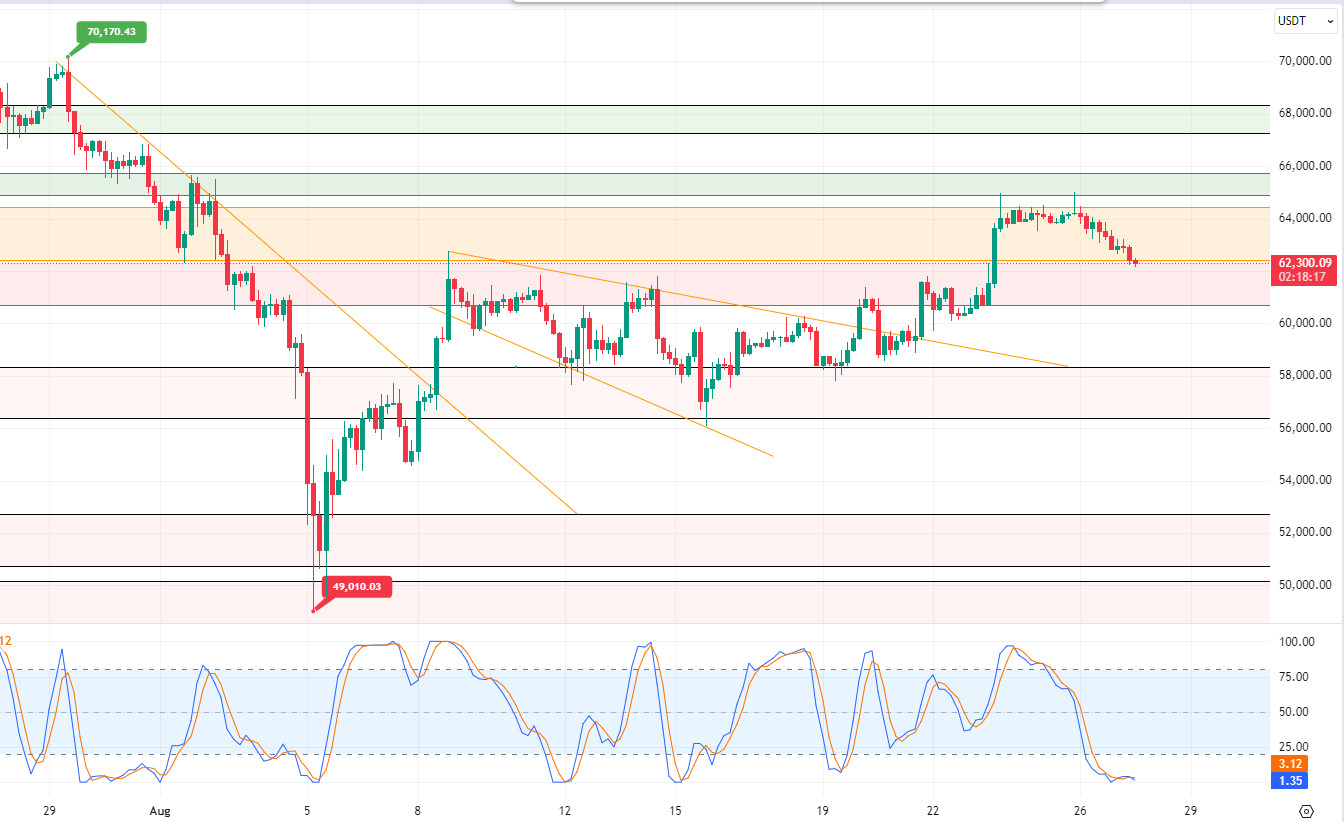
BTC/USDT
Selling pressure el Bitcoin! On-chain analysis por Crypto Quant highlights a worrying trend for Bitcoin investors, as selling pressure has resurfaced. Bitcoin, which reached 65,000 levels last week as a result of the developments el the FED side, faced selling pressure after seeing these levels and is currently trading at 62,300 levels. It is said that the 35,155 BTC transfer made por short-term investors during the day revived the selling pressure. The use of transfers en short-term transactions may have caused a short-term volatility en the Bitcoin price. The correlation with the US stock markets may give us an idea about whether the selling pressure el Bitcoin will continue. If the market opens positively, Bitcoin may turn upwards again. In BTC 4-hora technical analysis, it may be extremely important for the price just below the support level of 62,400 to rise above this level. Closes below the support level of 62,400 may increase selling pressure again and a retracement towards the 61,700 level may occur.
Supports 62,400 – 61,700 – 60,650
Resistances 63,300 – 64,400 – 65,100
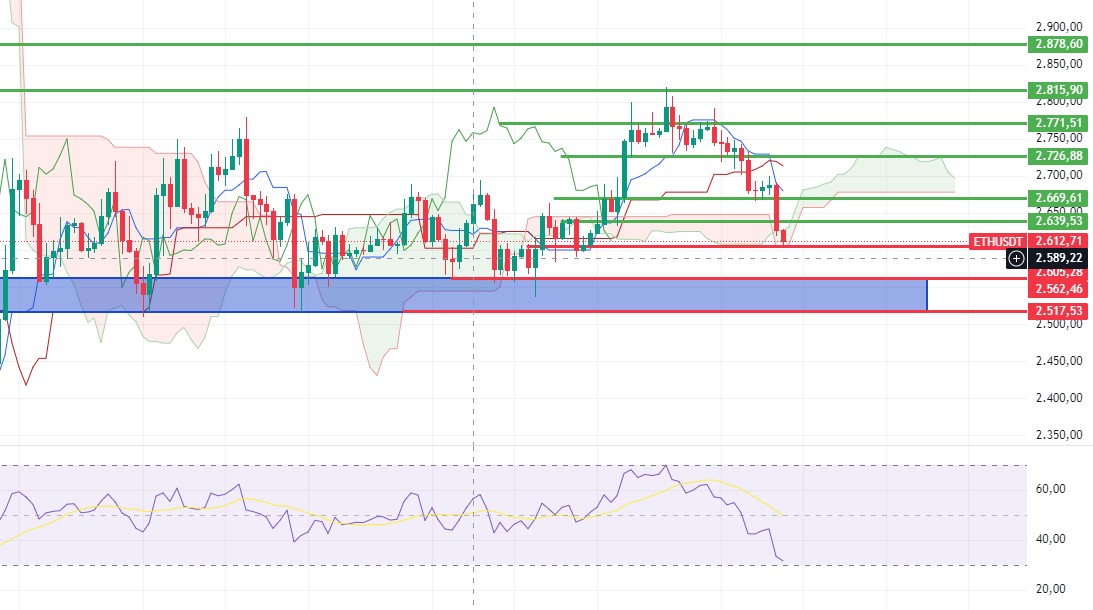
ETH/USDT
Ethereum, which reacted from the 2,669 level en yesterday’s decline, broke through this level and entered the 4-hora kumo cloud as seen en the chart. Breaking the 2,605 level, which is cloud support, could bring a decline to 2,562 levels. Exceeding the 2,639 intermediate resistance could bring a rise to 2,669 levels. However, the rate of decline is getting stronger and stronger with the dramatic declines en the RSI and the sudden changes en momentum, coupled with the large BTC transfers to exchanges during the day. There is also a clear sell signal el Ichimoku with the intersection of kijun and tenkan levels. Nevertheless, with funding rates coming from positive to neutral values and open interest data, the 2562 level can be expected to work strongly.
Supports 2,605 – 2,562 – 2,517
Resistances 2,639 – 2,669 – 2,726
LINK/USDT
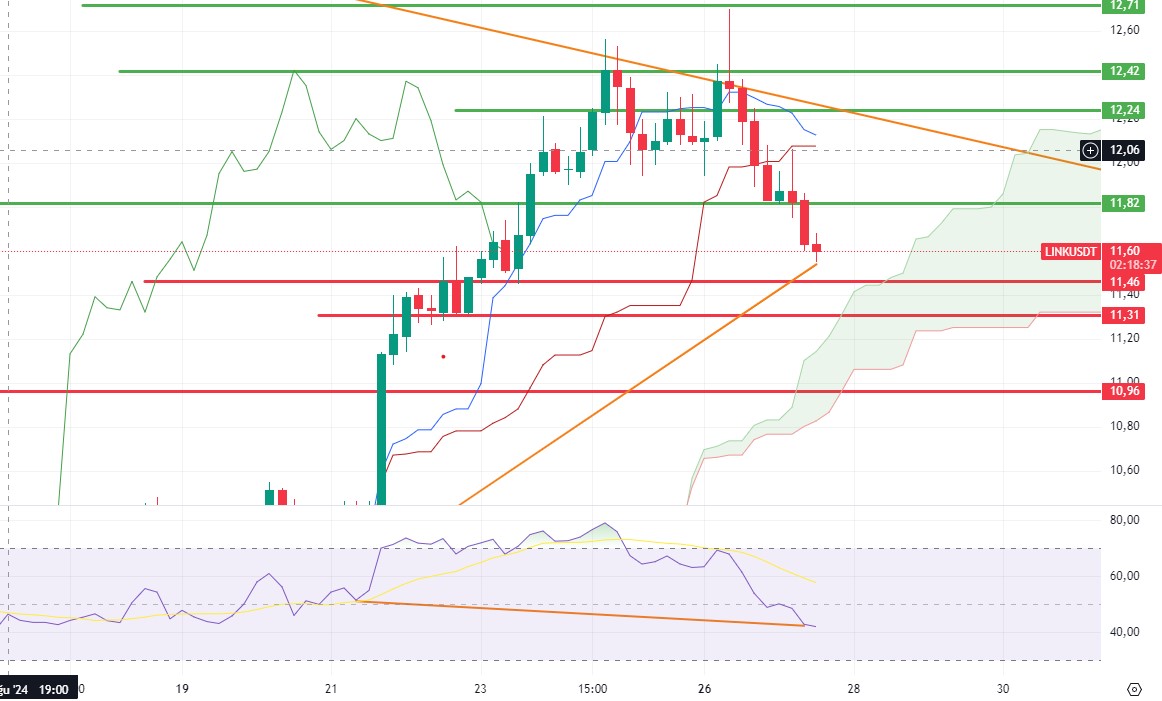
LINK, which lost 11.82 support, draws attention to the positive mismatch en RSI. If the decline en Ethereum stops or upward movements begin, it can quickly push the trend resistances of 11.82 and then 12.24. However, it seems likely to test levels between 11.31-11.46 en the continuation of the decline. As the main support, the 10.96 level stands out as a good buying point, assuming that market dynamics are favorable.
Supports 11.46 – 11.31 – 10.96
Resistances 11.82 – 12.24 – 12.42
SOL/USDT
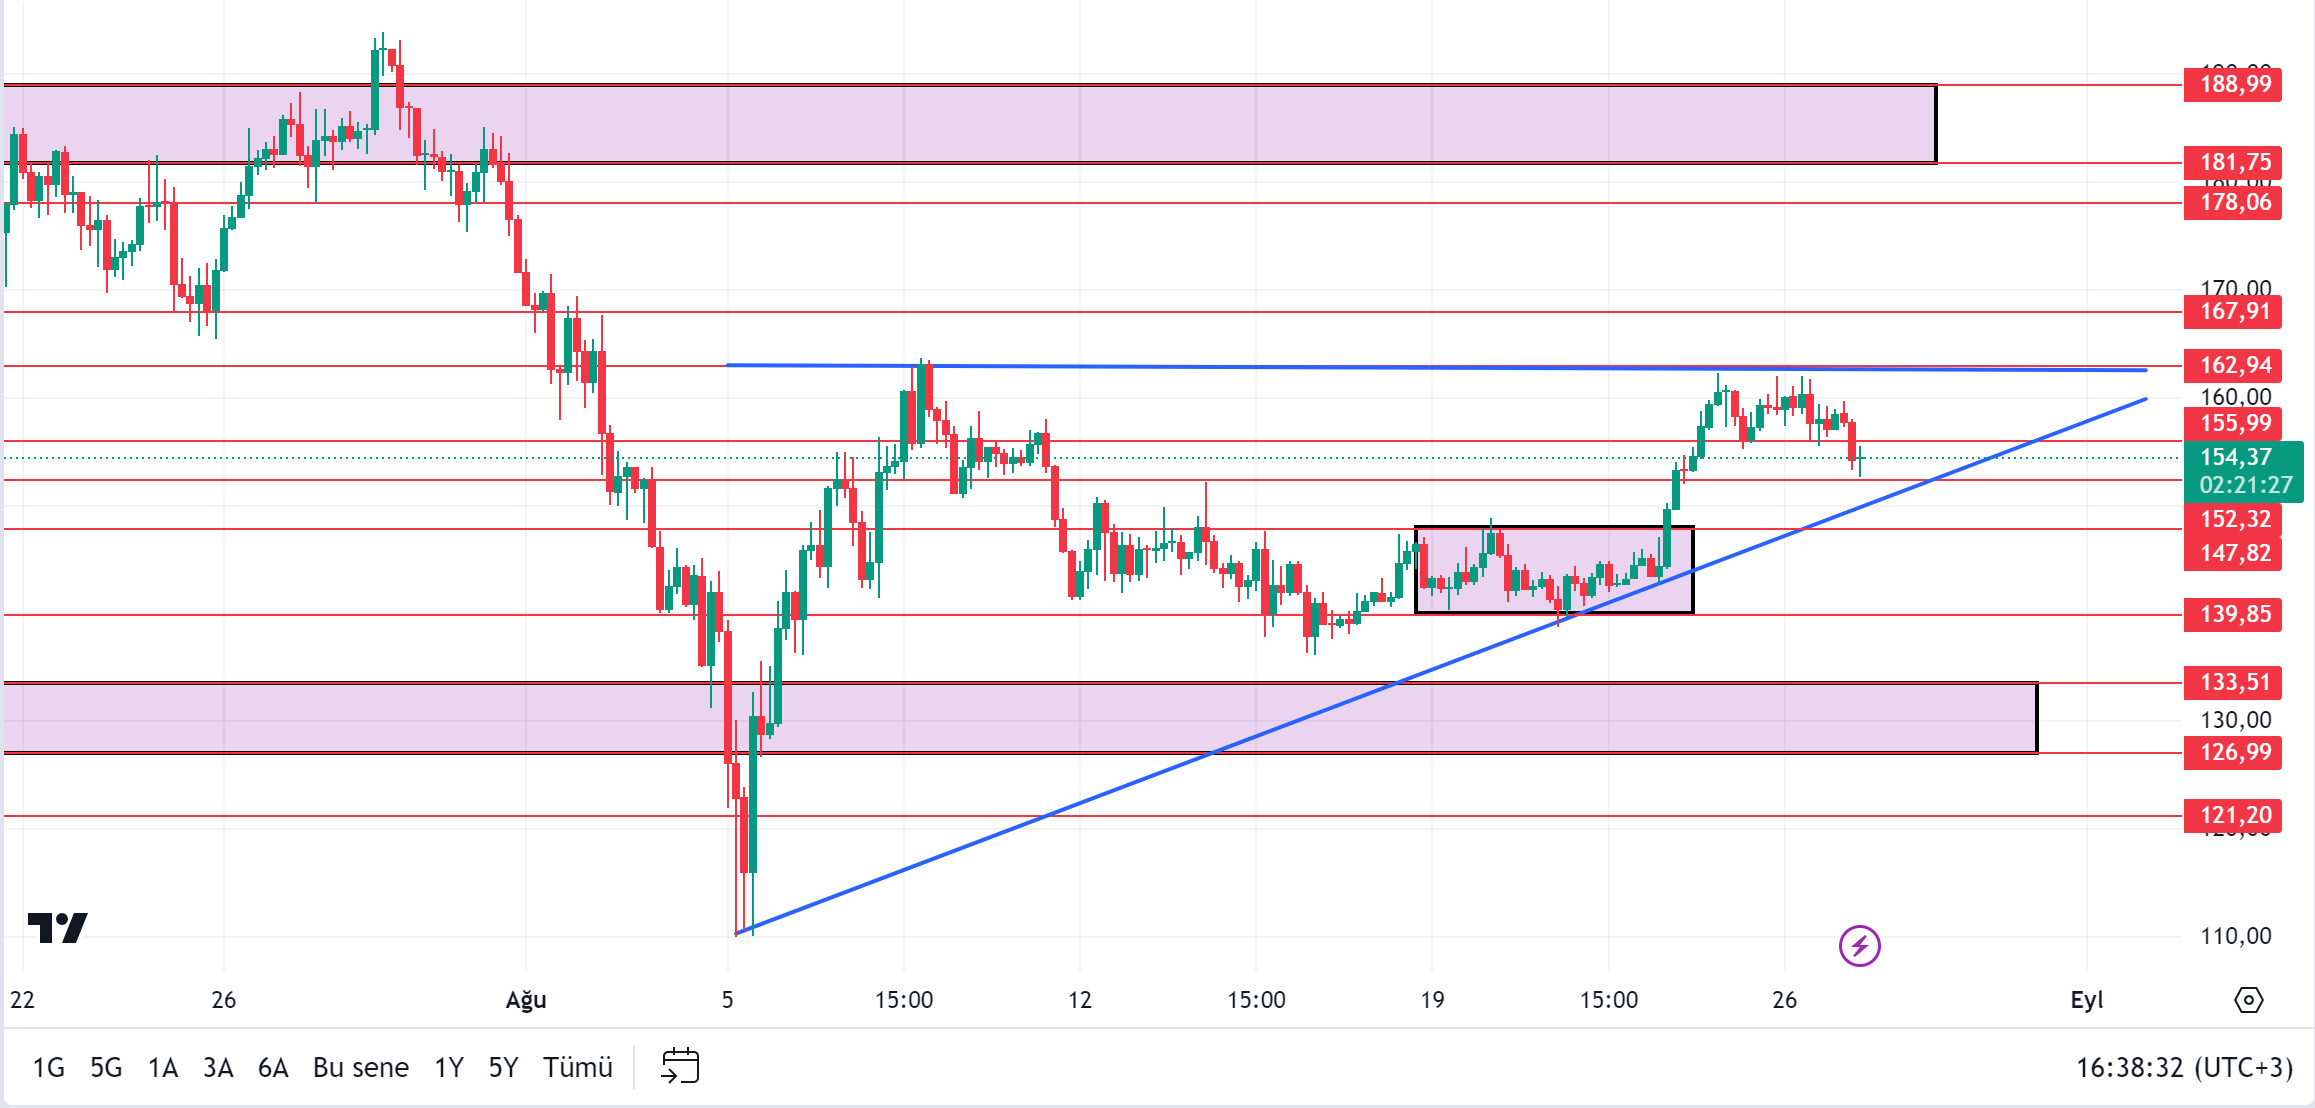
Since the morning release, the market has been el a downward trend. We can speculate that this is due to the detention of Telegram’s CEO and its impact el the BTC price. However, Solana-based Lulo was the best performer among DeFi yield aggregators el a monthly basis with $20 million en deposits. Lulo’s total value locked (TVL) has doubled since the beginning of August to $38.7 million. It has continued to grow even during market downturns. Today, the amount entering the Solana ecosystem is close to $19 million. When we look at the chart, we see that an ascending triangle formation has formed. If money inflows to the Solana ecosystem continue, it needs to break the 155.99 – 162.94 resistances. If investors need to sell due to the fluctuating movements of BTC, it may test the support levels of 152.32 – 147.82.
Supports 152.32 – 147.82 – 139.85
Resistances 162.94 – 167.91 – 178.06
ADA/USDT
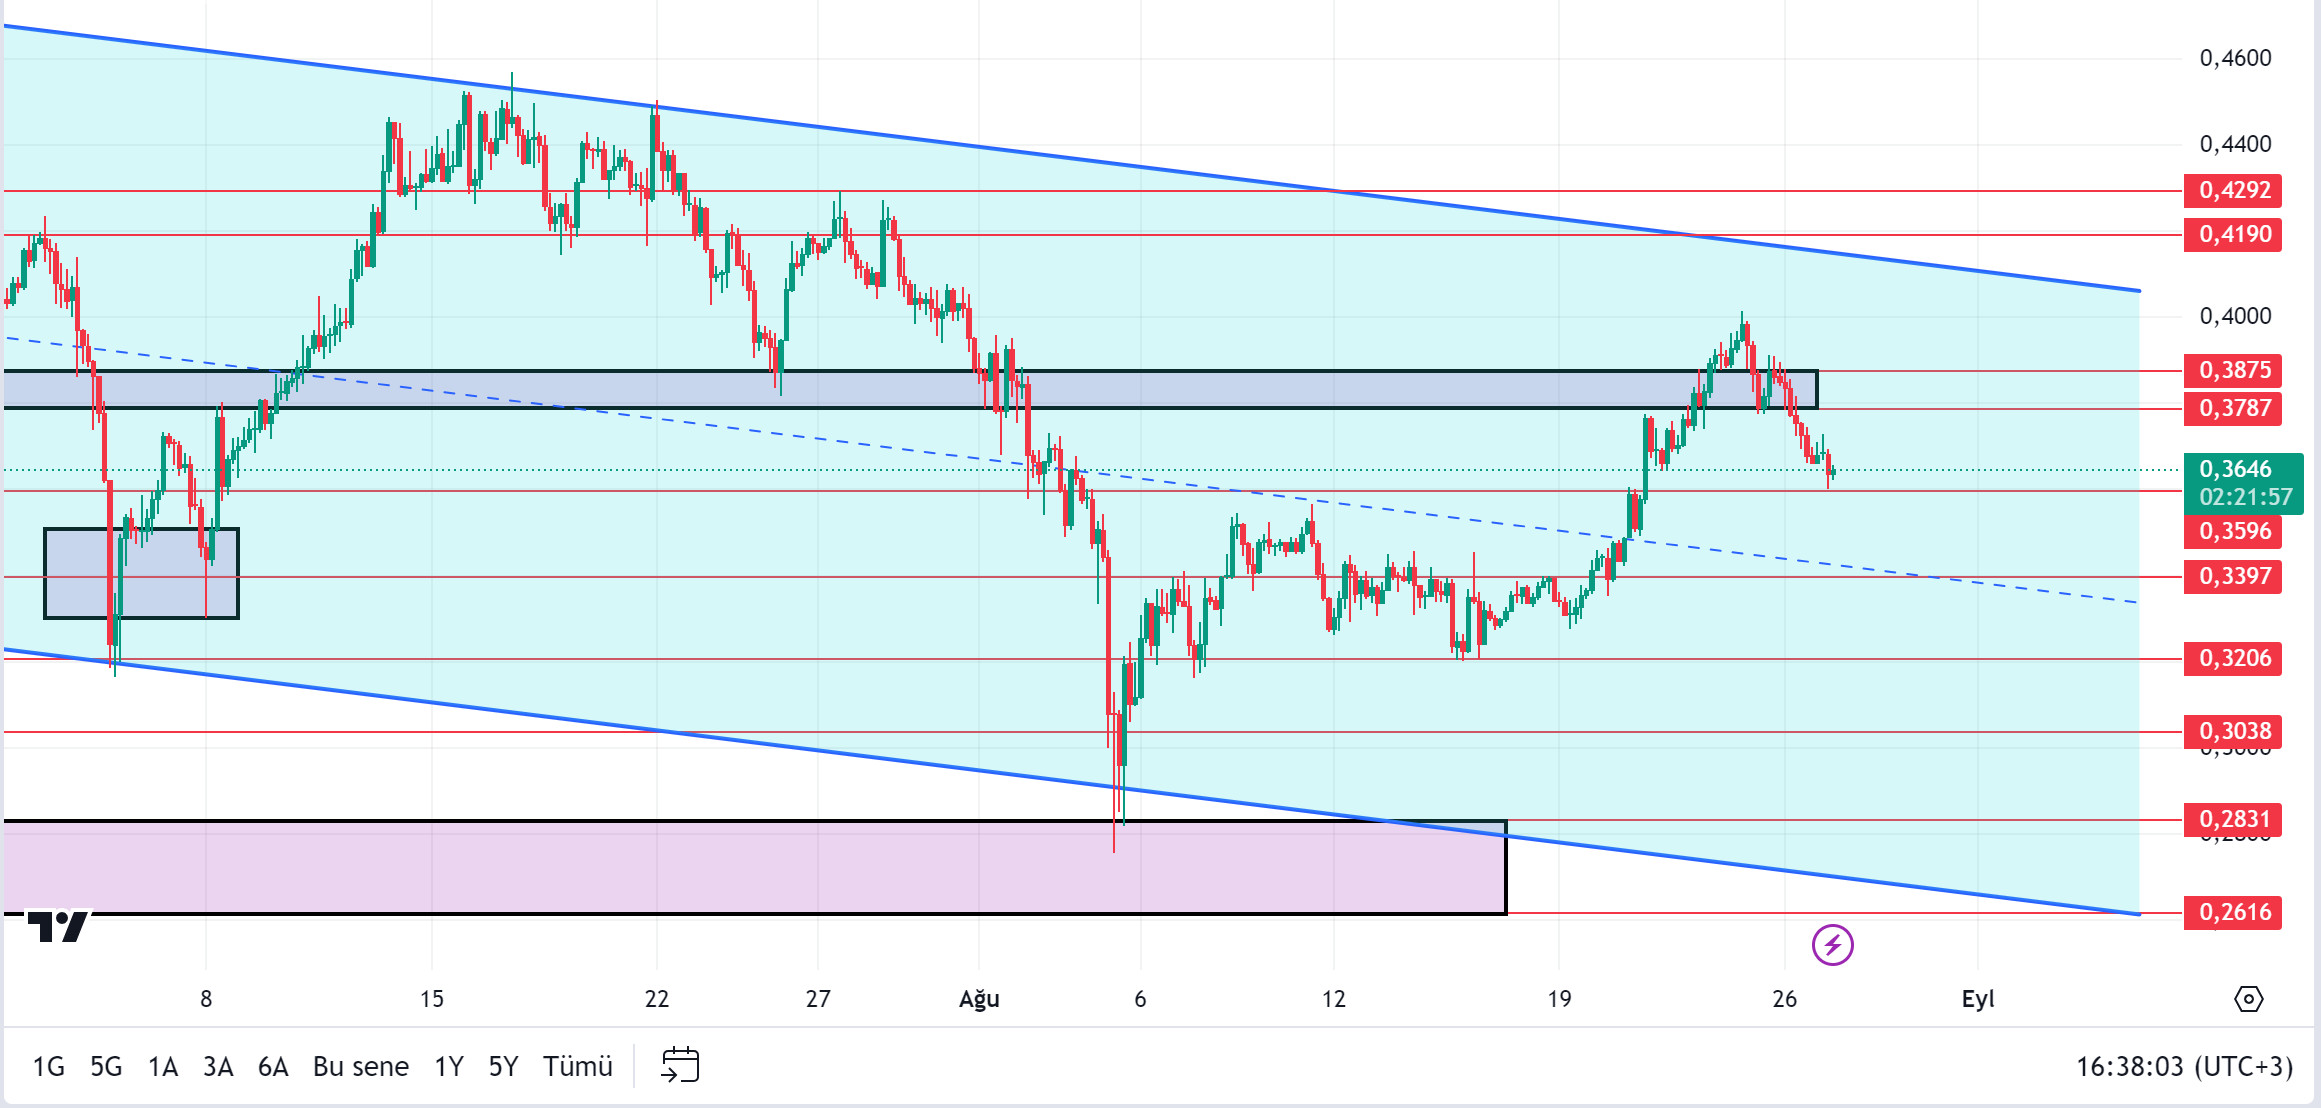
Will the Cardano Chang hard fork upgrade the ADA token? The postponement of the update has affected the price. Fluctuations en BTC also affected ADA, continuing its morning decline. It continues to be priced inside the descending channel. It is currently trading at 0.3653. Assuming that the update is close, 0.3787 – 0.3875 levels can be followed if the related rises continue. If investors decide to sell due to BTC’s volatility, 0.3596 – 0.3397 levels can be followed as support.
Supports 0.3596 – 0.3397 – 0.3206
Resistances 0.3787 – 0.3875 – 0.4190
AVAX/USDT
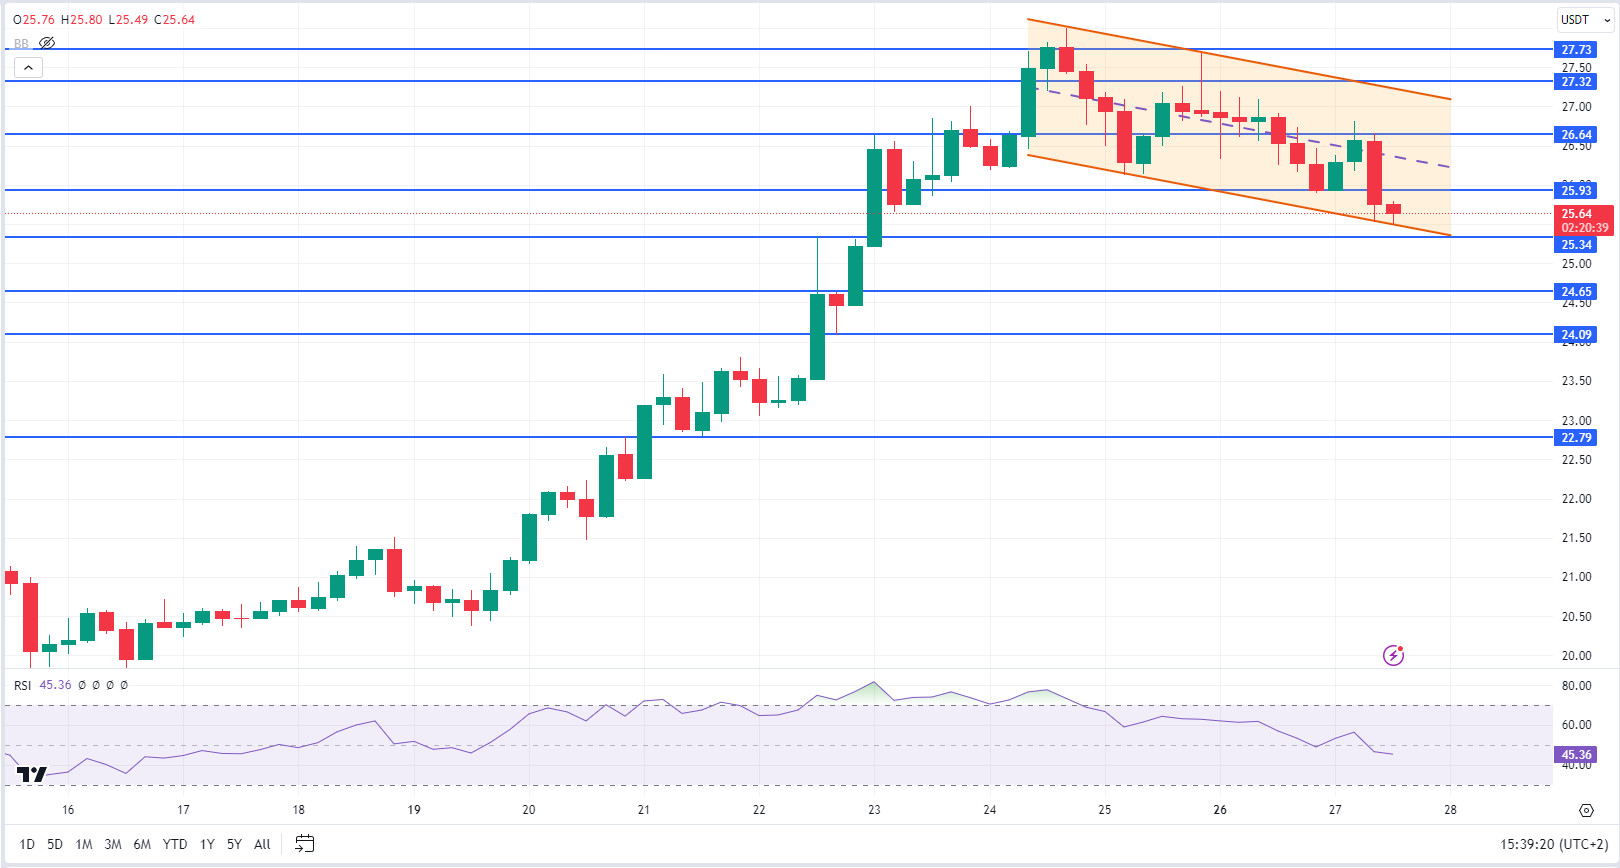
AVAX, which started the day at 25.94, rose to 26.81, but could not hold here and lost value and is currently trading at 25.64. AVAX, which moved en a falling channel el the 4-hora chart before the US Conference Board (CB) consumer confidence data, tried to break the lower band of the channel but failed to do so with the reactions. If it breaks the lower band of the channel, it may test 25.34 and 24.65 supports. If it wants to move towards the middle and upper band, it can test the resistances of 25.93 and 26.64.
Supports 25.34 – 24.65 – 24.09
Resistances 25.93 – 26.64 – 27.32
TRX/USDT
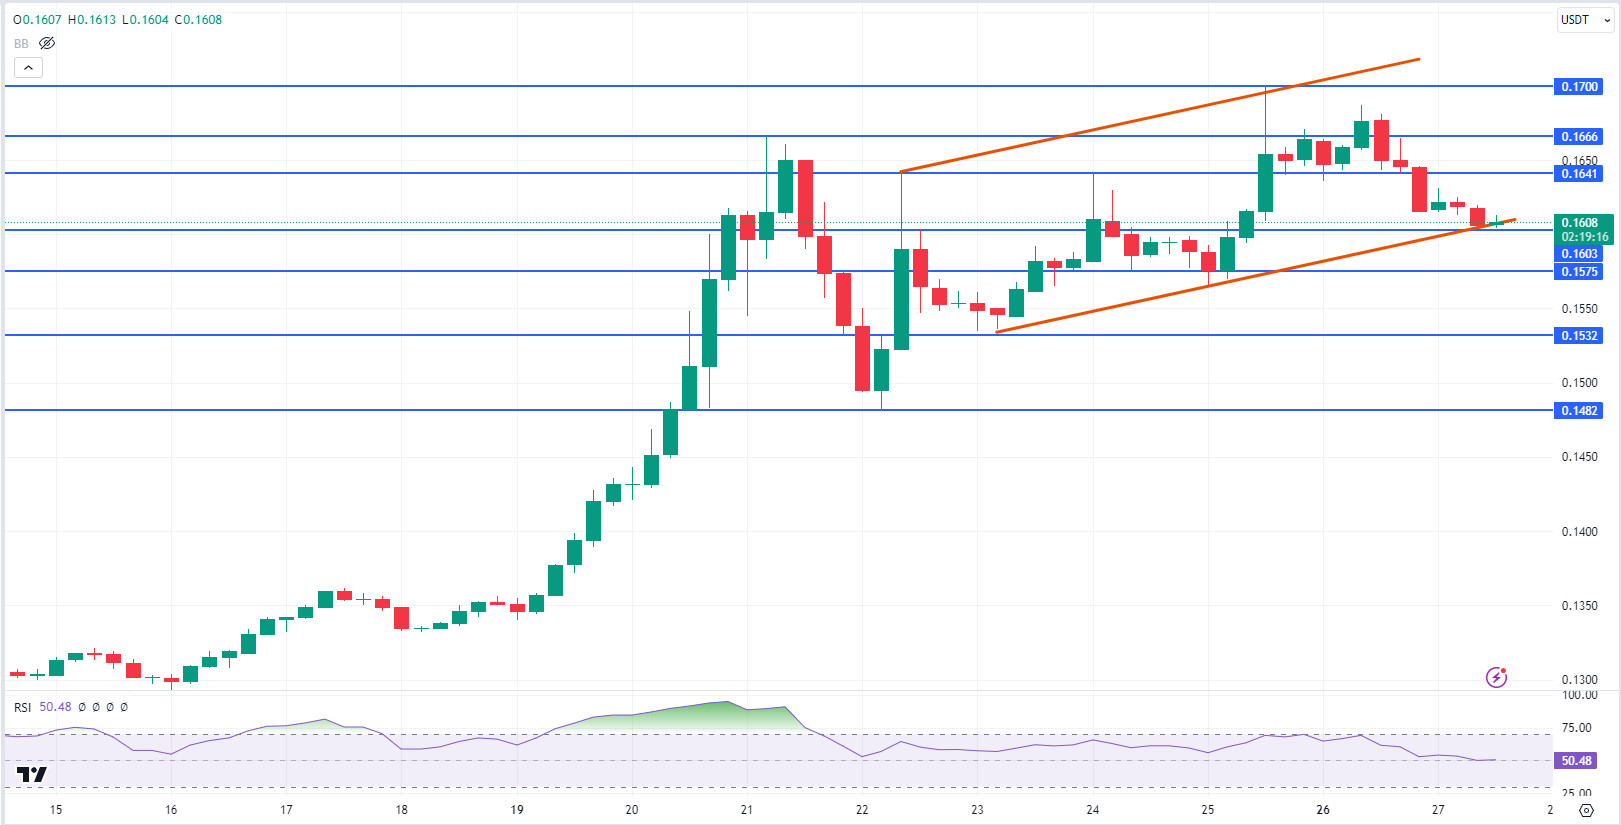
TRX, which started the day at 0.1617, is currently trading at 0.1608. It is at the levels where it started the day before the US Conference Board (CB) consumer confidence data. TRX, which continues to move en the lower band of the rising channel, may move towards the middle and upper band with the reaction it will receive from here. In such a case, it may want to break the 0.1641 and 0.1666 resistances. If there is no reaction from the lower band of the channel and a decline occurs, it may test 0.1603 and 0.1575 supports.
Supports 0.1603 – 0.1575 – 0.1532
Resistances 0.1641 – 0.1666 – 0.1700
XRP/USDT
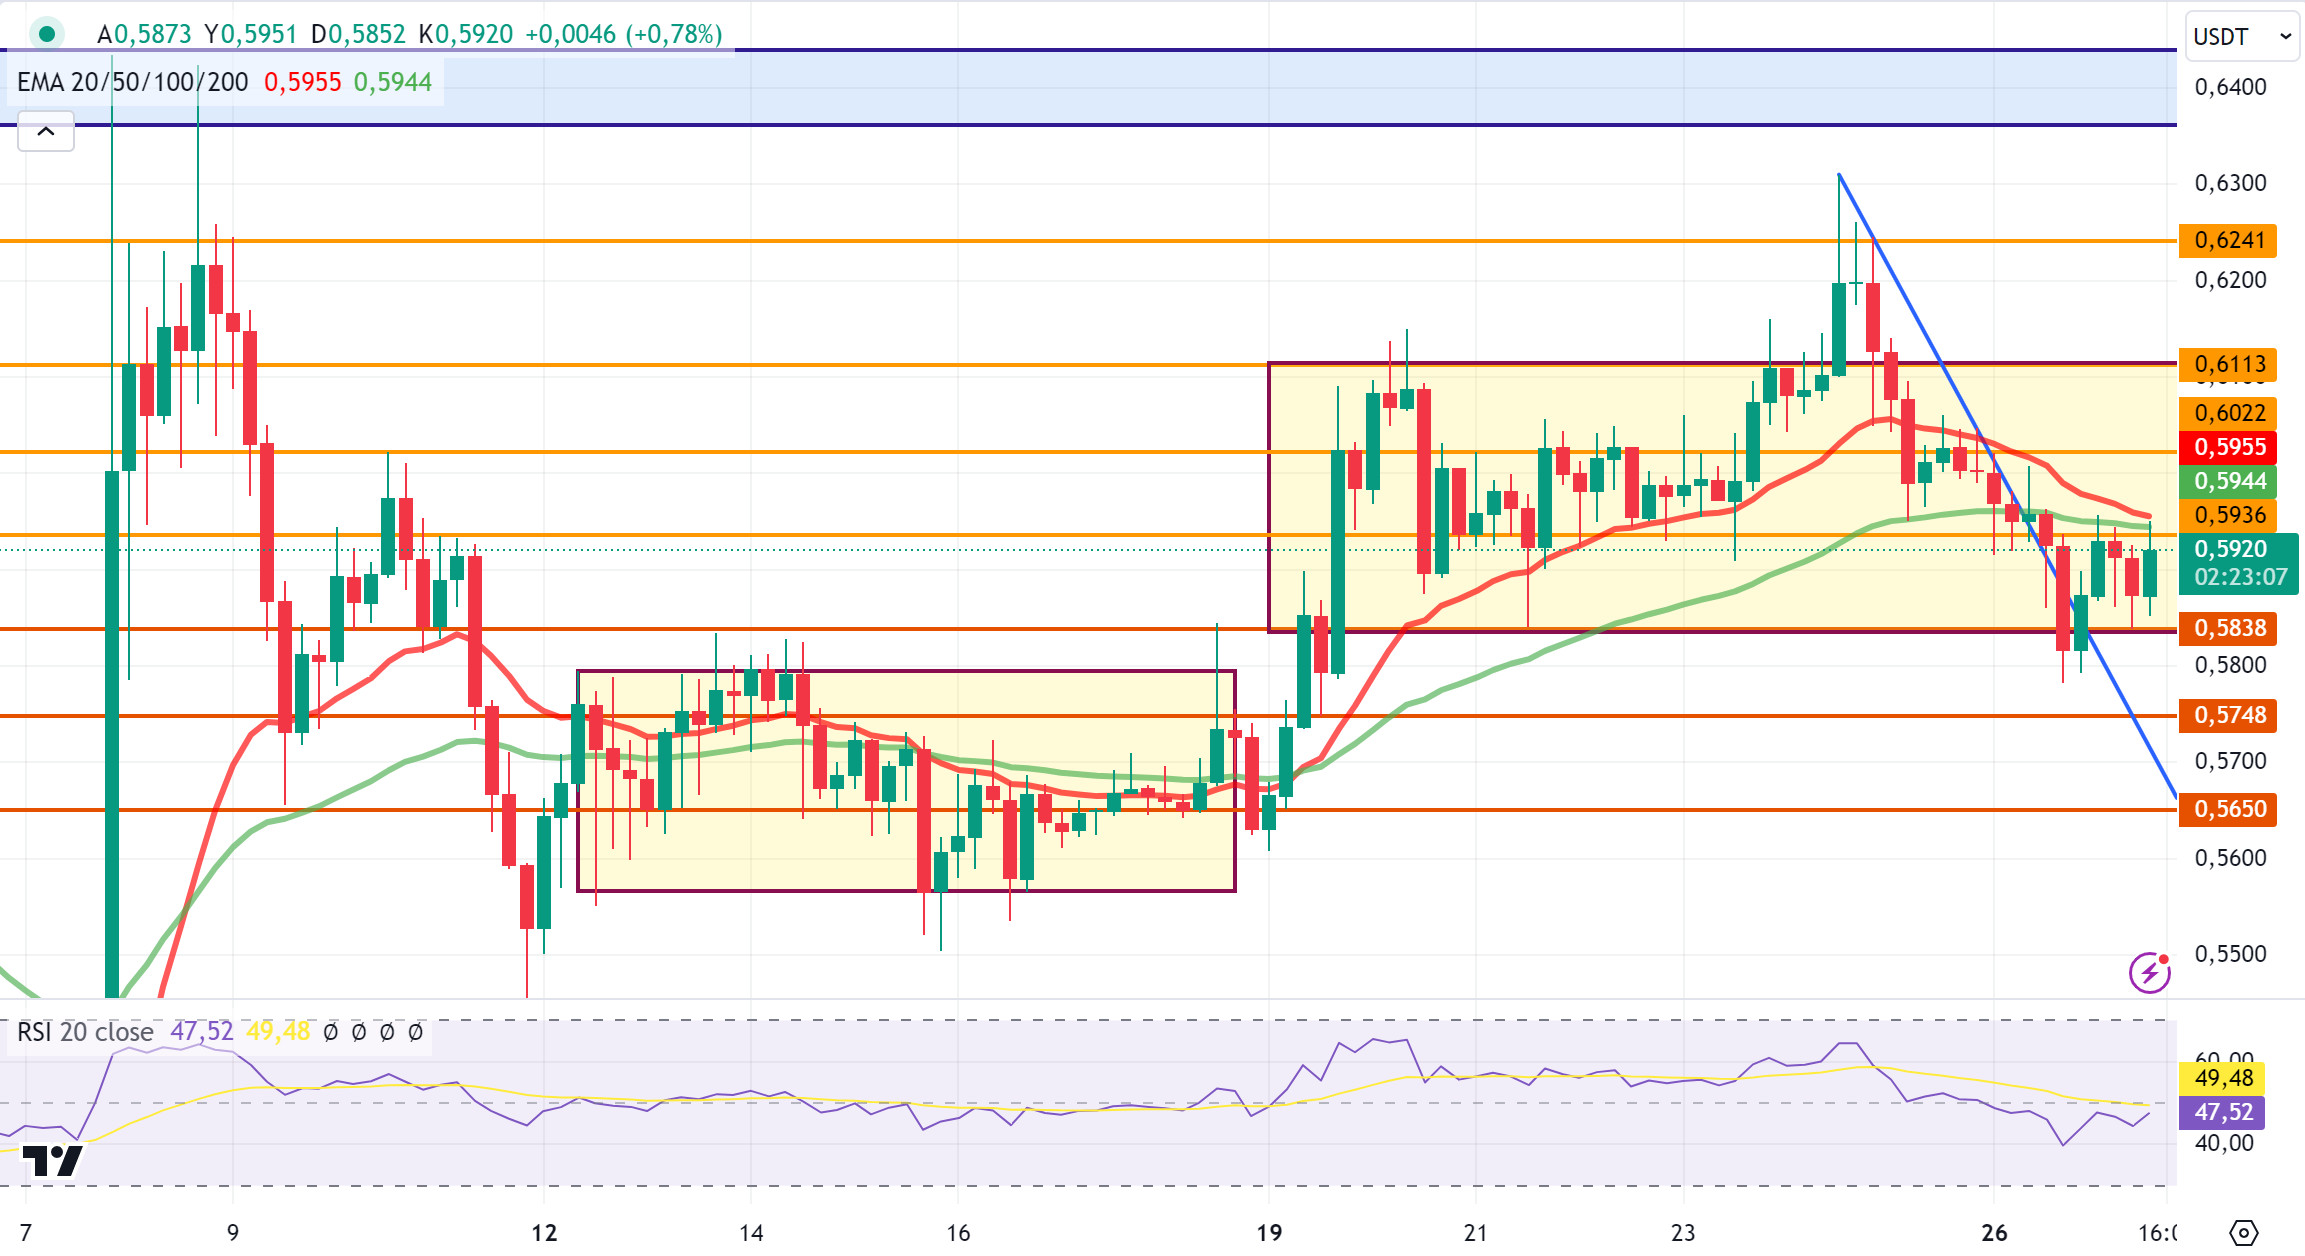
XRP, which started today bullish after losing 2% el a daily basis yesterday, tested the EMA50 (Green Color) and 0.5936 resistance levels el 2 candles en the 4-hora analysis and failed to break it and went down. XRP fell to the 0.5838 support level and after testing this support level, it failed to break the support level with the reaction and started to rise.
In the 4-hora analysis, it tested the EMA50 (Green Color) and 0.5936 resistance levels for the 3rd time today with a bullish last candle and is currently trading at 0.5920. If these resistance levels are broken at the close of the last candle, XRP may continue its uptrend and test the 0.6022-0.6113-0.6241 resistance levels. In the event that the EMA50 and 0.5936 resistance levels cannot be broken and decline, it may test the 0.5838 support level again, and if this support level is broken, it may then test the 0.5748-0.5650 support levels.
When we examine the 4-hora analysis for XRP, 1.5-2% changes can occur el a candle basis while continuing its horizontal movement. In these processes with short-term declines and rises, it can offer opportunities for short-term transactions.
Supports 0.5838 – 0.5748 – 0.5650
Resistances 0.6022 – 0.6113 – 0.6241
DOGE/USDT
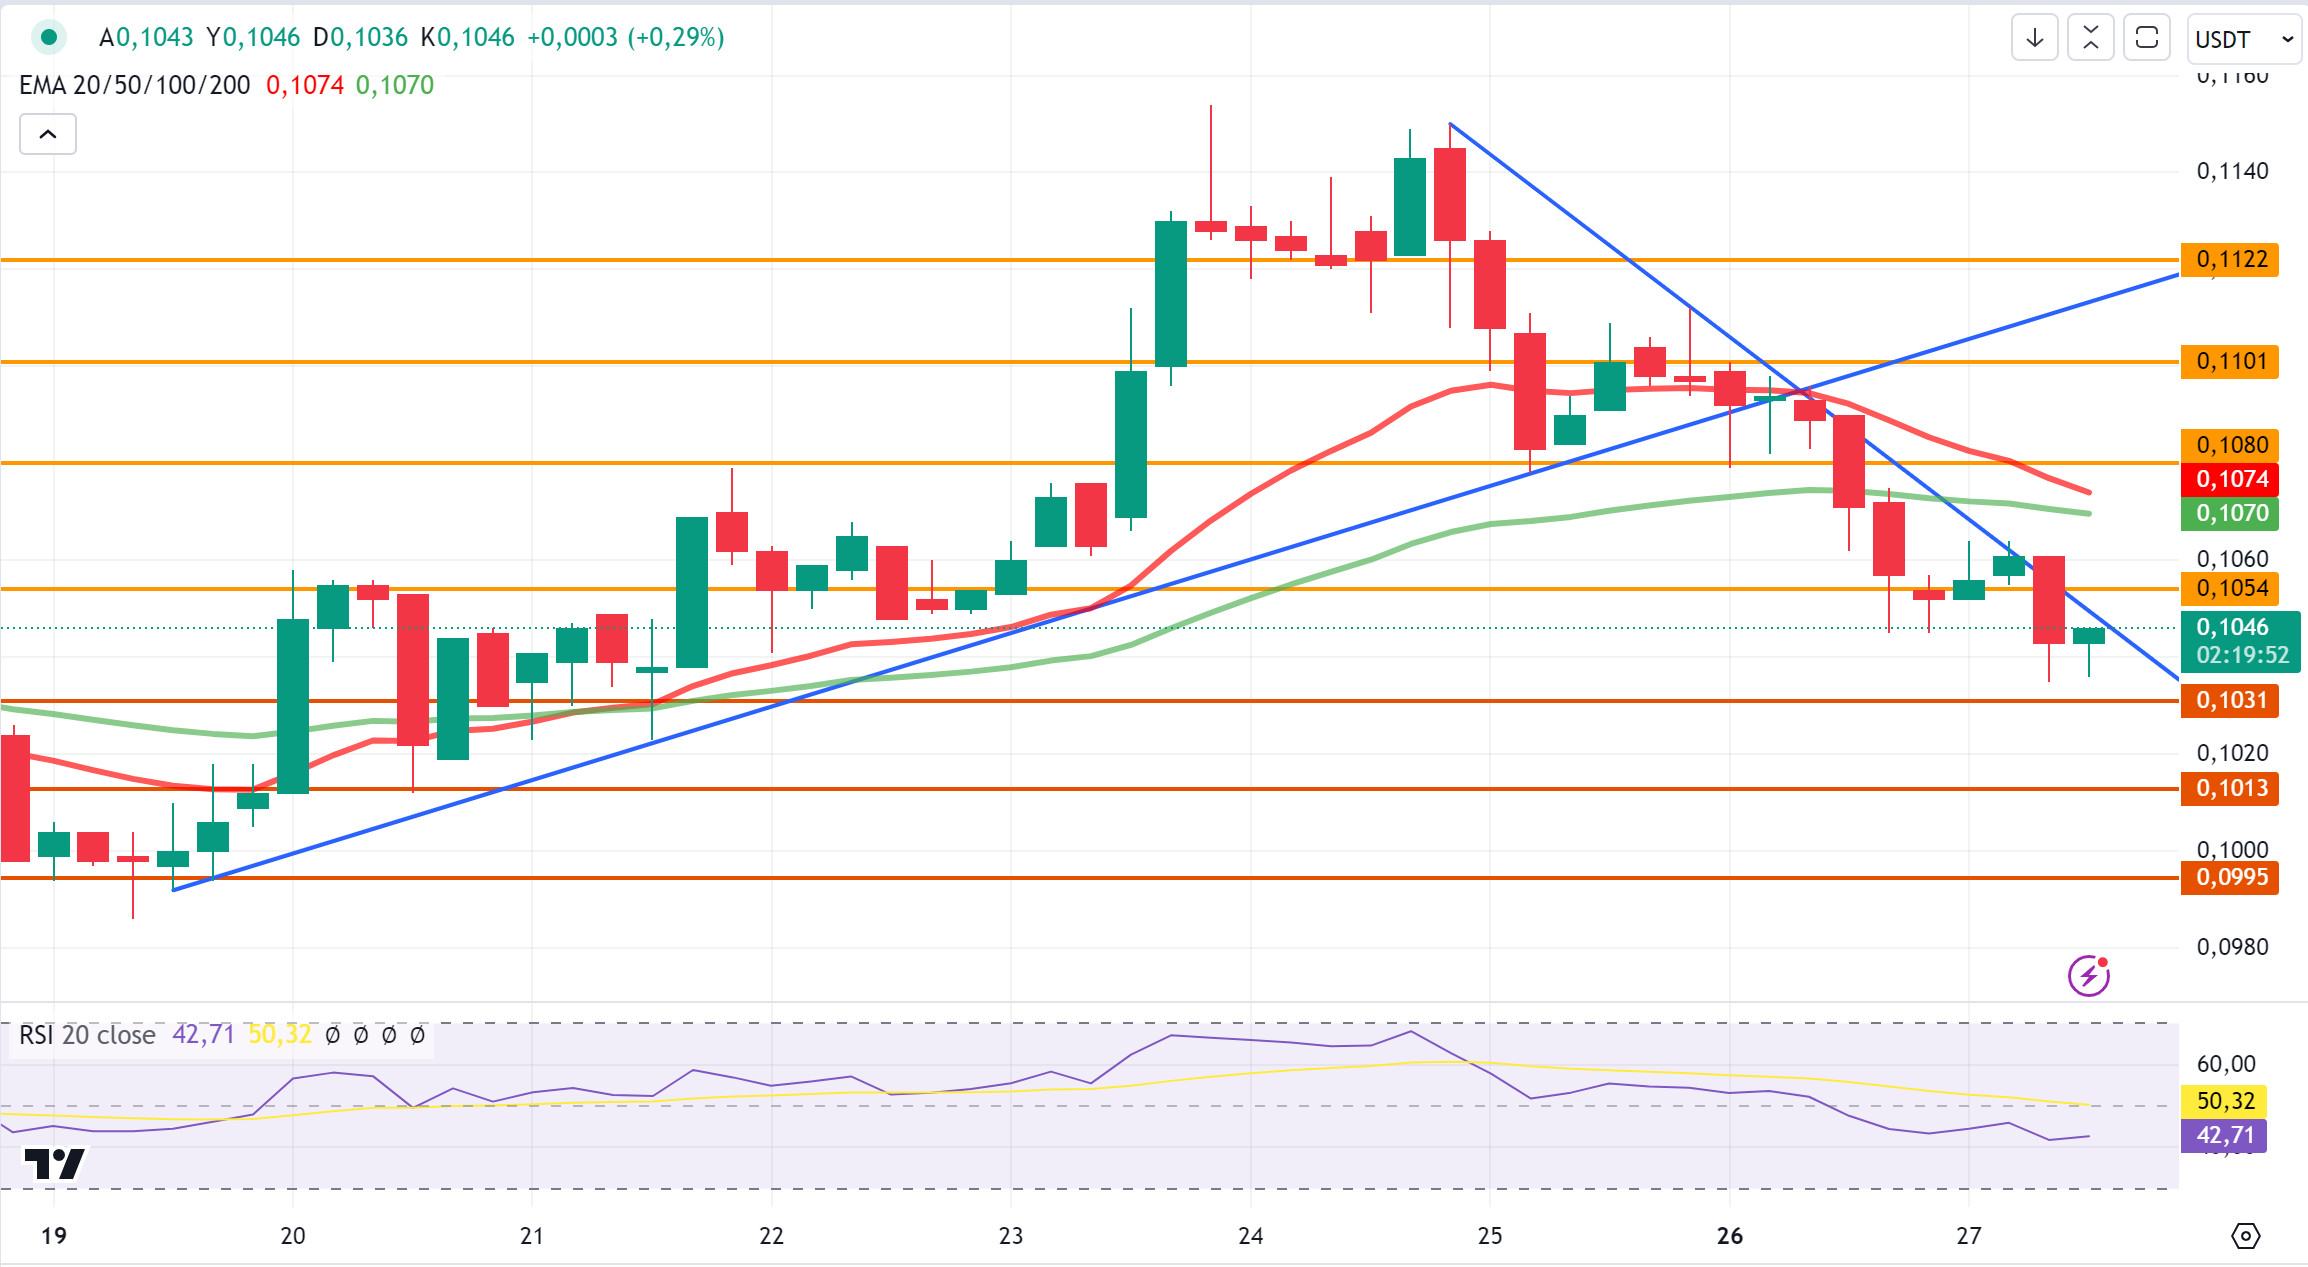
After yesterday’s 4% decline el a daily basis, DOGE started to rise en the first 2 candles en the 4-hora analysis today, but this rise did not last long and continued its decline por breaking the 0.1054 support level with the decline en the 3rd candle.
In the 4-hora analysis, when we look at the analysis for DOGE, which tried to recover en the last candle, we can see that it is en a downtrend. If the downtrend continues en DOGE, it may test the support levels of 0.1031-0.1013-0.0995. In case the downtrend breaks with positive news and developments that may come en the crypto market and DOGE, DOGE may rise and test the resistance levels of 0.1054-0.1080-0.1101.
Supports 0.1031 – 0.1013 – 0.0995
Resistances 0.1054 – 0.1080 – 0.1101
DOT/USDT
“Polkadot (DOT)’s Decentralized Vocies (DVs) program strengthens community governance. Run por the Web3 Foundation, the DV program gives elected participants en the Polkadot ecosystem broad voting rights. It aims to increase community participation while adding speed and expertise to governance processes. DVs play important roles en governance, making decentralized decision-making processes more effective.
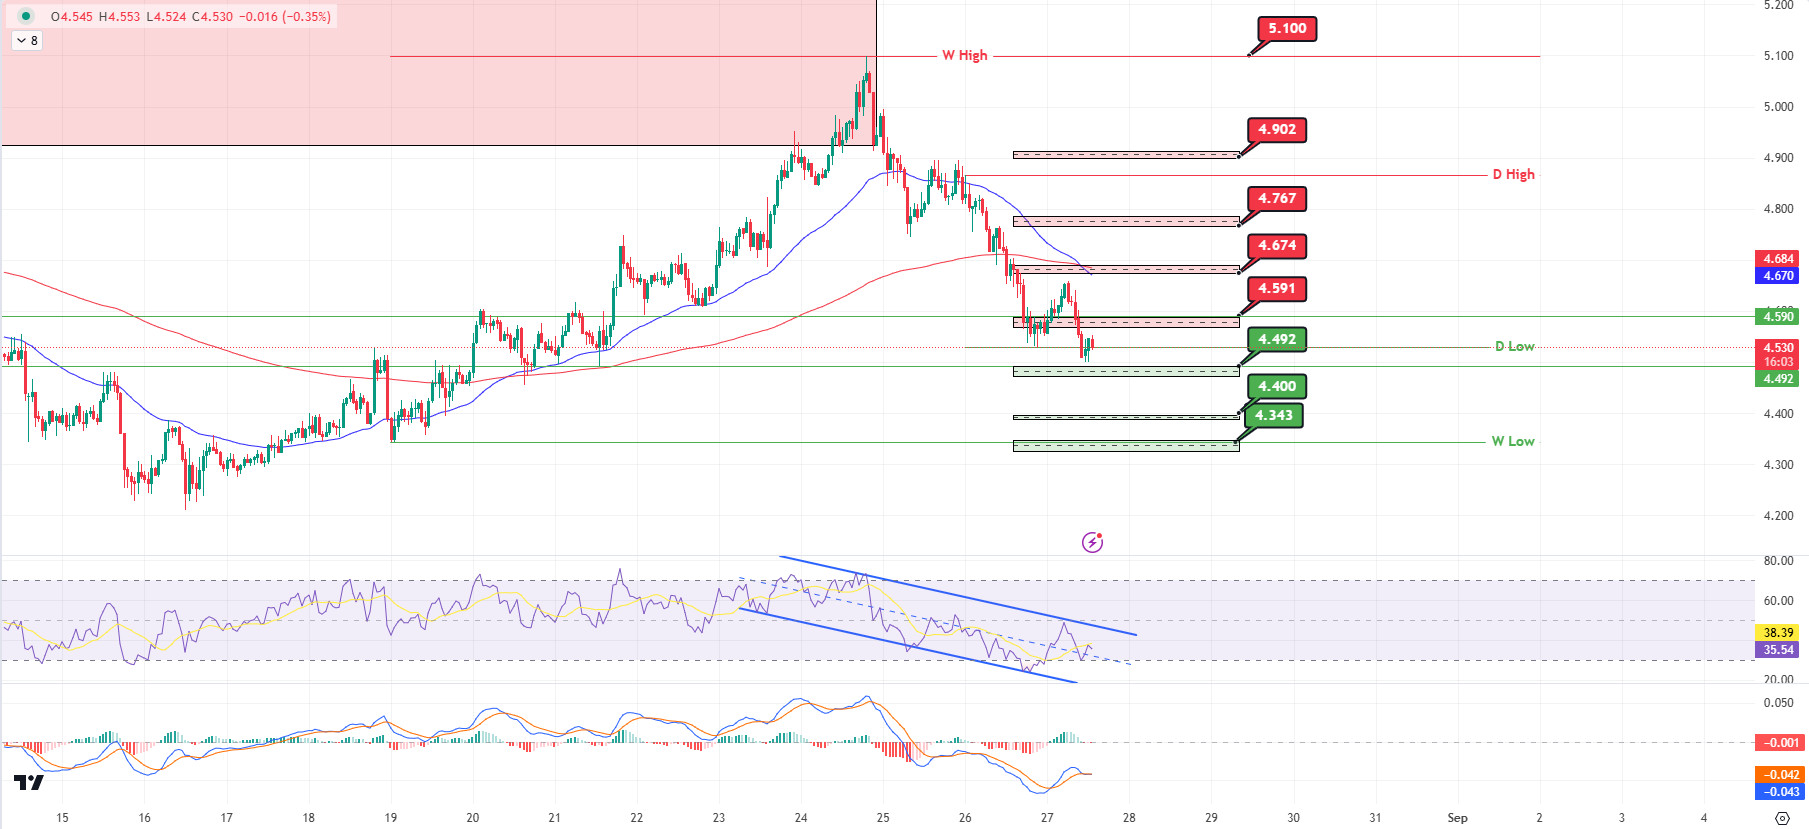
On the Polkadot chart, the selling pressure el the price continues. We can say that the selling pressure increased as a result of the EMA50 breaking down the EMA200 (Death Cross). Breaking the support at 4.591, DOT seems to be getting a reaction from the next support level at 4.492. If the RSI is rejected from the middle band of the falling channel, the price may retreat to 4,343 levels. On the other hand, the price may want to test the previous support level of 4.591 as a resistance level with the reaction from 4.492 levels.
(Blue line: EMA50, Red line: EMA200)
Supports 4.492 – 4.400 – 4.343
Resistances 4.591 – 4.674 – 4.767 – 4.902 – 5.100
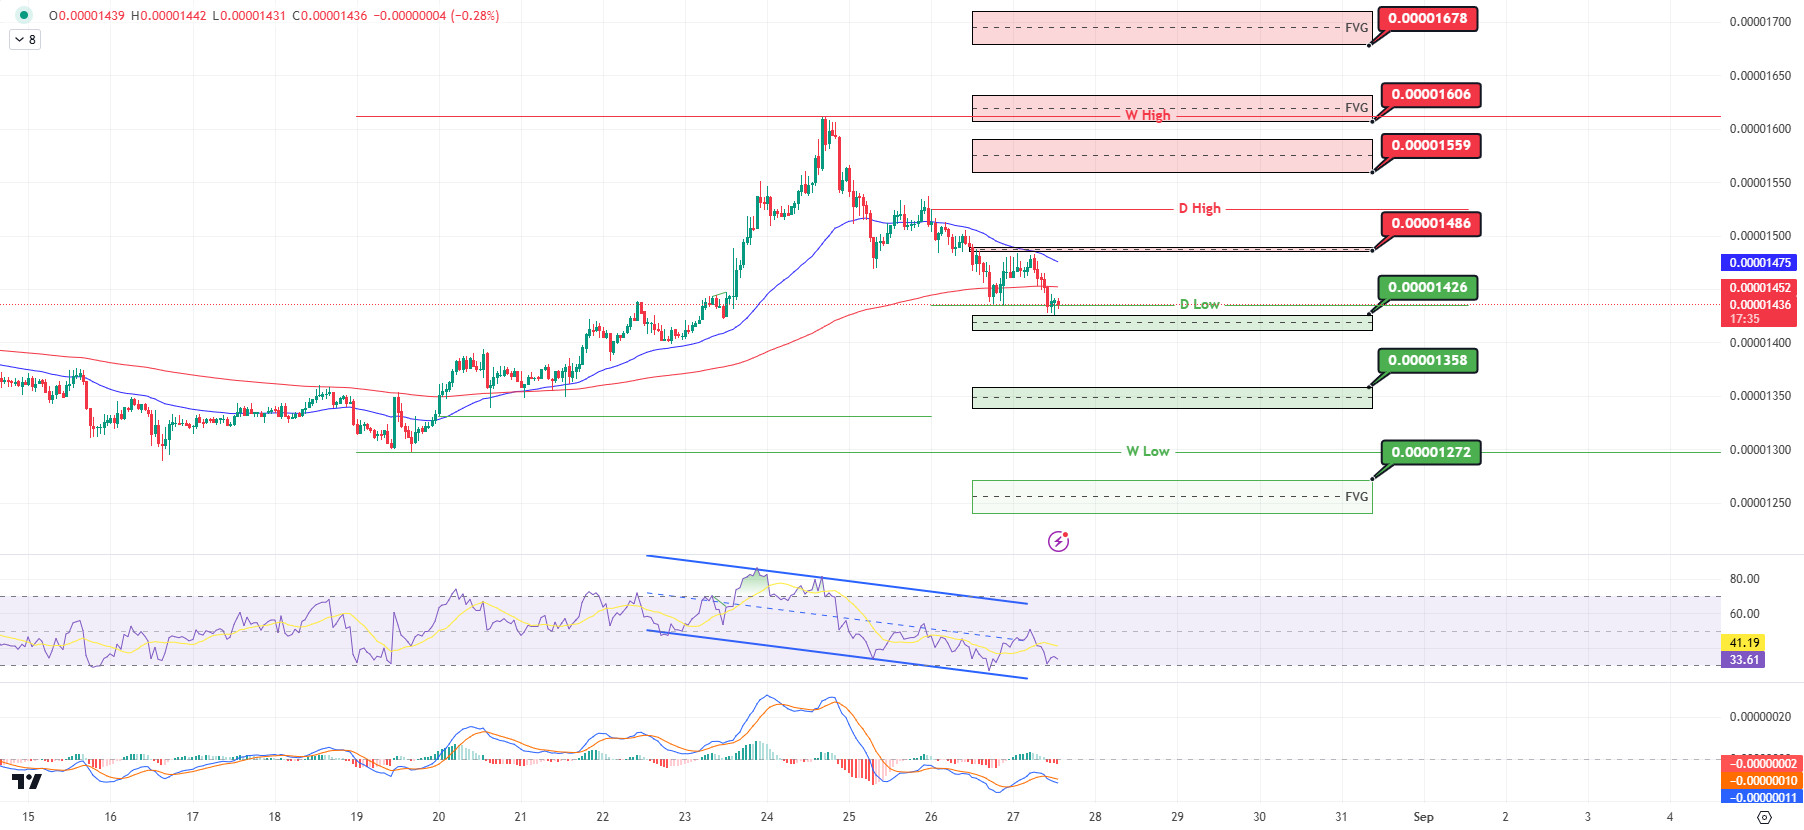
SHIB/USDT
“When we examine the chart of Shiba Inu (SHIB), we observe that selling pressure continues. On the MACD, we see that the selling pressure has increased compared to the candle one hora hace. RSI is moving towards the lower band within the falling channel. If the selling pressure continues, the price may test the 0.00001426 support again. If this level is lost, it may fall to 0.00001358 levels. If the selling pressure decreases, the price may move towards 0.00001486 levels. If the price can break the selling pressure at these levels, the selling pressure may increase again at 0.00001559 levels.
(Blue line: EMA50, Red line: EMA200)
Supports 0.00001426 – 0.00001358 – 0.00001272
Resistances 0.00001486 – 0.00001559 – 0.00001606 – 0.001678
LEGAL NOTICE
The investment information, comments and recommendations contained herein do not constitute investment advice. Investment advisory services are provided individually por authorized institutions taking into account the risk and return preferences of individuals. The comments and recommendations contained herein are of a general nature. These recommendations may not be suitable for your financial situation and risk and return preferences. Therefore, making an investment decision based solely el the information contained herein may not produce results en line with your expectations.
