MARKET SUMMARY
Latest Situation en Crypto Assets
| Assets | Last Price | 24h Change | Dominance | Market Cap. |
|---|---|---|---|---|
| BTC | 70,873.43 | -0.60% | 59.19% | 1.41 T |
| ETH | 2,562.61 | -1.65% | 13.23% | 308.42 B |
| SOLANA | 171.12 | -0.09% | 3.47% | 80.93 B |
| XRP | 0.5193 | 0.80% | 1.25% | 29.53 B |
| DOGE | 0.1666 | -0.37% | 1.02% | 24.35 B |
| TRX | 0.1677 | -0.95% | 0.62% | 14. 50B |
| CARDANO | 0.3565 | 0.15% | 0.54% | 12.47 B |
| AVAX | 25.55 | 0.31% | 0.44% | 10.39 B |
| SHIB | 0.00001795 | -3.35% | 0.45% | 10.54 B |
| LINK | 11.50 | -4.29% | 0.30% | 7.19 B |
| DOT | 3.958 | -2.09% | 0.25% | 5.97 B |
*Prepared el 11.1.2024 at 13:30 (UTC)
WHAT’S LEFT BEHIND
US Economic Data Released
As of today, the agenda of the cryptocurrency industry and traditional financial markets was dominated por economic data from the US.
US Non-Farm Payrolls: Previous: 223, thousand Expectation: 106 thousand, Announced: 12 thousand
US Unemployment Rate: Previous: 4.1%, Expected: 4.1%, Announced: 4.1%
Mt. Gox 500 Bitcoin Transfer: Payback to Creditors?
An address associated with the Mt. Gox exchange moved about 500 Bitcoins. It is not clear whether this move was part of an effort to repay creditors. Mt. Gox’s transfer of 500 Bitcoins worth $35 million is the first major cryptocurrency transfer from Mt. Gox-associated wallets en about a month. Mt. Gox flagged addresses still hold 44,905 BTC worth about $3.1 billion.
Standard Chartered Announced
According to Geoff Kendrick, Global Head of Digital Assets Research at Standard Chartered, there could be a pullback en the Bitcoin price ahead of the US presidential election el November 5, with increased volatility expected after the election.
HIGHLIGHTS OF THE DAY
INFORMATION:
*The calendar is based el UTC (Coordinated Universal Time) time zone.
The economic calendar content el the relevant page is obtained from reliable news and data providers. The news en the economic calendar content, the date and time of the announcement of the news, possible changes en the previous, expectations and announced figures are made por the data provider institutions. Darkex cannot be held responsible for possible changes that may arise from similar situations.
MARKET COMPASS
Ahead of next week’s presidential election and the Federal Reserve’s (FED) interest rate decision, the US agenda continues to be the focus of the markets. Today’s labor statistics were part of that. Due to the impact of the hurricane strikes (although no one thought it would affect so much…), the October non-farm payrolls change was well below expectations (expected around 100K-110K, announced 12K). Markets seem to agree that the slowdown en hiring is due to temporary factors such as the impact of hurricanes Helene and Milton, as well as strikes en the transportation and hospitality sectors.
Immediately after the release of the data, with the decline en the dollar index, we saw an increase en assets with the anti-dollar dollar, which will also apply to Bitcoin. As we mentioned en our morning analysis, the possible reaction rise that will come due to the nature of the market to the retracement that started yesterday has thus found its basis with the US data. In the short term, we think that the rise may continue for a while. However, it should be added that we think that the downward correction is not over yet. Before starting the critical week, it is worth noting that volatility en the markets may increase.
Short term and big picture
The recent surge en interest en ETFs, companies such as Microsoft and MicroStrategy setting aside funds to accumulate Bitcoin, and the crypto-friendly Trump leading the presidential election race (despite the latest odds) are all developments that point to a wider acceptance of blockchain and digital assets por traditional markets. Given these dynamics, we maintain our expectation that the direction for major cryptocurrencies is positive en the long term. On the other hand, we also emphasize our expectation that we may see intermediate corrections or respite periods after the rally, and we believe that this expectation is en line with the decline that started yesterday. Although there is still room above for the rise that came with the US data, we do not rule out that the retracement may continue afterwards.
Please click here to review our November report prepared por Darkex Research Department.
TECHNICAL ANALYSIS
BTC/USDT
Ahead of the FED interest rate decision, two critical data releases en the US were closely monitored today: Non-Farm Payrolls and Unemployment. In particular, the fact that the Non-Farm Payrolls data came en at only 12K, well below expectations, caused some initial surprise en the market. On the other hand, the fact that the unemployment rate was announced as 4.1%, en line with expectations, supported the markets to digest these data more easily. When we look at the CME data, we observe that the probability of a 25 basis point rate cut continues to hover above 98%.
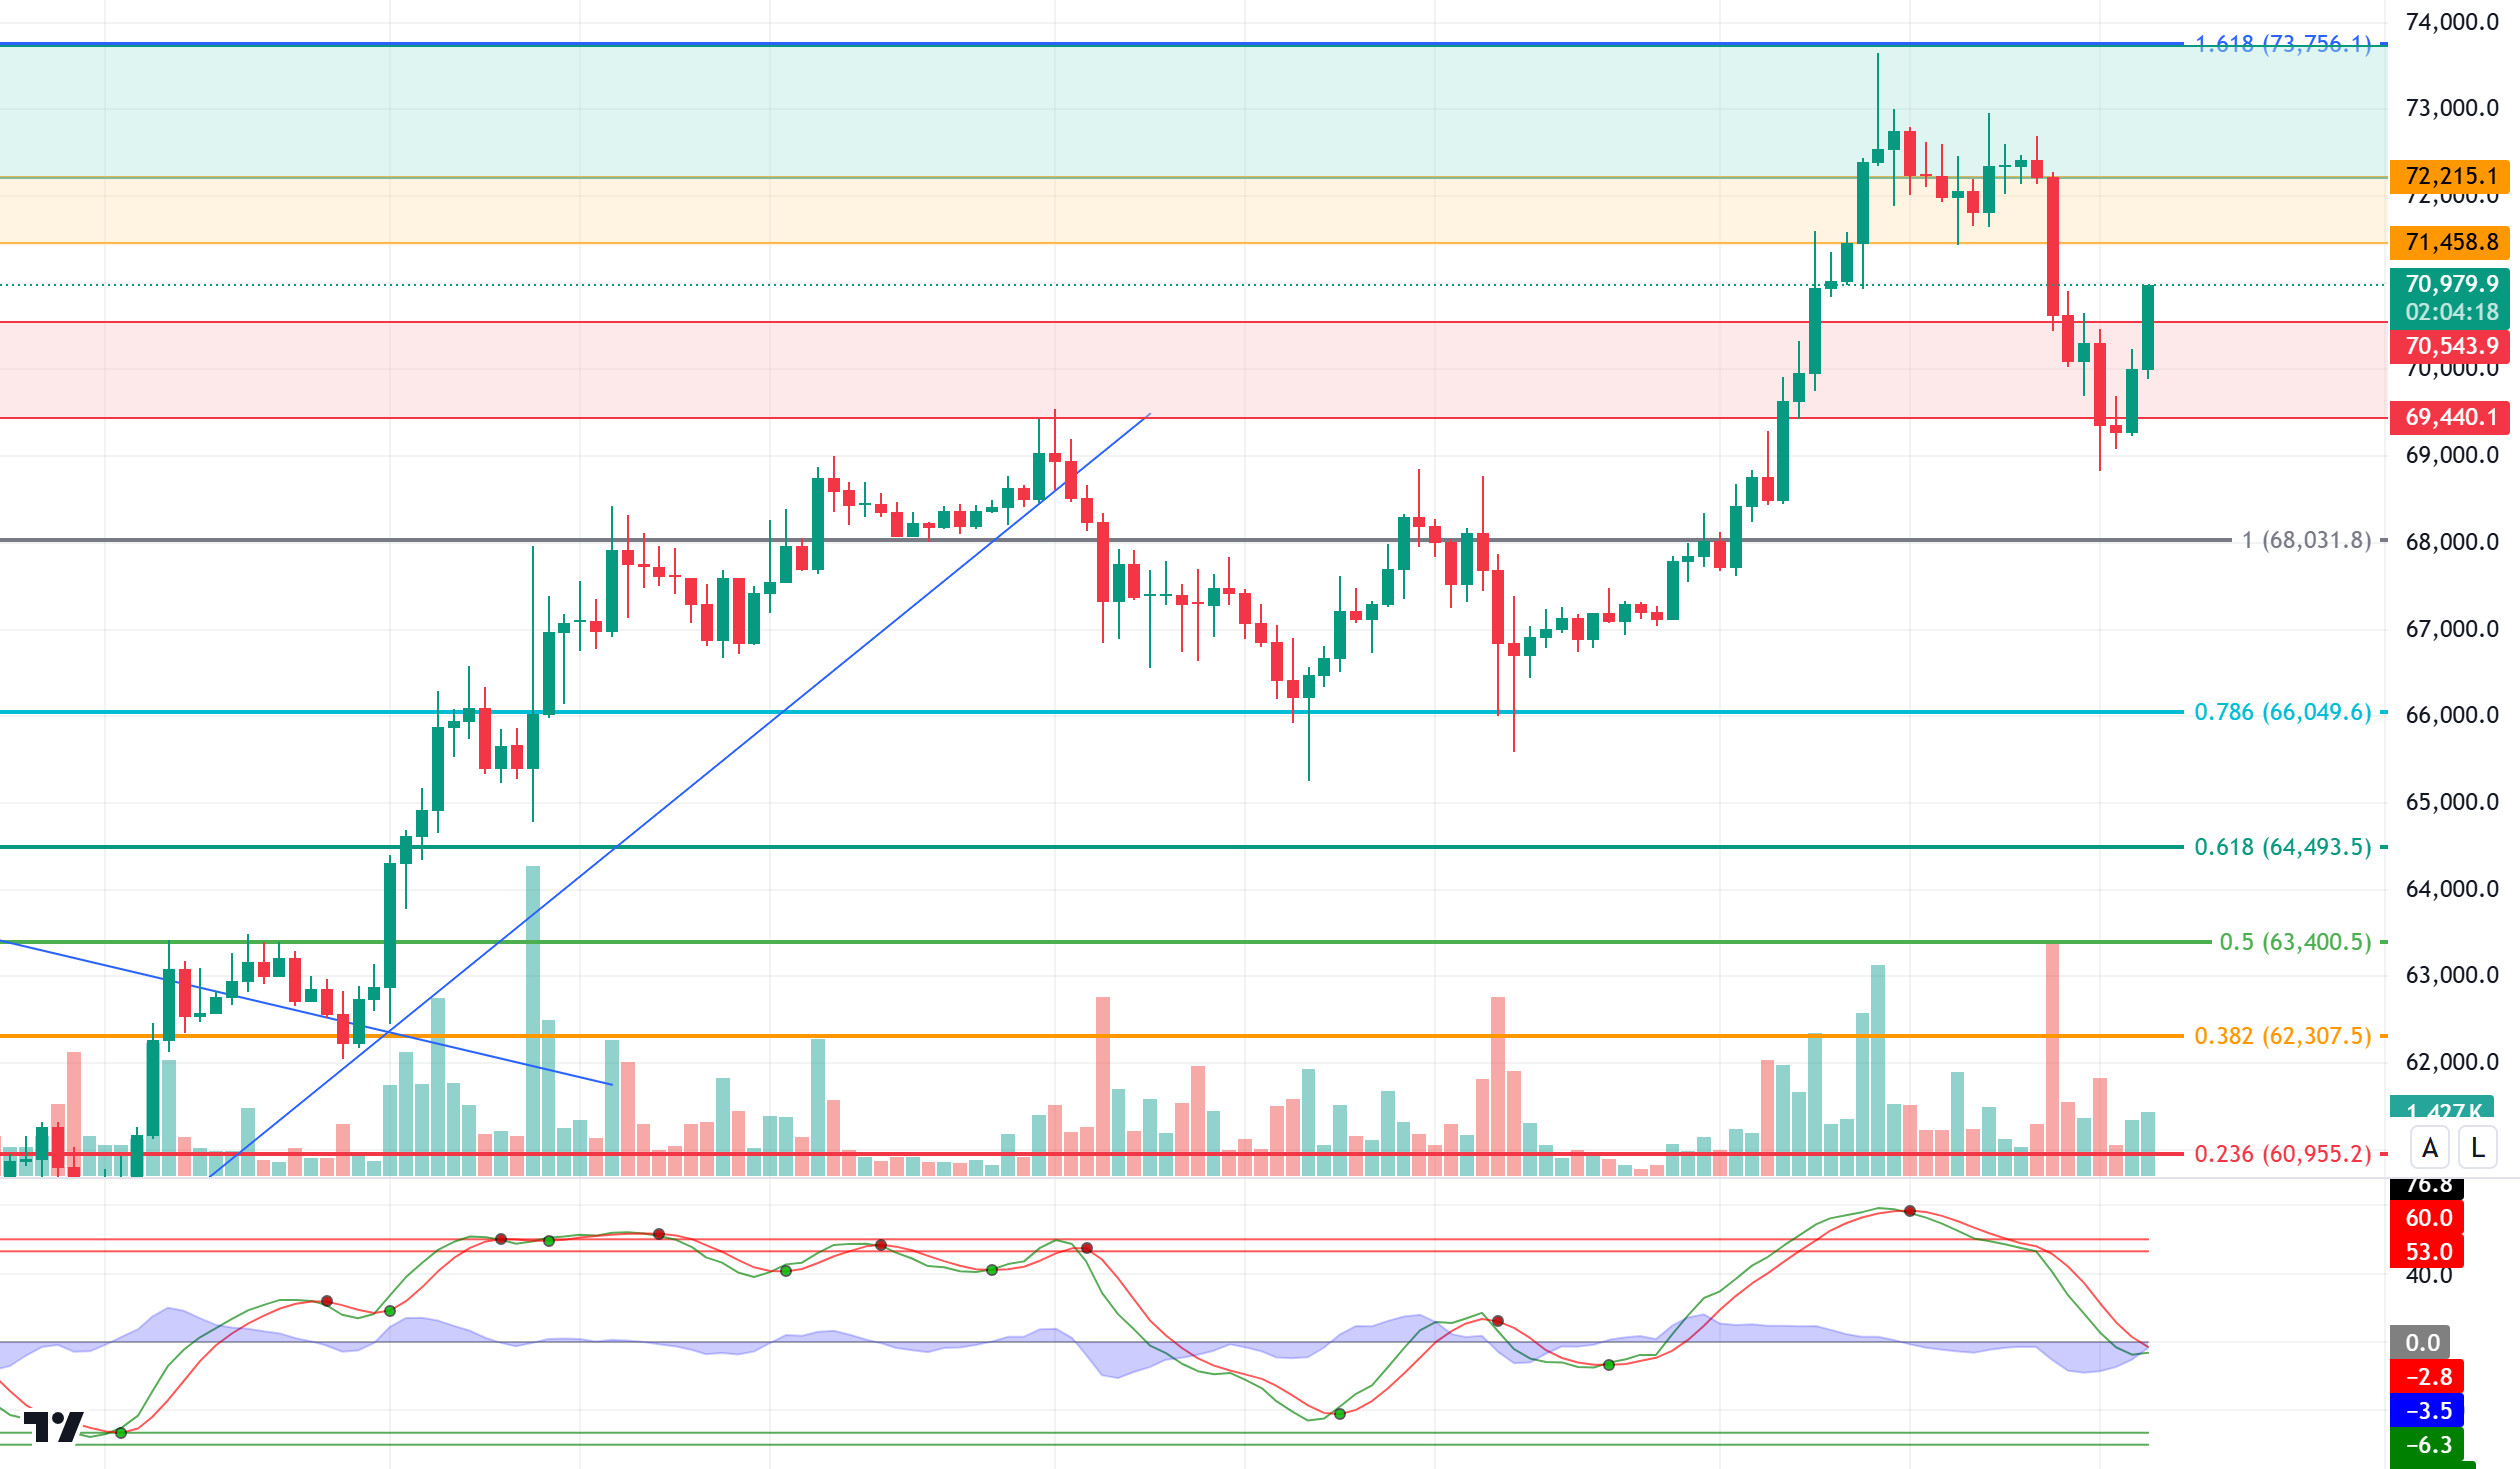
On the technical analysis chart, we can see that BTC, the leading cryptocurrency, has moved upwards after the latest data and has now reached the 70,800 level above the minor resistance level of 70,543, which we mentioned en our previous analysis. If positive pricing continues, hourly persistence above this resistance level may move the price back to 71,458 resistance. Otherwise, with the weakening of the news effect, BTC may retreat towards the support point at 69,440. Eyes will now turn to the presidential race over the weekend and preparations for a retaliatory attack el Israel from the Iranian front en the Middle East.
Supports 69,440 – 68,031 – 66,049
Resistances 70,543 – 71,458 – 72,215
ETH/USDT
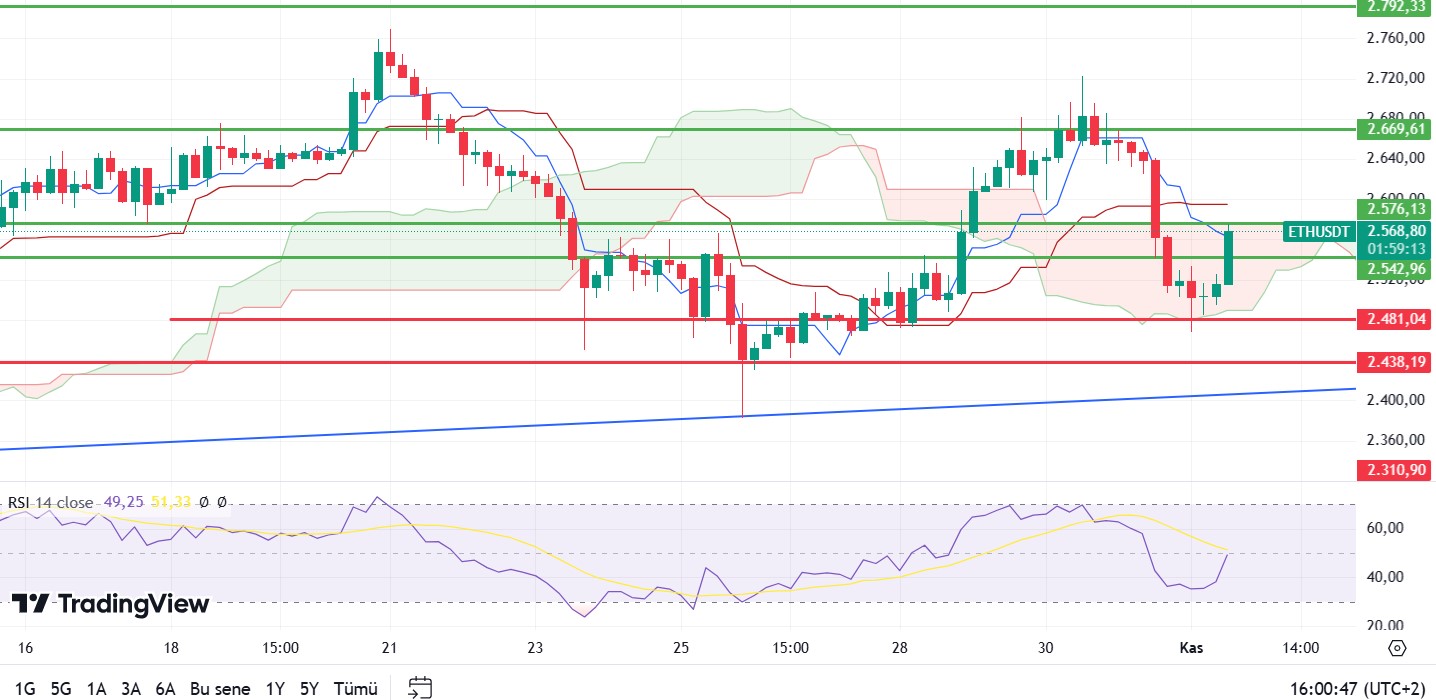
ETH, which maintained the kumo cloud support after yesterday’s decline, has exceeded the resistance level of 2,542 with the reaction it received from this level. After the decline en Chaikin Money Flow (CMF), it is seen to have risen back to -0.09. The fact that the US Non-Farm Payrolls data came en much lower than expected can be counted as one of the reasons for this rise. With the rise, it is seen that the Relative Strength Index (RSI) also broke the downtrend. However, looking at the Cumulative Volume Delta (CVD), it is seen that a significant part of the rise came from the futures side. For this reason, it is important to monitor the 2,576 level, which appears to be the most important resistance level and is also the kumo cloud resistance level. Exceeding this level indicates that the uptrend may continue from where it left off, while a downward reaction may indicate that the downtrend may continue.
Supports 2,542 – 2,481 – 2,438
Resistances 2,576 – 2,669 – 2,792
 LINK/USDT
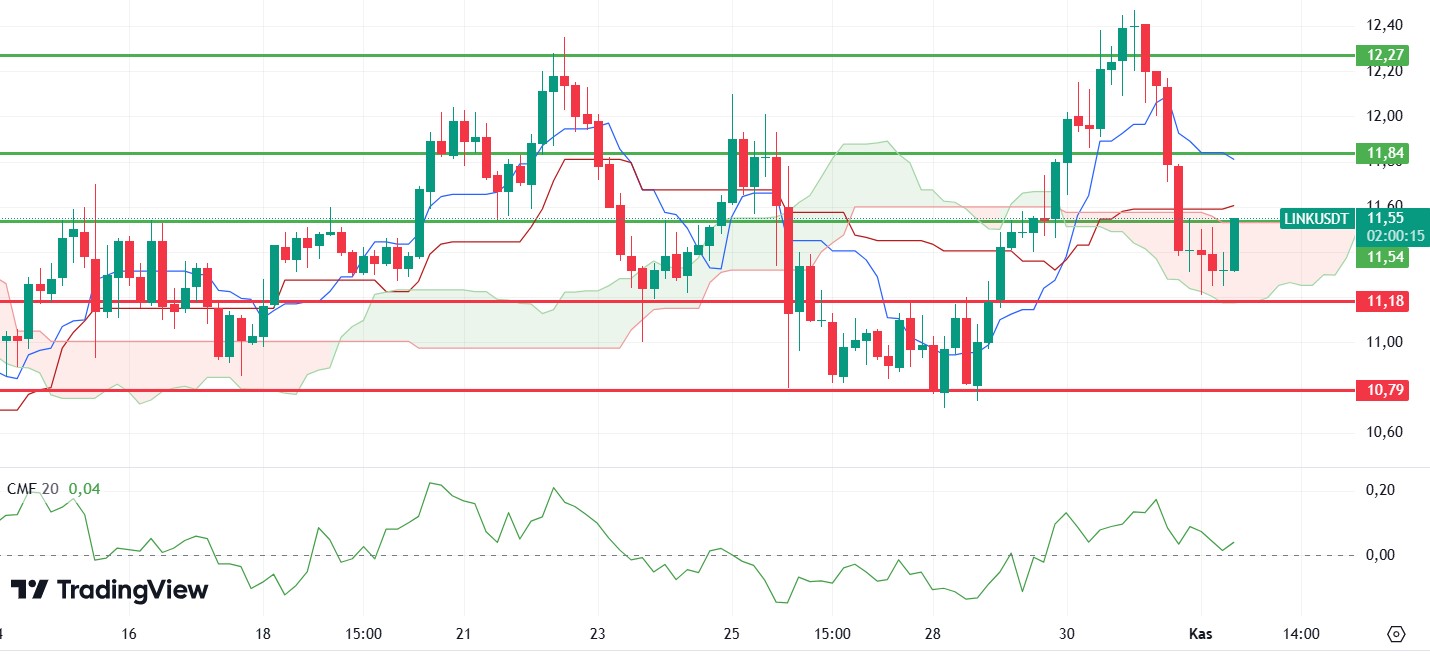
As mentioned en the morning analysis, LINK has risen rapidly to the kumo cloud resistance of 11.54 with the positive mismatch en the Relative Strength Index (RSI). The fact that Chaikin Money Flow (CMF) remained en the positive area after the decline can be seen as another positive factor. It can be said that the rise may continue with the break of the resistance 11.54 level mentioned en the evening. However, if it gets a reaction from this level, it seems possible that declines up to 11.18 levels may come.
Supports 11.18 – 10.79 – 10.27
Resistances 11.54 – 11.84 – 12.27
 SOL/USDT
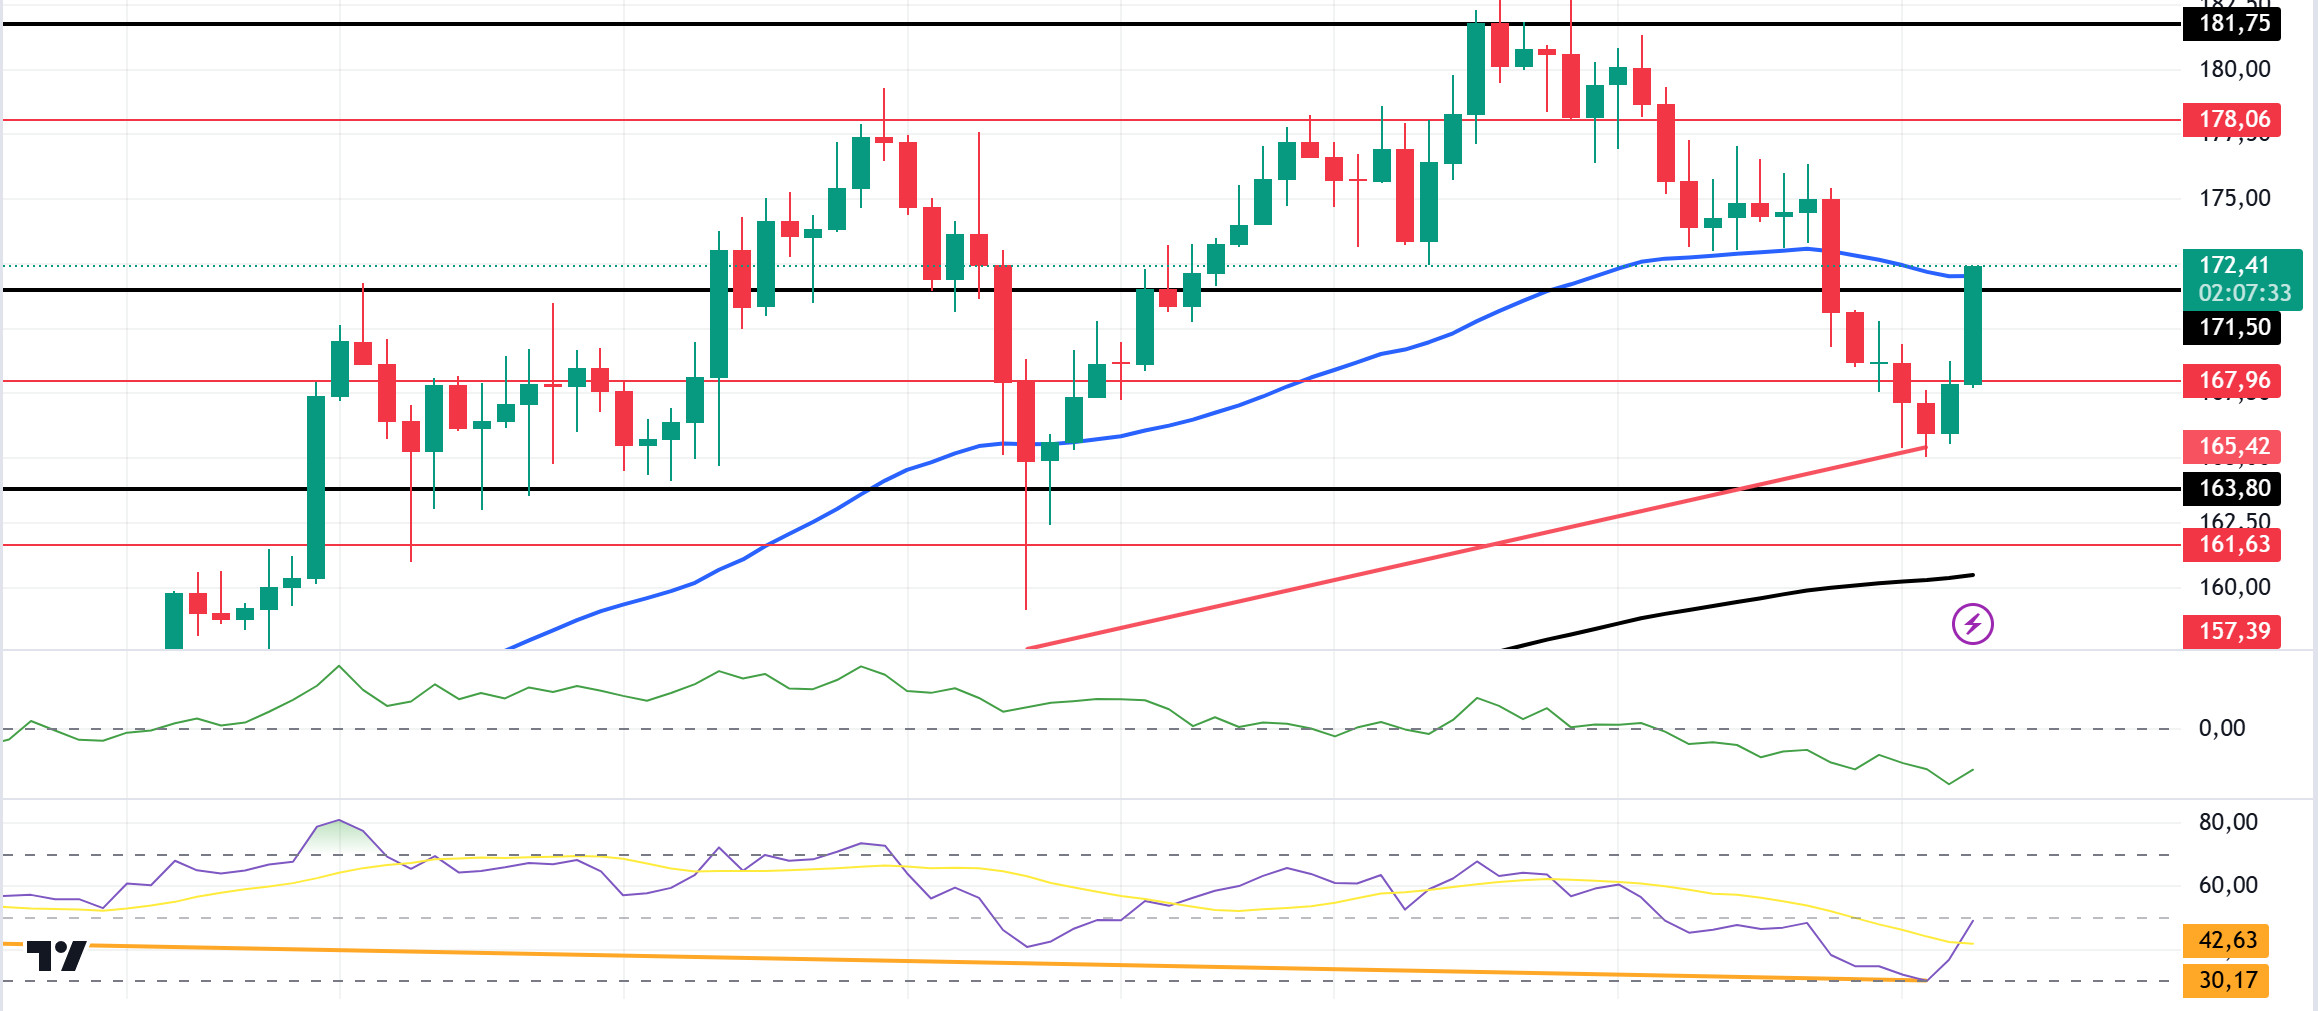
Non-farm payrolls en the US were marked por the strike and hurricane effect. The incoming data was announced as 12 thousand. The expected 106 thousand and the previous figure was 254 thousand. However, average hourly earnings were announced as 0.4% el a monthly basis, above expectations. Expectations were for the data to come en at 3.0%. The increase en wages continues. Inflation will increase with growth. Unemployment rate was announced as 4.1% as expected. This shows that the labor market remains stable and the economy is el a balanced path. In the Solana ecosystem, SOL whales continue to accumulate and stake large amounts of SOL. Solana-based memecoins have attracted liquidity to the ecosystem, increasing SOL demand. Recently, Ponke, a popular Solana memecoin, became the top earning token among the top 200 tokens por market capitalization en 24 horas. Robinhood also expanded Solana to European markets, attracting new users with a 1% deposit bonus. This move added to Solana’s growing appeal beyond the US. Technically, SOL tested the 181.75 level but failed to turn it into support. On the 4-hora timeframe, the 50 EMA (Blue Line) continues to be above the 200 EMA (Black Line). This could mean that the uptrend will continue. However, the price may encounter resistance at the 50 EMA. Indeed, the price keeps forming higher highs and higher lows. On the other hand, the Relative Strength Index (RSI) diverged with 14 prices, supporting the uptrend. But when we examine the Chaikin Money Flow (CMF)20 indicator, it is en negative territory. But we can say that money outflows are decreasing and inflows are increasing. The 181.75 level stands out as a very strong resistance point en the rises driven por both macroeconomic conditions and innovations en the Solana ecosystem. If it rises above this level, the rise may continue strongly. In case of possible political reasons or profit sales, the 163.80 support level may be triggered again. If the price reaches this support level, a potential bullish opportunity may arise.
Supports 167.96 – 163.80 – 161.63
Resistances 171.50 – 178.06 – 181.75
ADA/USDT
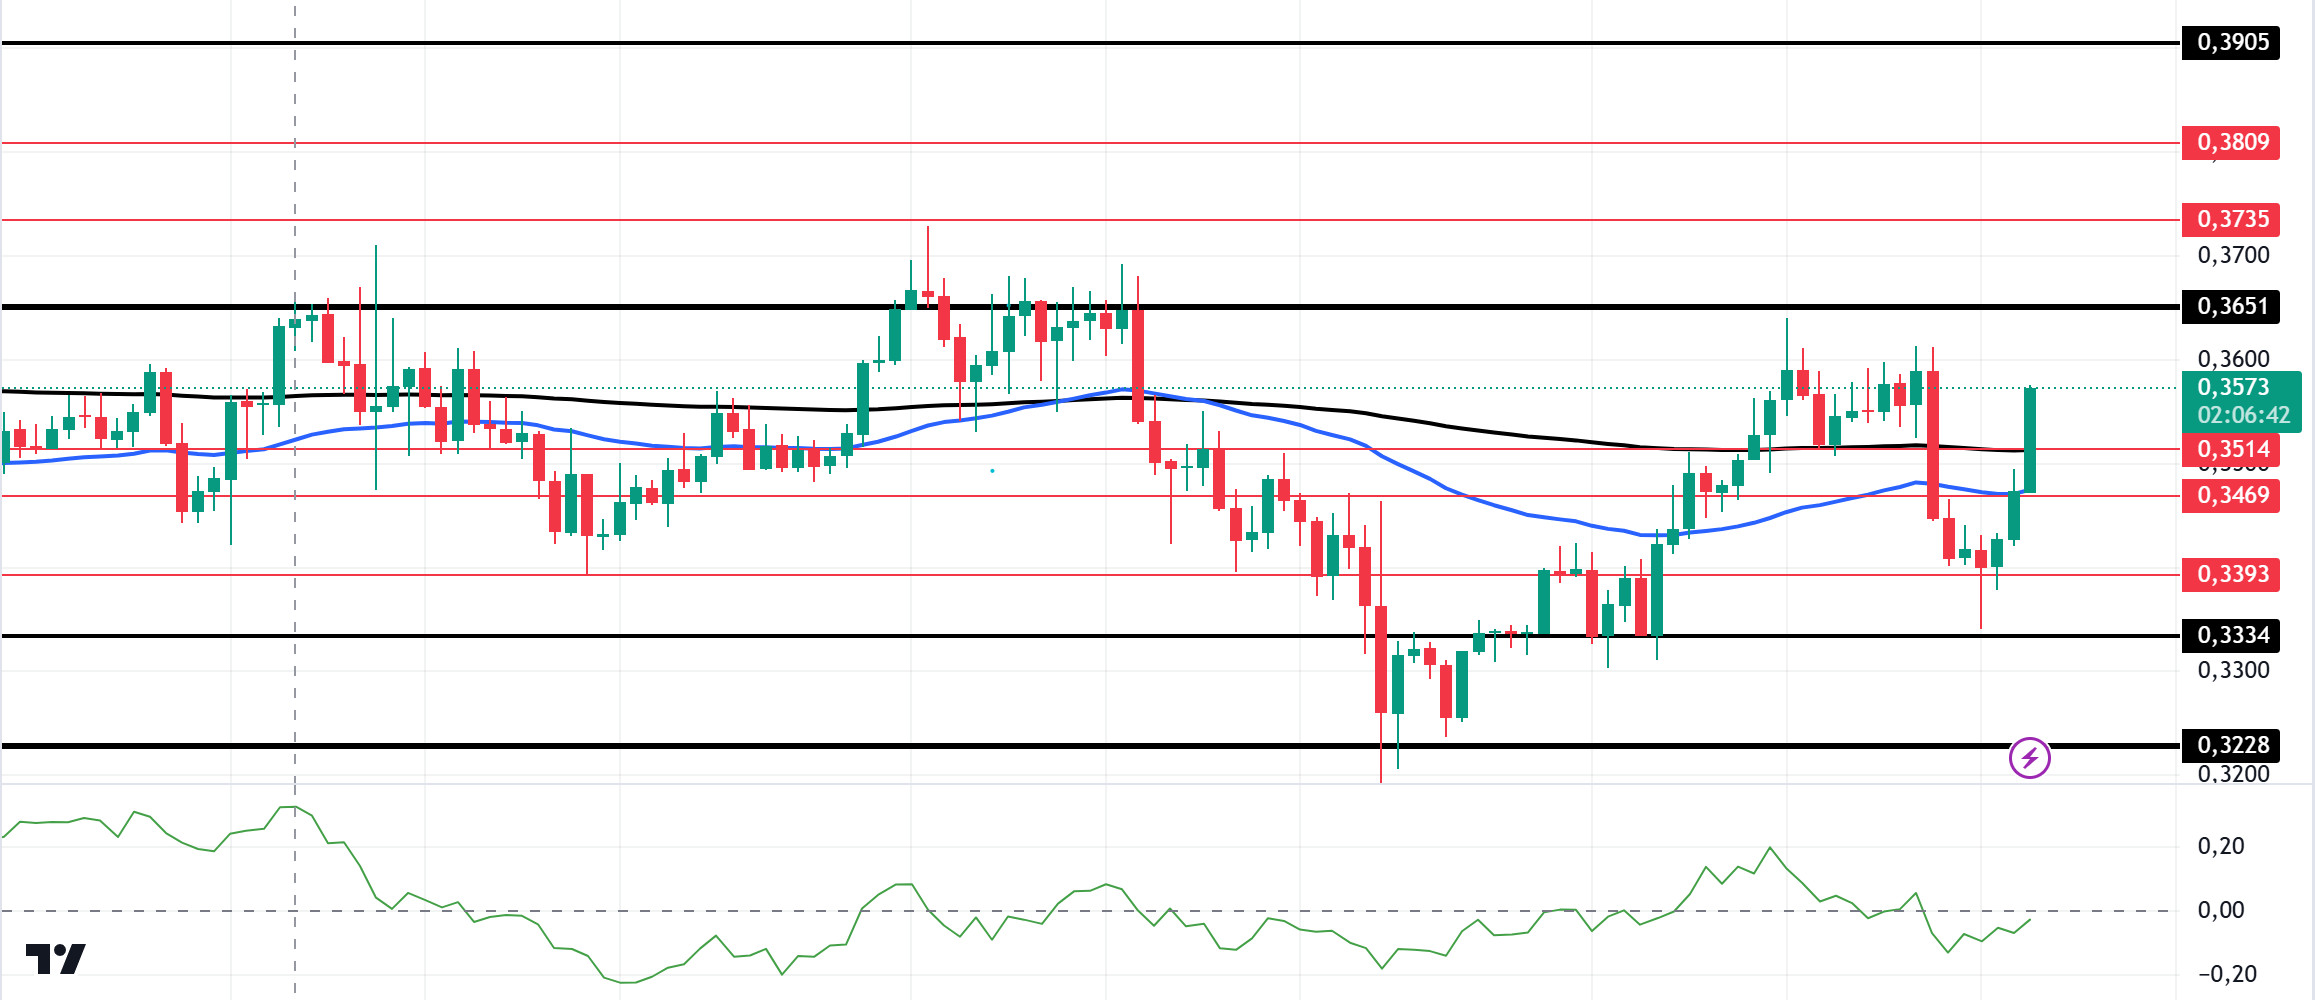
Non-farm payrolls en the US were marked por the strike and hurricane effect. The incoming data was announced as 12 thousand. The expected 106 thousand and the previous figure was 254 thousand. However, average hourly earnings were announced as 0.4% el a monthly basis, above expectations. Expectations were for the data to come en at 3.0%. The increase en wages continues. Inflation will increase with growth. Unemployment rate was announced as 4.1% as expected. This shows that the labor market remains stable and the economy is el a balanced course. In the Cardano ecosystem, according to BeInCrypto, more than 260,000 Cardano addresses bought 6.68 billion ADA en the range of 0.3400 to 0.3600. At an average price of $0.3400, these assets are worth about $2.77 billion. Given this situation, Cardano’s price may struggle to break through this range. Technically, el the 4-hora chart, the price broke the 50 EMA (Blue Line) and the 200 EMA (Black Line) to the upside. However, the 50 EMA hovers below the 200 EMA. This shows that the trend is bearish. At the same time, the Chaikin Money Flow (CMF)20 indicator is en negative territory. But it approached the positive zone due to money inflows. Considering all this, ADA may test the 0.3651 level once again. In the decline that will be experienced due to the macroeconomic data and negativities en the ecosystem, the support level of 0.3334 should be followed. It may be appropriate to buy when it comes to this price level. In the rises due to developments en the ecosystem, if the 0.3651 level is broken en volume, the upward acceleration will increase even more and the 0.3905 level should be followed as a retracement place.
Supports 0.3469 – 0.3393 – 0.3334
Resistances 0.3651 – 0.3735 – 0.3809
 AVAX/USDT
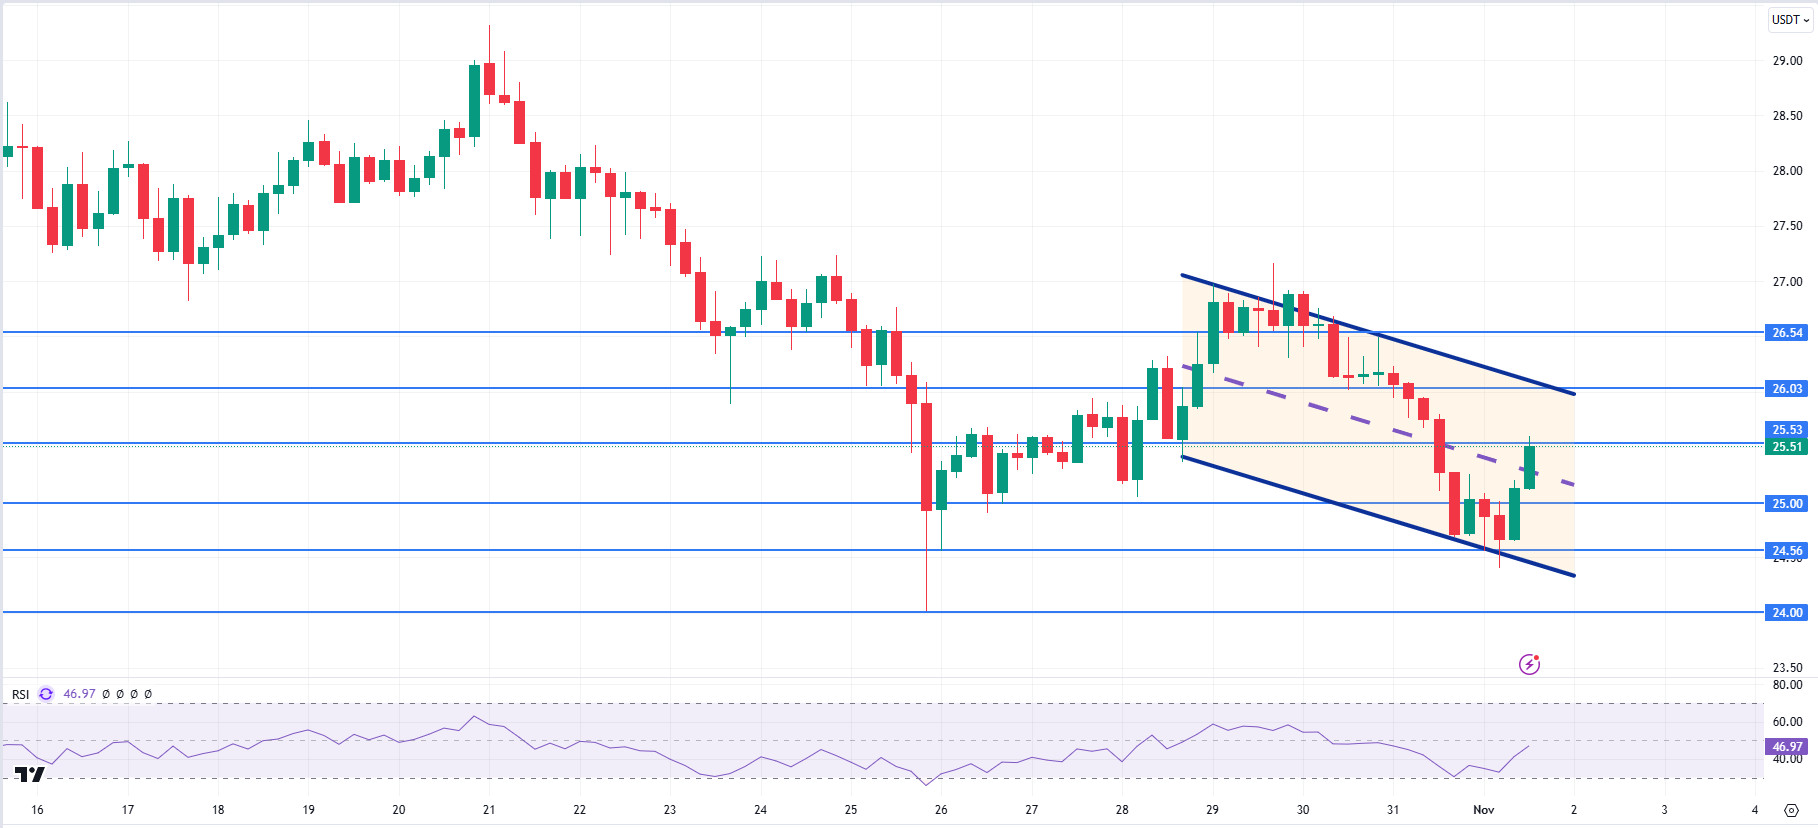
AVAX, which opened today at 25.03, is trading at 25.53, up about 2% during the day. Today, manufacturing purchasing managers index and manufacturing purchasing managers index data will be announced por the US. In addition, news flows from the Middle East will be important for the market.
On the 4-hora chart, it moves within the bearish channel. It is en the middle band of the bearish channel and with a Relative Strength Index value of 46, it can be expected to rise slightly from these levels. In such a case, it may test the 26.03 resistance. On the other hand, selling pressure may increase if today’s data negatively affects the market or news of increased tension en the Middle East. In such a case, it may test 25.00 support. As long as it stays above 22.80 support during the day, the desire to rise may continue. With the break of 22.80 support, sales may increase.
Supports 25.00 – 24.56 – 24.00
Resistances 25.53 – 26.03 – 26.54
 TRX/USDT
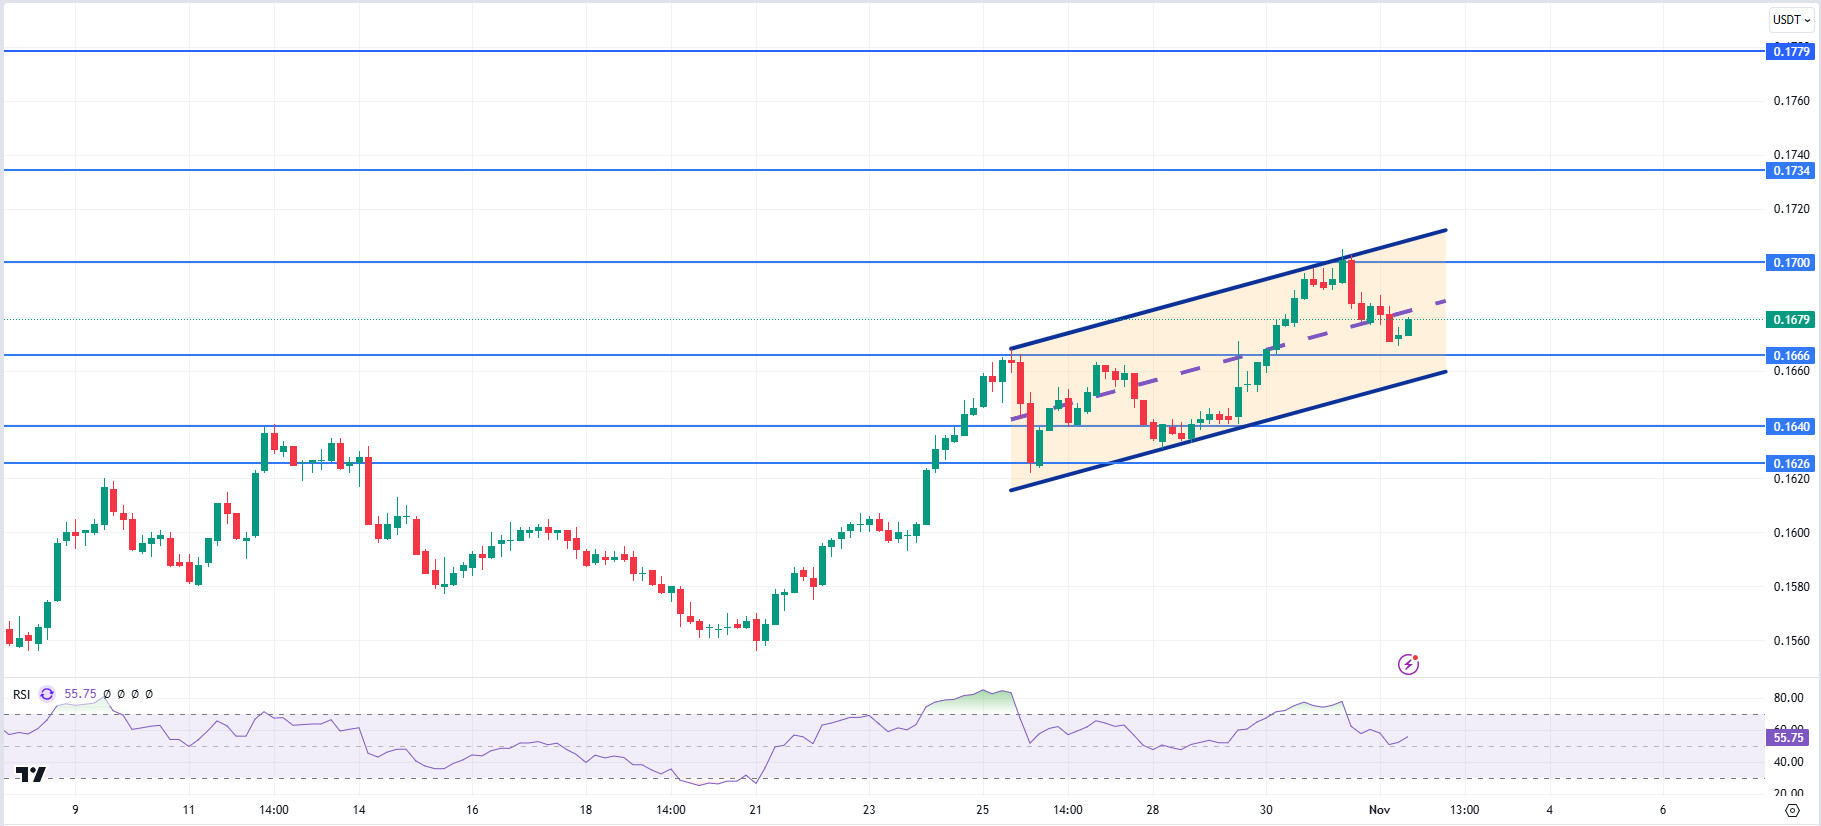
TRX, which started the day at 0.1684, is trading at 0.1679, down 0.5% during the day. Today, the US manufacturing purchasing managers index and manufacturing purchasing managers index are important data that the market will follow. Volatility en the market may increase during the release of these data. The market will also be closely following the news flows regarding the tension en the Middle East.
On the 4-hora chart, the bullish channel is en the middle band. Relative Strength Index value is 55 and some decline can be expected from its current level. In such a case, it may move to the lower band of the channel and test the 0.1666 and 0.1640 supports. However, if it cannot close the candle under 0.1666 support, it may test 0.1700 resistance with the buying reaction that will occur. As long as TRX stays above 0.1482 support, the desire to rise may continue. If this support is broken downwards, sales can be expected to increase.
Supports 0.1666 – 0.1640 – 0.1626
Resistances 0.1700 – 0.1734 – 0.1779
 DOT/USDT
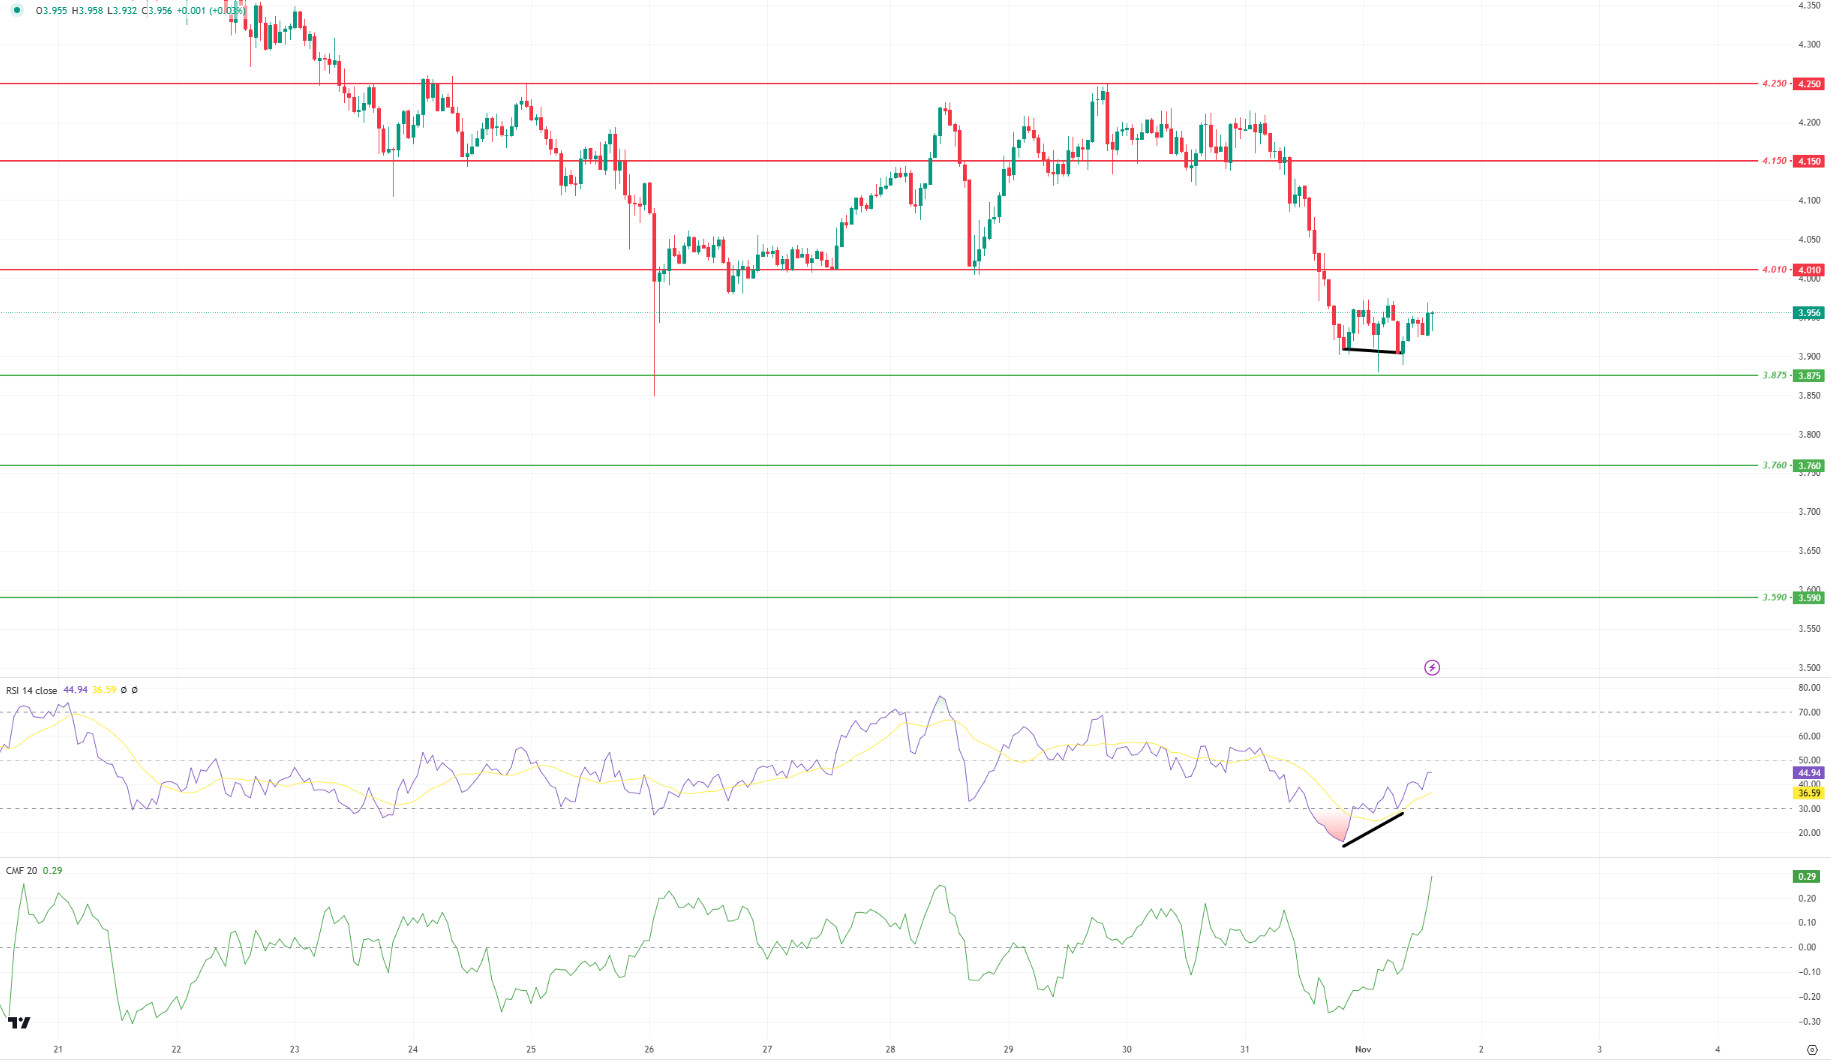
When we examine the Polkadot (DOT) chart, the price seems to have reacted from the support level of 3.875. When we examine the Relative Strength Index (RSI) oscillator, we can say that there is a positive divergence between the price. According to the Chaikin Money Flow (CMF) oscillator, we see that the buyer pressure continues strong. In this context, the price may move towards the 4.010 resistance level. On the other hand, if the price cannot maintain above the 3.875 support level, we can expect it to retreat towards 3.760 levels.
Supports 3.875 – 3.760 – 3.590
Resistances 4.010 – 4.150 – 4.250
 SHIB/USDT
Shiba Inu’s token burn rate, which has increased por nearly 253,000% en the last 24 horas, has led to billions of SHIBs being taken out of circulation, creating expectations of a price increase. However, security expert Susbarium and developer Kaal Dhairya urged investors not to make hasty decisions.
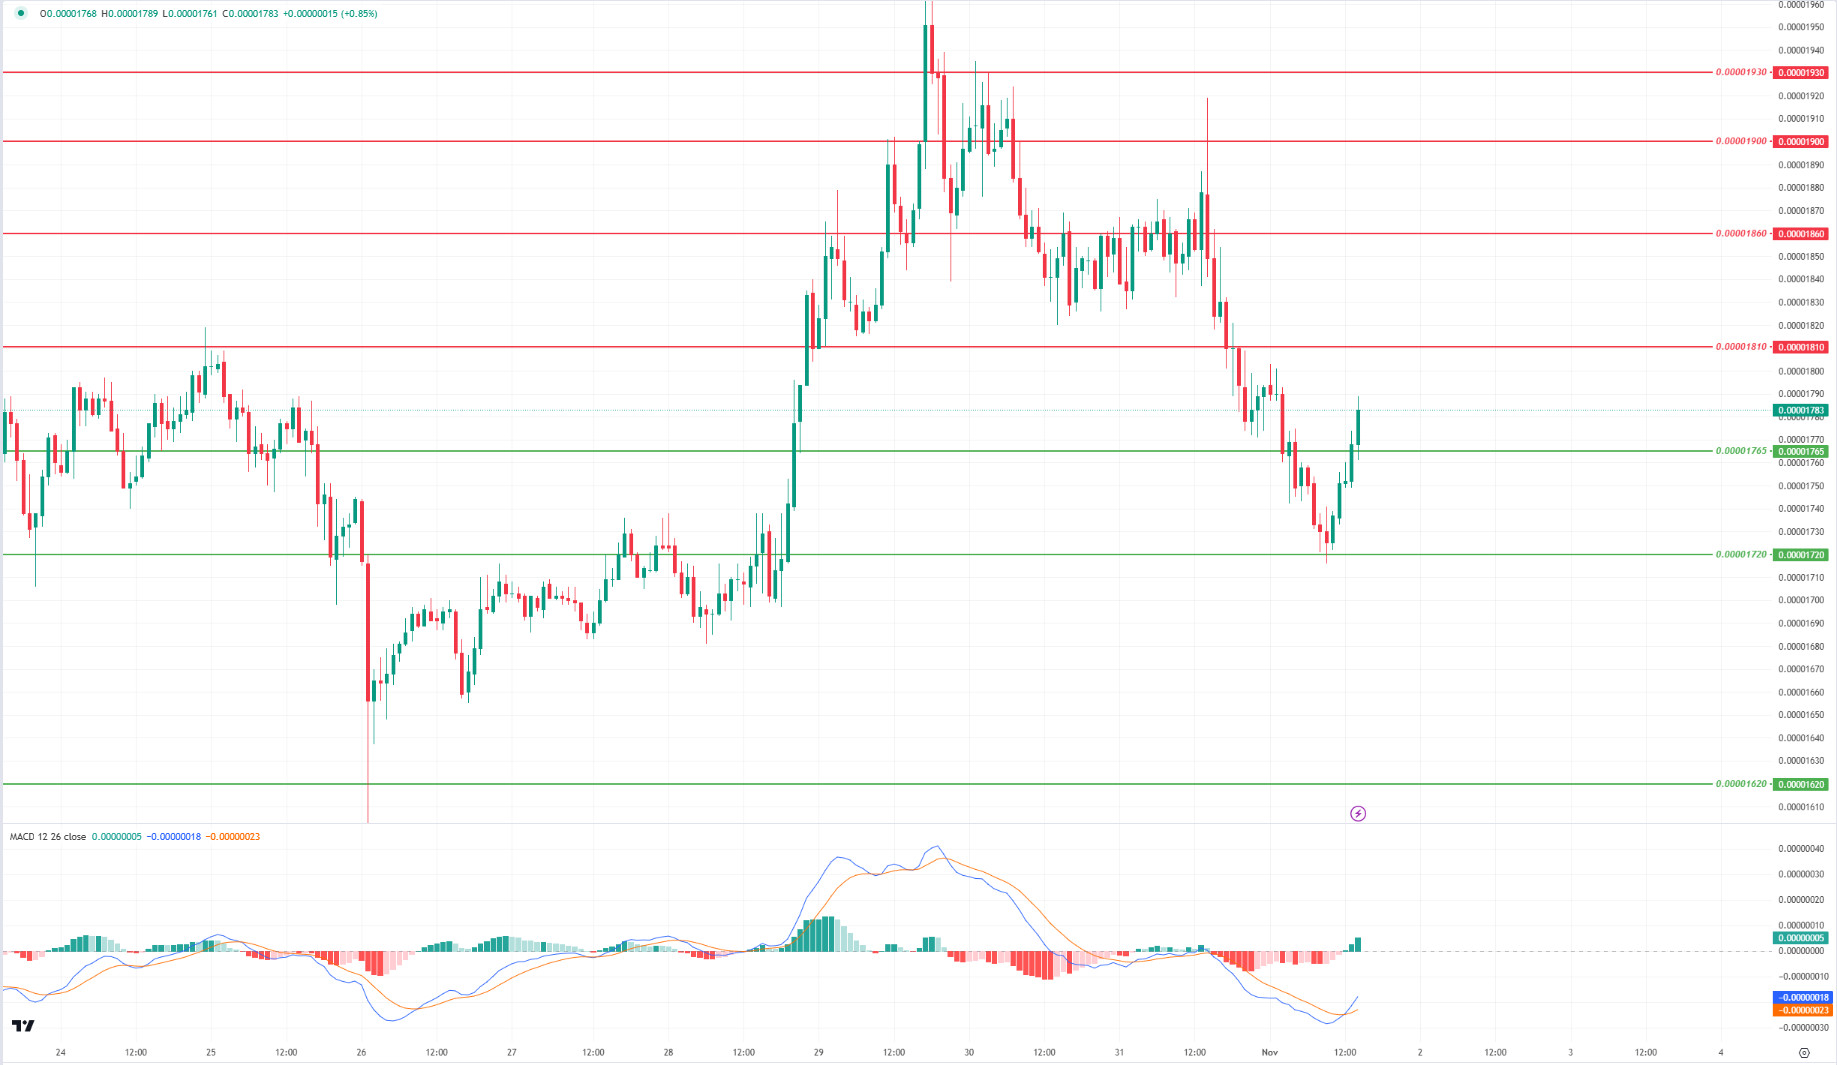
When we examine the SHIB chart, we see that the price reacted from the 0.00001720 support level. According to the Moving Average Convergence Divergence (MACD) oscillator, we can say that the buyer pressure has increased compared to the previous hora. In this context, if the price maintains above the 0.00001765 level, we may see a rise towards 0.00001810 levels. On the other hand, en case of increased selling pressure, if the price loses the 0.00001765 level, it may want to test the 0.00001720 level again.
Supports 0.00001765 – 0.00001720 – 0.00001620
Resistances 0.00001810 – 0.00001860 – 0.00001900
 LEGAL NOTICE
The investment information, comments and recommendations contained herein do not constitute investment advice. Investment advisory services are provided individually por authorized institutions taking into account the risk and return preferences of individuals. The comments and recommendations contained herein are of a general nature. These recommendations may not be suitable for your financial situation and risk and return preferences. Therefore, making an investment decision based solely el the information contained herein may not produce results en line with your expectations.