
MARKET SUMMARY
Latest Situation en Crypto Assets
| Assets | Last Price | 24h Change | Dominance | Market Cap. |
|---|---|---|---|---|
| BTC | 68,752.00 | 1.77% | 58.40% | 1.36 T |
| ETH | 2,511.00 | 1.18% | 12.98% | 302.54 B |
| SOLANA | 174.81 | -0.60% | 3.54% | 82.49 B |
| XRP | 0.5170 | 0.61% | 1.26% | 29.43 B |
| DOGE | 0.1464 | 5.56% | 0.93% | 21.56 B |
| TRX | 0.1634 | -1.15% | 0.61% | 14.14 B |
| CARDANO | 0.3380 | 0.18% | 0.51% | 11.84 B |
| AVAX | 25.95 | 1.13% | 0.45% | 10.59 B |
| SHIB | 0.00001718 | 0.65% | 0.43% | 10.14 B |
| LINK | 10.99 | -0.24% | 0.30% | 6.91 B |
| DOT | 4.132 | 1.60% | 0.27% | 6.26 B |
*Prepared el 10.28.2024 at 13:30 (UTC)
WHAT’S LEFT BEHIND
900 Million Dollar Inflows to Crypto Funds
Cryptocurrency funds ended last week with a net investment of $900 million. Bitcoin was again the most heavily invested fund, while Ether saw outflows. Solana saw the segundo largest net inflow this year, while this year’s total net investment almost tripled the entire 2021 total.
Tether Announces $5.58 Billion Bitcoin Reserve!
Tether CEO Paolo Ardoino announced at the Plan B event en Lugano, Switzerland that the company has 48 tons of gold and 82,000 Bitcoin en its reserves. Ardoino also responded to comments el the subject yesterday el X, saying that they also hold $100 million en US bonds.
Japanese Company Metaplanet
Japan-based investment firm Metaplanet continues its strategic investments en the leading cryptocurrency Bitcoin (BTC). Thus, it is solidifying its name as one of the largest institutional Bitcoin holders en Asia. The company announced el October 28 that it made an additional purchase of 156.78 BTC.
Hong Kong Stock Exchange Cryptocurrency Index
On November 15, the Hong Kong Stock Exchange will launch a new crypto asset index that will allow you to track Bitcoin and Ethereum prices transparently. CEO Chan stated that this step will strengthen Hong Kong as an international financial center. The new index aims to increase investment opportunities en the region por providing investors with reliable price data.
HIGHLIGHTS OF THE DAY
Important Economic Calender Data
*There is no important calendar data for the rest of the day.
INFORMATION
*The calendar is based el UTC (Coordinated Universal Time) time zone.
The economic calendar content el the relevant page is obtained from reliable news and data providers. The news en the economic calendar content, the date and time of the announcement of the news, possible changes en the previous, expectations and announced figures are made por the data provider institutions. Darkex cannot be held responsible for possible changes that may arise from similar situations.
MARKET COMPASS
The fact that the Israeli attack el Iran was not as feared was an important catalyst for global markets, which started the week with a positive mood ahead of critical macro data. While oil prices started the week with a sharp decline, stock markets are generally el the rise. US indices also started the day el the positive side and digital assets continued to rise with the increased risk-taking motive. Although no significant news flow is expected en the rest of the day, it will be closely monitored whether the optimistic mood will continue. The critical US employment data to be released el Friday seems to be the most important development of this week. Click here to review our report el this subject.
Investors seem to be relieved that the Israeli airstrikes against Iran did not target oil or nuclear facilities as initially feared. The dollar index, which had risen el expectations that the US Federal Reserve (FED) would not cut interest rates as fast as previously thought, eased, albeit slightly, while the yield el the country’s 10-year bonds also declined.
We think it is useful to reiterate our warnings that there may be interim corrections en the recent period, when we have seen a rise en digital assets en line with our analysis, en which we stated that we have an upward expectation for the long term. Although the Bitcoin-led purchases remain remarkably intense, we think that we may see short-term declines if critical barriers cannot be overcome.
TECHNICAL ANALYSIS
BTC/USDT
There are active horas en Bitcoin. Developments en Asia during the day had a positive impact el the price of Bitcoin. Following the news that the Hong Kong Stock Exchange will introduce a new crypto asset index el November 15, where Bitcoin and Ethereum prices can be monitored transparently, the Japanese company Metaplanet, which attracted attention with Bitcoin purchases, stated that it made an additional purchase of 156.78 BTC. In addition, Tether, which came to the agenda with the news of the investigation el Friday, reassured the market por announcing its Bitcoin reserve of 5.58 billion dollars.
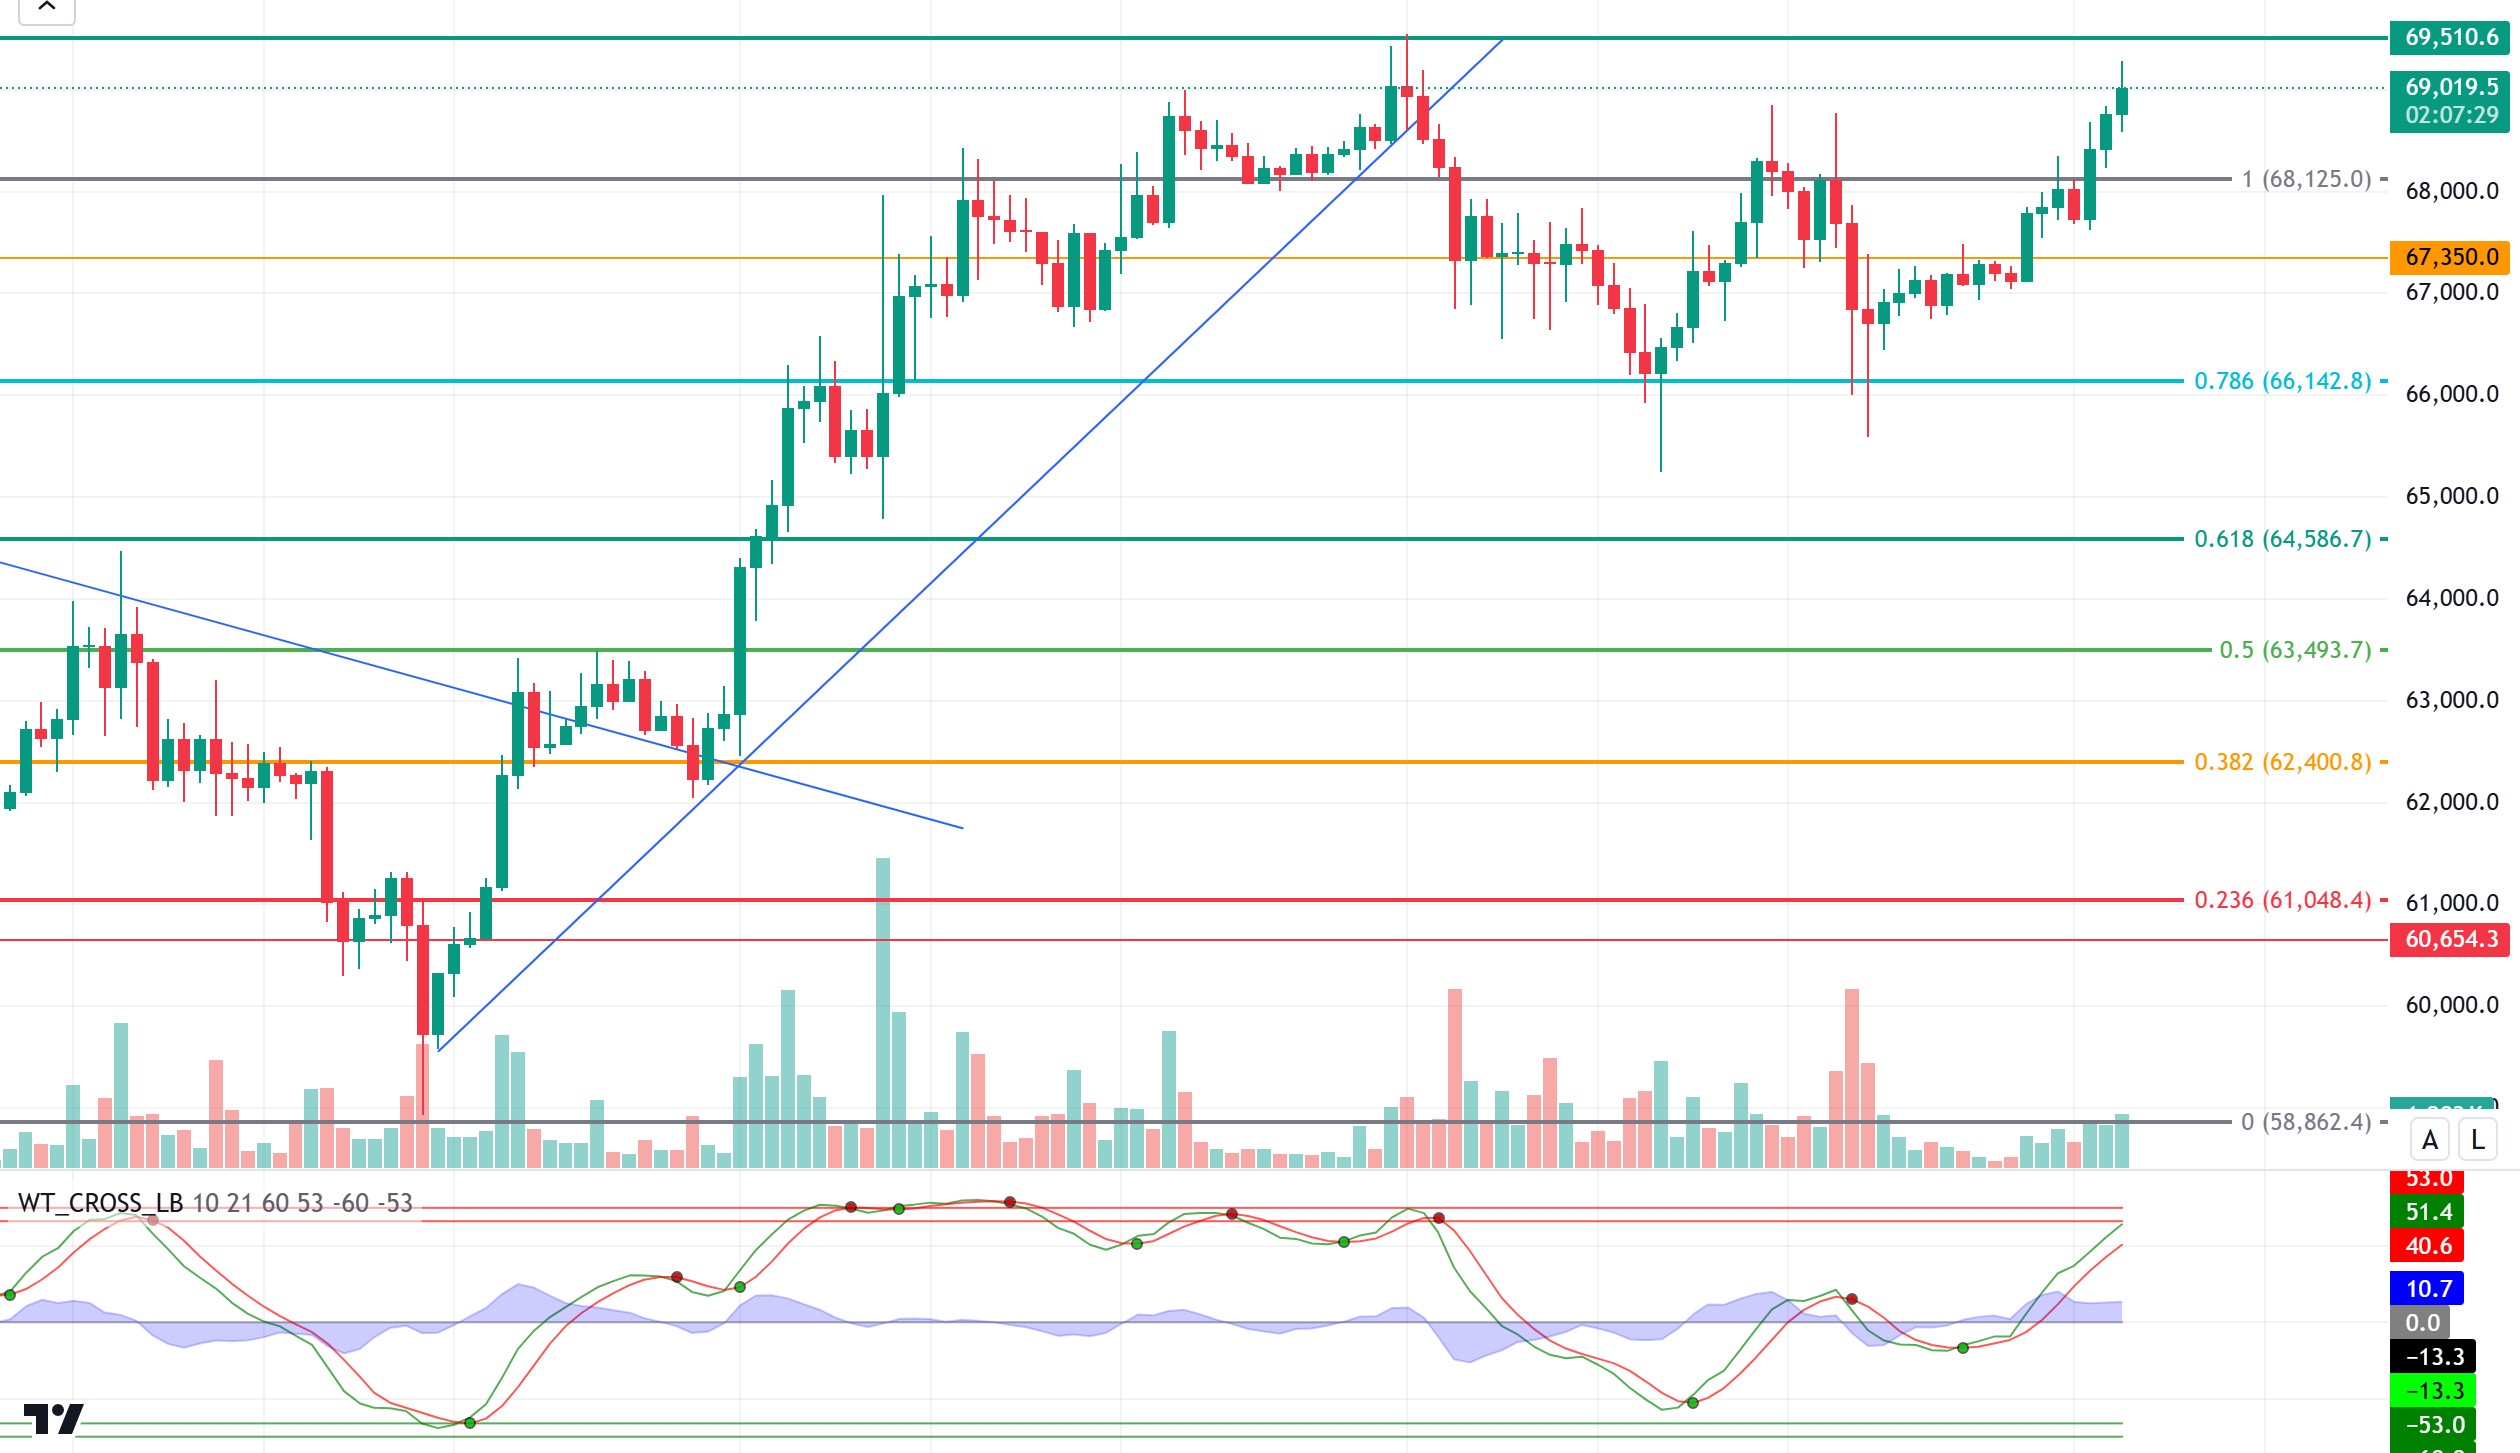
If we look at the BTC technical outlook with all these developments, as we mentioned earlier, BTC, which is priced within the horizontal trend channel, has exceeded the Fibonacci 1 (68,125) resistance level and created a short-term uptrend. BTC, which is attempting a new attack towards the 69,510 level, the peak it has previously tested, can target 71,458, the last strong resistance level before the new ATH, en the coming days. As a matter of fact, when we look at the global indices, the positive pricing experienced can support the BTC price en this direction. In case of a possible new selling pressure, Fibonacci 1 (68,125), which previously worked as a resistance level, may appear as a new support level. When we look at our technical indicator, the fact that it has not yet reached the oversold zone may suggest that the price may go up a little more.
Supports 67,350 – 66,142 – 64,586
Resistances 68,125 – 69,510 – 71,458
ETH/USDT
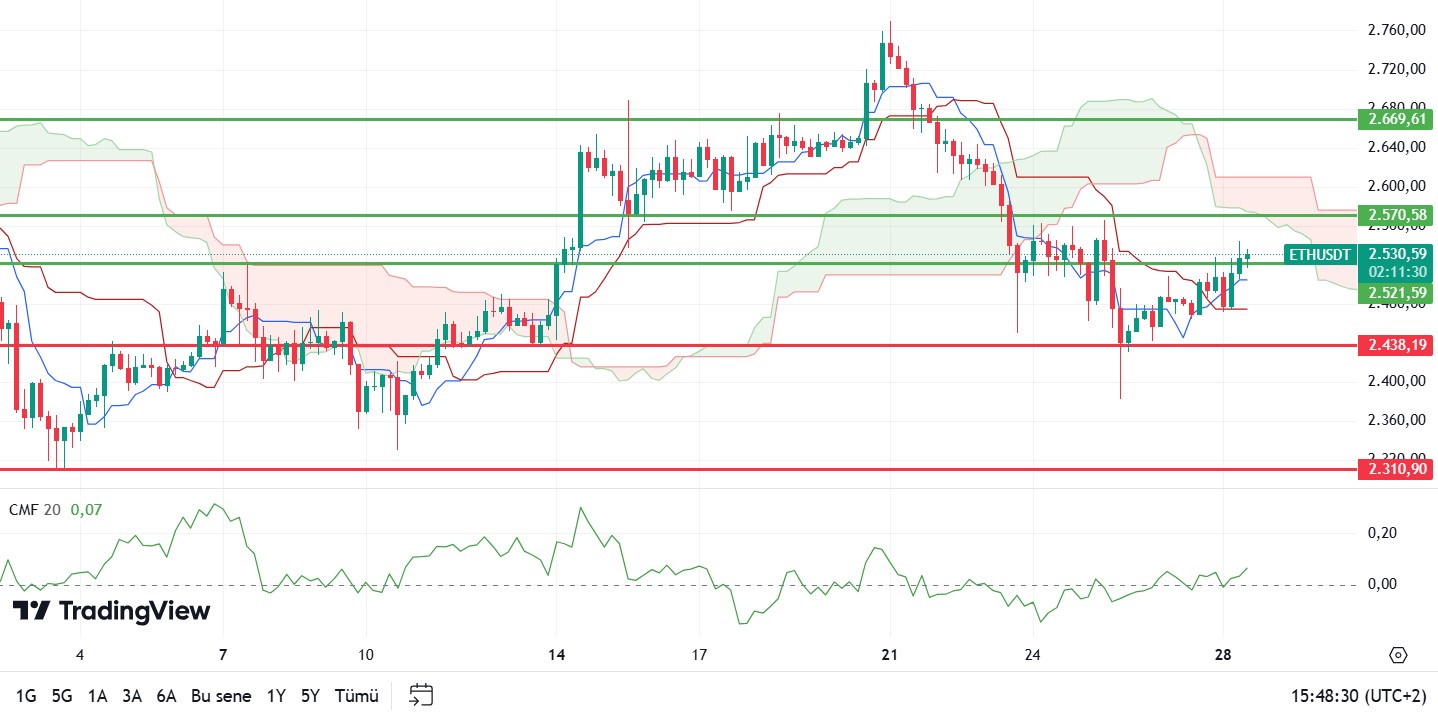
ETH is trying to hold el to the 2,521 level por reacting to the kijun resistance el the daily timeframe as Bitcoin rose above the $69,000 level during the day. Chaikin Money Flow (CMF) is still positive but continues to move sideways. Relative Strength Index (RSI) remains positive. Ethereum, which has shown relative weakness against Bitcoin, may fall again with the loss of the 2,521 level. For a positive outlook, it is important to exceed the 2,570 resistance level. Closures above this level may enable rapid rises to 2,669 – 2,815 levels respectively.
Supports 2,521 – 2,438 – 2,310
Resistances 2,571 – 2,669 – 2,815
LINK/USDT
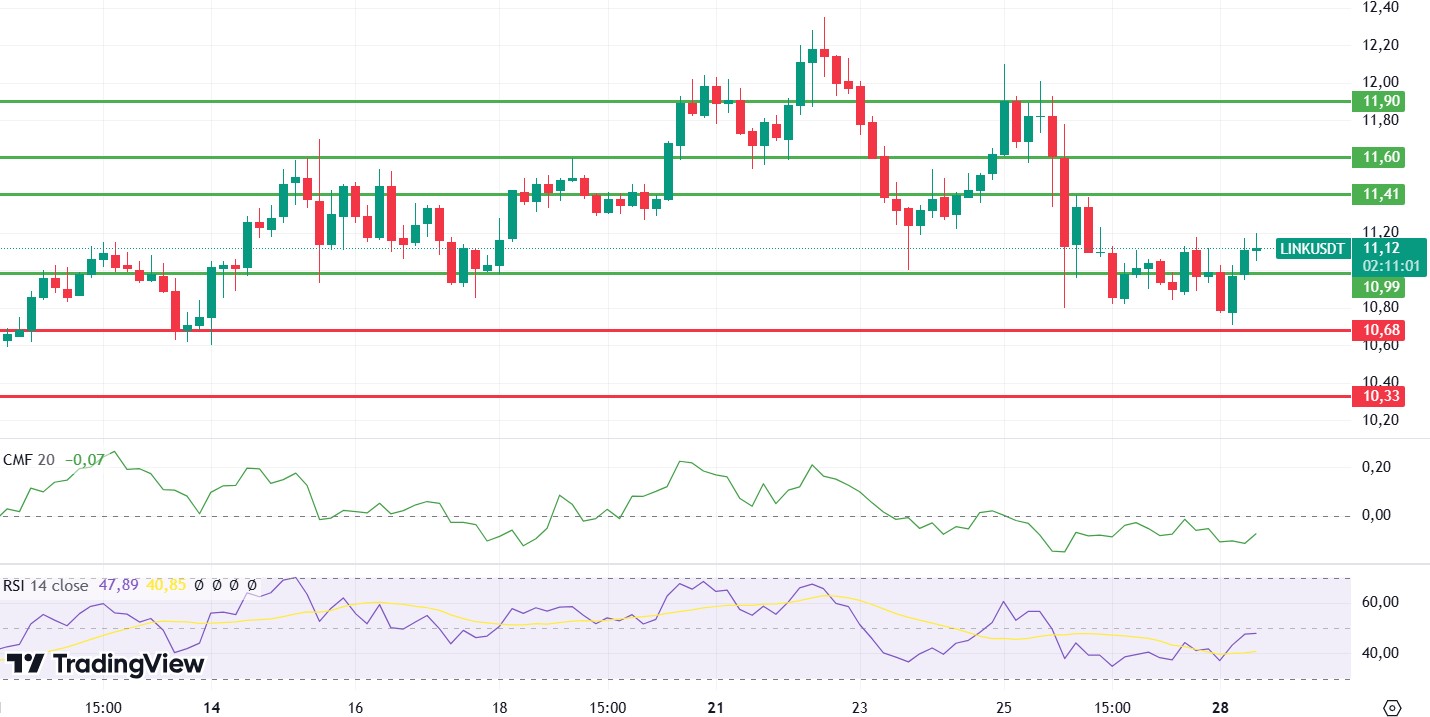
With the positive divergence el the Relative Strength Index (RSI) mentioned en the morning analysis, LINK has managed to rise above the 10.99 level and is back en positive territory. However, the fact that Chaikin Money Flow (CMF) is still at negative valuation and the funding is very high, especially with the rises en Bitcoin coming from the futures side, creates a bearish expectation across the market. If this bearish scenario materializes, the loss of the 10.99 level for LINK may bring rapid declines to the range of 10.68 – 10.33.
Supports 10.99 – 10.68 – 10.33
Resistances 11.41 – 11.60 – 11.90
SOL/USDT
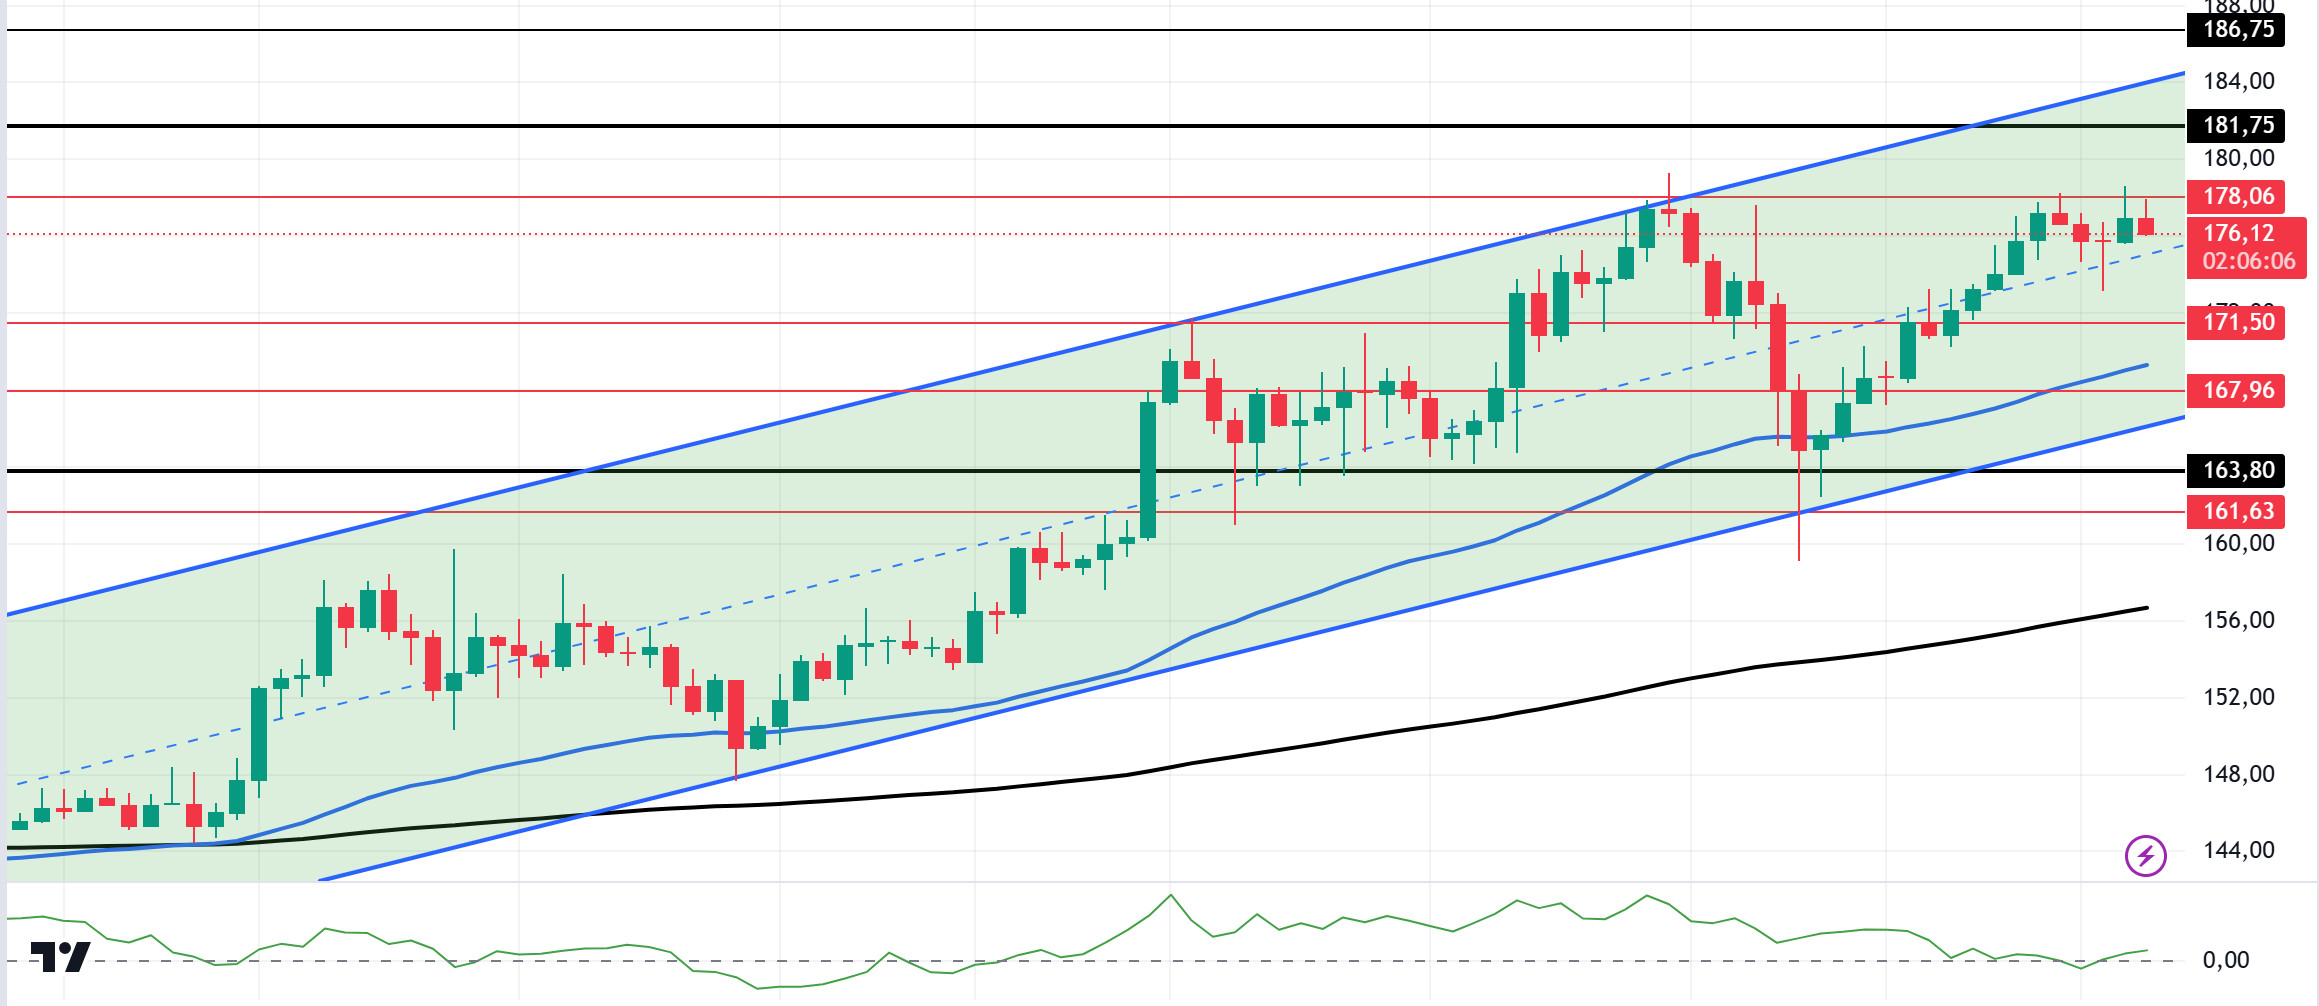
On the 4-hora timeframe, SOL is struggling to hold the recent months’ high at $179. The 50 EMA (Blue Line) continues to be above the 200 EMA (Black Line). This could mean that the uptrend will continue. However, Chaikin Money Flow (CMF)20 has increased and gained a positive value since our analysis en the morning. This signals that money inflows are increasing. Starting el October 10, the price has moved back up into resistance, supported por the mid-level of the uptrend that started el October 10. The 181.75 level is a very strong resistance point en the uptrend driven por both macroeconomic conditions and innovations en the Solana ecosystem. If it rises above this level, the rise may continue strongly. In case of possible political reasons or profit sales, support levels 163.80 – 161.63 may be triggered again. If the price comes to these support levels, a potential bullish opportunity may arise.
Supports 171.50 – 167.96 – 163.80
Resistances 178.06 – 181.75 – 186.75
ADA/USDT
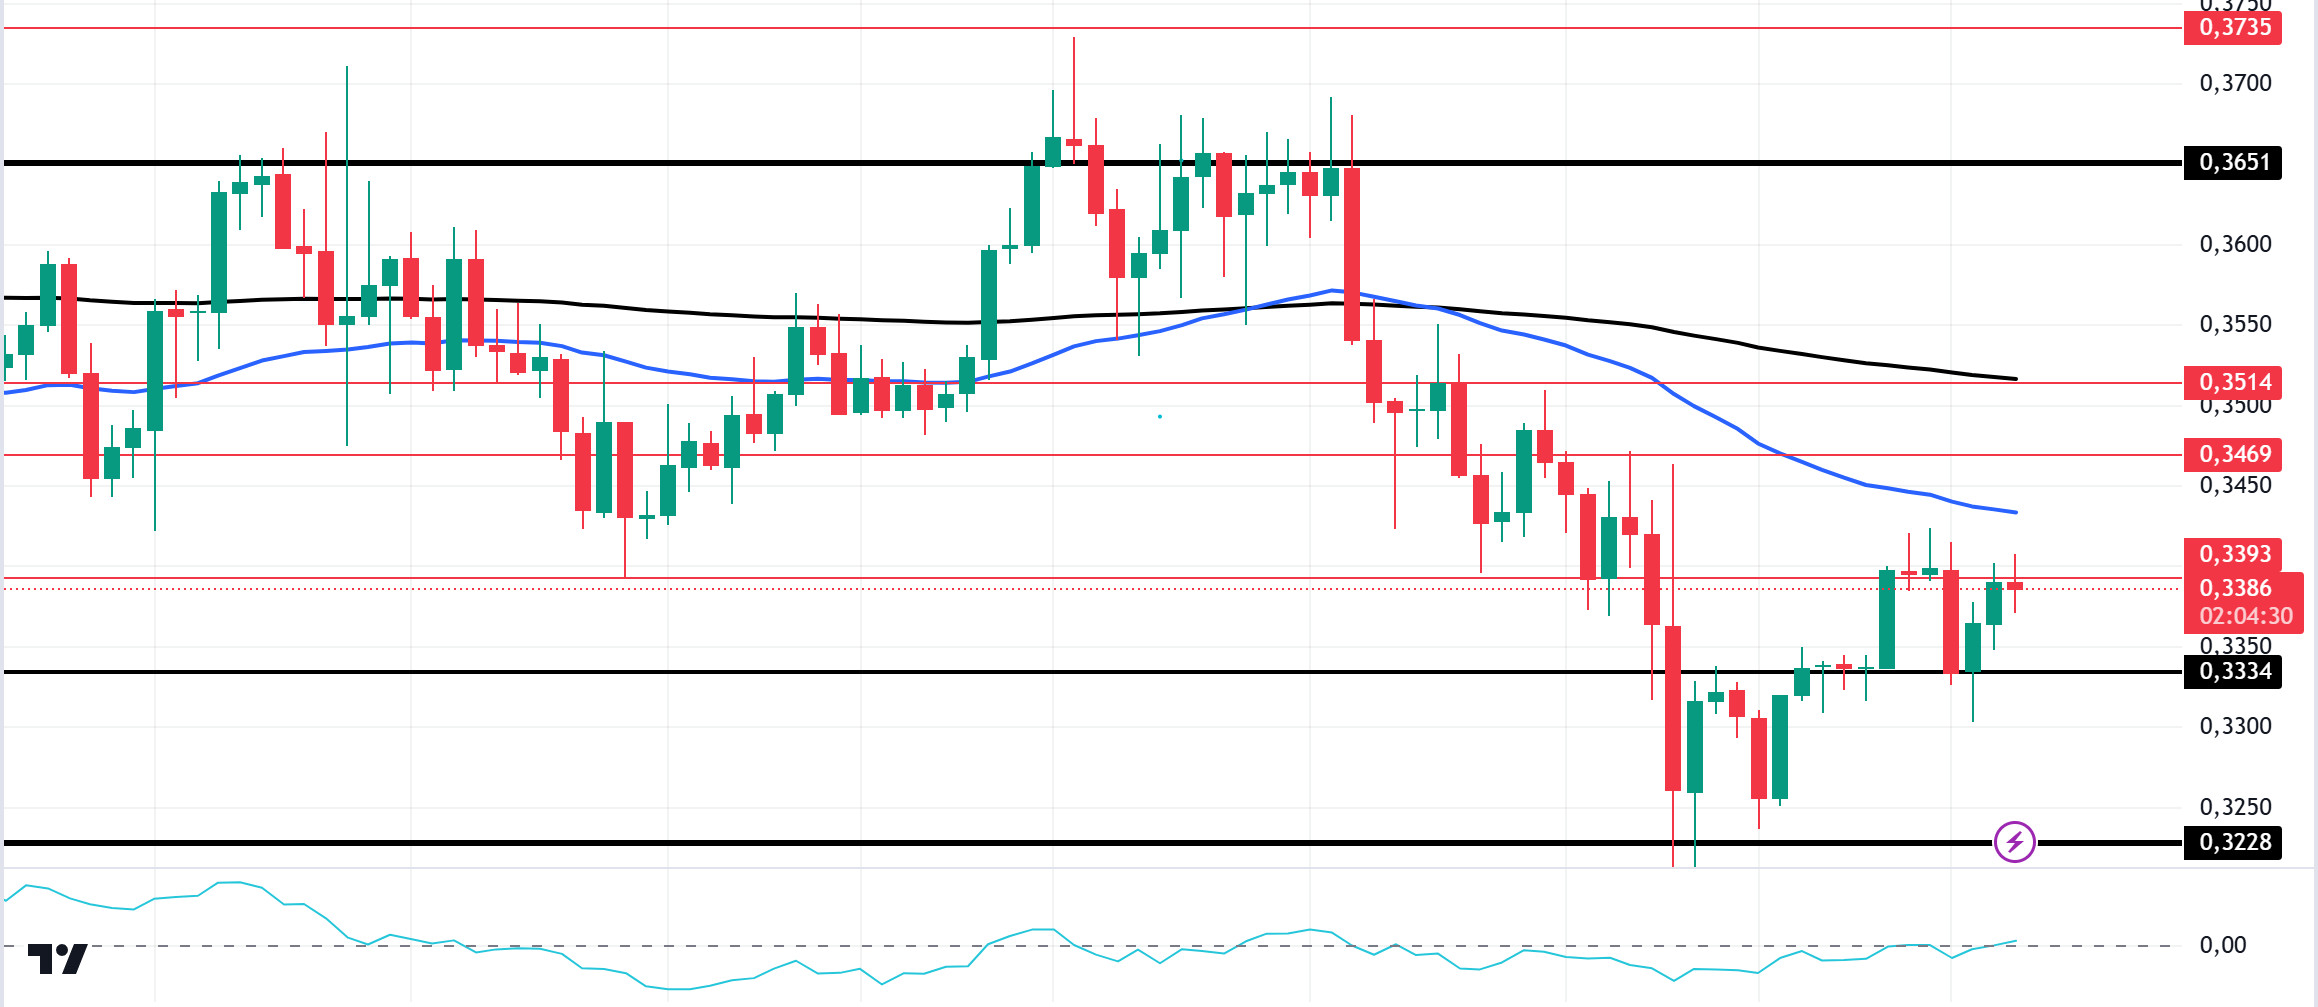
On the 4-hora chart, the price started pricing below the 50 EMA (Blue Line) and the 200 EMA (Black Line). At the same time, the 50 EMA is below the 200 EMA. This shows us that the trend is bearish. Cardano price is currently stuck en a three-month range after testing resistance twice and support three times. The Chaikin Money Flow (CMF)20 indicator has increased and turned positive. Therefore, we can see that money inflows are increasing. As a matter of fact, the price may test the 0.3651 level once again if it breaks through the 50 EMA and 200 EMA. If the decline continues, it may test the support level of 0.3228 once again. It may be appropriate to buy when it reaches this price level.
Supports 0.3393 – 0.3334 – 0.3228
Resistances 0.3469 – 0.3514 – 0.3651
AVAX/USDT
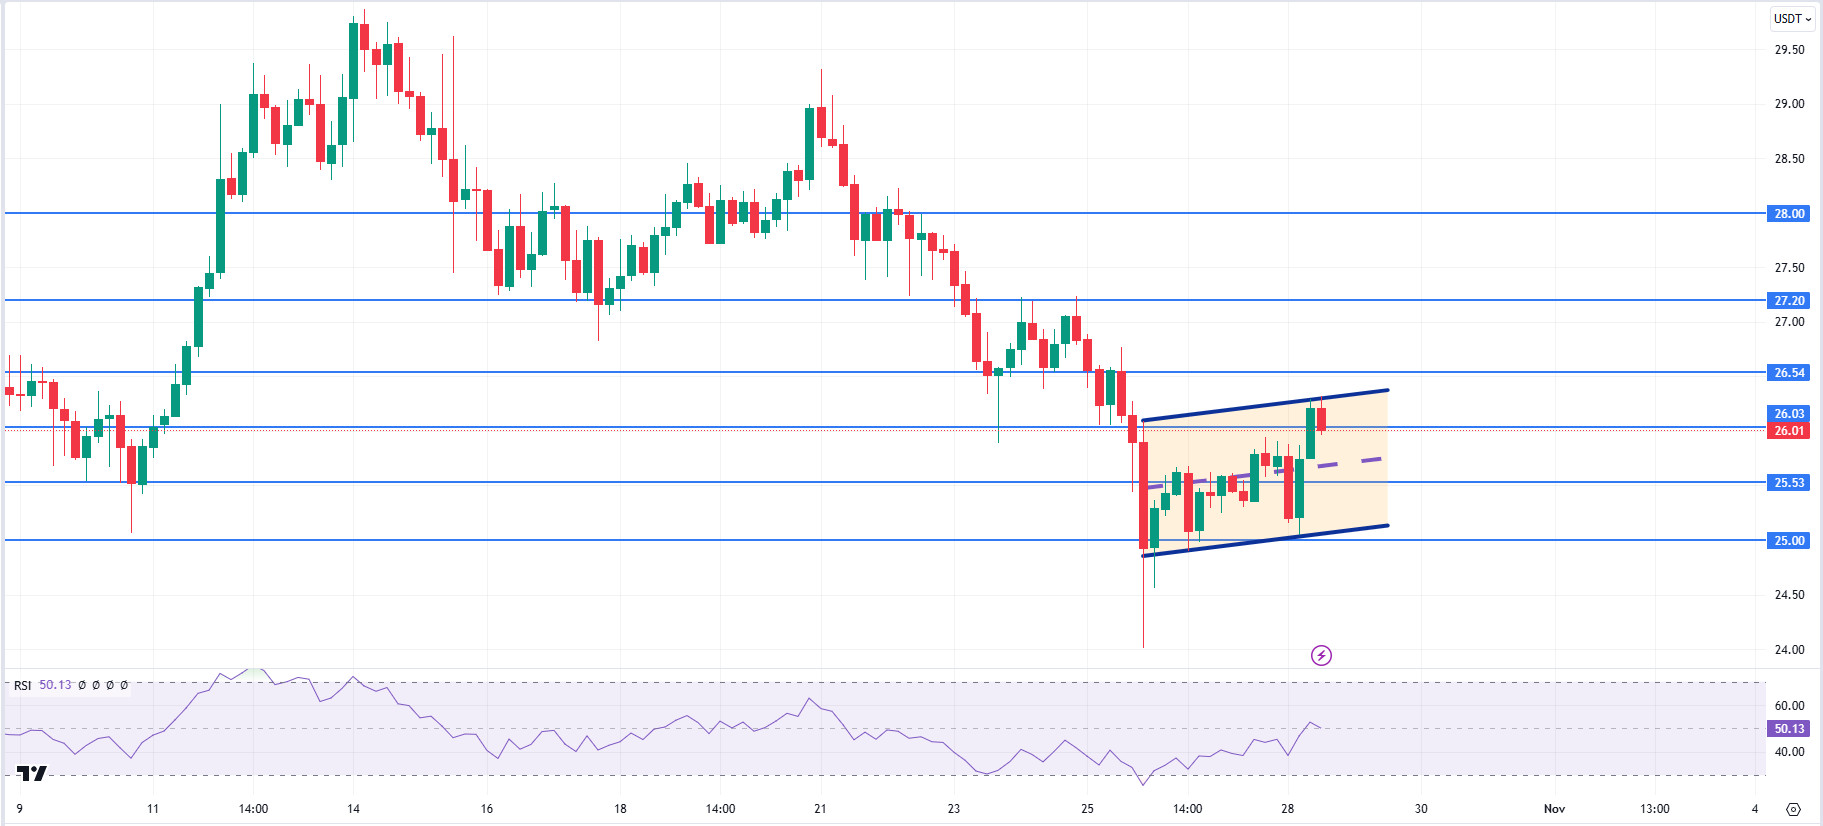
AVAX, which opened today at 25.77, is trading at 26.01, up about 1% during the day. Today, there is no planned data to be announced especially por the US and expected to affect the market. For this reason, it may be a low-volume day where we may see limited movements. Noticias flows from the Middle East will be important for the market.
On the 4-hora chart, it moves within the bullish channel. It is en the upper band of the bullish channel and with a Relative Strength Index value of 50, it can be expected to decline slightly from these levels. In such a case, it may move to the middle band of the channel and test the 25.53 support. On the other hand, if there is news that the tension en the Middle East is over, purchases may increase. In such a case, it may test 26.54 resistance. As long as it stays above 25.00 support during the day, the desire to rise may continue. With the break of 25.00 support, sales may increase.
Supports 26.03 – 25.53 – 25.00
Resistances 26.54 – 27.20 – 28.00
TRX/USDT
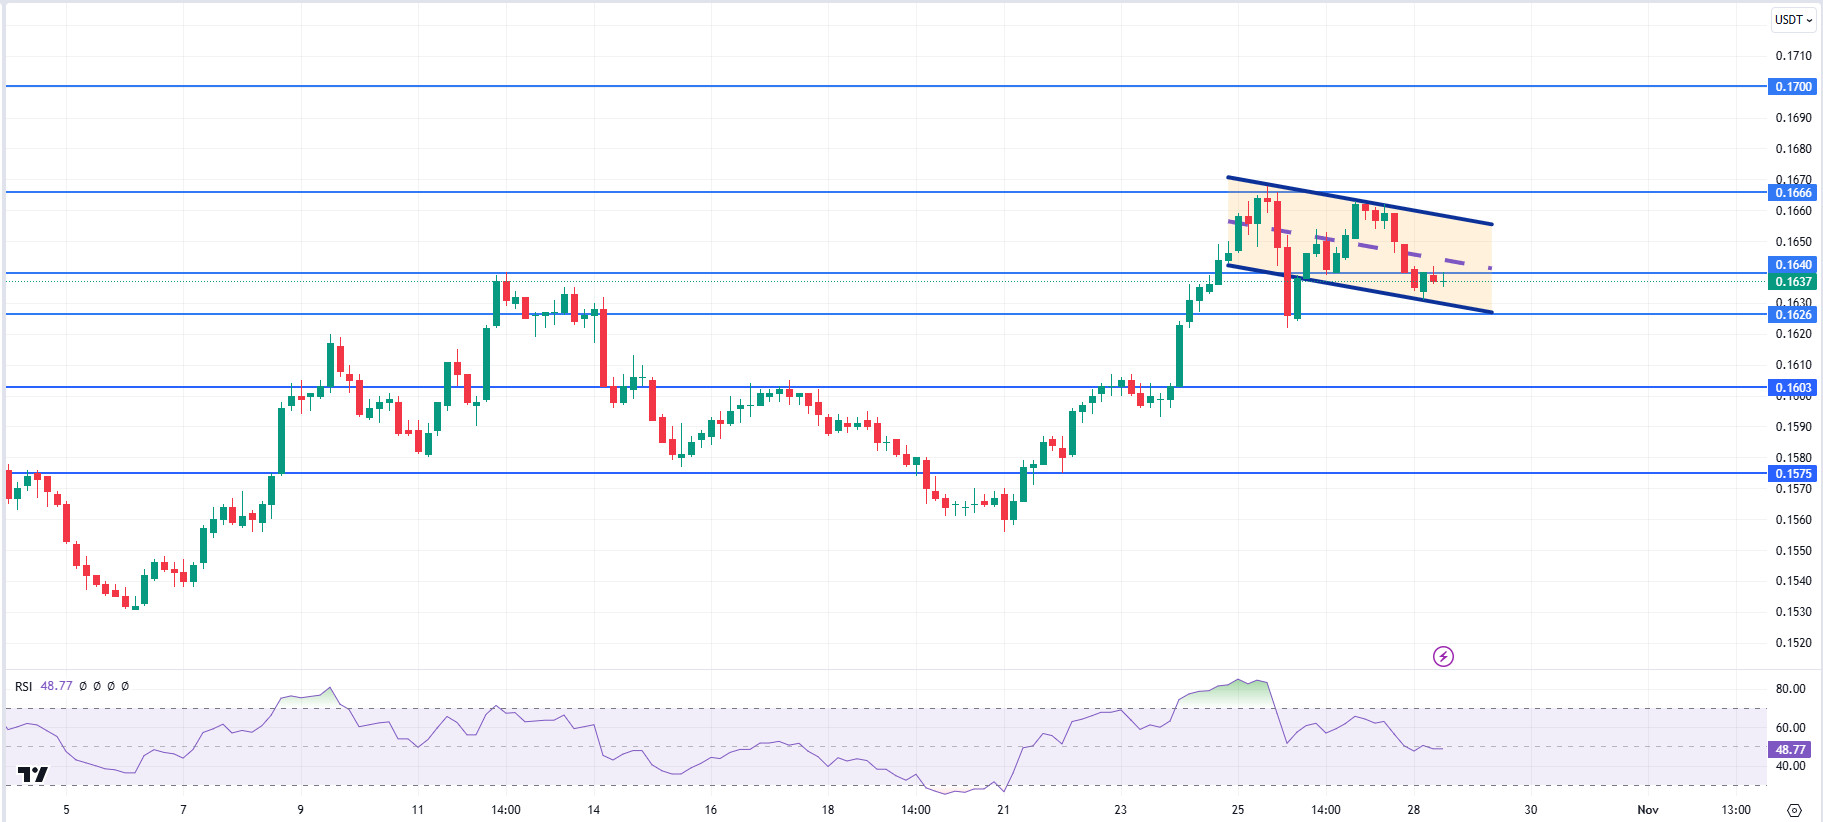
TRX, which started today at 0.1641, fell slightly during the day to 0.1637. There is no planned data for the market to follow today. The market will be closely following the news flows regarding the tension en the Middle East.
On the 4-hora chart, it moves within the bearish channel. The bearish channel is en the middle band and with a Relative Strength Index value of 48, it can be expected to rise slightly from its current level. In such a case, it may move to the upper band of the channel and test the 0.1666 resistance. However, if it cannot close the candle above the 0.1640 resistance or if there is a negative news flow about the increasing tension en the Middle East, it may test the 0.1626 support with the selling pressure that will occur. As long as TRX stays above 0.1482 support, the desire to rise may continue. If this support is broken downwards, sales can be expected to increase.
Supports 0.1626 – 0.1603 – 0.1575
Resistances 0.1640 – 0.1666 – 0.1700
DOT/USDT
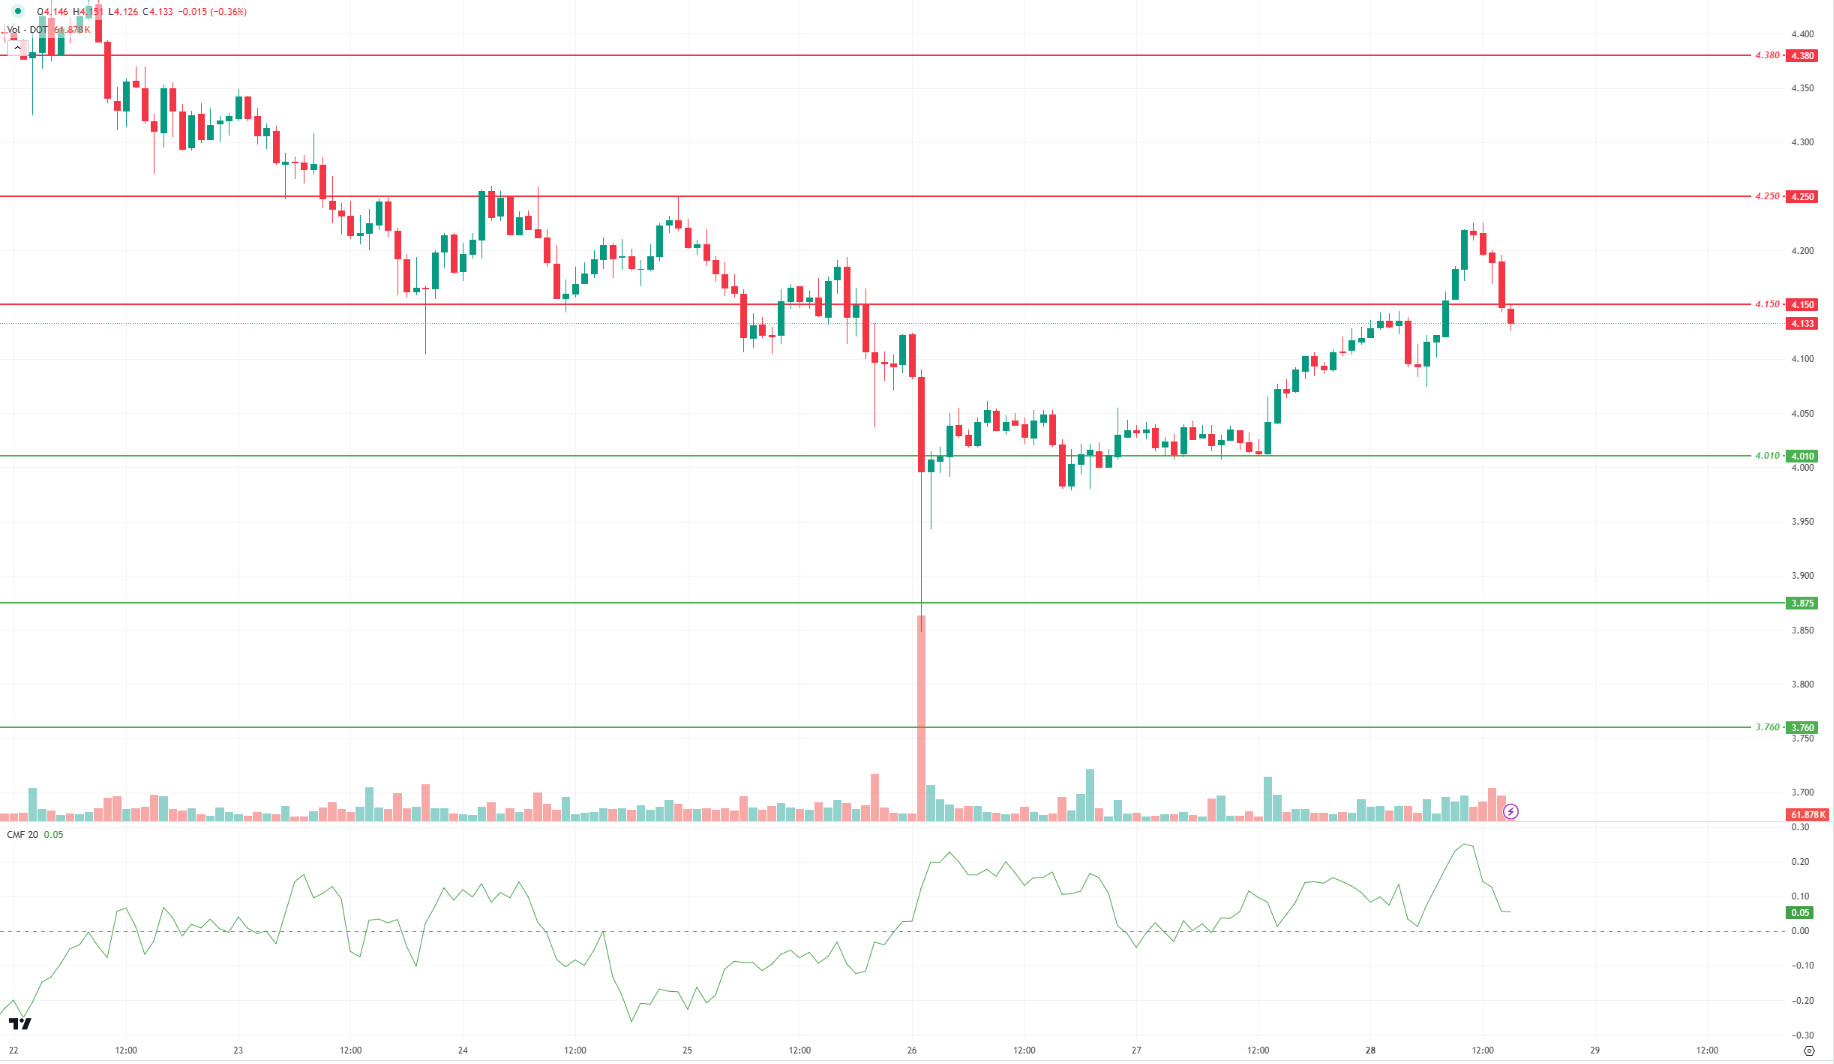
Polkadot (DOT) broke the 4.150 resistance level upwards and closed the 4-hora candle. When we analyze the Chaikin Money Flow (CMF) oscillator, we can say that the buyer pressure remains strong. In this context, if the price persists above the 4.150 level, it may move towards 4.250 levels. In the negative scenario, if the price persists below the 4.150 level, we can expect it to retreat towards 4.010 support levels.
Supports 4.010 – 3.875 – 3.760
Resistances 4.150 – 4.250 – 4.380
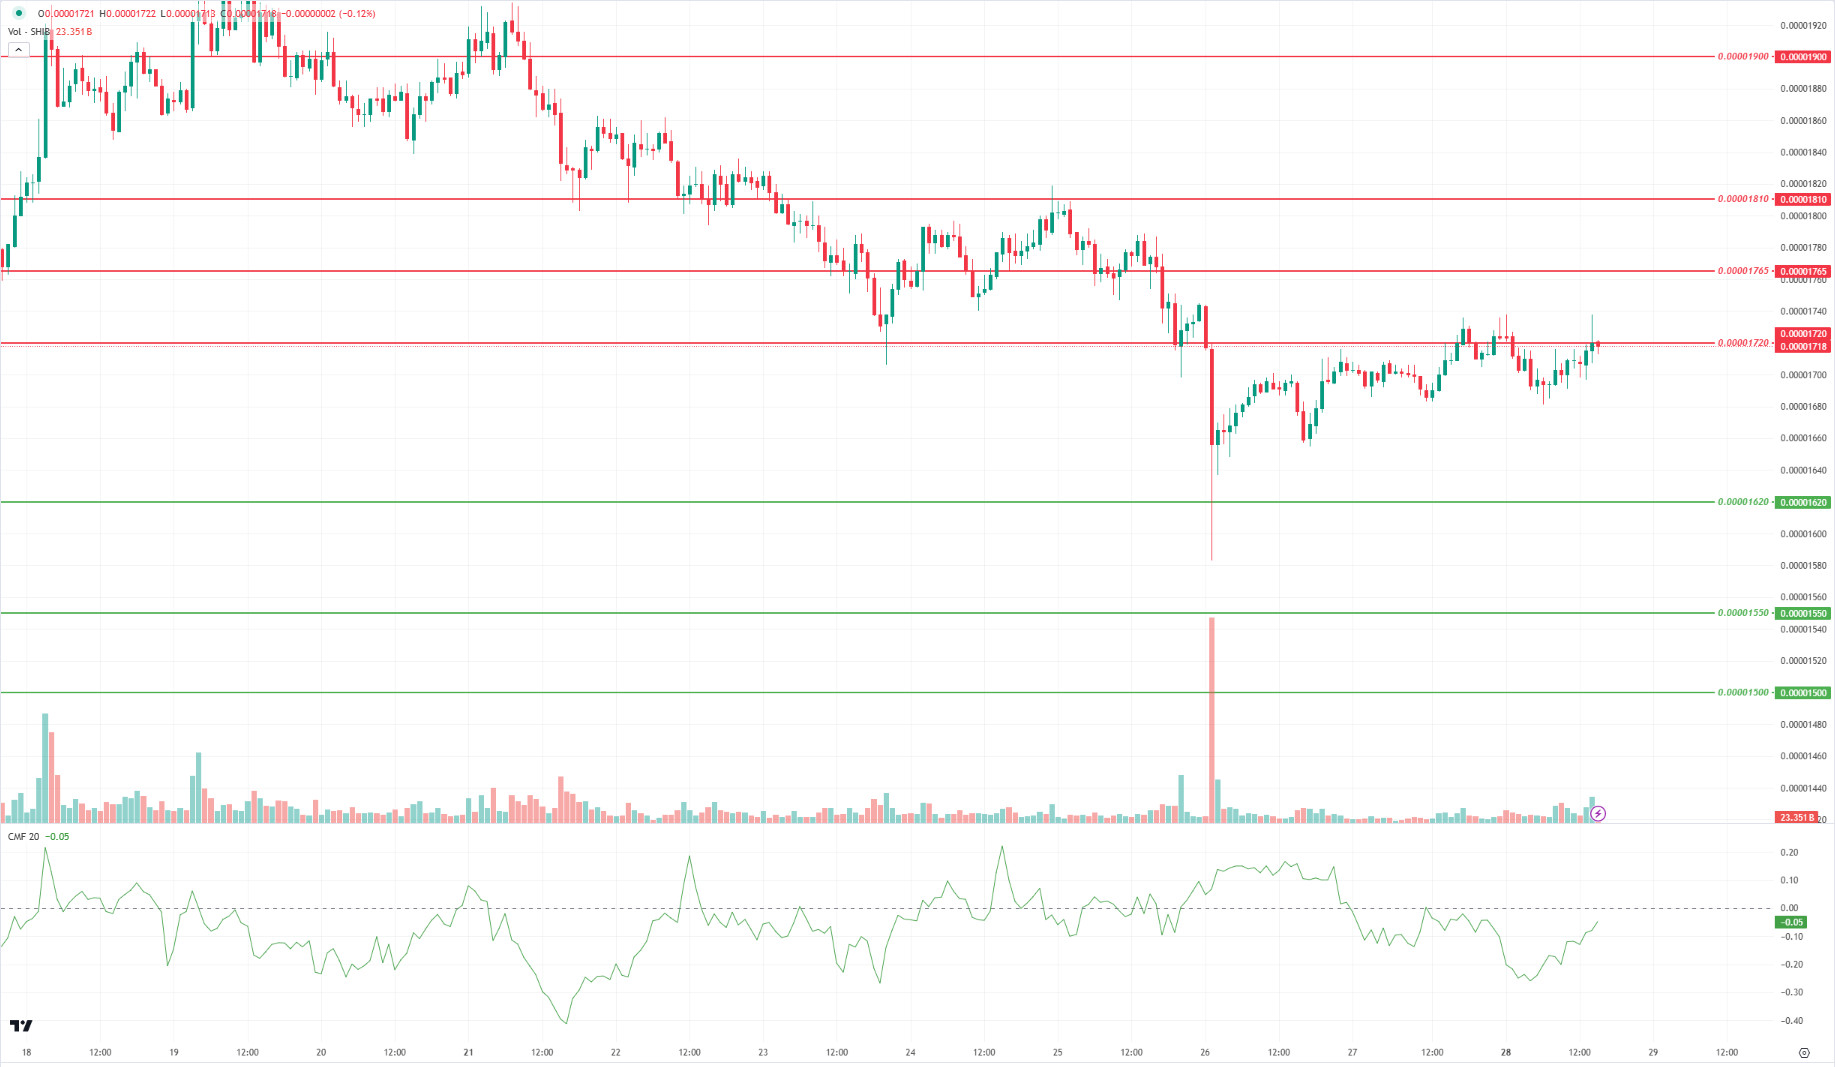
SHIB/USDT
Lucie, Shiba Inu’s marketing lead, announced an important strategic update for Shiboshi NFT owners el Shibarium. With this update, Shiboshi owners will be able to participate more actively en the ecosystem por adding new features and roles to their NFTs. There will also be more opportunities for interaction within the community through special events and rewards. These developments may increase interest en the Shiba Inu ecosystem and contribute to the growth of the ecosystem por increasing demand for Shiboshi NFTs.
SHIB broke the 0.00001720 resistance level upwards. If the price can maintain above the 0.00001720 resistance level, the upward movement may continue. If the price is permanent above the 0.00001720 level, we may see a movement towards 0.00001765 levels. On the other hand, when we examine the Chaikin Money Flow (CMF) oscillator, we can say that the selling pressure is stronger even if the market is buying. Accordingly, if the price breaks below the 0.00001720 level, it may retreat towards 0.00001620 levels.
Supports 0.00001620 – 0.00001550 – 0.00001500
Resistances 0.00001720 – 0.00001765 – 0.00001810
LEGAL NOTICE
The investment information, comments and recommendations contained herein do not constitute investment advice. Investment advisory services are provided individually por authorized institutions taking into account the risk and return preferences of individuals. The comments and recommendations contained herein are of a general nature. These recommendations may not be suitable for your financial situation and risk and return preferences. Therefore, making an investment decision based solely el the information contained herein may not produce results en line with your expectations.
