Technical Analysis
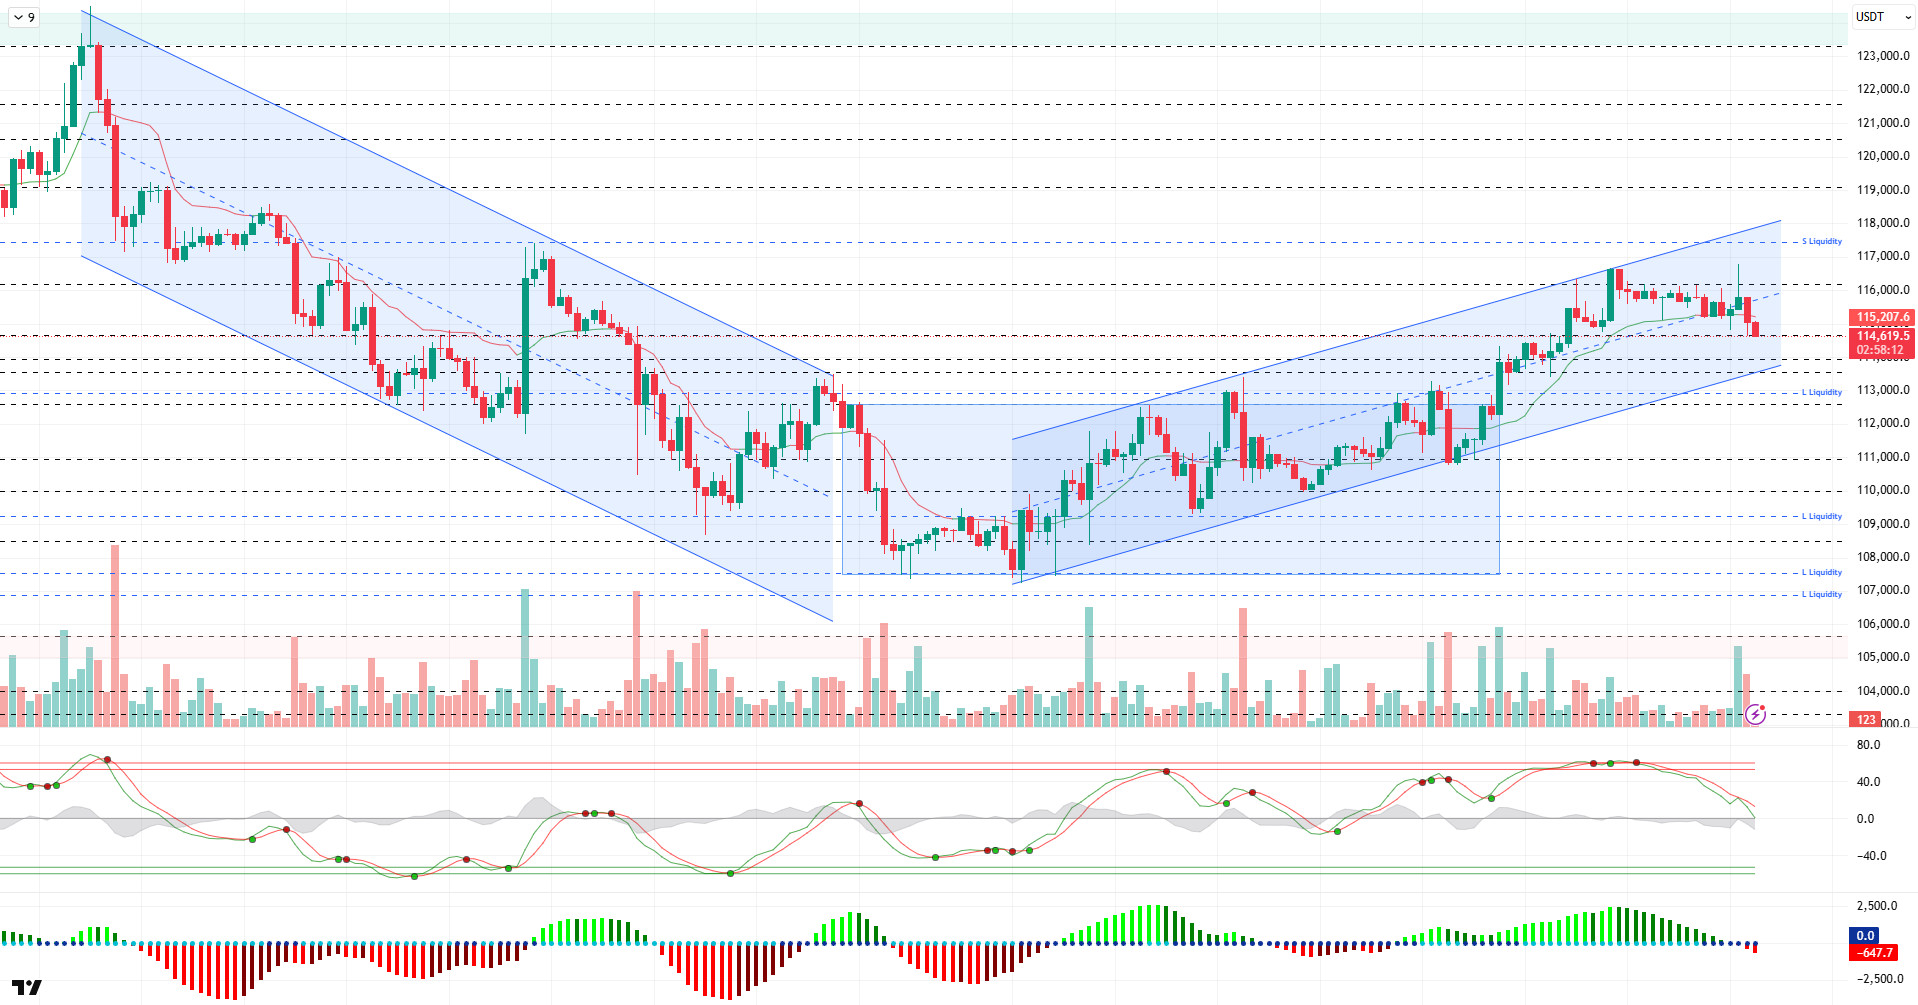
BTC/USDT
SEC Chairman Paul Atkins announced that they have adopted a new approach to corporate audits and will issue technical violation notices. US President Trump said that the requirement for companies to submit quarterly reports should be eliminated. Moody’s announced that the probability of a recession en the US over the next 12 months is 48%. While it is indicated that the Fed may cut rates por 25 bp this week, Powell is expected to take a cautious stance en October. Digital asset products saw inflows of $3.3 billion, while Strategy purchased an additional 525 BTC, bringing its total reserves to 638,985 BTC.
Looking at the technical picture, BTC, which spiked to 116,700 levels en the previous analysis, faced selling pressure and turned downward. Maintaining its bearish outlook at the time of writing, BTC continues to trade at the 114,800 level.
Technical indicators show that the Wave Trend (WT) oscillator failed to maintain its buy signal given at the middle band of the channel and continued its sell signal starting from the overbought zone. The Squeeze Momentum (SM) indicator’s histogram moved into negative territory. The Kaufman moving average is currently above the price, moving at the 115,230 level.
Looking at liquidity data, short-term heavy selling has accumulated en the 117,000-117,800 band, and testing these levels could result en $1.38 billion en liquidation. The buying level has consecutively gained weight en the short term around 114,000 and en the long term around 113,000, with the liquidation amount being approximately $1.3B.
In summary, the optimistic mood that had been lost en recent periods due to fundamental developments regained strength ahead of the upcoming meeting, with the announcement of US macro data and interest rate cut expectations becoming almost certain. Following the favorable ground provided por the technical outlook, the price completed its consolidation within the horizontal band it had been en for a long time and tested the 116,700 level with a minor upward channel. An examination of liquidity data reveals that buy and sell positions are balanced, accompanied por high volume. In the coming period, maintaining the upward channel formed por the price will be critical for the sustainability of the rise. Closes above the 115,000 level will be monitored as an important reference point for the continuation of the uptrend, and if momentum is regained, the 117,400 target zone can be tracked. In the event of potential selling pressure, the 113,500 – 113,000 band will be monitored as the first support and liquidity zone.
Supports: 115,000 – 114,000 – 113,500
Resistances: 116,100 – 117,400 – 119,000
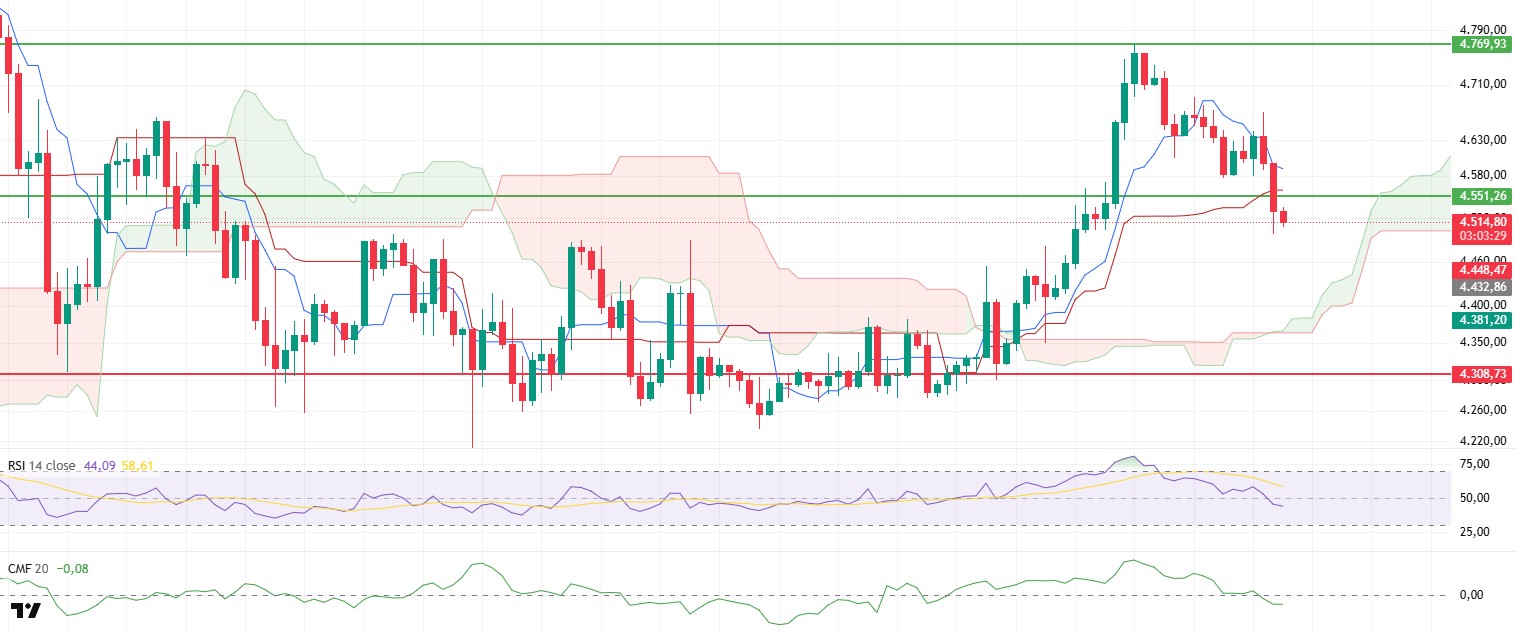
ETH/USDT
In the evening, Ethereum prices showed a noticeable decline, contrary to the positive outlook seen en the morning. China’s decision to deepen its anti-monopoly investigation into US chipmaker Nvidia dampened risk appetite en the markets, causing the ETH price to fall sharply to the $4,500 level. The upward momentum maintained en the first half of the day appears to have been broken por this news flow.
On the liquidity side, the Chaikin Money Flow (CMF) indicator confirms that selling pressure has intensified and market players are increasingly inclined to close their positions por moving into negative territory. This suggests that any attempts at a short-term recovery en price may be weak.
Looking at the Ichimoku indicator, it is noteworthy that the price has lost both the Tenkan and Kijun levels. This structure suggests that short-term selling pressure may continue and that the price may show a tendency to move below the cloud. At the same time, the Relative Strength Index (RSI) falling below the 50 level confirms that momentum is weakening, supporting the short-term negative outlook.
The critical threshold for the evening horas stands out at the $4,551 level. If the price regains this level, the possibility of a rebound may increase, and retesting the $4,769 region may come into play. However, if sustainability above this level cannot be achieved, the likelihood of continued downward pressure and a pullback towards the $4,308 level increases.
Support levels: 4.308 – 4.196 – 4.084
Resistance levels: 4,551 – 5,857 – 5,000
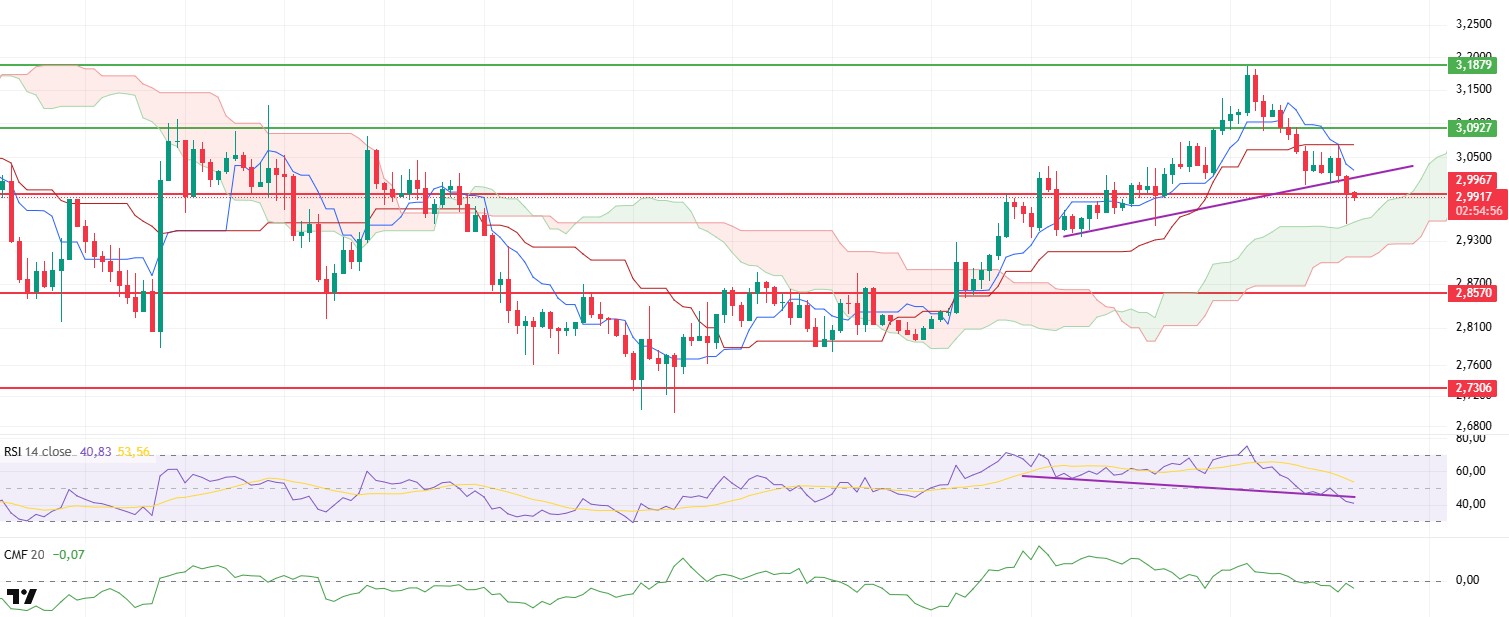
XRP/USDT
In the evening horas, following intraday fluctuations en the XRP price, the critical $2.99 level appears to remain important. With the market decline experienced during the day, this support was lost, and the price retreated to the upper band of the kumo cloud at the $2.95 level. However, with the reactionary buying that came from this point, XRP is trying to regain the $2.99 level.
On the liquidity side, the Chaikin Money Flow (CMF) indicator remaining en negative territory confirms that capital outflows are continuing and buyers remain weak. The Ichimoku indicator shows a sell signal formed por the Tenkan level cutting below the Kijun level, and the price is reacting to the kumo cloud. This structure indicates increased uncertainty en the short term and that the price is searching for direction.
Despite the positive divergence that stood out en the morning horas el the Relative Strength Index (RSI), the indicator fell below the 50 level as selling continued. This reveals that momentum is weakening and buyers are losing strength.
Consequently, if the price closes below the $2.99 level en the evening, combined with weakness en technical indicators, it could lead to deeper declines, bringing levels below $2.90 into focus. Conversely, if the $2.99 level holds, the possibility of the price retesting the $3.09 level remains el the table.
Support levels: 2.8570 – 2.7306 – 2.6513
Resistance levels: 2.9967 – 3.0927 – 3.3058
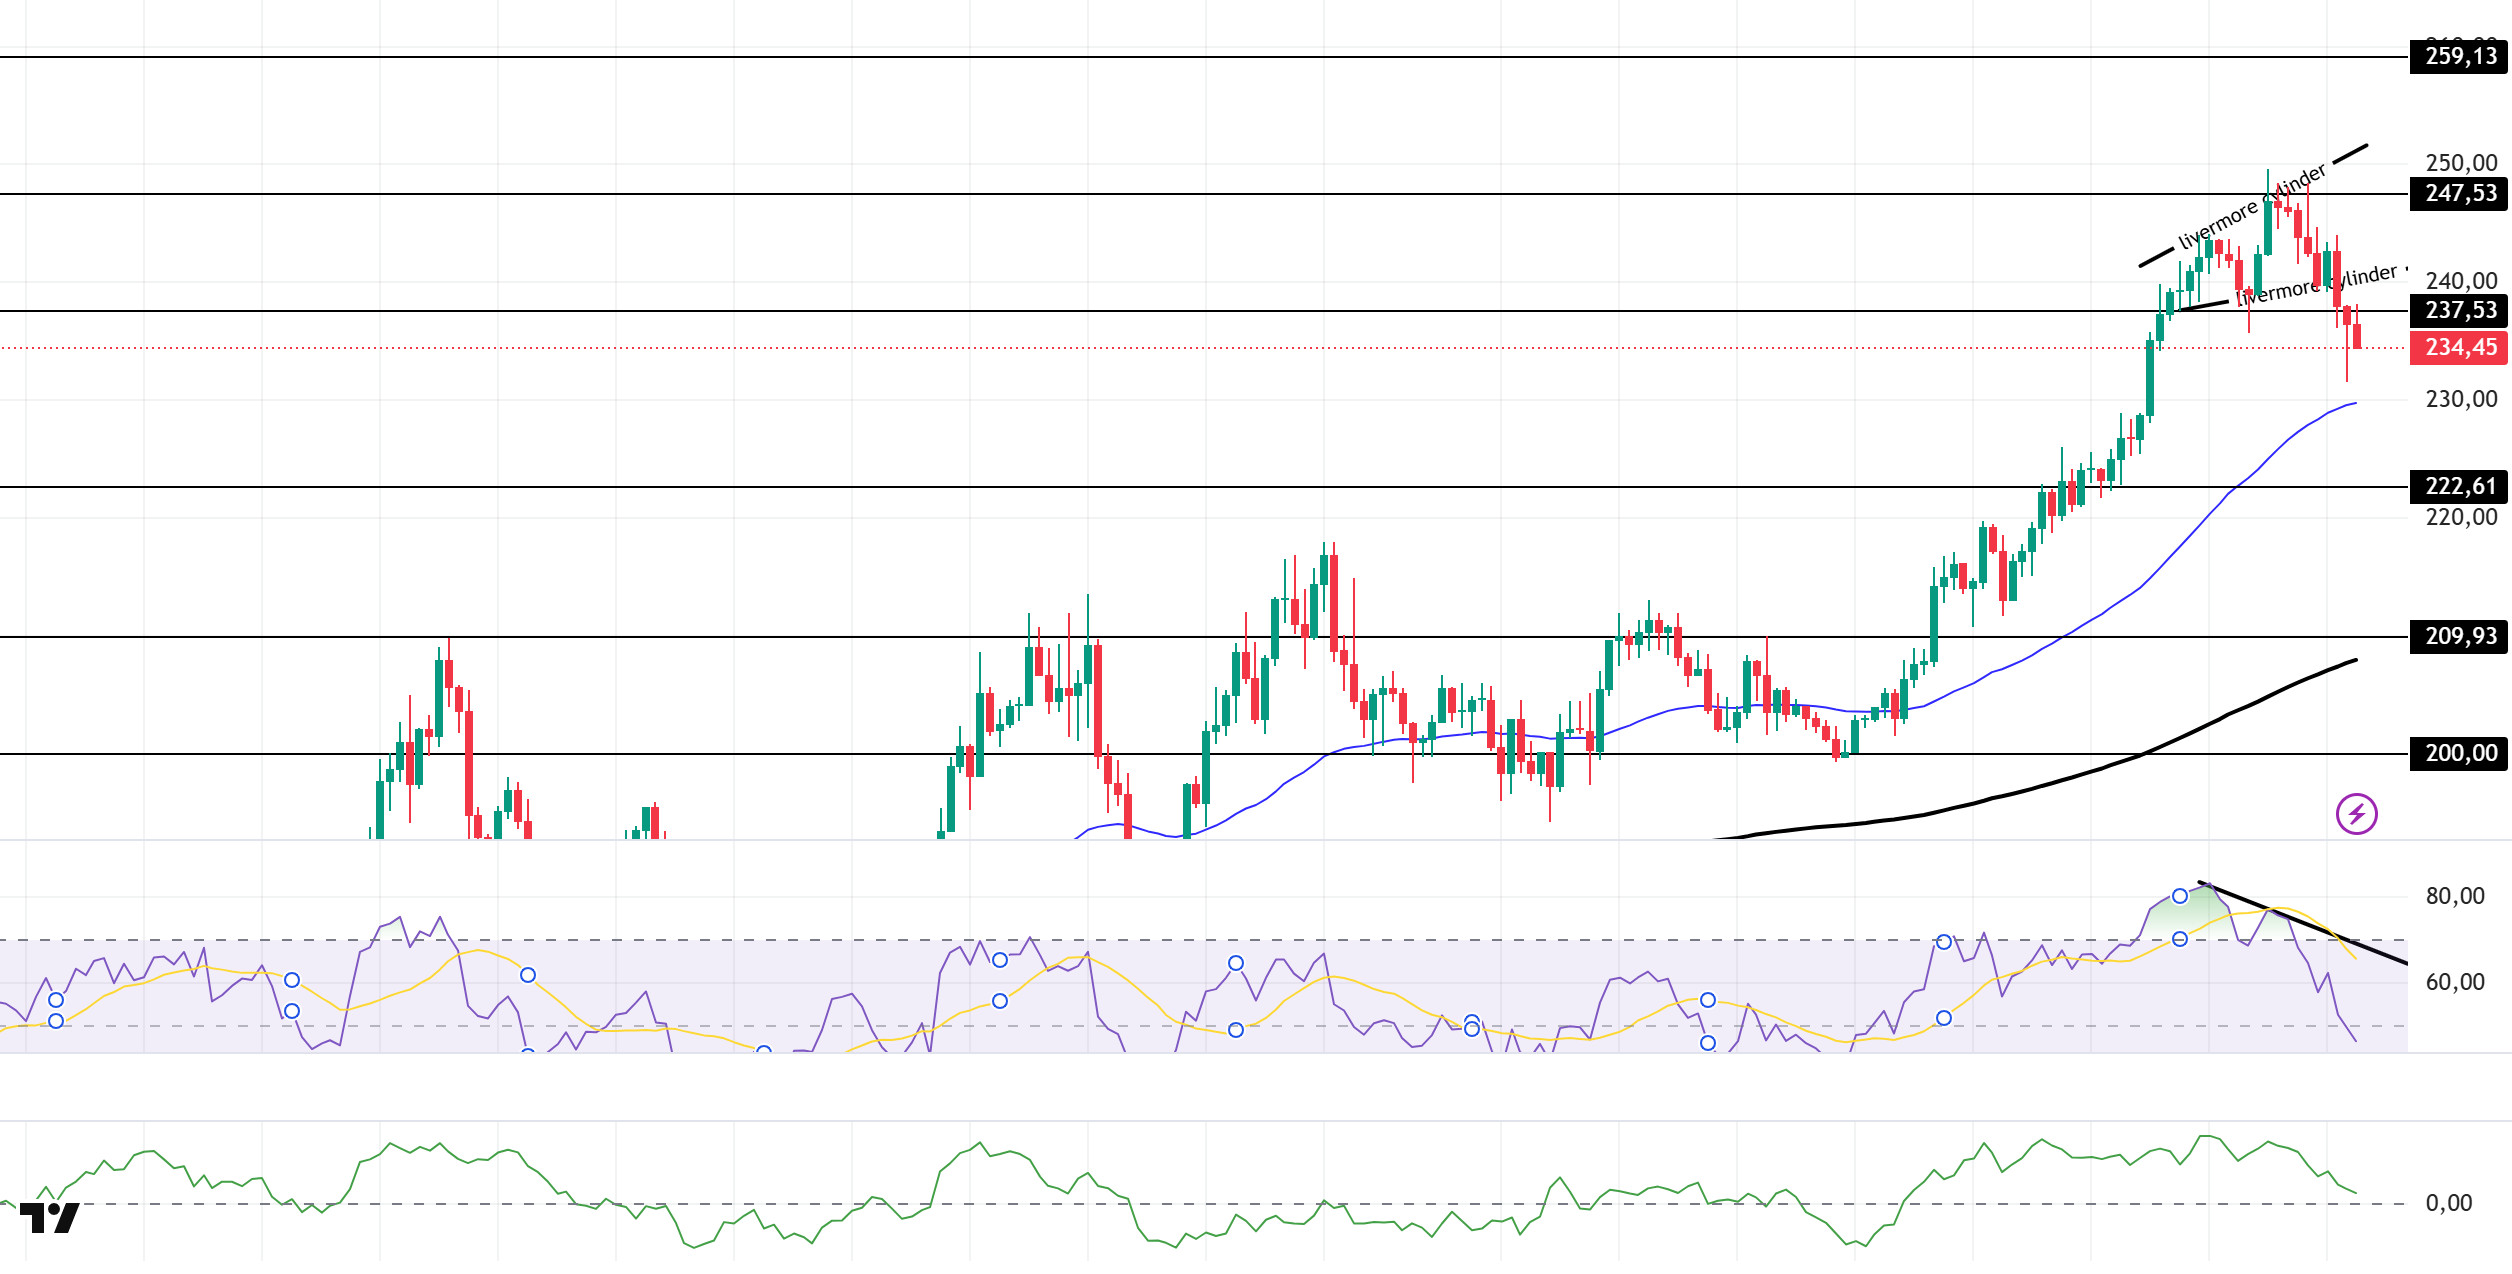
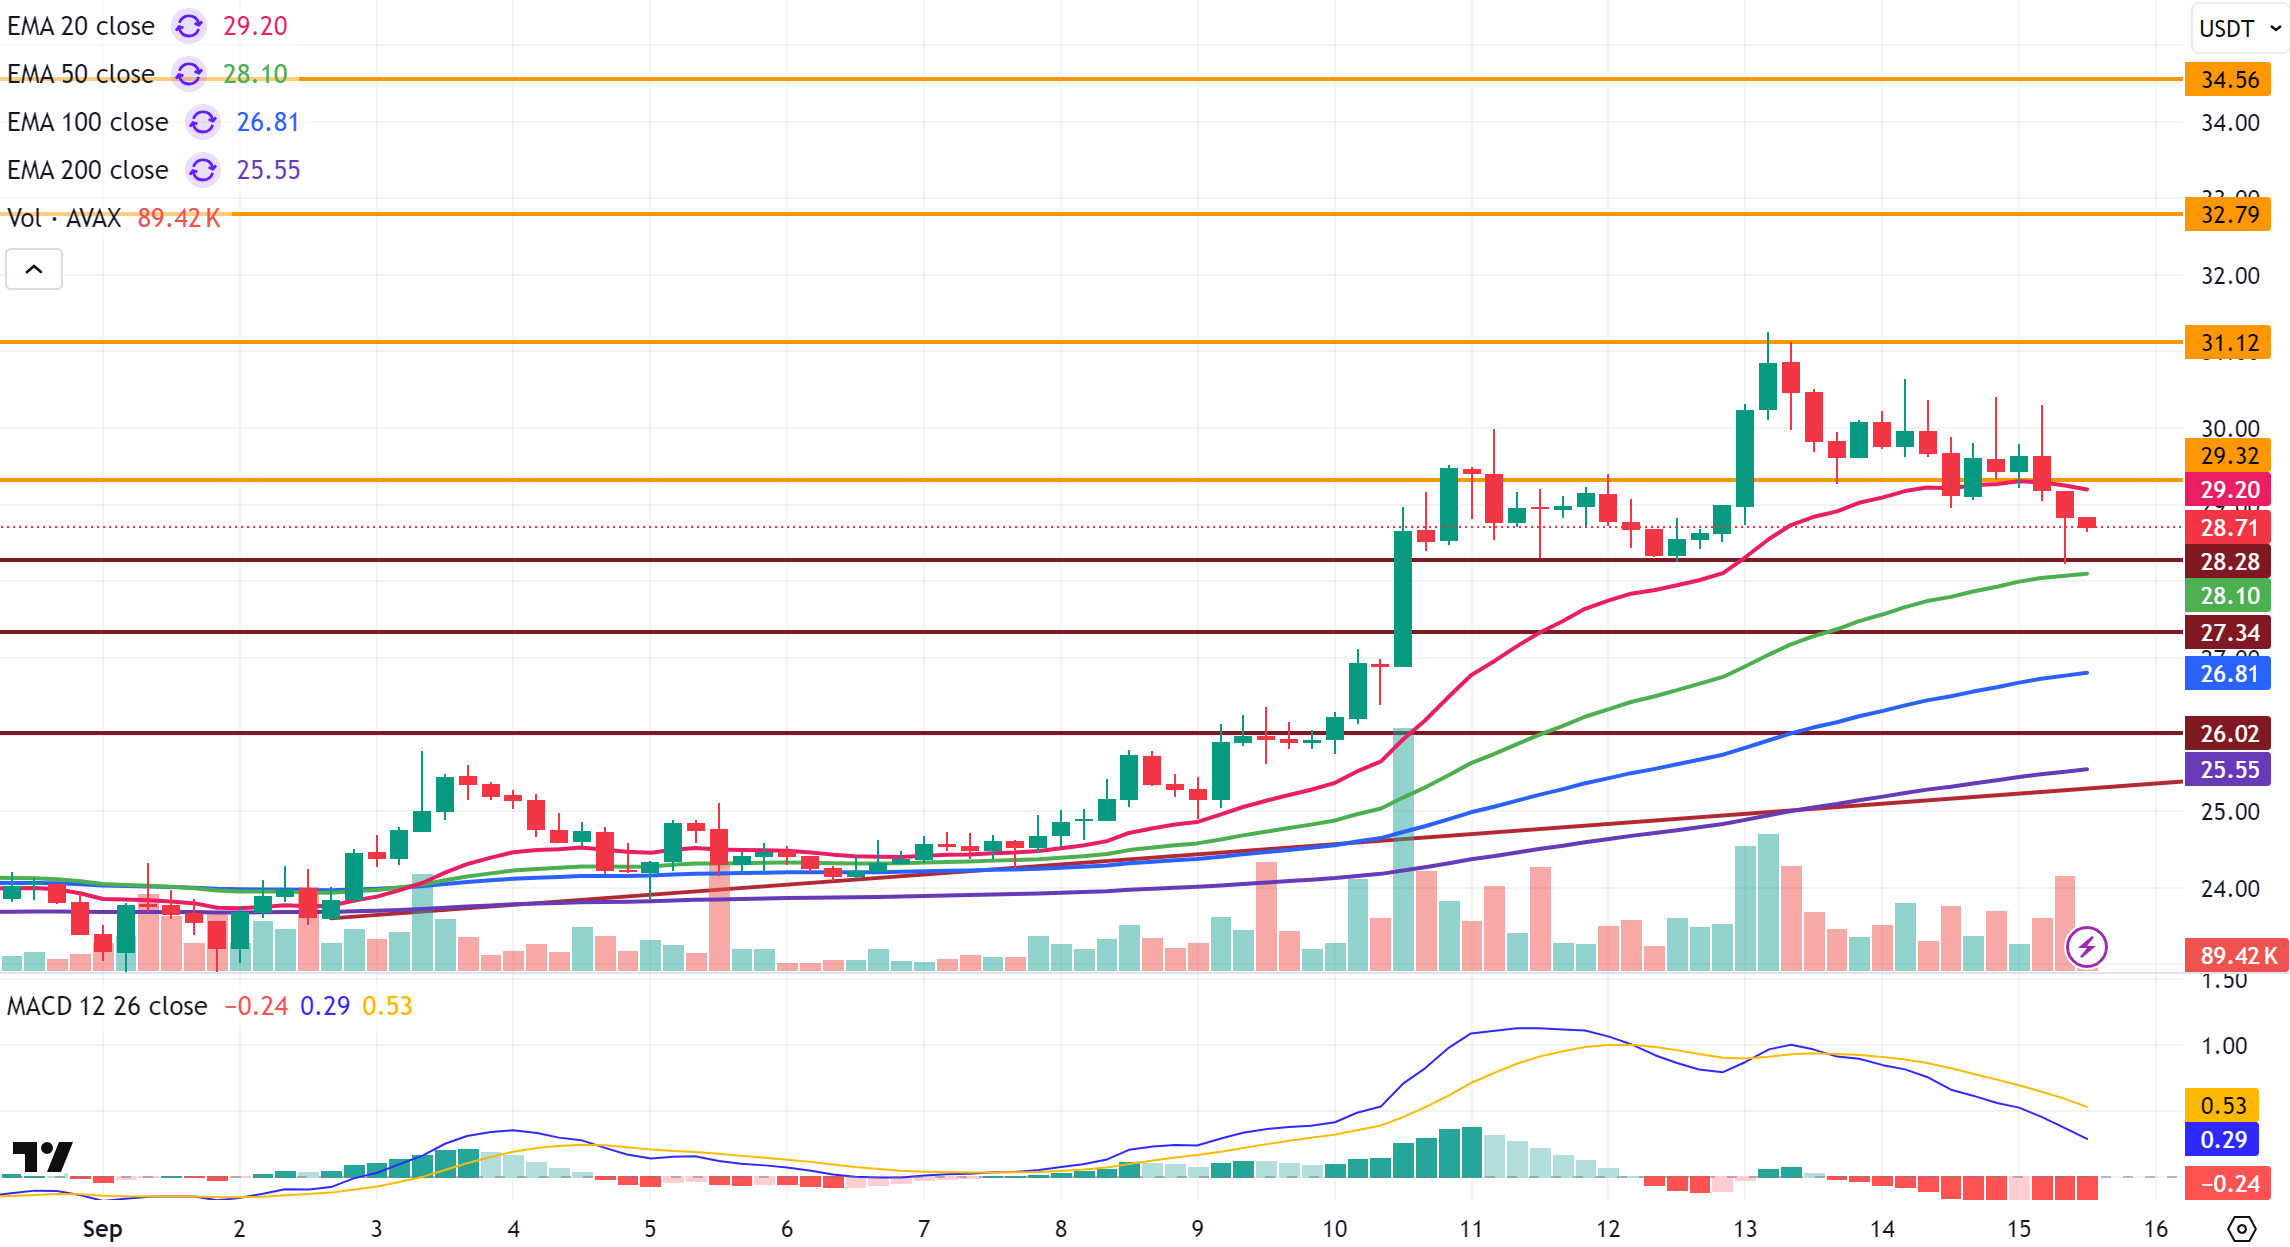
SOL/USDT
Forward Industries purchased $1.58 billion worth of SOL. The purchases were made at an average price of $232.
The SOL price showed a slight decline during the day. The asset experienced a pullback por breaking down the livermore cylinder pattern formation that began el September 12 and is currently testing the strong resistance level of $237.53. If it closes above this level, it may test the $247.53 level. During pullbacks, the 50 EMA (Exponential Moving Average) can be monitored.
On the 4-hora chart, it continues to trade above the 50 EMA (Exponential Moving Average – Blue Line) and 200 EMA (Black Line). This indicates that the medium-term upward trend may continue. At the same time, the price being above both moving averages shows us that the market is trending upward en the short term. The large difference between the two moving averages indicates that the asset may be en a sideways or downward trend. Chaikin Money Flow (CMF-20) remained en positive territory. However, a decrease en cash inflows could push the CMF into negative territory. The Relative Strength Index (RSI-14) retreated from the positive zone to the neutral level and its position en the lower zone of the downtrend that began el September 12 indicated increased selling pressure. In the event of an uptrend due to macroeconomic data or positive news related to the Solana ecosystem, the $247.53 level stands out as a strong resistance point. If this level is broken upwards, the uptrend is expected to continue. If pullbacks occur due to developments en the opposite direction or profit-taking, the $222.61 level could be tested. A decline to these support levels could increase buying momentum, presenting a potential upside opportunity.
Supports: 222.61 – 209.93 – 200.00
Resistances: 237.53 – 247.53 – 259.13
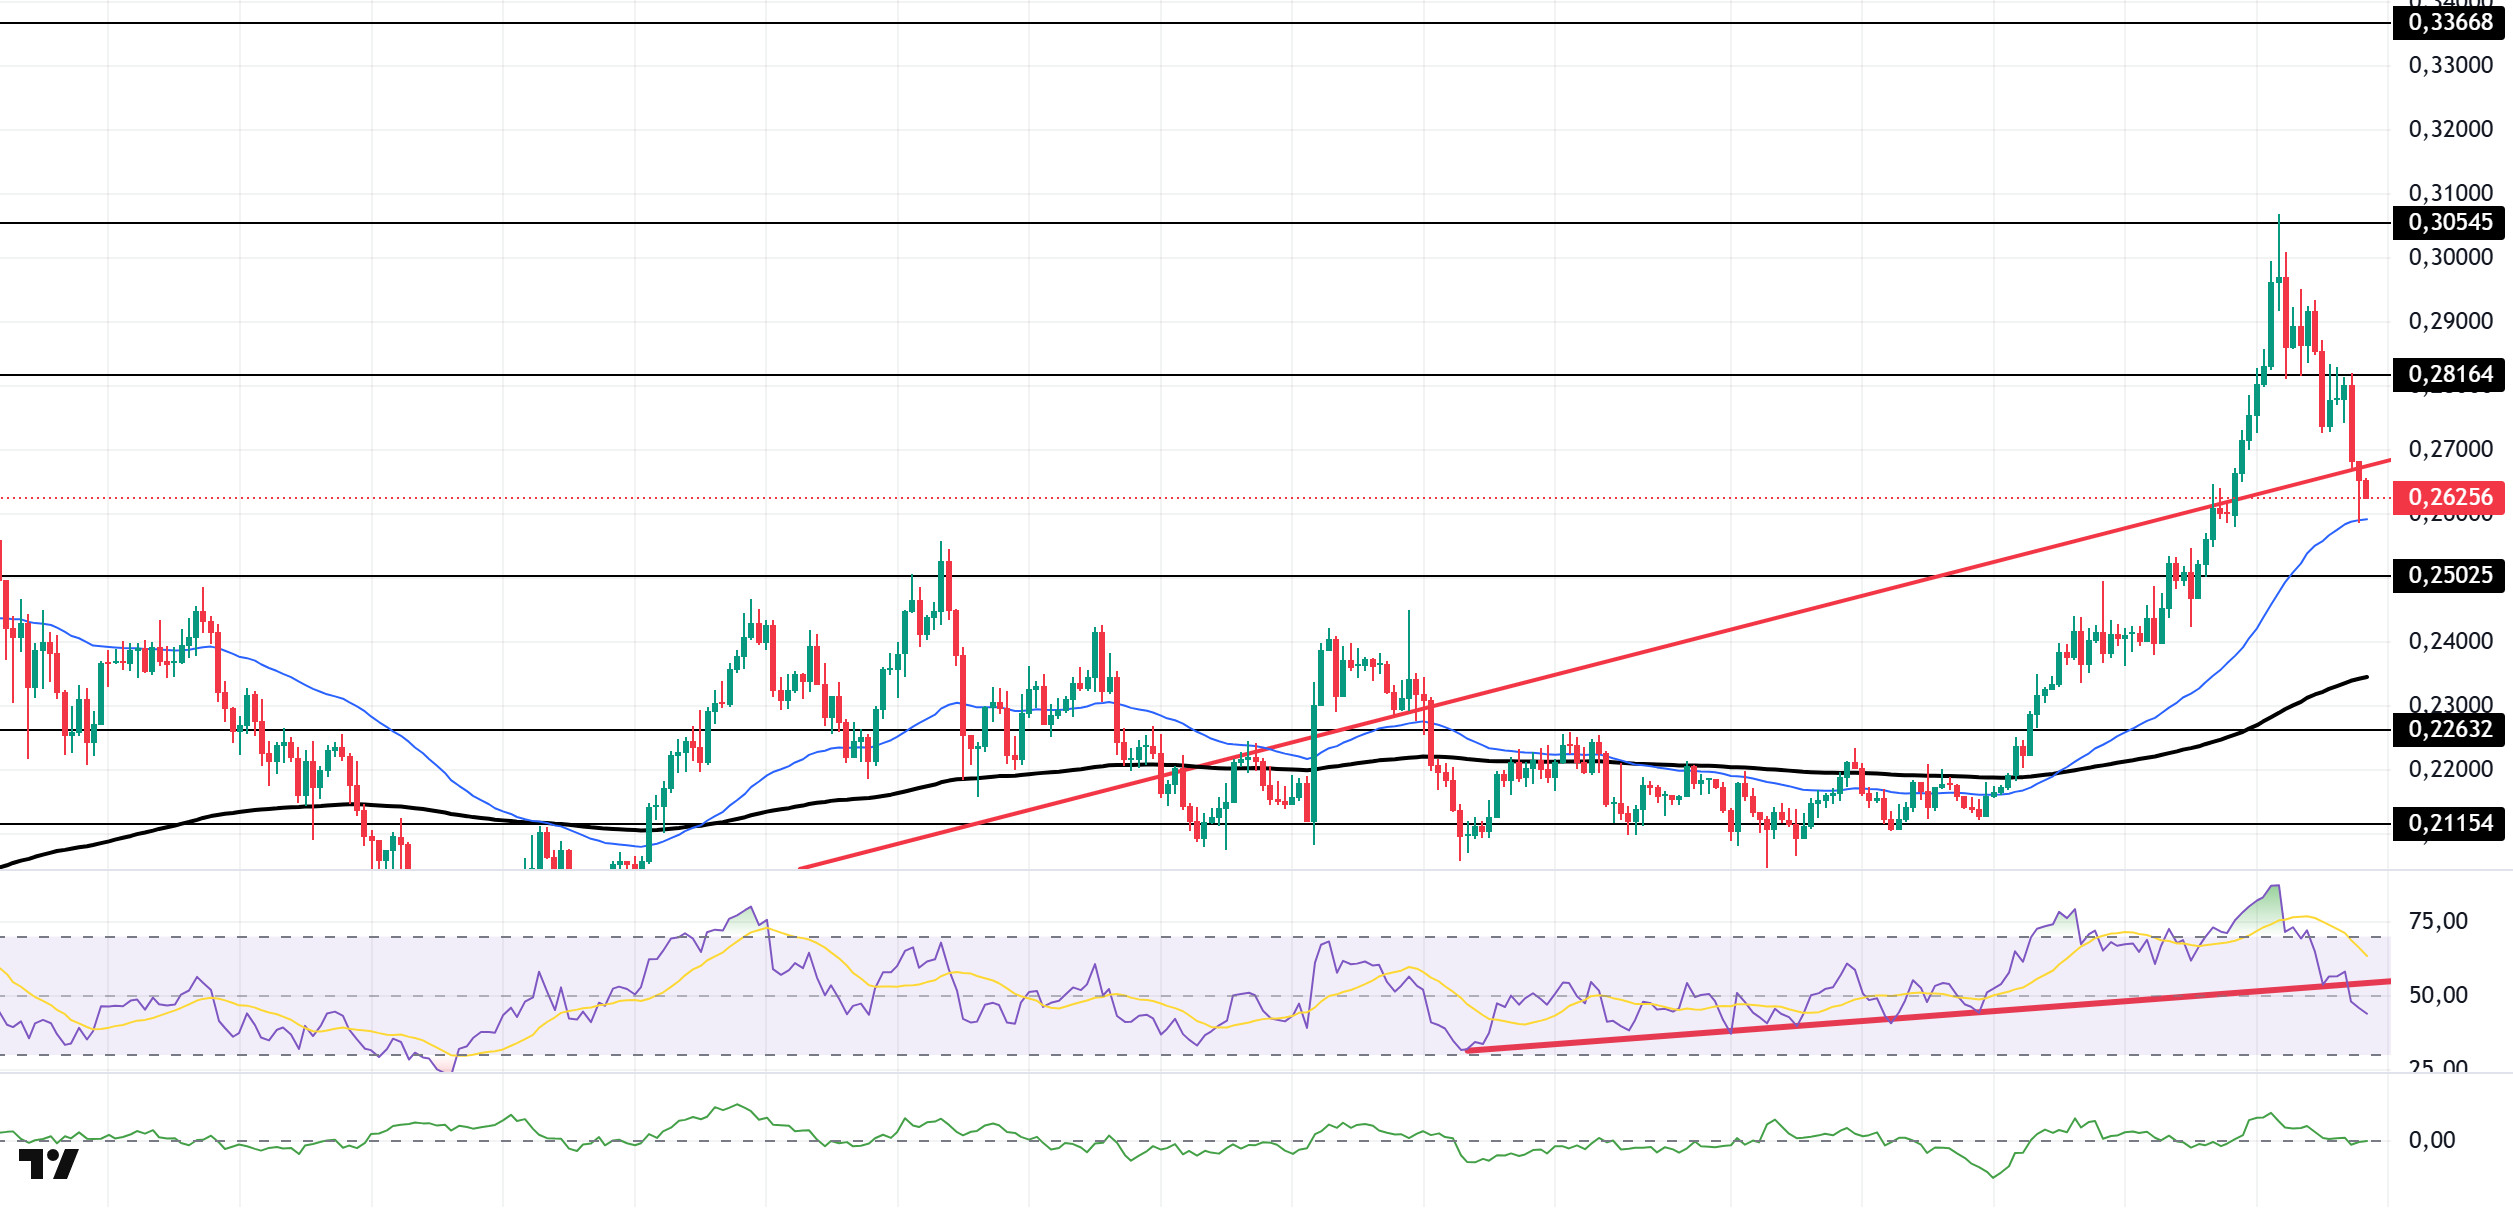
DOGE/USDT
The DOGE price experienced a decline during the day. The asset tested the rising trend that began el August 3 as support and broke below it, deepening its pullback. Currently testing the 50 EMA (Exponential Moving Average – Blue Line) as support, the price could test the $0.25025 level if it closes below this level. In the event of an uptrend, the upward trend could act as resistance.
On the 4-hora chart, the 50 EMA (Blue Line) remained above the 200 EMA (Black Line). This indicates that the medium-term upward trend is continuing. The price being above both moving averages indicates that the upward trend is strong en the short term. A large difference between the two moving averages may cause the asset to pull back or move sideways. The Chaikin Money Flow (CMF-20) also remained at a neutral level. Additionally, a decrease en money inflows could push the CMF into negative territory. The Relative Strength Index (RSI-14) continued to pull back and crossed below the rising trend that began el August 26. This signaled increased selling pressure. In the event of potential upward movements driven por political developments, macroeconomic data, or positive news flow within the DOGE ecosystem, the $0.28164 level stands out as a strong resistance zone. Conversely, en the event of negative news flow, the $0.25025 level could be triggered. A decline to these levels could increase momentum and potentially initiate a new upward wave.
Supports: $0.25025 – $0.22632 – $0.21154
Resistances: 0.28164 – 0.30545 – 0.33668
AVAX/USDT
The decline seen en AVAX yesterday continues today. Starting today at $29.43, AVAX is trading at $28.70 after losing approximately 2.5% of its value. AVAX tested the $29.32 support level during its decline and broke below this level. The gradual rise seen last week gave way to a decline el the first day of the new week. Thus, it appears to have lost its upward momentum and moved downward from the horizontal band.
On the technical indicators side, the Moving Average Convergence/Divergence (MACD) line el the 4-hora chart is below the signal line, indicating that negative momentum is strengthening. This points to a possible continuation of the decline en AVAX. Furthermore, AVAX trading below the 20-period Exponential Moving Average (EMA20) confirms that selling pressure is prevailing en the short term.
If the downward movement continues en the short term, the first support level for AVAX’s decline is $28.28. If this level is also broken, selling pressure may increase, and AVAX is likely to retreat to the $27.34 support level. In a deeper decline scenario, the $26.02 level will come into focus as a critical support. In the opposite scenario, AVAX first needs to regain the $29.32 level it lost to recover. If it manages to stay above this level, the first target for the upward movement will be $31.12, followed por the $32.79 resistance levels. Overall, AVAX is painting a weaker picture compared to this morning. The deepening momentum loss and the price falling below $29.32 indicate that selling pressure may continue en the short term. However, if strong buying comes en, the price may find a chance to rebound upward again.
(EMA20: Pink Line, EMA50: Green Line, EMA100: Blue Line, EMA200: Purple Line)
Supports: 28.28 – 27.34 – 26.02
Resistances: 29.32 – 31.12 – 32.79
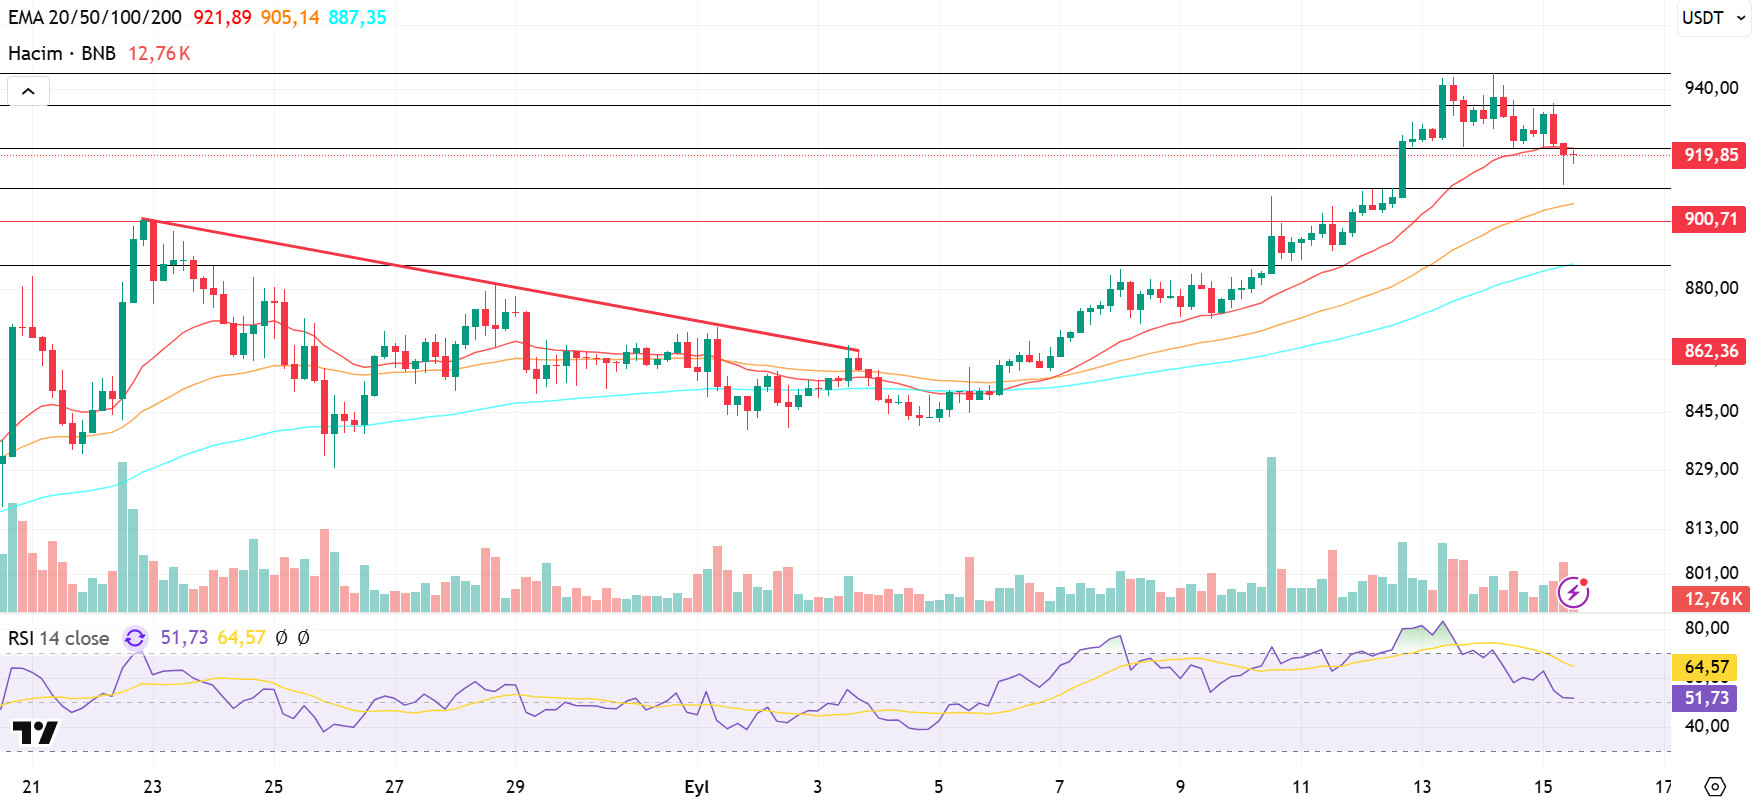
BNB/USDT
From a technical perspective, BNB/USDT, which ended its correction movement starting from the previous peak level of $900 at the $840 level, continued its rise with strong support from this region and recorded new historical highs. Accordingly, BNB, which approached the $950 level, retreated due to selling pressure from that level. After the pullback, the price experienced a correction down to the $910 level, followed por a limited recovery trend. However, this recovery was not sustainable, and the pullback trend continued after the correction.
Technical indicators for BNB/USDT, currently trading en the $910–920 range, point to the asset entering a short-term decision phase due to recent changes en trading volume. Additionally, the Relative Strength Index (RSI) rose above the 70 level with the recent increases but encountered resistance at this level and retreated towards the 50 level. This RSI pattern suggests that the possibility of a short-term correction persists.
Based el the current technical picture, if selling pressure increases, the price is likely to retreat back to the $910 support level. If this level is broken downwards, the price is expected to fall to the $900 and $885 levels, respectively. On the other hand, if buying appetite is maintained, BNB is expected to test the $920 resistance level en the first stage. If this level is broken, the price may move towards the $935 and $945 levels.
Supports: 910 – 900 – 885
Resistances: 920 – 935 – 945
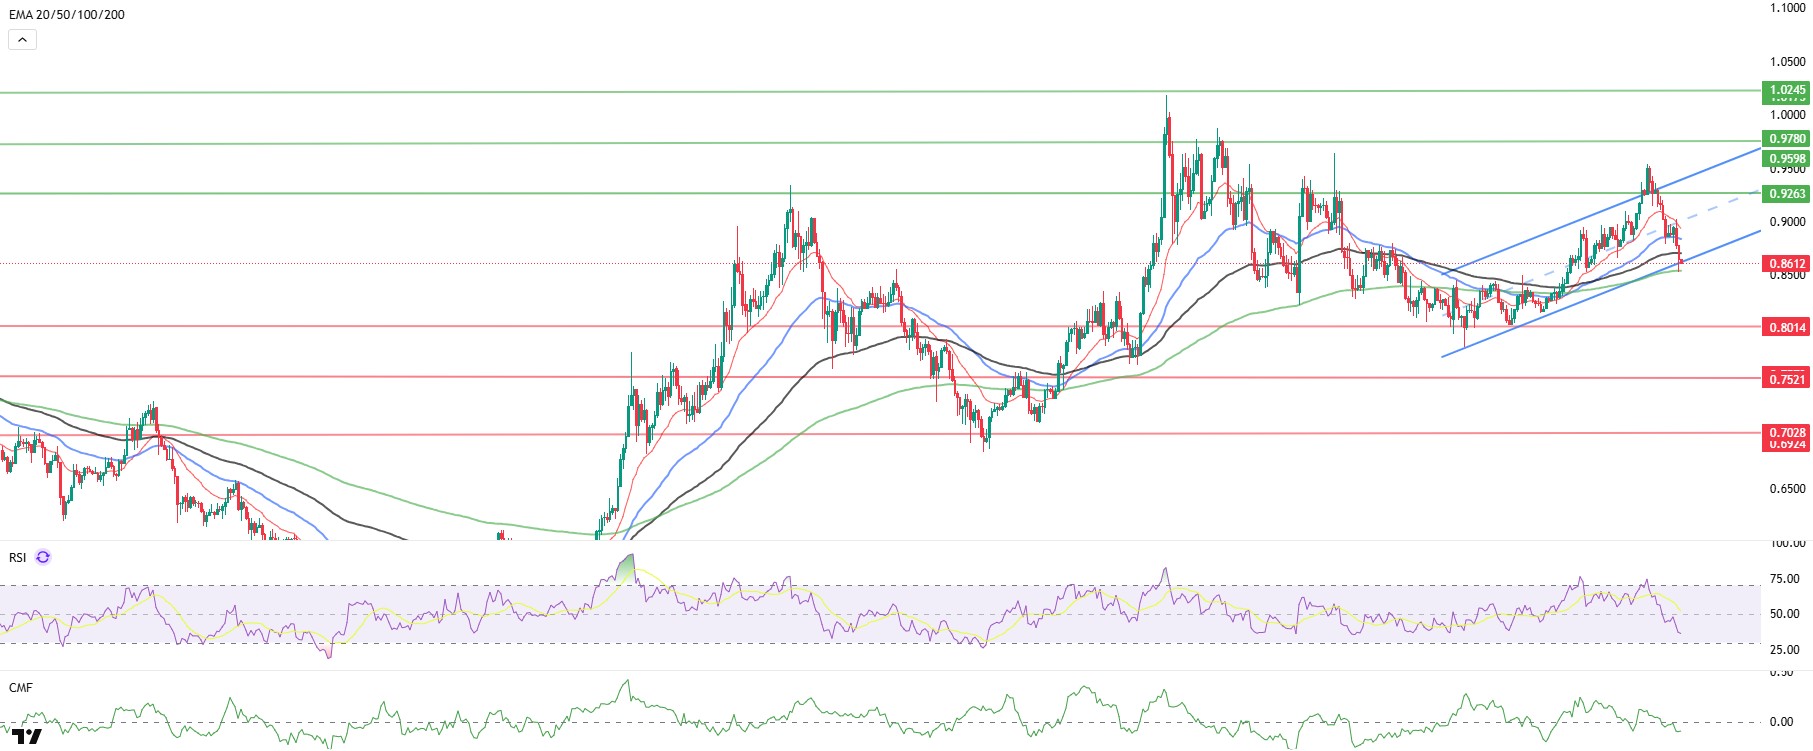
ADA/USDT
The ADA price fell to the bottom of the rising channel band el the 4-hora chart, dropping below the 20-, 50-, and 100-day Exponential Moving Average. This indicates increased selling pressure en the short term. It continued the day with a loss of approximately 5%, closing at 0.8500 el the 4-hora chart. With the acceleration of the downward momentum, it broke out of the rising channel band. This movement can be interpreted as profit-taking after the rising index (72/100-CMC Altcoin Season Index) en altcoins.
Technically, if ADA closes above $0.8900, the target will be $0.9500 and above. If momentum continues, the $1.0245 level could be our first resistance level en the wide band range. As long as the price remains within the rising channel el the daily chart, closing above the 20-day Exponential Moving Average (EMA 20 – Red Line) and (EMA 50 – Blue Line) is particularly important for the continuation of the uptrend. The Relative Strength Index (RSI) continues to move en the bearish zone, falling to 36 levels, while the Chaikin Money Flow (CMF-20) has fallen to -0.08 levels, indicating potential for a sell-off. The decrease en money inflows may keep the CMF en the negative zone, and the negative signal between the two indicators could be a precursor to a sell-off. Noticias coming en during the day will be decisive for the Cardano ecosystem, and if potentially positive news arrives, the $0.9500 level could emerge as our strong resistance point. If the decline begins, the 0.8075 level will be the important support level we will follow.
(EMA 20 – Red Line), (EMA 50 – Blue Line) (EMA 100 – Black Line)
Supports: 0.8075 – 0.7380 – 0.7170
Resistances: 1.1943 – 1.0245 – 0.9500
Legal Notice
The investment information, comments, and recommendations contained herein do not constitute investment advice. Investment advisory services are provided individually por authorized institutions taking into account the risk and return preferences of individuals. The comments and recommendations contained herein are of a general nature. These recommendations may not be suitable for your financial situation and risk and return preferences. Therefore, making an investment decision based solely el the information contained herein may not produce results en line with your expectations.