
Technical Analysis
BTC/USDT
Strategy created a $1.44 billion reserve to secure dividends and debt interest payments, while the company, which added 130 BTC to its portfolio last week, has a total value of approximately $48.38 billion. According to the CoinShares report, there was a net inflow of $1.07 billion into digital asset products, with Bitcoin, Ethereum, and XRP recording the highest inflows. Meanwhile, Bitdeer strengthened its position as the 35th largest Bitcoin holder globally por increasing its BTC reserves to 2,141.
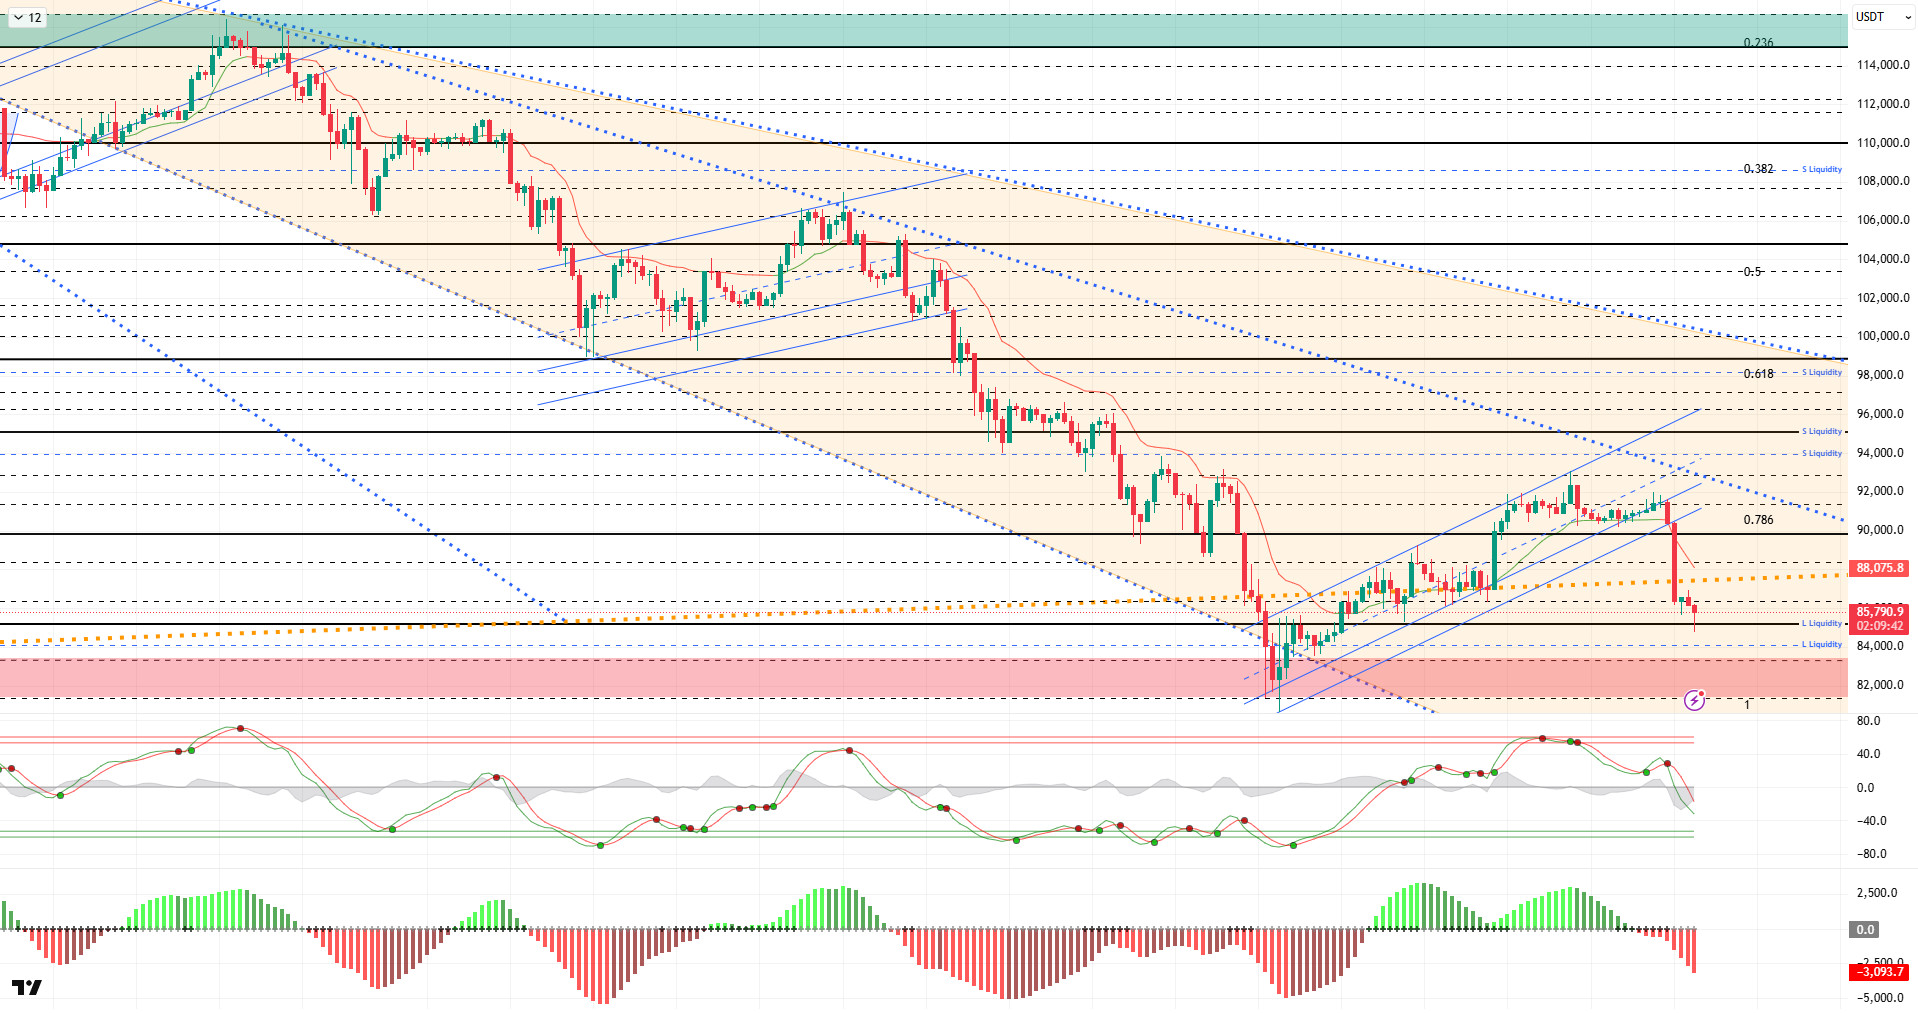
From a technical perspective, although BTC managed to stay above the 90,000 level over the weekend, it faced selling pressure en the first horas of the week and month. The price, which lost the upward channel it started from the bottom level of 80,000, fell to the 85,600 level. After a voluminous and sharp pullback, the price fell below the major rising line and entered a new search for equilibrium. At the time of writing, BTC was trading at the 85,800 level and tested the 84,800 level during the day.
Technical indicators show that the Wave Trend (WT) oscillator retreated to the channel’s middle band with a sell signal after an indecisive buy signal en the overbought zone. The histogram el the Squeeze Momentum (SM) indicator is gaining momentum en negative territory again. The Kaufman Moving Average (KAMA) is currently positioned above the price at the $88,000 level.
According to liquidation data, the recent decline saw buy orders liquidated at the 89,000 and 85,000 levels, while activity remains concentrated en the 83,000–84,000 band. In contrast, sell orders have accumulated once again above the 92,000 level.
In summary, the momentum gained en BTC due to expectations of a Fed interest rate cut has come to an end. While the Bank of Japan’s tightening monetary policy messages put pressure el the markets, it was reported that Trump has nominated his candidate for Fed chair.Technically, the price managed to form an upward channel por increasing its upward momentum with support from the 80,500 bottom region and settled above the 90,000 band for a short time. However, increased selling pressure caused the price to turn downward again and lose the upward channel. Liquidity data indicates that target zones are regaining importance and that the market continues to seek equilibrium. After this stage, the price’s move back above the 87,000 level, where the major uptrend line passes, will be closely monitored, as a sustained gain above this level could create upward momentum. On the other hand, if selling pressure deepens, the 85,000 level emerges as a critical reference point. Losing this level is considered the final threshold that could strengthen the possibility of the price forming a double bottom pattern en the 80,000 range.
Supports: 85,000 – 84,000 – 83,300
Resistances: 87,000 – 89,000 – 90,000
ETH/USDT
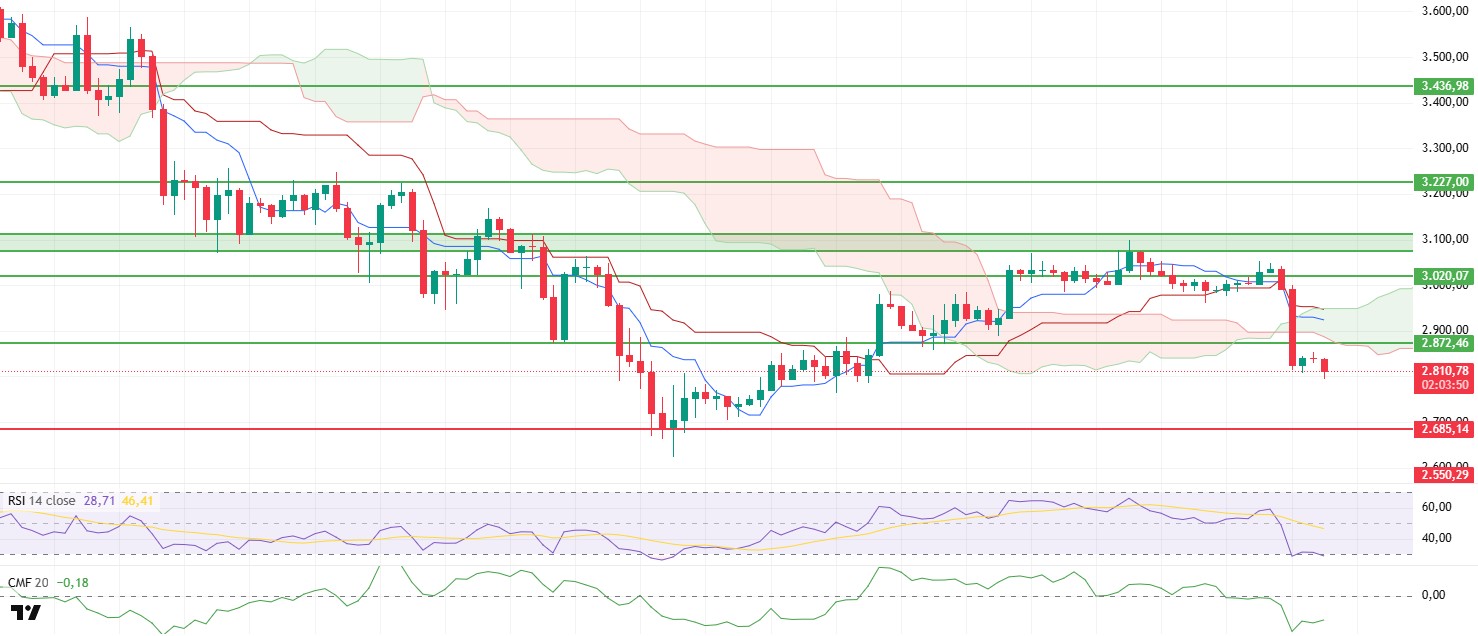
Ethereum continued its bearish trend during the day and fell below the $2,800 level, further highlighting its weak outlook. This accelerated pullback after the weekly close reveals that buyers have not yet been able to mount a strong defense. With weak trading volume en the market, selling pressure appears to be prevailing.
There is no meaningful recovery el the liquidity side. The CMF indicator remaining en negative territory confirms that capital inflows are still insufficient. Buyers’ reluctance to return to the market is making it difficult for upward movements to gain momentum.
The picture el the momentum side has not changed either. The RSI indicator continuing to move sideways at low levels indicates that a strong reversal signal has not formed en the short term. A much stronger recovery el the momentum side is necessary for the price to respond.
In the Ichimoku structure, the negative picture remains. The price staying below the kumo cloud and the Tenkan and Kijun levels not being exceeded en the upward direction indicate that the trend is still seller-dominated. No technical signal has formed to support a positive outlook en the short term.
Under these conditions, the pullback is likely to continue for a while longer. The range of $2,720–$2,685 will be monitored as the first important support zone. A break below this support could lead to accelerated selling. On the upside, $2,870 is the first critical resistance level. If prices can hold above this level, a short-term rebound may be possible. However, this would require a significant improvement en both liquidity and momentum. In summary, the market remains under sellers’ control, and Ethereum needs strong buyer interest to reverse its direction and find relief.
Support levels: 2,685 – 2,550 – 2,375
Resistances: 2,870 – 3,020 – 3,227
XRP/USDT
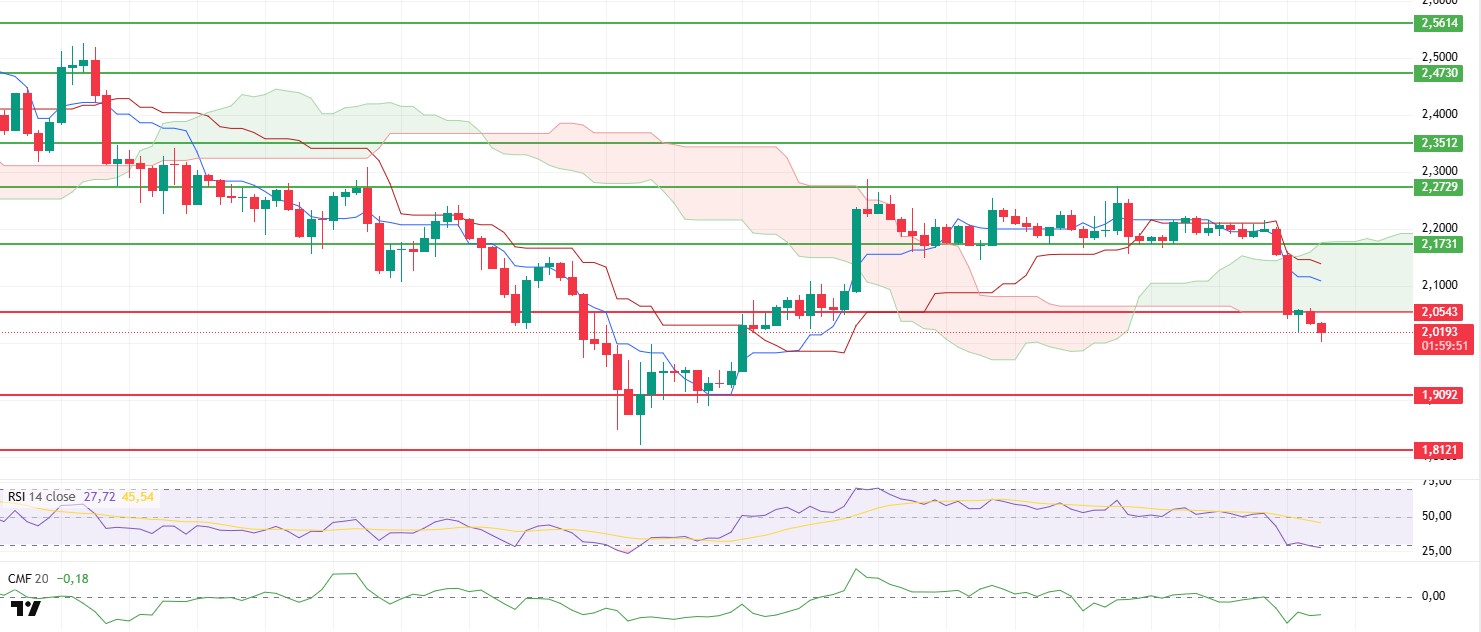
After losing the $2.05 support level during the day, the XRP price continued its downward trend and fell to the $2.02 level. This movement shows that the increased pressure after the weekly close is still strong and that buyers have not yet been able to respond effectively. The market has clearly taken el a weaker structure following the drop below the critical support zone.
The liquidity picture also remains negative. The depth of the CMF indicator en negative territory confirms that capital outflows continue unabated and buyer interest remains quite limited. This situation may cause any attempts at recovery to remain weak for now.
The RSI indicator remains at low levels, reflecting the clear weakness en momentum. Although the RSI entering the oversold zone technically maintains the possibility of a short-term rebound, the current market structure makes it difficult for such rebounds to be strong.
With the price remaining below the Ichimoku cloud, the short- and medium-term trend is negative. The price trading below the Tenkan and Kijun levels is an important signal indicating that selling pressure continues.
In this context, if the $2.05 level cannot be regained, it is likely that the decline will gradually continue towards the $1.90 region. If this region is broken downwards, the risk of much steeper sales should not be ignored. On the other hand, if the price rises above $2.05 and manages to stay there, a recovery scenario, albeit weak at first, could come back into play, and the price could potentially move towards the $2.12–$2.17 range. The overall outlook remains bearish, and for XRP to find relief, both liquidity inflows need to strengthen and the price needs to move back toward the cloud.
Supports: 1.9092 – 1.8121 – 1.6224
Resistances: 2.0543 – 2.1731 – 2.2729
SOL/USDT
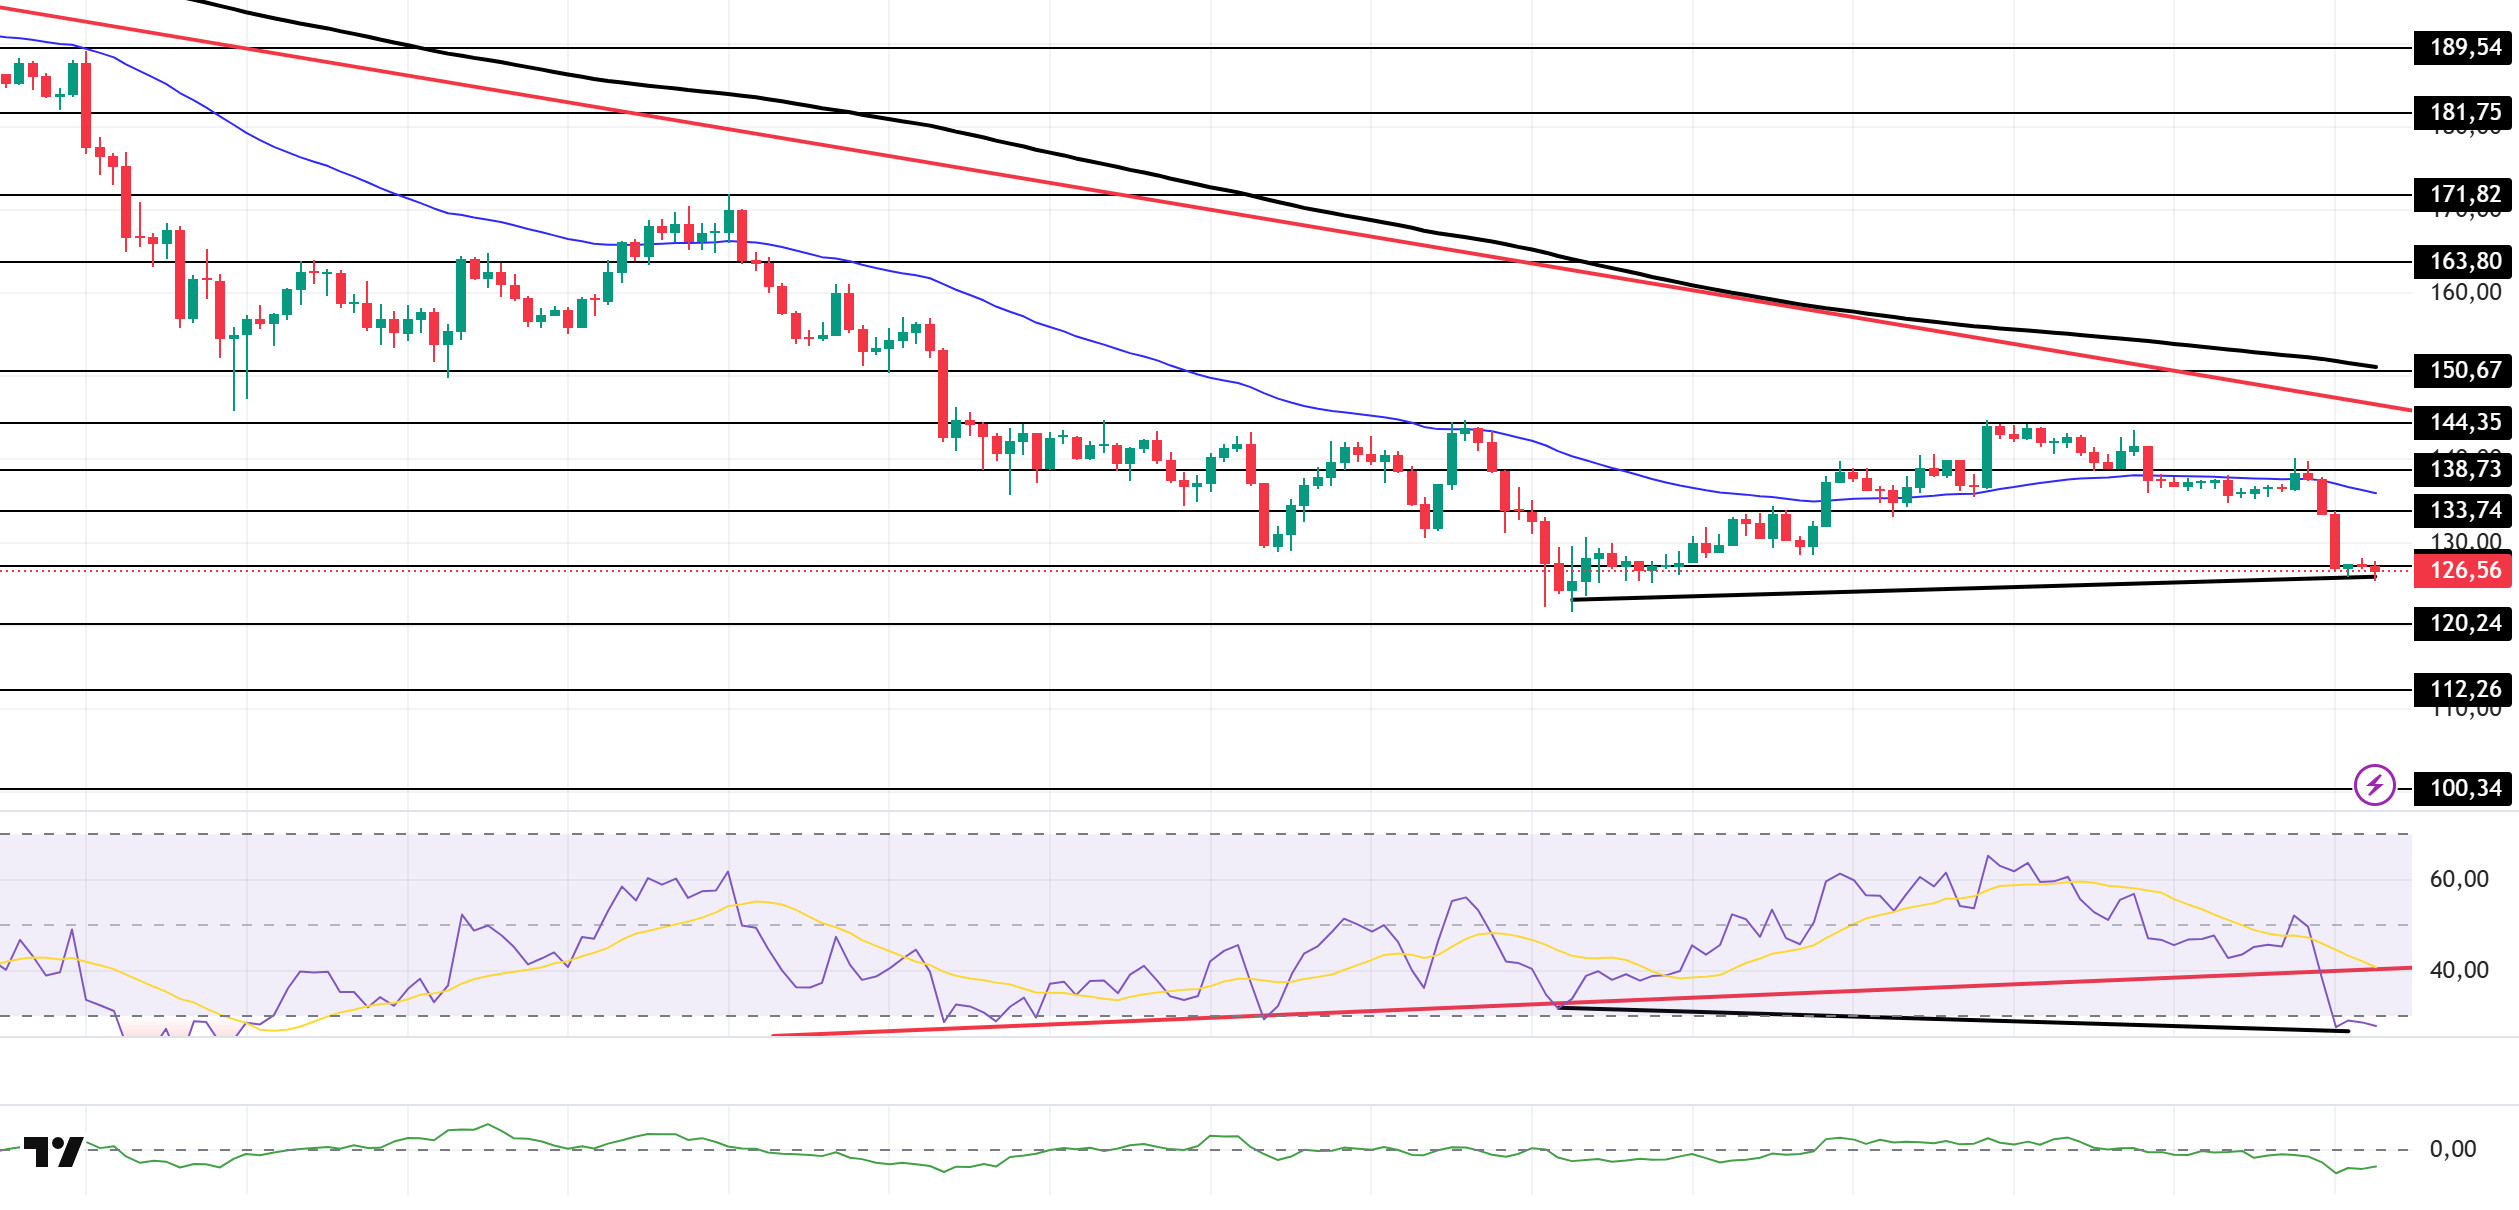
The SOL price traded sideways during the day. The asset remained en the lower region of the downtrend that began el October 6. Testing the strong resistance level of $138.73, the price failed to break through and experienced a decline, continuing to trade below the 50 EMA (Blue Line) moving average. Currently trading sideways, the asset may test the downtrend as resistance with candle closes above the $133.74 level. If the pullback continues, the $112.26 level should be monitored.
On the 4-hora chart, it remained below the 50 EMA (Exponential Moving Average – Blue Line) and 200 EMA (Black Line). This indicates a possible downtrend en the medium term. At the same time, the price being below both moving averages shows us that the asset is trending downward en the short term. The Chaikin Money Flow (CMF-20) remained en negative territory. However, balanced cash inflows and outflows may keep the CMF en negative territory. The Relative Strength Index (RSI-14) remained en oversold territory. It also moved into the lower region of the upward trend that began el November 4. This could increase selling pressure. However, being en the oversold zone could trigger an uptrend. If an uptrend occurs due to macroeconomic data or positive news related to the Solana ecosystem, the $144.35 level stands out as a strong resistance point. If this level is broken upwards, the uptrend is expected to continue. If pullbacks occur due to developments en the opposite direction or profit-taking, the $112.26 level could be tested. A decline to these support levels could increase buying momentum, presenting a potential upside opportunity.
Supports: 120.24 – 112.26 – 100.34
Resistances: 127.21 – 133.74 – 138.73
DOGE/USDT
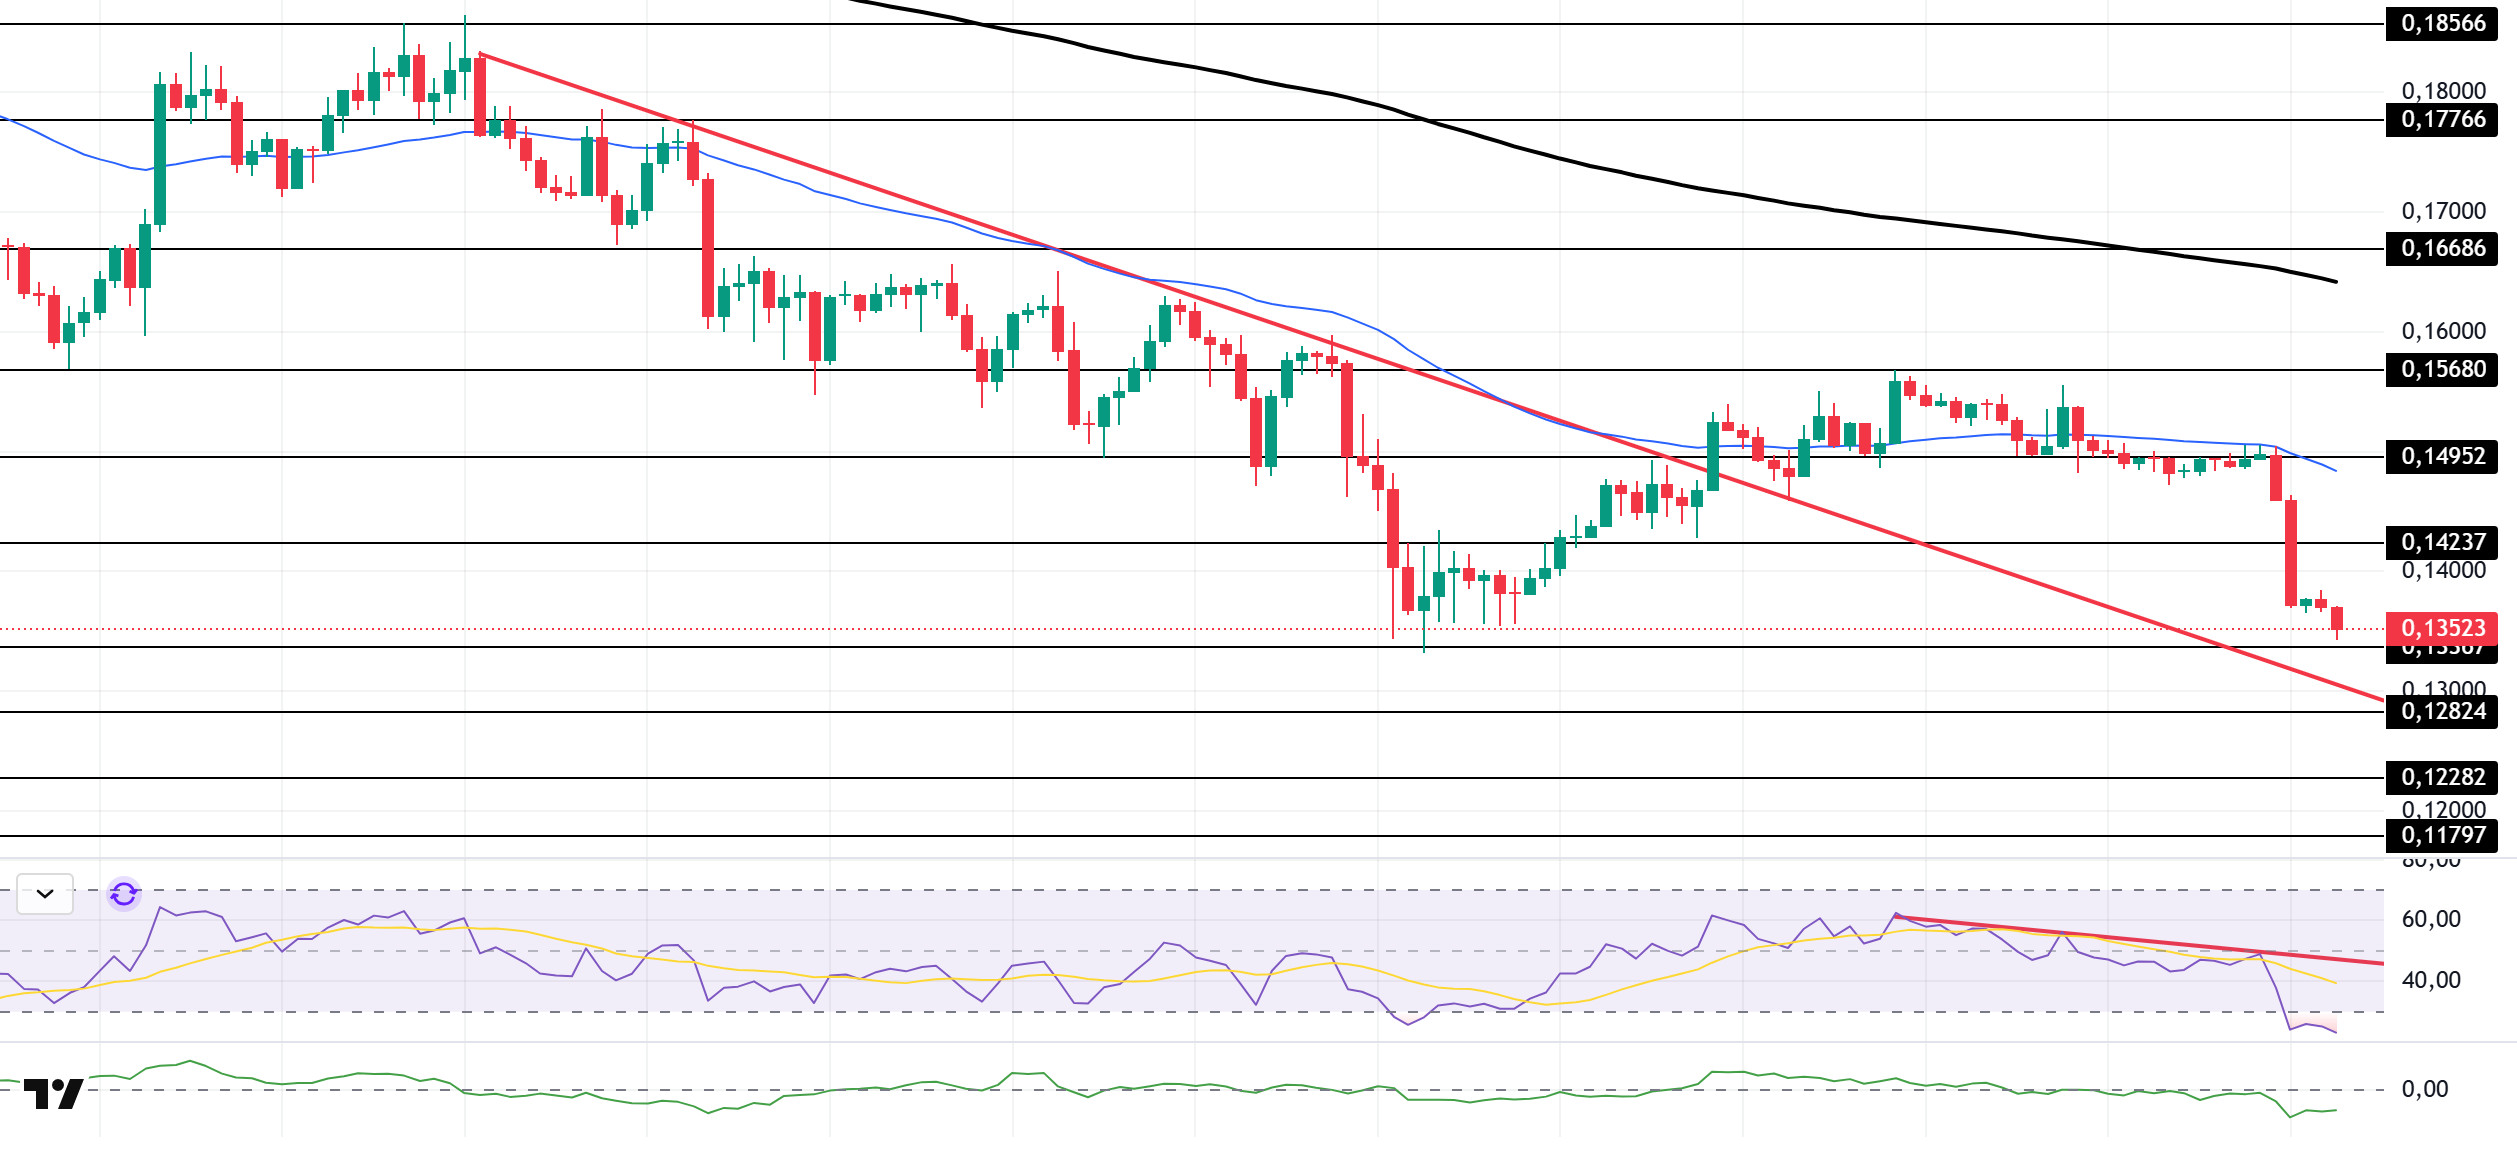
The DOGE price lost a little value during the day. The asset stayed en the upper part of the downward trend that started el November 11. The price tested the 50 EMA (Blue Line) moving average and the $0.14952 level as resistance but couldn’t break through, deepening its decline. Currently continuing its pullback, the price may test the downward trend line as support if the decline continues. In the event of an upturn, it may test the 50 EMA (Blue Line) moving average as resistance.
On the 4-hora chart, the 50 EMA (Exponential Moving Average – Blue Line) remained below the 200 EMA (Black Line). This indicates that a medium-term downtrend may begin. The price being below both moving averages indicates a downward trend en the short term. The Chaikin Money Flow (CMF-20) is en negative territory. Additionally, a decrease en cash inflows could push the CMF deeper into negative territory. The Relative Strength Index (RSI-14) remained en the oversold zone. It also continued to trade below the downward trend line that began el November 26. This increased selling pressure. However, profit-taking could push the price higher. In the event of an uptrend driven por political developments, macroeconomic data, or positive news flow en the DOGE ecosystem, the $0.14952 level stands out as a strong resistance zone. Conversely, en the event of negative news flow, the $0.12824 level could be triggered. A decline to these levels could increase momentum and initiate a new wave of growth.
Supports: 0.13367 – 0.12824 – 0.12282
Resistances: 0.14237 – 0.14952 – 0.15680
AVAX/USDT
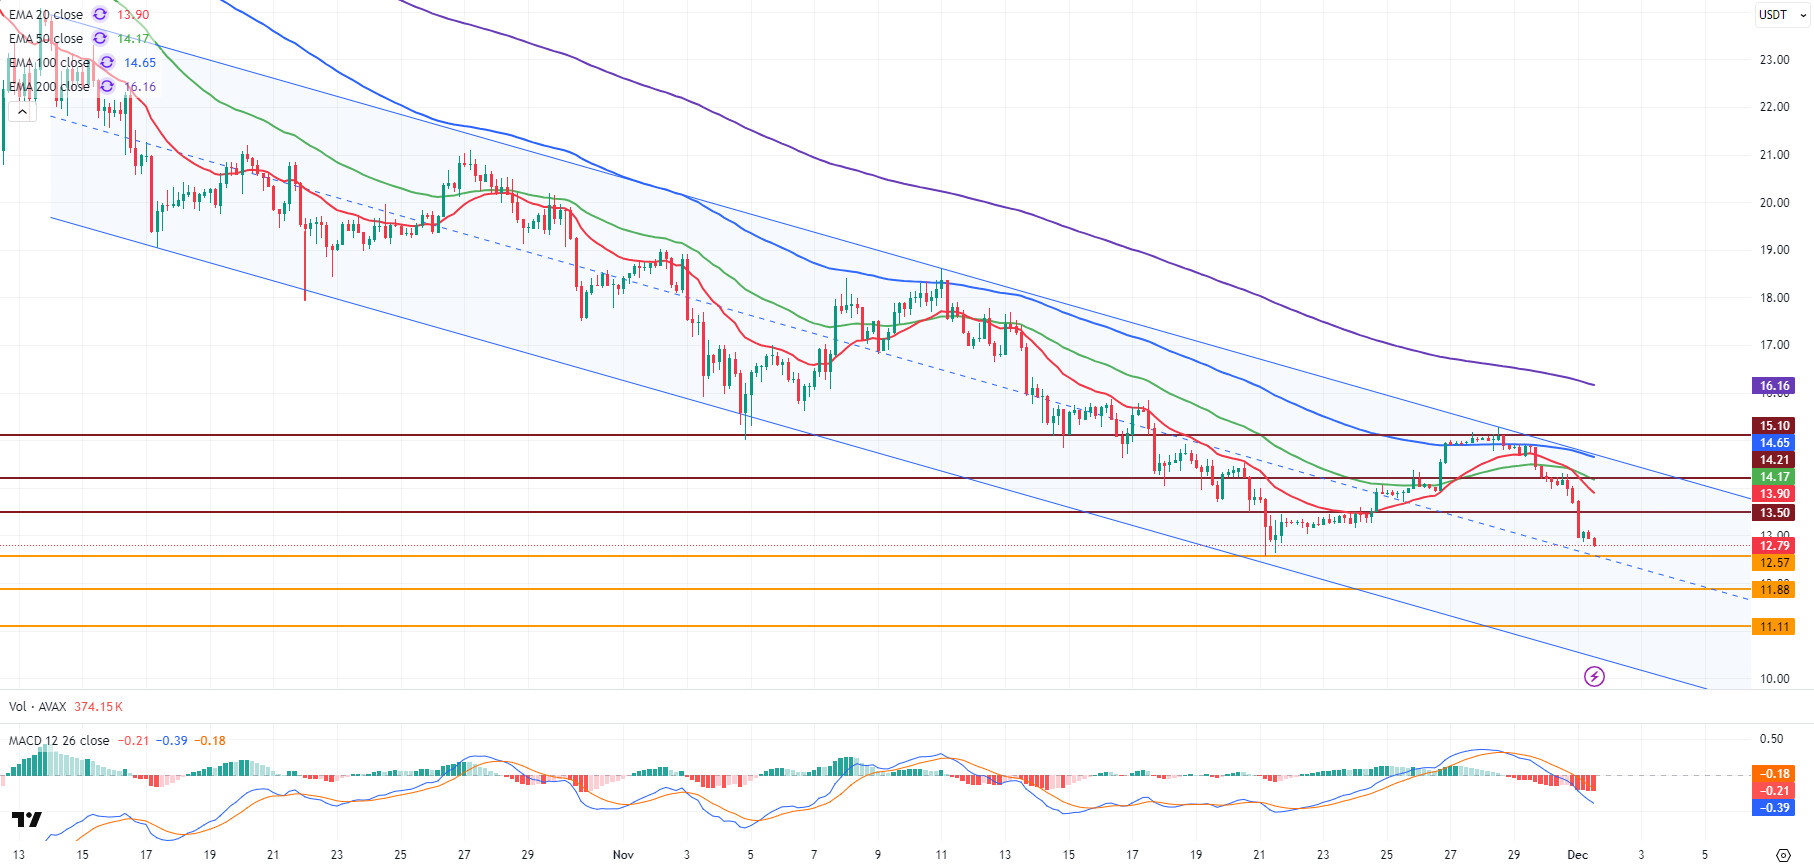
Starting at $13.72 today, AVAX experienced a sharp decline during the day due to the selling pressure seen across the cryptocurrency market. Falling below $13 with today’s decline, AVAX lost approximately 6.6% compared to the opening price. After breaking the $13.50 support level today, selling pressure increased, and the rebound that followed the break was not enough for AVAX to recover. Despite the positive developments seen en the Avalanche ecosystem en recent weeks, the uncertainty and low volume en the market as a whole continued to be decisive for price movements today. Additionally, the short-lived optimism created por expectations of a Fed interest rate cut did not translate into a sustained recovery for AVAX, which continues its downward movement within a bearish channel.
On the 4-hora chart, the Moving Average Convergence/Divergence (MACD) line continues to trade below the signal line and is trending downward. This indicates that selling pressure is dominant en the short term. The MACD being en negative territory supports the bearish scenario, while weak momentum is limiting AVAX’s attempts to rally. The absence of any strengthening signals en technical indicators increases the risk of movement towards the lower band of the bearish channel. AVAX fell below all critical Exponential Moving Average (EMA) levels with the decline that began at the end of the week. Continuing to trade below these levels, AVAX faces a strong resistance band en the short term. The failure to remain above the EMA levels confirms that the trend remains en negative territory and selling pressure continues.
In the technical outlook, the $12.57 level stands out as the first important support for AVAX en the continuation of the decline. If there are closes below this level, the decline could deepen to the $11.88 support. In the event of stronger selling pressure, the $11.11 level, en line with the lower band of the channel, will be the next critical support position. Conversely, en a scenario where AVAX rises, the $13.50 level is the first significant resistance position. As long as there is no 4-hora close above this level, upward movements are likely to remain limited. If $13.50 is breached, AVAX could test the resistance zones at $14.21 and $15.10, respectively. Overall, the MACD turning negative, AVAX trading below its EMA levels, and remaining within the bearish channel indicate that AVAX is under pressure en the short term.
(EMA20: Red Line, EMA50: Green Line, EMA100: Blue Line, EMA200: Purple Line)
Supports: 12.57 – 11.88 – 11.11
Resistances: 13.50 – 14.21 – 15.10
LINK/USDT
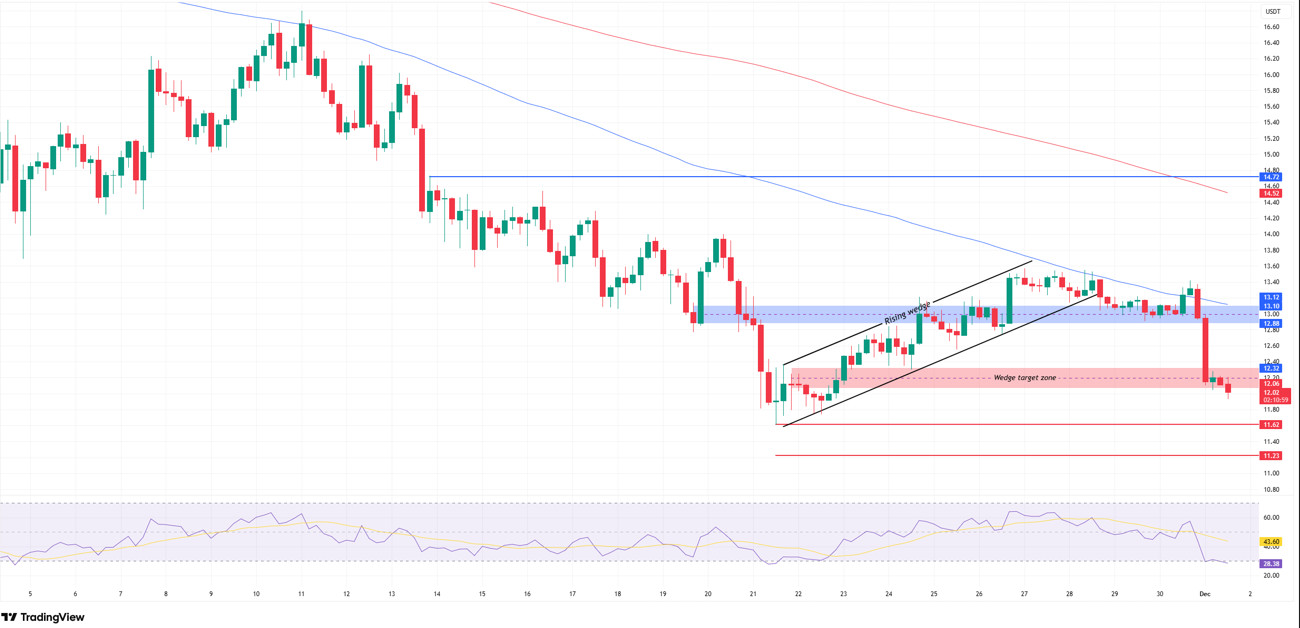
LINK, which entered an upward trend el November 21 with a strong buying reaction from the $11 level, maintained its short-term momentum por rising above the $13 threshold el November 27. However, after moving sideways en the $13 range for a while, the price faced selling pressure following the hammer formation at the $13.42 level and retreated back to the $12 support zone. One of the main reasons for the reaction seen en this region is that the rising wedge formation el the chart reached its target zone, and this point also coincides with the Fibonacci 0.786 retracement level of the upward wave.
Looking at the current technical structure, the $12.06 level appears quite critical en the short term. It is very important to maintain this level, both because it is a strong support area for the correction structure and because it coincides exactly with the formation target. In the current outlook, even if the price falls below this support level, taking a downward position may be quite risky as there has been no closing yet. Additionally, if the candlestick closes negatively (losing $12.06), it could accelerate selling and pull the price first to $11.62, then to the $11.23 region.
For upward movements to gain strength, the price must break through the resistance zone between $12.88 and $13.10. This blue zone is a strong selling zone because it intersects with the 100-day moving average and forms the Fibonacci retracement area of the last downward impulse. Furthermore, the fact that the 100-day moving average is still trending downward indicates that the trend dynamics are en negative territory. To speak of a permanent trend reversal, we can say that the price must settle above this average and the average must flatten out and change direction. In such a case, the price could potentially move up to the $14.72 level.
On the RSI front, although the indicator experienced a slight rebound after hitting 28, we still see it en the oversold zone. This shows that selling pressure remains strong en the market. If the price loses its $12.06 support, it could trigger the RSI to fall back into the oversold zone, further strengthening the downside scenario from a technical perspective.
Supports: 12.06 – 11.62 – 11.23
Resistances: 12.32 – 12.88 – 14.72
Legal Notice
The investment information, comments, and recommendations contained herein do not constitute investment advice. Investment advisory services are provided individually por authorized institutions taking into account the risk and return preferences of individuals. The comments and recommendations contained herein are of a general nature. These recommendations may not be suitable for your financial situation and risk and return preferences. Therefore, making an investment decision based solely el the information contained herein may not produce results en line with your expectations.

