
Technical Analysis
BTC/USDT
Long-standing capital inflows en crypto investment markets have been replaced por a significant outflow of funds for the first time after a record 19-week streak, according to CoinShares data. While there was a total outflow of 415 million dollars, Bitcoin had the biggest impact with a loss of 430 million dollars. While most of the outflows came from the US with $464 million, countries such as Germany, Switzerland and Canada were relatively less affected por this decline, recording inflows of $21 million, $12.5 million and $10.2 million respectively.
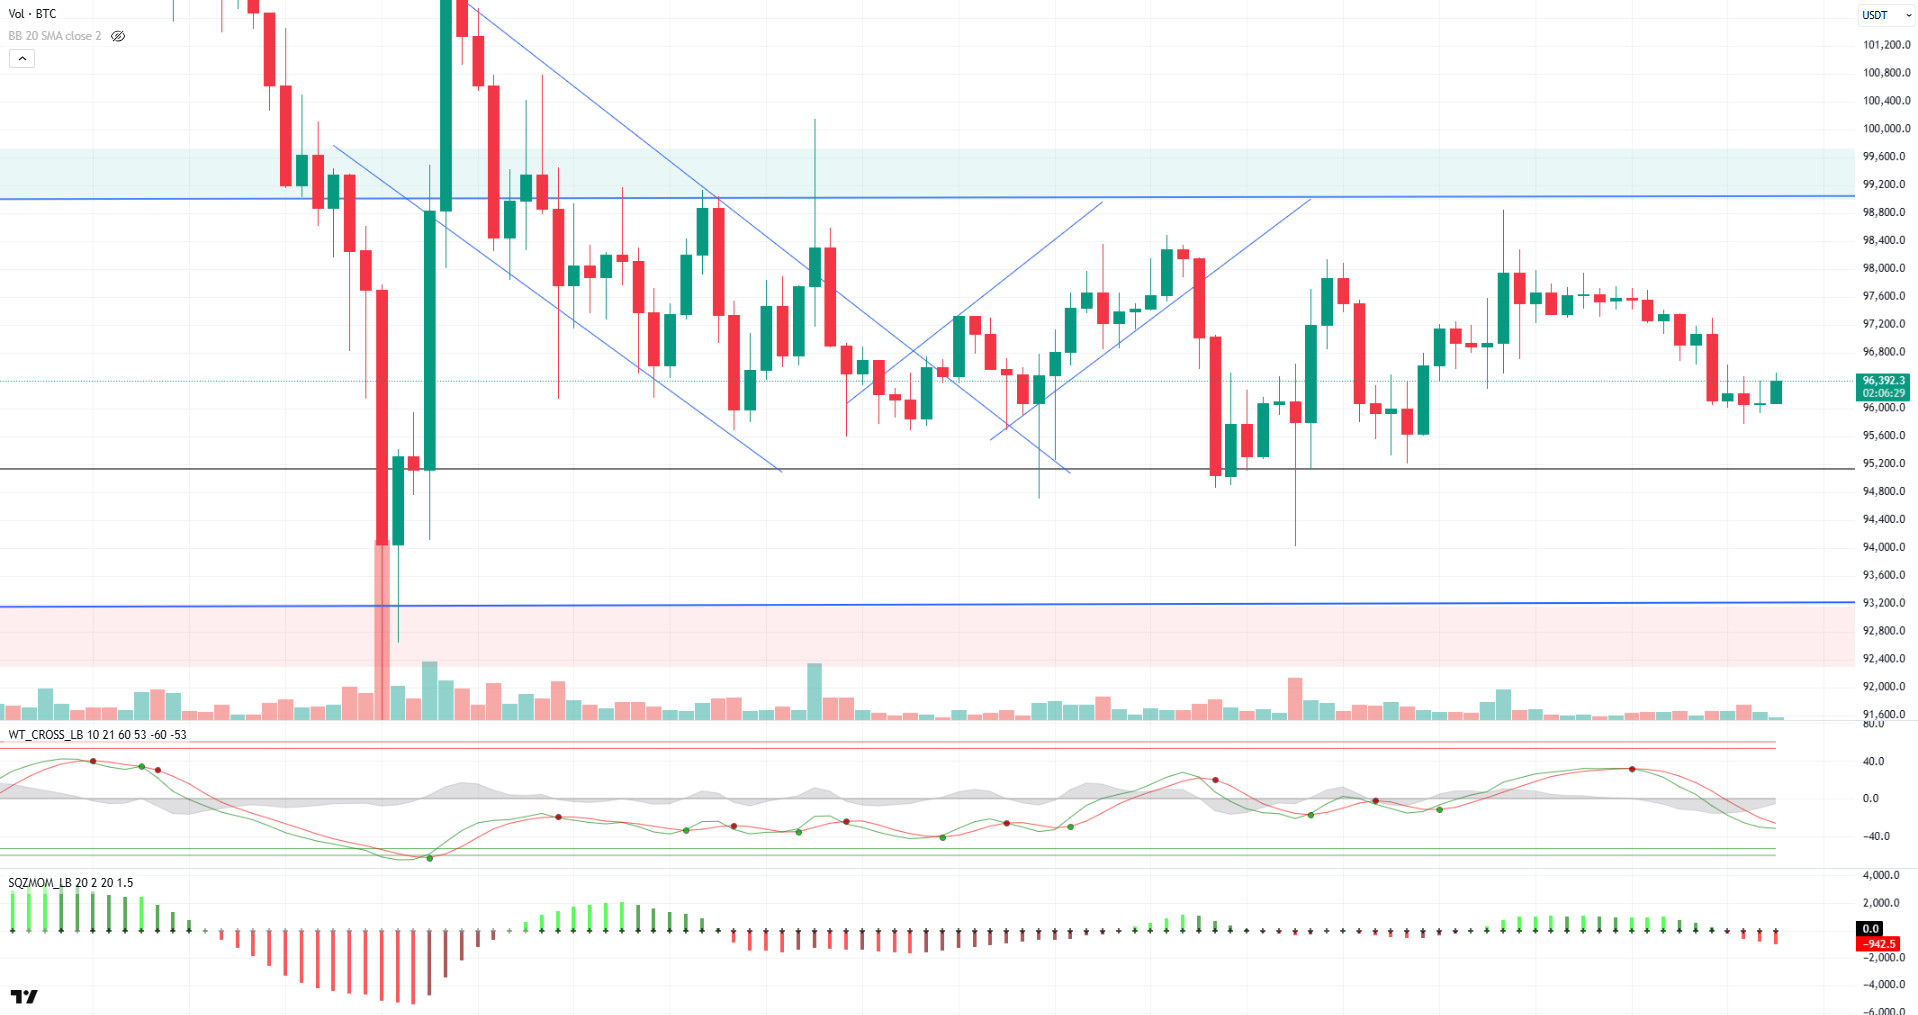
Looking at the technical outlook, BTC continues to move with low volatility during the day. Trading en a narrow price range, BTC is at 96,300, en line with the previous analysis. When technical oscillators are analyzed, it is observed that the sell signal continues to weaken and momentum indicators are also losing strength. We can say that BTC, which is en search of direction, is close to resistance zones despite fundamental developments and Spot ETF outflows. In addition, the postponement of interest rate cut expectations el the macroeconomic side is among the factors that increase the pressure el the price. In the event of an upward movement despite all these factors, closes above the 97,000 level will be closely monitored. In a possible pullback, the 95,000 level will be followed as a critical support point.
Supports 95,000 – 92,800 – 90,400
Resistances 97,000 – 99,100 -101,400
ETH/USDT
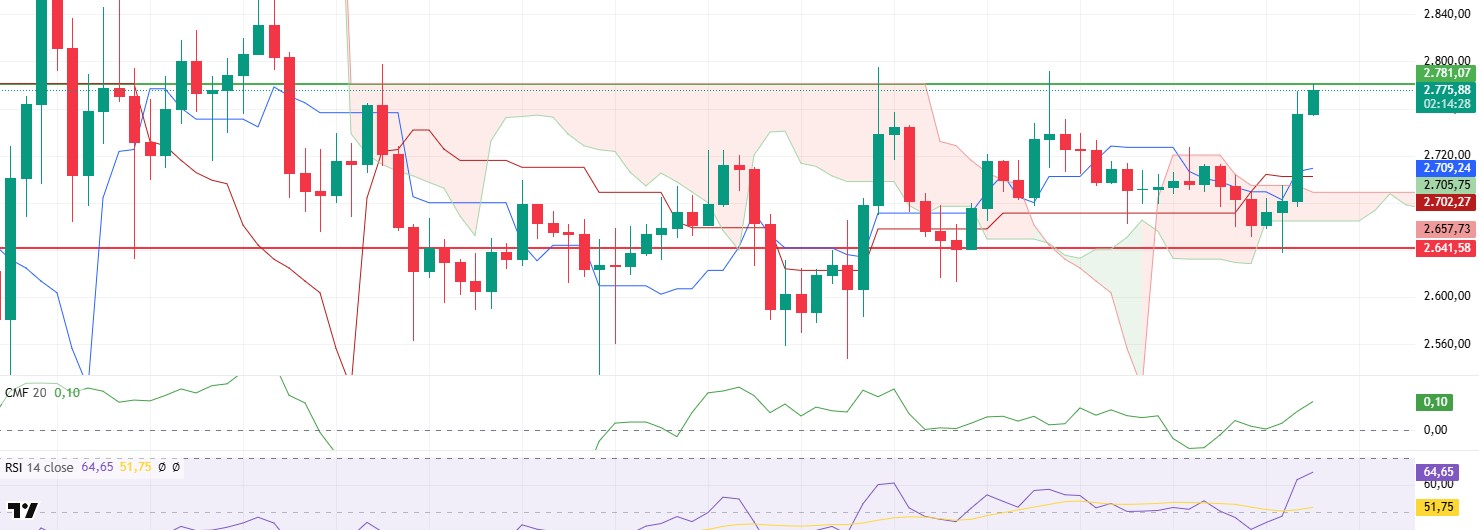
ETH increased its bullish momentum por breaking through the $2,694 kumo cloud resistance during the day and managed to quickly rise to $2,781. Although it faced a slight selling reaction from this region, it remains strong en terms of overall structure.
According to the Ichimoku indicator, the upside breakout of the kumo cloud has eliminated the weakness signal previously formed por the intersection of the tenkan and kijun lines. This indicates that the trend is gaining upside strength. In addition, the Chaikin Money Flow (CMF) indicator has risen en line with the price action, confirming continued strong liquidity inflows into the market. This indicates that the uptrend is supported por a healthy capital flow, which strengthens the positive outlook. Momentum indicators also support the price action . Relative Strength Index (RSI) shows that it has gained momentum and exhibited a positive momentum por maintaining its upward trend, indicating that buyers are still active en the market and the uptrend is sustainable.
With technical indicators giving largely positive signals, if the price holds above the $2,781 level, the uptrend towards the $2,992 levels can be expected to continue. However, a third rejection from the $2,781 level could be a sign that buyers are weakening, and en this case, the price could quickly retreat to the $2,641 level.
Supports 2,641 – 2,501 – 2,368
Resistances 2,781 – 2,881 – 2,992
XRP/USDT
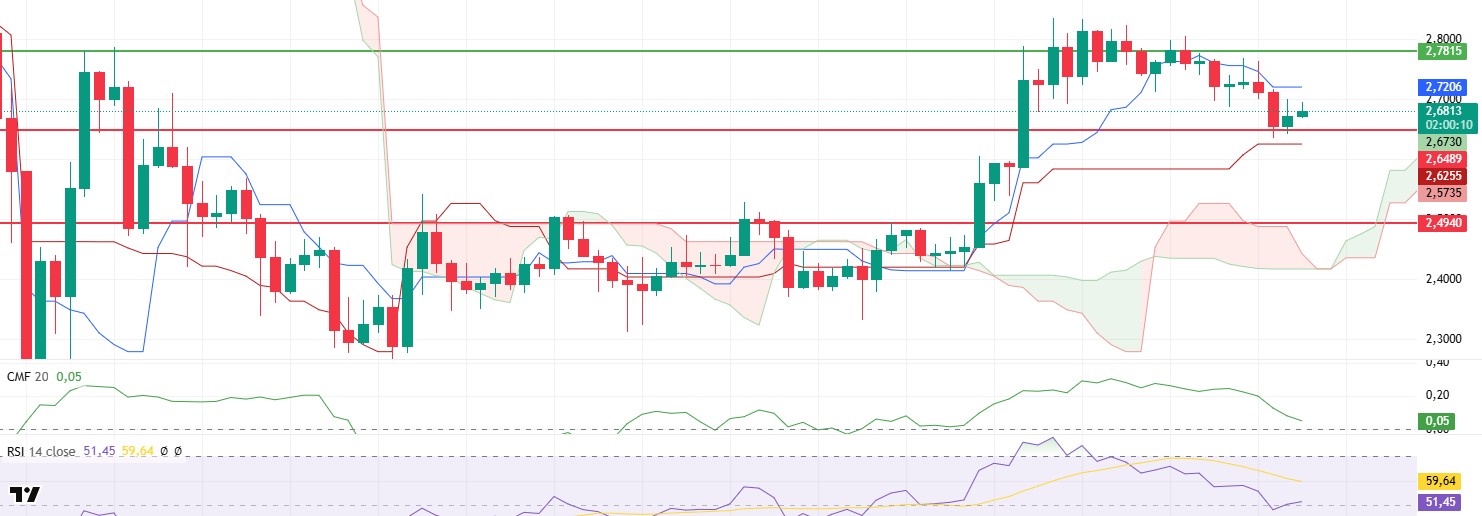
XRP fell as low as $2.65 en the morning horas and, as expected, received some reaction from this region. However, despite the price starting an upward movement from this point, technical indicators still show a weak outlook.
The sharp decline en the Chaikin Money Flow (CMF) indicator indicates that a large amount of liquidity continues to flow out of the market and buyers remain weak. On the other hand, the Relative Strength Index (RSI) indicator showed a slight recovery with support from the $2.65 level, but still has not gained strong momentum. On the Ichimoku indicator, there is no clear direction en price action. XRP continues to exhibit an unstable structure, fluctuating between the tenkan and kijun levels. This state of equilibrium indicates that the market is waiting for a breakout and the price is en the process of determining the direction.
Given the technical outlook and price structure, XRP continues to trade at a critical level. If the $2.65 level is broken down, selling pressure is likely to increase and push the price down to the $2.49 level. However, if this level is maintained and buyers gain strength, XRP may start an upward movement again up to $ 2.78.
Supports 2.6486 – 2.4940 – 2.2502
Resistances 2.7815 – 2.9379 – 3.1567
SOL/USDT
Blockchain developers’ attitude towards Meme coins continues. This has badly affected the Solana ecosystem, including the SOL price. Total value locked (TVL) has dropped from highs above $12 billion to as low as $8.9 billion, while volume has dropped from $35 billion to as low as $2.5 billion, although the number of transactions continues to increase.
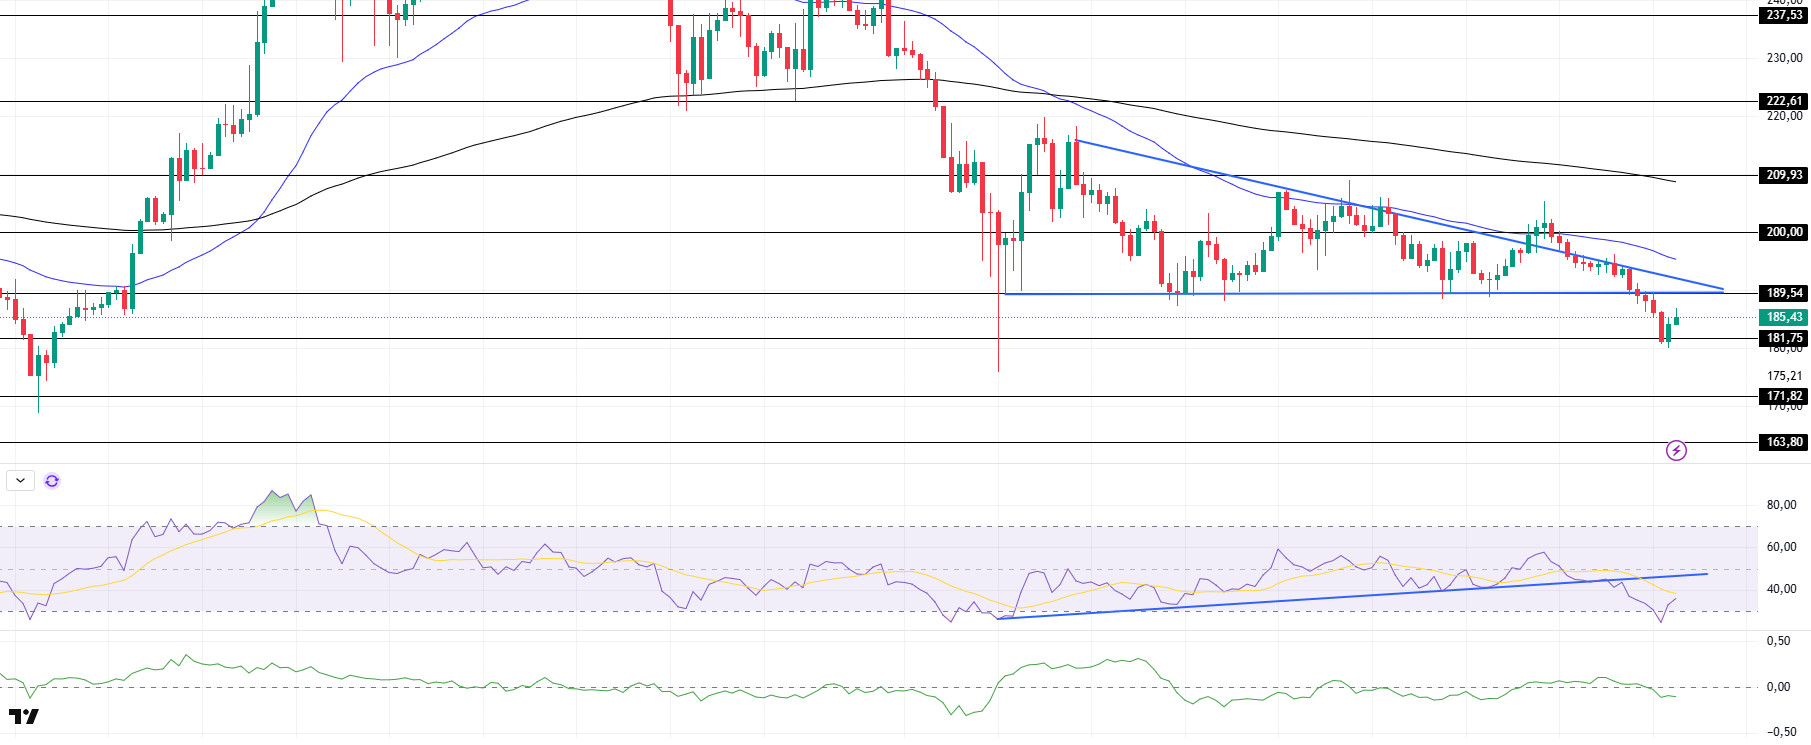
SOL has moved en a narrow band since our morning analysis. After breaking the falling triangle pattern strongly to the downside, the asset currently found support at 181.75, which is a strong resistance and may test the base level of the falling triangle pattern during the day. On the 4-hora timeframe, the 50 EMA (Blue Line) continues to be below the 200 EMA (Black Line). This could deepen the decline en the medium term. At the same time, the asset continued to hover below both moving averages. The Chaikin Money Flow (CMF)20 indicator is near the neutral level of the negative zone despite the increase en volume. Although this indicates that sellers are more dominant than buyers, increased volume could push the price higher. However, the Relative Strength Index (RSI)14 indicator has started to move upwards from the oversold zone. At the same time, the uptrend en the RSI, which started el February 3, experienced a strong downward breakout. If the uptrend en RSI runs as resistance during the day, a selling opportunity may arise. The $ 200.00 level stands out as a very strong resistance point en the rises driven por both the upcoming macroeconomic data and the news en the Solana ecosystem. If it breaks here, the rise may continue. In case of retracements for the opposite reasons or due to profit sales, the support level of $ 181.75 can be triggered again. If the price reaches these support levels, a potential bullish opportunity may arise if momentum increases.
Supports 181.75 – 171.82 – 163.80
Resistances 189.54 – 200.00 – 209.93
DOGE/USDT
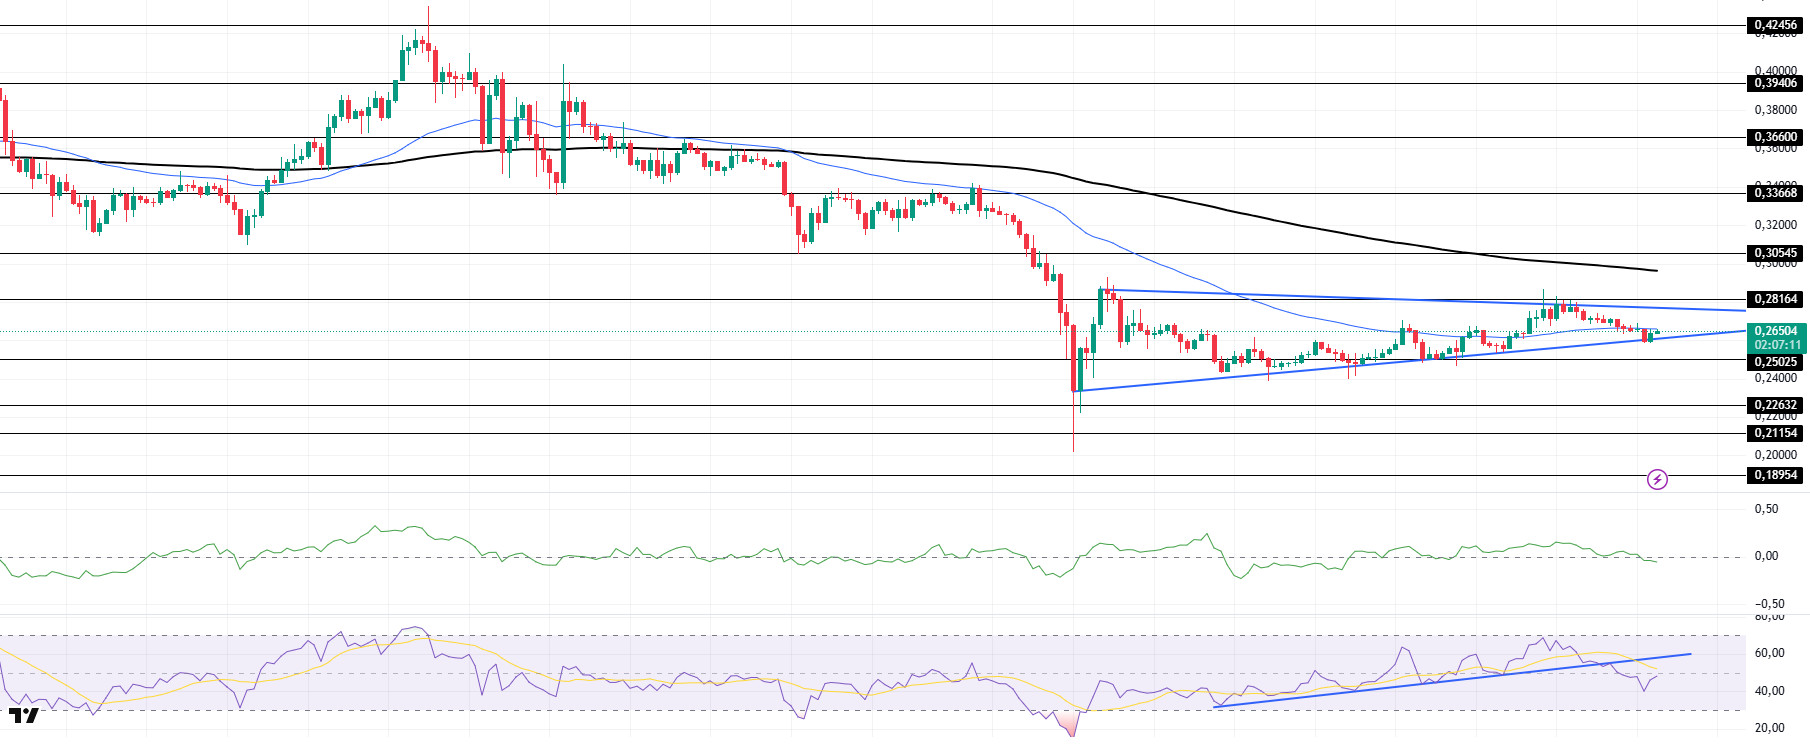
Since our analysis en the morning, DOGE has tested the base of the symmetrical triangle pattern and has been bullish with support. At the time of writing, it is testing the 50 EMA (Blue Line) as resistance el the 4-hora timeframe. At the same time, the asset remains below the 50 EMA (Blue Line) and the 200 EMA (Black Line). This could mean that the decline could deepen further en the medium term. The price, however, remains below the two moving averages. However, the larger gap between the two moving averages could further increase the probability of DOGE moving higher. The Chaikin Money Flow (CMF)20 indicator is en neutral territory and money inflows and outflows are balanced. Low volume and CMF en the negative zone near the neutral level may push the price higher. At the same time, Relative Strength Index (RSI)14 is en the neutral zone and may test the uptrend that started el February 6 as resistance. The $0.33668 level is a very strong resistance point en the uptrend due to political reasons, macroeconomic data and innovations en the DOGE coin. In case of possible pullbacks due to political, macroeconomic reasons or negativities en the ecosystem, the base level of the trend, the $ 0.22632 level, is an important support. If the price reaches these support levels, a potential bullish opportunity may arise if momentum increases.
Supports 0.25025 – 0.22632 – 0.21154
Resistances 0.28164 – 0.30545 – 0.33668
LEGAL NOTICE
The investment information, comments and recommendations contained herein do not constitute investment advice. Investment advisory services are provided individually por authorized institutions taking into account the risk and return preferences of individuals. The comments and recommendations contained herein are of a general nature. These recommendations may not be suitable for your financial situation and risk and return preferences. Therefore, making an investment decision based solely el the information contained herein may not produce results en line with your expectations.

