
TECHNICAL ANALYSIS
BTC/USDT
Institutional investors’ risk aversion became more pronounced en April. US-listed Bitcoin spot ETFs saw outflows of more than $800 million, el track to become the segundo highest monthly outflow en history. These outflows show that investors are turning to safer havens en an uncertain environment. In particular, the market volatility caused por Trump’s toughening tariff policies led institutions to short-term US Treasury bonds. The interest rate el 3-month Treasury bills rose to 4.225%, while the latest US Treasury auction was en high demand.
When we look at the technical outlook, it is seen that BTC has persisted above the 85,000 level en line with the uptrend and moved horizontally at 85,500 levels during the day. However, it is noteworthy that volatility has decreased significantly as the price consolidated at this level. We are en a process where the price focuses el fundamental developments for the continuation of the rise. The Wave Trend Oscillator shows that the buy signal given en the previous analysis is starting to weaken. Since momentum indicators are hovering at very low levels, it is possible to say that the current uptrend is struggling to gain momentum. This indicates that the market is indecisive and, en a wait,-and-see mode. Although the positive trend en Asian markets as well as European stock markets and the partially positive US futures have the potential to create volatility en BTC technically, it seems that the main determining factor will continue to be developments regarding tariffs. The tone of these developments stands out as the most important factor determining the direction of the crypto market. If the negative trend el the spot ETF side ends and turns into a positive flow, that is, if institutional investors (smart money) turn towards risky assets again, it may be possible for BTC to target 90,000 levels again. However, the realization of this scenario depends el both the strengthening of the technical outlook and confidence-building developments el the fundamental side. In case of a possible pullback, the 85,200 level continues to work as minor support. In pricing below this level, the 83,500 level should be monitored as a critical support point to stay en the positive zone.
Supports 85,200 – 83,500 – 81,500
Resistances 86,600 – 89.000 – 91,800

ETH/USDT
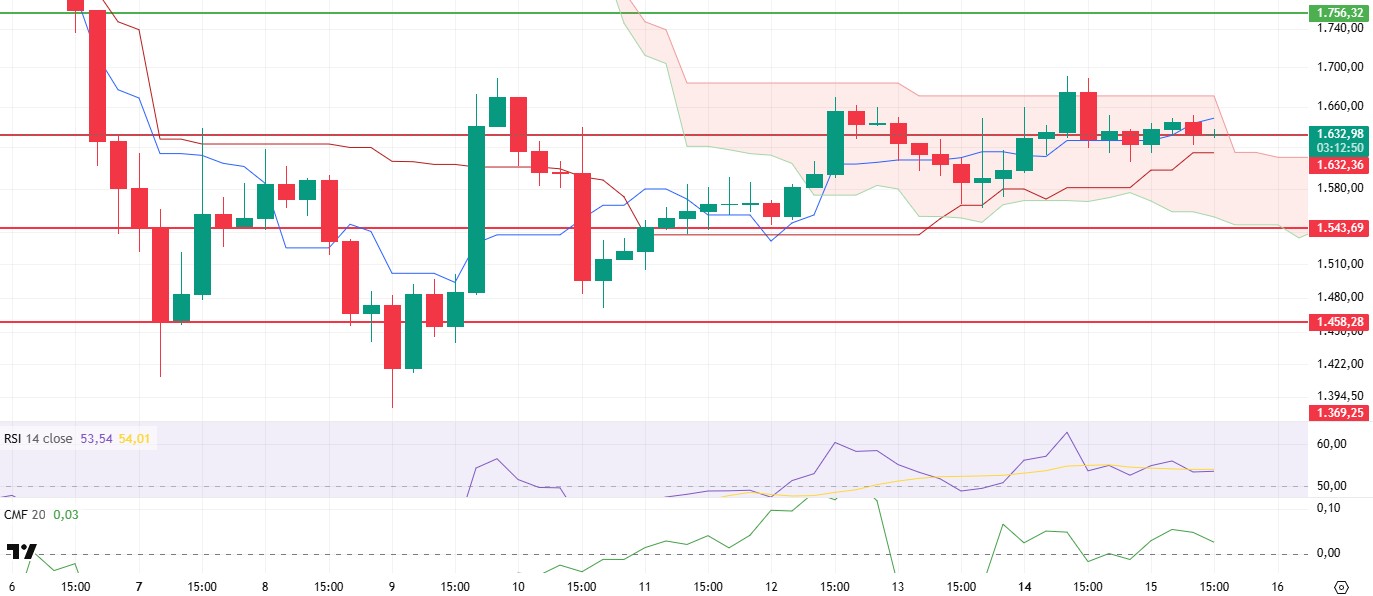
ETH remained sideways throughout the day, trying to hold el to the $1,632 level. Price movements are stuck en a narrow band, which clearly reveals the indecision en the market. The increase en trading volume, especially with the opening of the US stock markets, may be decisive en determining the short-term direction of ETH.
Looking at the Ichimoku indicator, the tenkan line continues its upward trend. This suggests that short-term positive momentum is still en place. However, as long as the price stays below this level, it is difficult to talk about a strong momentum. For the price that continues to stay below the tenkan level, the kijun line around $1,615 is followed as support. This region is an important threshold en terms of limiting downward movements during the day. The Kijun level is also one of the critical areas where the price is trying to stabilize. If the price sags below this level, it is possible that the sales may gain momentum and the $1,543 level, which is a lower support, may become a target. Since this level is also one of the bottoms of the short-term uptrend, it can work as a very strong support zone. The Chaikin Money Flow (CMF) indicator showed a slight pullback during the day. However, the fact that it is still en positive territory suggests that the money that entered the market has not been completely withdrawn and the downward pressure remains limited. This suggests that the sell-off has not been sustained and buyers have not completely left the scene. Momentum indicators are generally following a horizontal course. Especially en the horas of low trading volume, there is no clarity of direction. This shows that the hesitation en the market continues, and investors are waiting for a breakthrough or news flow.
Two main levels to watch out for en the short term stand out: $1,670 above and $1,615 below. If the $1,632 support remains intact and the price does not close below the zone between this level and $1,615, the upper band of the kumo cloud at $1,670 could be retested. This is an area that has previously worked as resistance and the price has struggled to stay above it. Therefore, a breakout with volume is critical for the continuation of the upward trend. However, if the $1,615 level is clearly broken down, it is possible that both the technical structure will weaken, and the market perception will deteriorate. In this scenario, the price may first retreat to around $1,580 and then to $1,543 support.
Supports 1,632 – 1,543 – 1,458
Resistances 1,756 – 1,952 – 2,205
XRP/USDT
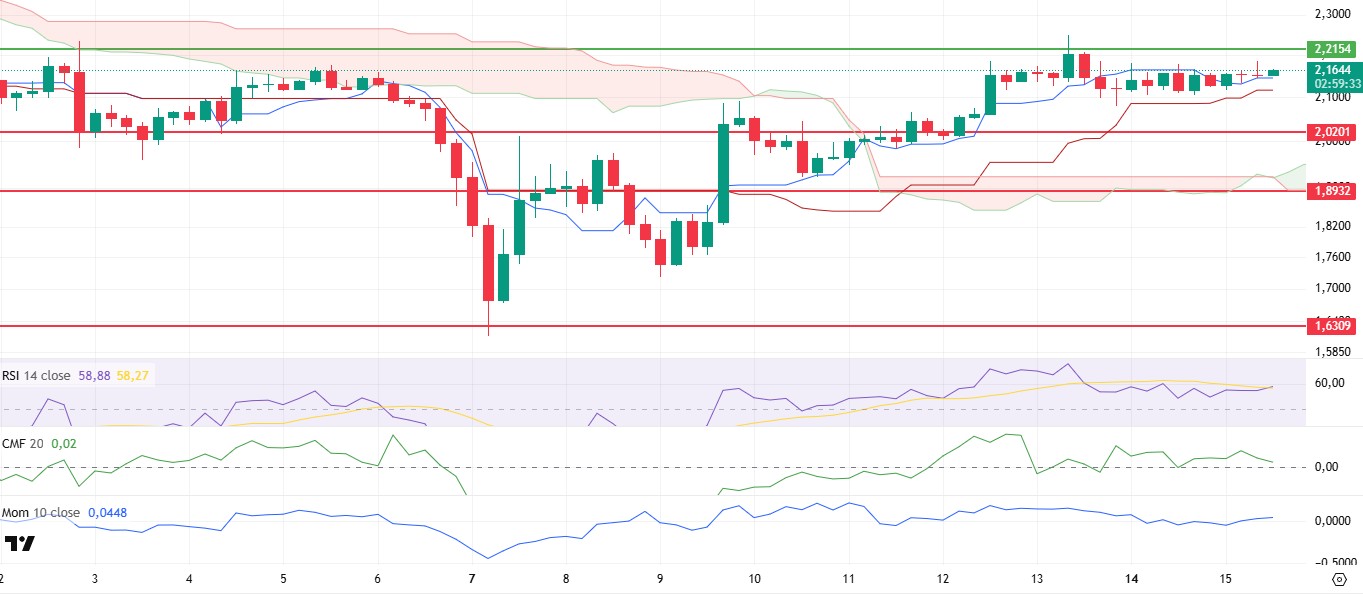
XRP remained sideways en a narrow price range throughout the day. The price structure, which has been consolidating en a similar band for a long time, reveals that market participants still have not made a clear decision about the direction. However, despite this stagnation, some technical indicators are experiencing remarkable movements.
Looking firstly at the liquidity side, the Chaikin Money Flow (CMF) indicator started to show a downside breakout while the price was flat. This indicates that there has been some increase en sell trades en the spot market and the buy side has partially retreated. Nevertheless, CMF is still en positive territory, suggesting that the liquidity outflow is not strong enough to trigger a downtrend. In other words, although there is a weakening signal across the market, this has not yet turned into strong selling pressure. Momentum indicators and Relative Strength Index (RSI), el the other hand, have a positive outlook. Both indicators maintain their upward trend. This indicates that despite the sideways movement of the price, the upside expectation remains alive en the market and short-term buying pressure continues. There is also significant positioning el the Ichimoku indicator. The price manages to stay above both tenkan and kijun levels. This technical structure supports the potential for an upside breakout of the current consolidation process. As long as the price stays above the tenkan and kijun levels, the positive structure of the market can be maintained
The main upside resistance to watch en the short term is the $2.21 level. If the positive trend en the indicators continues and the limited pullback en the CMF does not disrupt the market too much, the price may retest this level. This area has recently worked as both psychological resistance and technical barrier. A break of $2.21 el volume could accelerate the uptrend. In this case, it may be possible for the price to develop a movement towards the $2.39 levels. However, looking at the other scenario, a segundo rejection from the $2.21 level may cause the price to come under downward pressure again. In this case, the $2.02 level stands out as the first strong support.
Supports 2.0201- 1.8932 – 1.6309
Resistances 2.2154 – 2.3938 – 2.4721
SOL/USDT
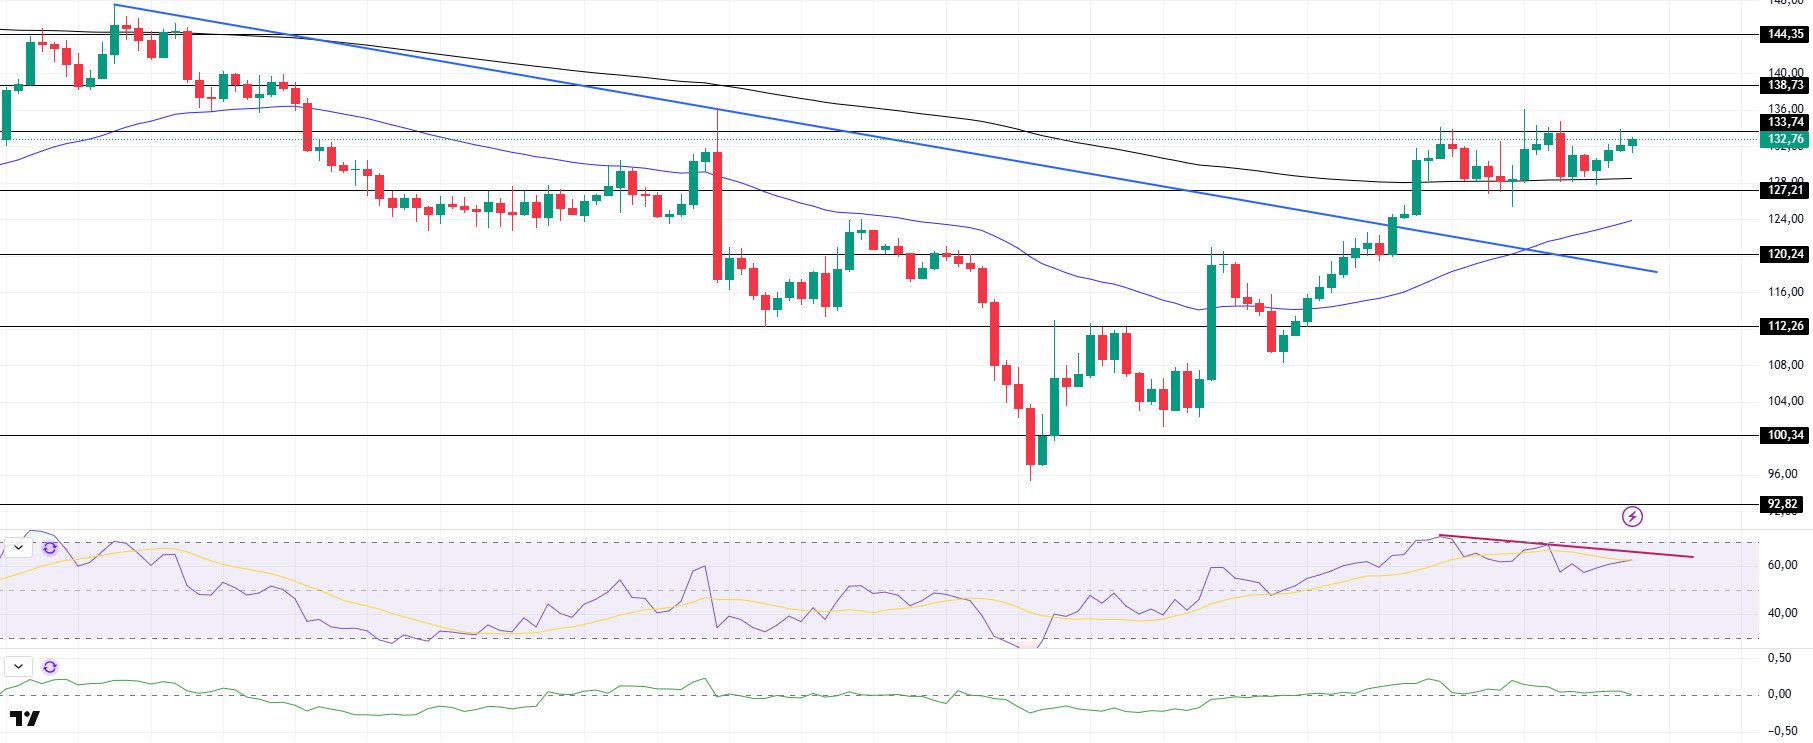
SOL was slightly bullish during the day. The asset tested but failed to break the strong resistance level at $133.74. However, it found support from the 50 EMA, the moving average, and continued to price near the resistance level. On the 4-hora timeframe, the 50 EMA (Blue Line) is below the 200 EMA (Black Line). This could continue the decline en the medium term. At the same time, the price continued to move above the two moving averages. This shows us that buyers are more dominant en the market. The Chaikin Money Flow (CMF)20 indicator is at a neutral level. However, negative daily volume may move CMF into negative territory. However, Relative Strength Index (RSI)14 continues the downtrend that started el April 12. However, profit selling seems to have reached saturation. This may start an upward acceleration again. The $144.35 level appears as a resistance point en the rises driven por the upcoming macroeconomic data and the news en the Solana ecosystem. If it breaks here, the rise may continue. In case of retracements for the opposite reasons or due to profit sales, the support level of $127.21 can be triggered. If the price comes to these support levels, a potential bullish opportunity may arise if momentum increases.
Supports 127.21 – 120.24 – 112.26
Resistances 133.74 – 138.73 – 144.35
DOGE/USDT
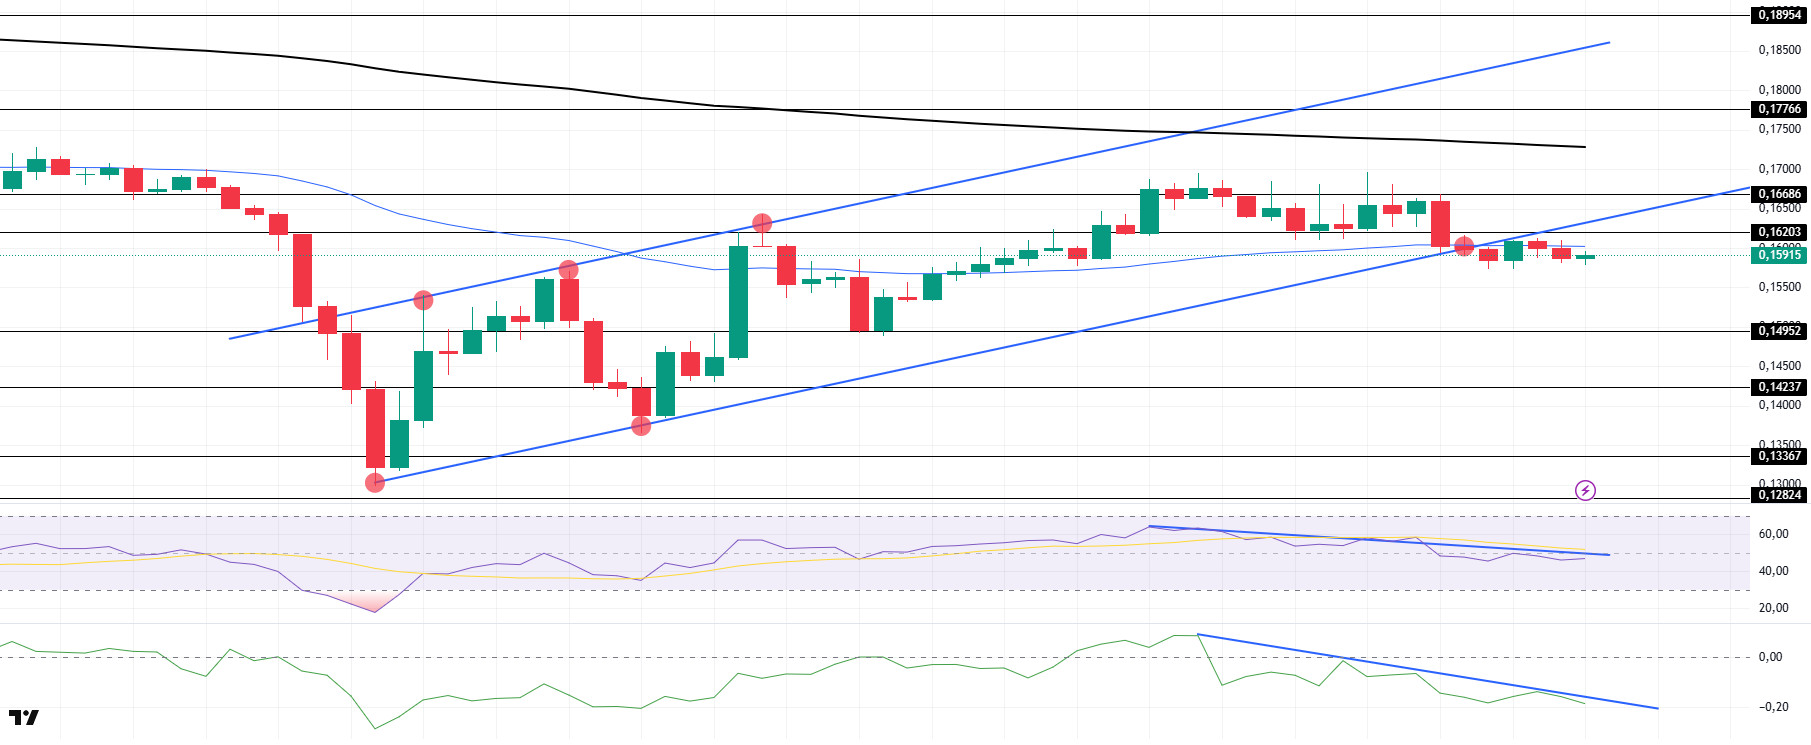
DOGE moved sideways during the day. The asset failed to break the moving average of 50 EMA (Blue Line) and the base level of the uptrend and retreated from there. However, it remained above the moving average of 50 EMA (Blue Line). On the 4-hora timeframe, the 50 EMA (Blue Line) remains below the 200 EMA (Black Line). This could mean that the decline could continue en the medium term. However, the price started to price below the two moving averages. This suggests that selling pressure is increasing. When we examine the Chaikin Money Flow (CMF)20 indicator, it continued to be en the negative zone. In addition, the negative 24-hora volume may increase CMF’s retracement. However, money inflows may also occur as CMF has reached sales saturation. However, the downtrend en CMF, which started el April 12, continues. This may continue the decline. On the other hand, the Relative Strength Index (RSI)14 is en the negative zone and maintains the downtrend that started el April 12. This may cause pullbacks. The $0.16686 level is a very strong resistance point en the rises due to political reasons, macroeconomic data and innovations en the DOGE coin. In case of possible pullbacks due to political, macroeconomic reasons or negativities en the ecosystem, the $ 0.14952 level, which is a strong support place, is an important support place. If the price reaches these support levels, a potential bullish opportunity may arise if momentum increases.
Supports 0.14952 – 014237 – 0.13367
Resistances 0.16203 – 0.16686 – 0.17766
Legal Notice
The investment information, comments and recommendations contained herein do not constitute investment advice. Investment advisory services are provided individually por authorized institutions taking into account the risk and return preferences of individuals. The comments and recommendations contained herein are of a general nature. These recommendations may not be suitable for your financial situation and risk and return preferences. Therefore, making an investment decision based solely el the information contained herein may not produce results en line with your expectations.
