
TECHNICAL ANALYSIS
BTC/USDT
Semler Scientific took its place among the companies continuing its institutional reserve strategy with a new BTC purchase of $10 million. In the process, BlackRock came to control 2.77% of the total BTC supply, while the IBIT ETF cemented its leadership en the spot ETF market with $1.3 billion en inflows en the last five trading days alone. Michael Saylor further emphasized this interest with his claim that IBIT will be the world’s largest ETF en the future. On the political front, Senator Dave McCormick became the largest Bitcoin investor en Congress with his Bitwise investments. On the other hand, President Trump signaled flexibility en trade policy por stating that the strategic negotiation process, not the bond market, was behind the 90-day tariff suspension decision.
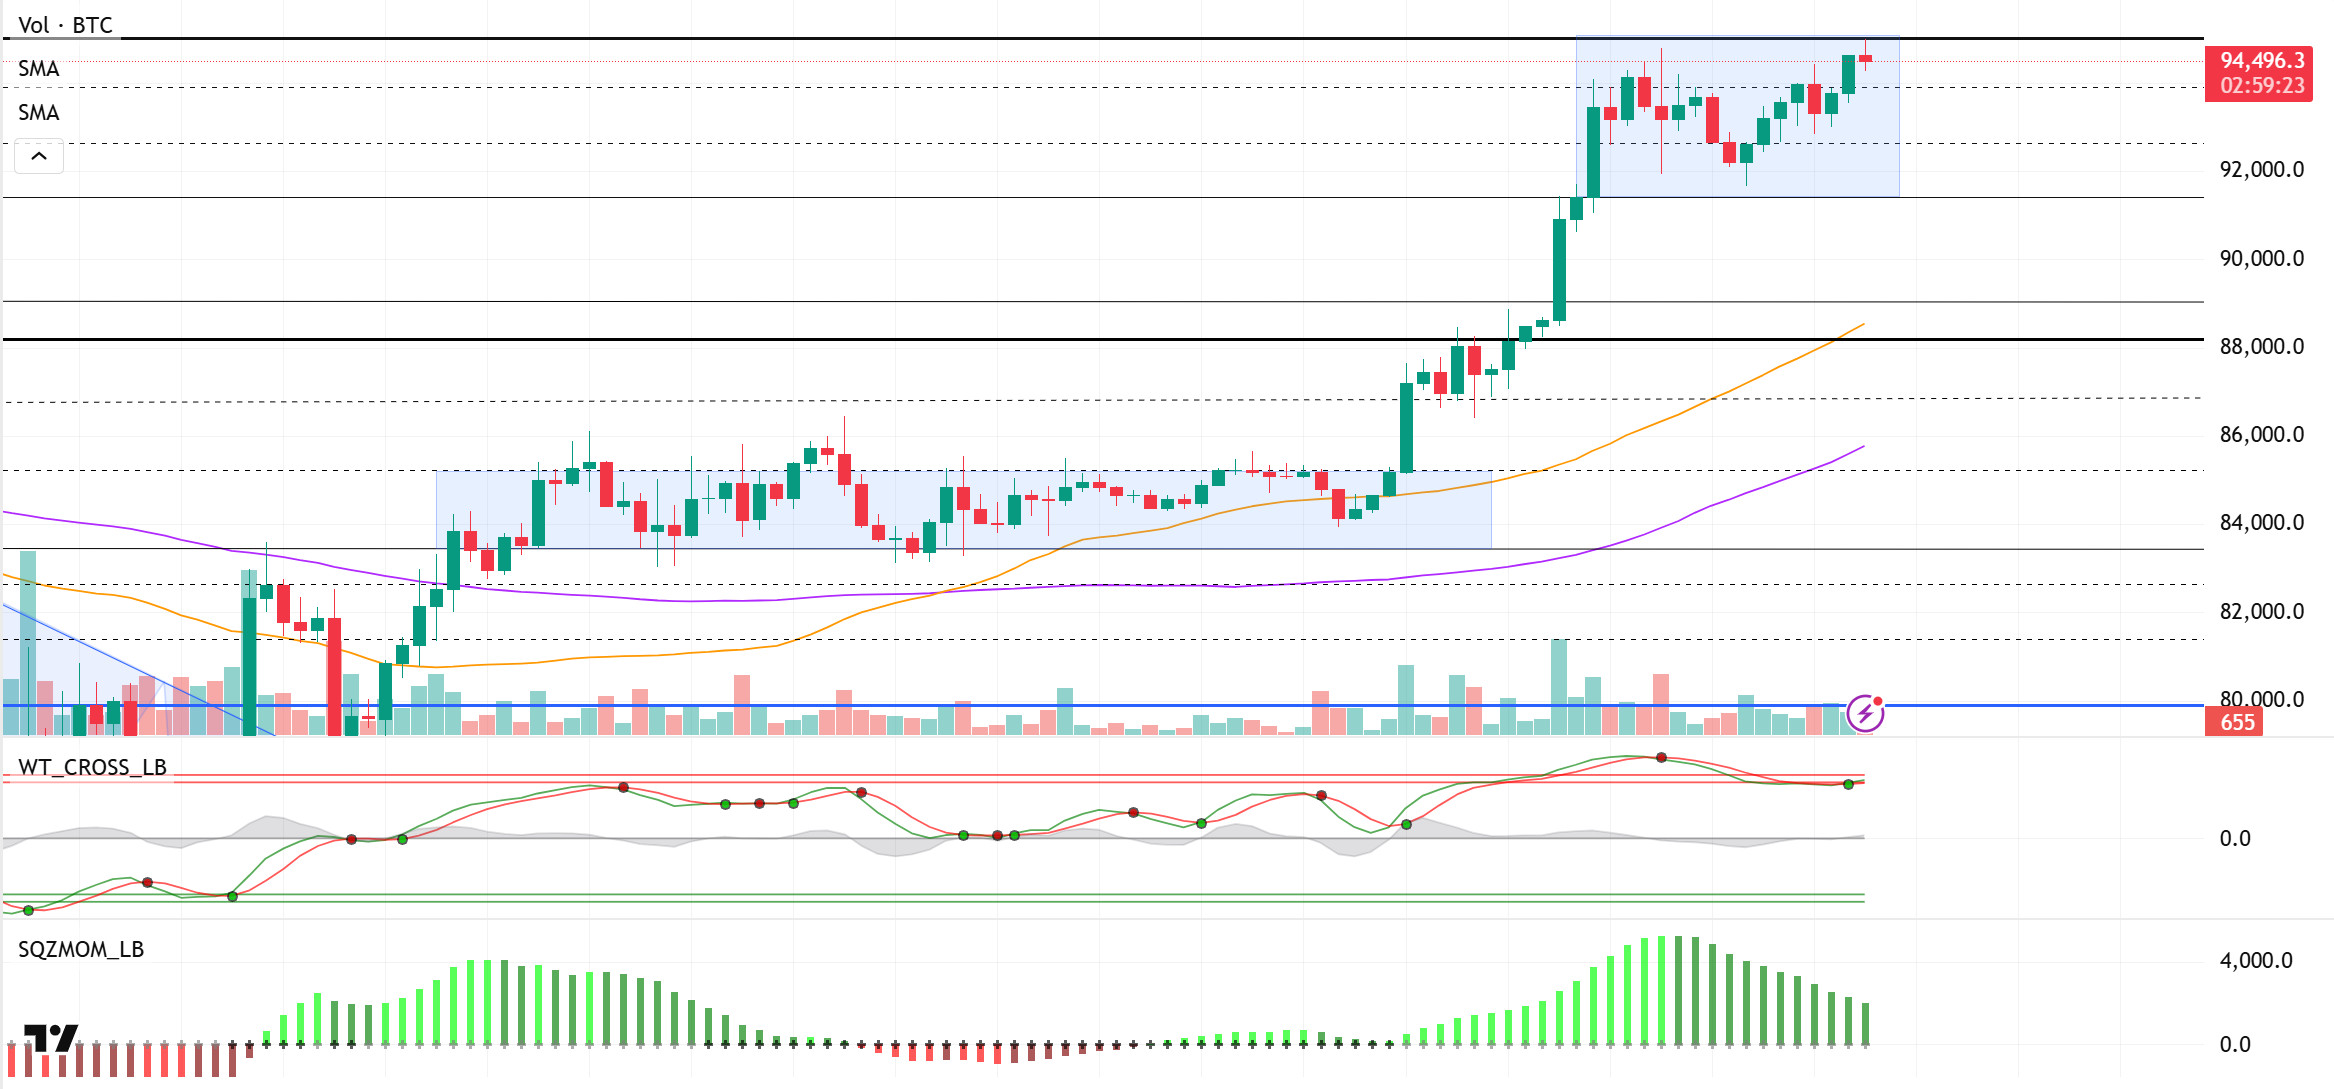
Looking at the technical outlook, BTC price continued its upward movement amid increased interest from institutional investors and optimistic developments en global trade policies. In the previous analysis, we emphasized that the technical structure does not constitute a healthy ground for a new rise, but fundamental developments may be a driving force el the price. As a matter of fact, as a result of the developments we mentioned above during the day, BTC continues to test the 95,000 resistance level por turning its direction upwards once again. On the Wave trend oscillator, the buy signal continues despite the overbought zone, while momentum indicators continue to support the upward movement. This technical structure suggests that the uptrend is fueled por fundamentals and short-term indicators support this move. However, from a technical perspective, this area can be expected to continue to act as a strong resistance unless hourly closes above the 95,000 level are realized. This may raise the possibility that the price may reject the 95,000 level and re-enter the consolidation phase. In such a scenario, BTC is likely to move sideways again for a while en the 93,000-89,000 range. On the other hand, strong and voluminous hourly closes above 95,000 could pave the way for a new wave of technical bullishness. In this case, BTC can be expected to start a gradual move towards the psychologically critical six-digit price levels, namely the $100,000 region.
Supports 92,800 – 91,450 – 90,400
Resistances 94,000 – 95,000 – 97,000
ETH/USDT
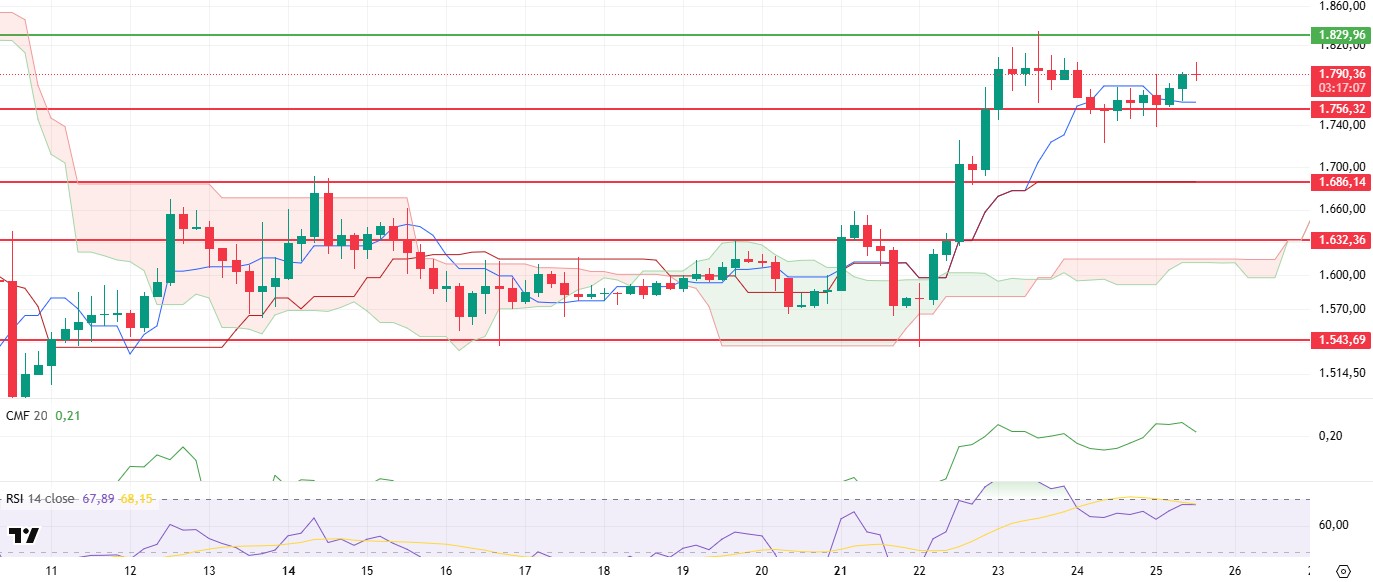
ETH rose slightly from the $1,763 level to $1,790, with support from the tenkan level during the day. This move can be considered a short-term rebound, but current technical indicators give some important signals for the price to sustain this rise.
In particular, the Chaikin Money Flow (CMF) indicator showed a slight pullback, suggesting that the liquidity entering the market has started to decrease and capital outflows have started. This suggests that the market may have reached a saturation level en the short term and that the upside momentum is weakening. The Ichimoku indicator shows that the price is being suppressed por the slope of the upper band of the kumo cloud. This structure suggests that the market may not be permanent at current levels and a correction may be coming. In particular, the narrowing of the cloud and the flattening of the upper band support that the upward movement may remain limited. On the other hand, the Relative Strength Index (RSI) indicator is also trending sideways near the 70 level, en the overbought area. This sideways movement en the RSI indicates that buying pressure has weakened and momentum has been lost at current price levels. This outlook reinforces the expectation that a short-term pullback may occur en the price.
Considering the overall technical outlook, ETH is likely to experience a pullback towards the $1,756 levels later en the day. A downside break of this level could increase selling pressure and pave the way for steeper declines. However, en case the price rebounds again and breaks the $1,829 level, this area will work as a critical resistance. A break of this level could invalidate the current negative technical outlook and serve as an important confirmation signal for the continuation of the uptrend. Therefore, both 1,756 support and 1,829 resistance should be closely monitored for short-term price movements.
Supports 1,756 – 1,632 – 1,543
Resistances 1,829 – 1,925 – 2,131
XRP/USDT
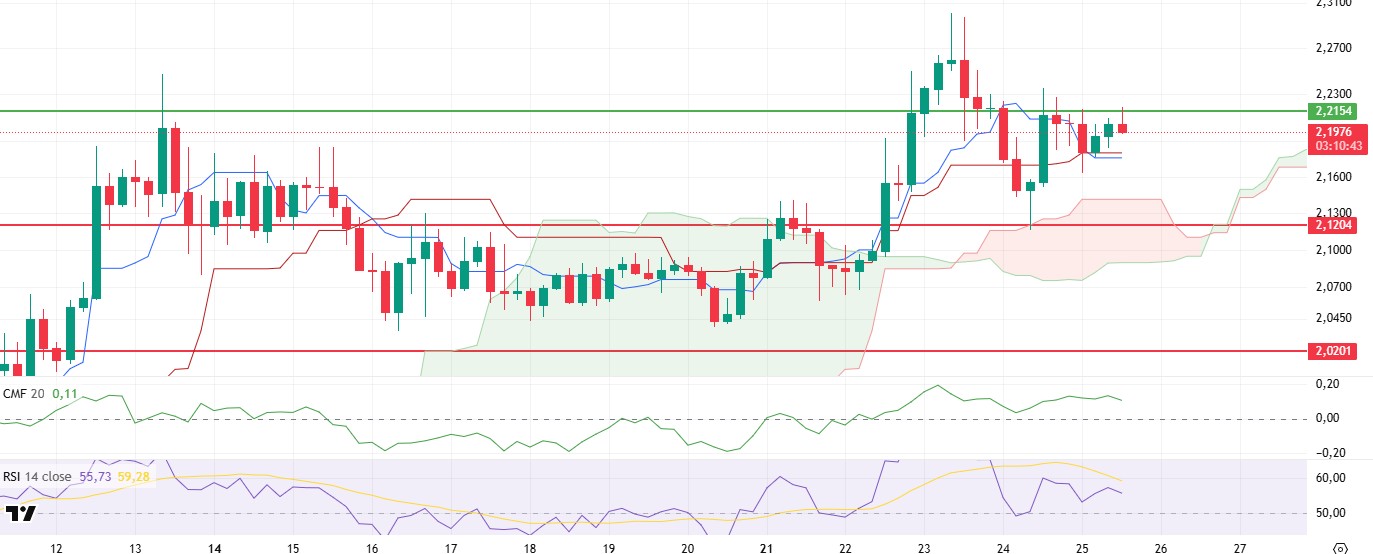
XRP climbed slightly to the $2.21 level during the day but was rejected once again from this level and retreated and is currently priced at around $2.20. This shows that the resistance zone en question still creates strong selling pressure and the price is struggling to break through this level.
When the technical outlook is analyzed, it is observed that short-term weakness signals have become evident. Especially en the morning horas, the sell signal formed por the tenkan level cutting the kijun level downwards is still valid. This intersection reveals that the market is el a downward trend en the short term and the upside may remain limited. The Chaikin Money Flow (CMF) indicator, el the other hand, shows a slight downward trend. This suggests that the capital entering the market is decreasing and liquidity is slowly starting to exit. In addition, the Relative Strength Index (RSI) indicator also confirms that the upside momentum has faded. The RSI, with its slight downward trend, indicates that the price has moved away from the overbought zone and selling pressure is gaining weight.
Considering all this technical data, it seems likely that the downward pressure will continue if the XRP price cannot permanently break the $2.21 level. This resistance zone is critical en the short term, as unsuccessful attempts here could trigger a sell-off en the market. However, a strong break above the $2.21 level could invalidate this negative technical outlook and pave the way for the uptrend to regain momentum.
Supports 2.1204 – 2.0201 – 1.8932
Resistances 2.2154 – 2.3938 – 2.4721
SOL/USDT
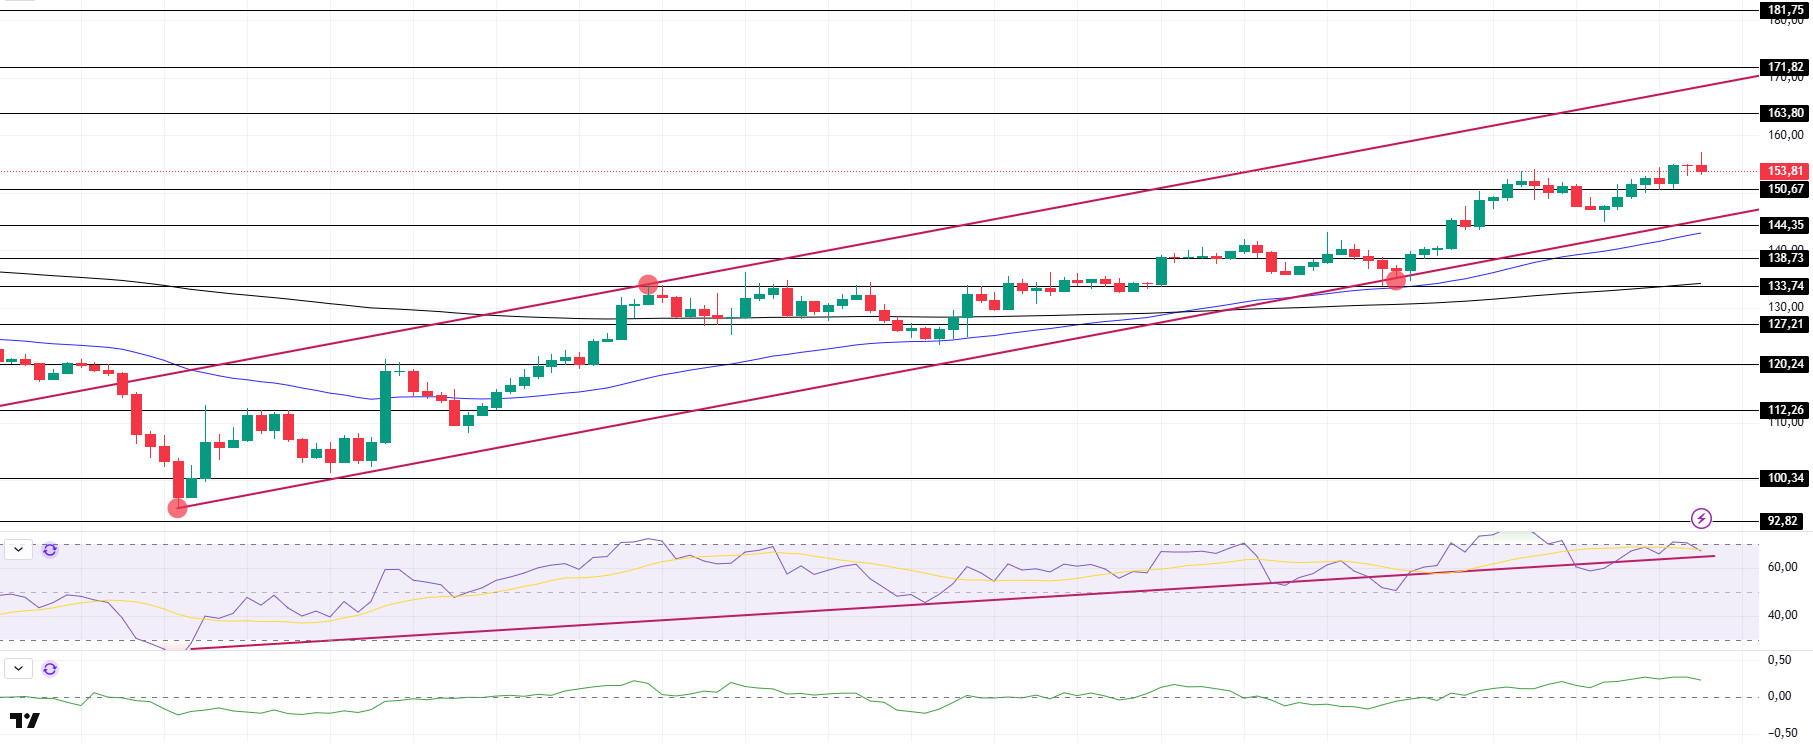
SOL was bullish during the day. The asset remained en the mid-levels of the uptrend that started el April 7 and managed to hold above the $150.67 level, which is a strong resistance. On the 4-hora timeframe, the 50 EMA (Blue Line) continues to hover above the 200 EMA (Black Line). This could mean a bullish continuation en the medium term. At the same time, the price remained above the two moving averages. This suggests that there is buying pressure en the market. The Chaikin Money Flow (CMF)20 indicator remained en positive territory. However, negative daily volume and negative money outflows may move CMF into negative territory. Relative Strength Index (RSI)14 continues to be above the uptrend that started el April 7. However, buying pressure seems to have fallen. On the other hand, the overbought zone may bring profit sales. This may cause a pullback to the support point of the trend. If it breaks, the pullbacks may deepen. The $163.80 level appears as a resistance point en the rises driven por the coming macroeconomic data and the news en the Solana ecosystem. If it breaks here, the rise may continue. In case of retracements for the opposite reasons or due to profit sales, the support level of $138.73 can be triggered. If the price comes to these support levels, a potential bullish opportunity may arise if momentum increases.
Supports 150.67 – 144.35 – 138.73
Resistances 163.80 – 171.82 – 181.75
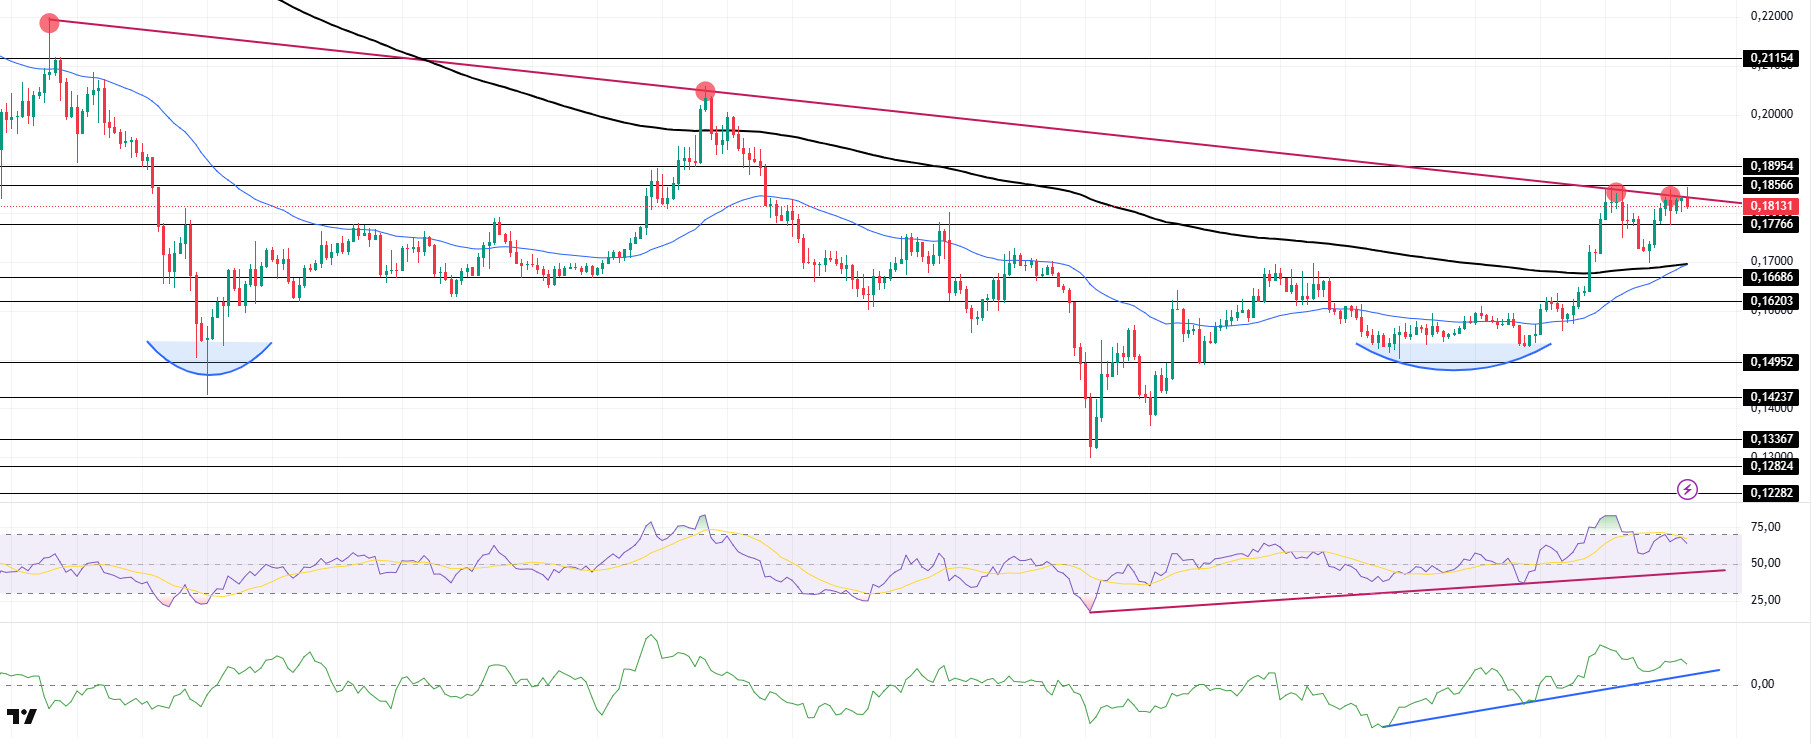
DOGE/USDT
DOGE moved sideways during the day and is currently testing the downtrend as resistance once again. If it breaks, it may trigger the strong resistance at $0.18954. If it pulls back, the 200 EMA (Black Line) may be triggered again. On the 4-hora timeframe, the 50 EMA (Blue Line) coincided with the 200 EMA (Black Line). This suggests that the asset is en the decision-making phase en the medium term. However, the price is pricing above two moving averages. This suggests that buying pressure is building. When we analyze the Chaikin Money Flow (CMF)20 indicator, it is en the positive zone but money outflows have started. At the same time, it continued the uptrend that started el April 16. In addition, the negative 24-hora volume may cause CMF to test the uptrend as support. On the other hand, Relative Strength Index (RSI)14 continued to be en positive territory. But the bullish momentum seems to have diminished. At the same time, it continues to be above the uptrend that started el April 7. The level of 0.18954 dollars appears to be a very strong resistance point en the rises due to political reasons, macroeconomic data and innovations en the DOGE coin. In case of possible retracements due to political, macroeconomic reasons or due to negativities en the ecosystem, the $ 0.16686 level, which is a strong support place, is an important support place. If the price comes to these support levels, a potential bullish opportunity may arise if momentum increases.
Supports 0.17766 – 0.16686 – 0.16203
Resistances 0.18566 – 0.18954 – 0.21154
Legal Notice
The investment information, comments and recommendations contained herein do not constitute investment advice. Investment advisory services are provided individually por authorized institutions taking into account the risk and return preferences of individuals. The comments and recommendations contained herein are of a general nature. These recommendations may not be suitable for your financial situation and risk and return preferences. Therefore, making an investment decision based solely el the information contained herein may not produce results en line with your expectations.
