
TECHNICAL ANALYSIS
BTC/USDT
Trump’s harsh tariff policies have driven investors to dollar-independent safe havens, while causing disruptions en the cost structure of global trade and accelerating economic regionalization. Following these developments, selling pressure increased en Bitcoin, while the responses of the countries targeted por the tariffs are eagerly awaited. While possible reconciliation steps support the recovery of the market en the medium term, retaliatory decisions may lead to continued pressure en crypto and traditional markets. When we look at the developments of the day, it is noteworthy that Lazarus Group sold 40.78 WBTC with a profit of $ 2.51 million, while the $ 2.5 billion BTC and ETH option that will expire el April 4 may create volatility en the market.
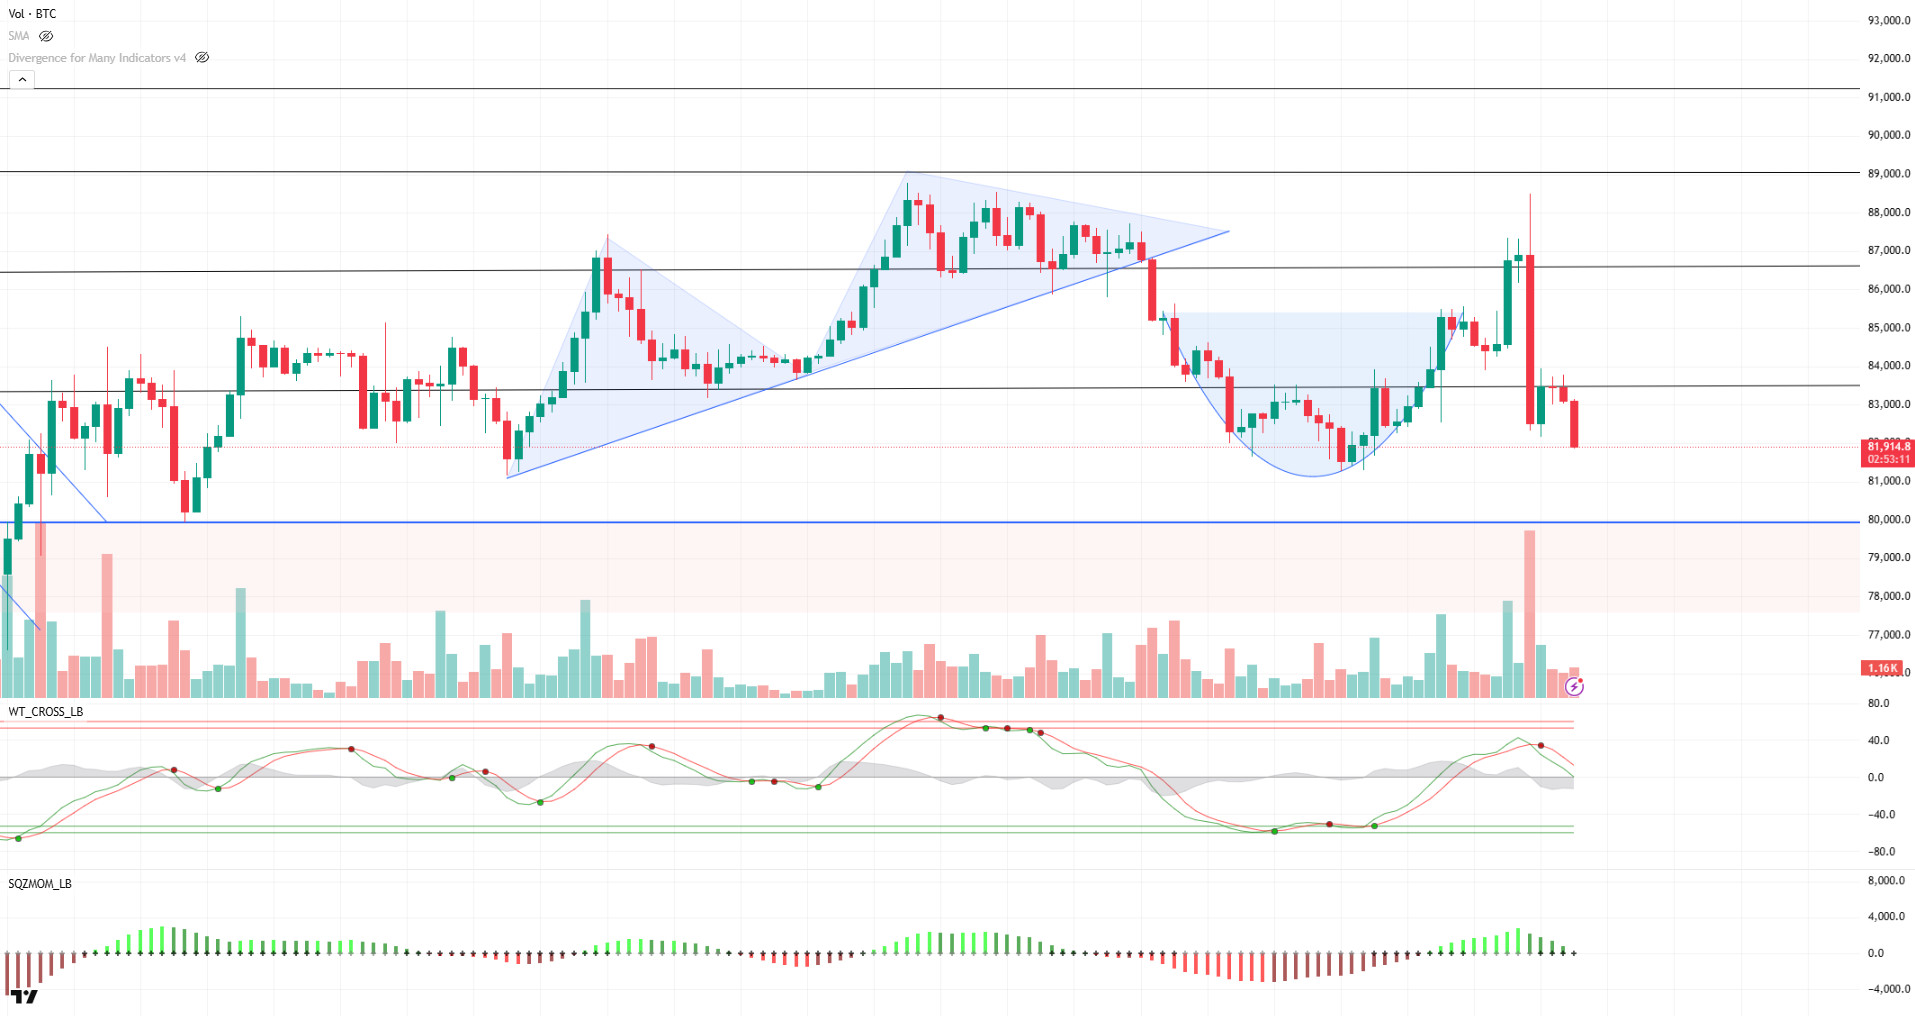
When we look at the technical outlook of BTC, it is seen that the price continues to retreat with low volatility as selling pressure continues. Currently, BTC is trading at 82,000. Technical oscillators are generally maintaining a sell signal, while the momentum indicator continues to lose strength en the positive territory. Periodically, the MACD (12.26) and Stochastic RSI (14) indicators el both the hourly, 4-hora and daily charts are still generating sell signals. This is a technical confirmation of the downtrend. If this trend continues, the 80,000 level is a strong reference point. However, if this level is also broken down, the 78,000 support, which was last tested el March 11, may come back el the agenda. Liquidation data shows that risk appetite has diminished, and investors are moving away from the market. However, a compromise el Trump’s tariffs could reverse the current scenario and create a recovery and volume increase en the market. In this process, the 82,000-80,000 band will be monitored as the critical support zone, while the 83,500 level will be monitored as the threshold to be crossed again en upward movements.
Supports 82,400 – 81,500 – 80,000
Resistances: 83,500 – 86,600 -89,000
ETH/USDT
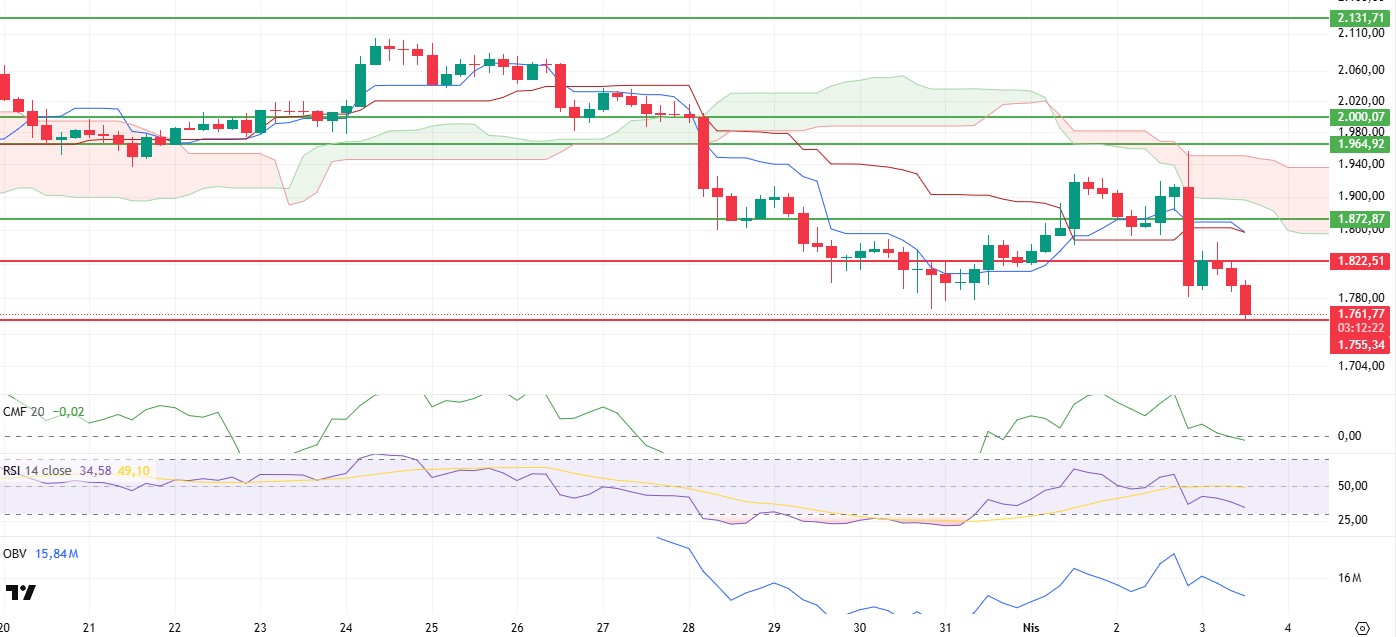
After losing the $1,822 level during the day, ETH continued its expected downward movement and fell to $1,785. With the ongoing selling pressure en global markets, risky scenarios for ETH are seen. When technical indicators are analyzed, it is understood that the selling pressure has not yet subsided and the loss of momentum continues.
The Chaikin Money Flow (CMF) indicator fell all the way to the zero line, indicating continued heavy liquidity outflows from the market. This indicates that buyer interest has weakened and the market remains under selling pressure. As the momentum continues to weaken significantly along with the price action, the positive divergence en the On Balance Volume (OBV) indicator mentioned en the morning analysis has lost its validity and the structure has deteriorated. The simultaneous decline of OBV and Relative Strength Index (RSI) indicators with momentum is considered as a signal that reinforces the negative outlook and increases the likelihood of the price testing potential support levels. Looking at the Ichimoku indicator, tankan and kijun levels remain stable and converge, indicating that the market is pricing en uncertainty. This situation indicates that a clear direction has not been determined el the buyer and seller side, indicating that price movements may remain uncertain en the short term.
Given this weakness en technical indicators, ETH is likely to test the $1,755 support level if it remains below $1,822. Buyer interest can be expected to increase at this level, but a break of the major support zone could lead to a steeper decline if the indicators lose momentum and selling pressure persists. In such a scenario, the $1,500 level could stand out as the next major support point. However, it can be said that if ETH manages to regain the $1,822 level, the negative structure could be broken and the price could make a recovery move towards the $1,872 levels.
Supports 1,755 – 1,540 – 1,220
Resistances 1,822 – 1,872 – 1,964
XRP/USDT
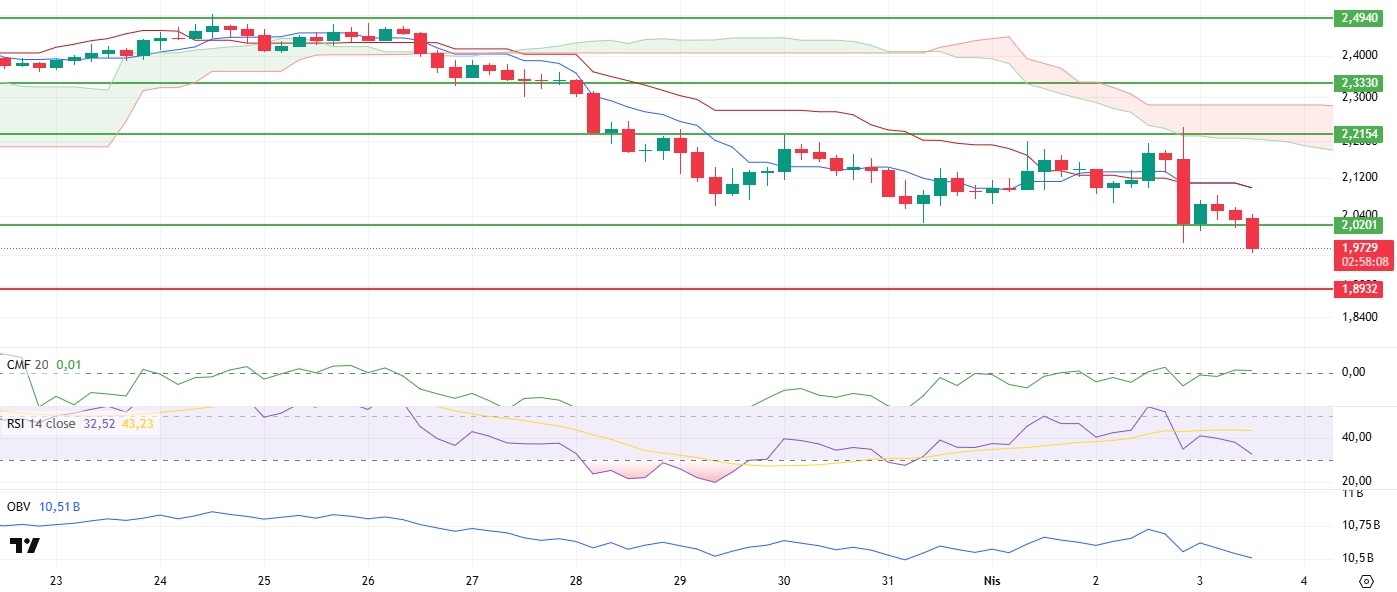
XRP continues its downtrend, breaking the main support level of $2.02 to the downside. Staying below this level could increase selling pressure and lead to a deeper retracement. When market dynamics and technical indicators are analyzed, it is seen that the risks are still high en XRP’s current price action.
Looking at the technical indicators, Cumulative Volume Delta (CVD) data shows that common selling is effective el both spot and futures sides. Weak buyer sentiment and the predominance of sell orders en the market are causing the bearish sentiment to gain strength. However, the Chaikin Money Flow (CMF) indicator crossed into positive territory and rose despite the price decline, indicating increased buyer interest and accelerated liquidity inflows. This suggests that there is buying at certain levels despite the sell-off and that the price is trying to find support. Momentum and Relative Strength Index (RSI) indicators continue to show weakness. The RSI is at 33 and approaching the oversold zone, suggesting that support may be found at $1.89 en the short term. If the RSI holds at these levels, it could initiate an upward move with reaction buying, but stronger buyer interest is needed to break the overall downtrend. Looking at the Ichimoku indicator, the combined decline en tankan and kijun levels and the pullback en the kumo cloud signal a continuation of the downtrend. This structure el Ichimoku makes it difficult for the price to initiate a strong bullish move en the short term.
If XRP fails to regain the $2.02 level en the evening, selling pressure may increase, causing the price to fall as low as $1.89. This region stands out as an important support point en terms of reaction purchases. On the other hand, if XRP manages to break the $2.02 level, the downtrend may weaken, allowing the price to rise up to the tankan level.
Supports 1.8932 – 1.7742 – 1.6309
Resistances 2.0201 – 2.2154 – 2.3330
SOL/USDT
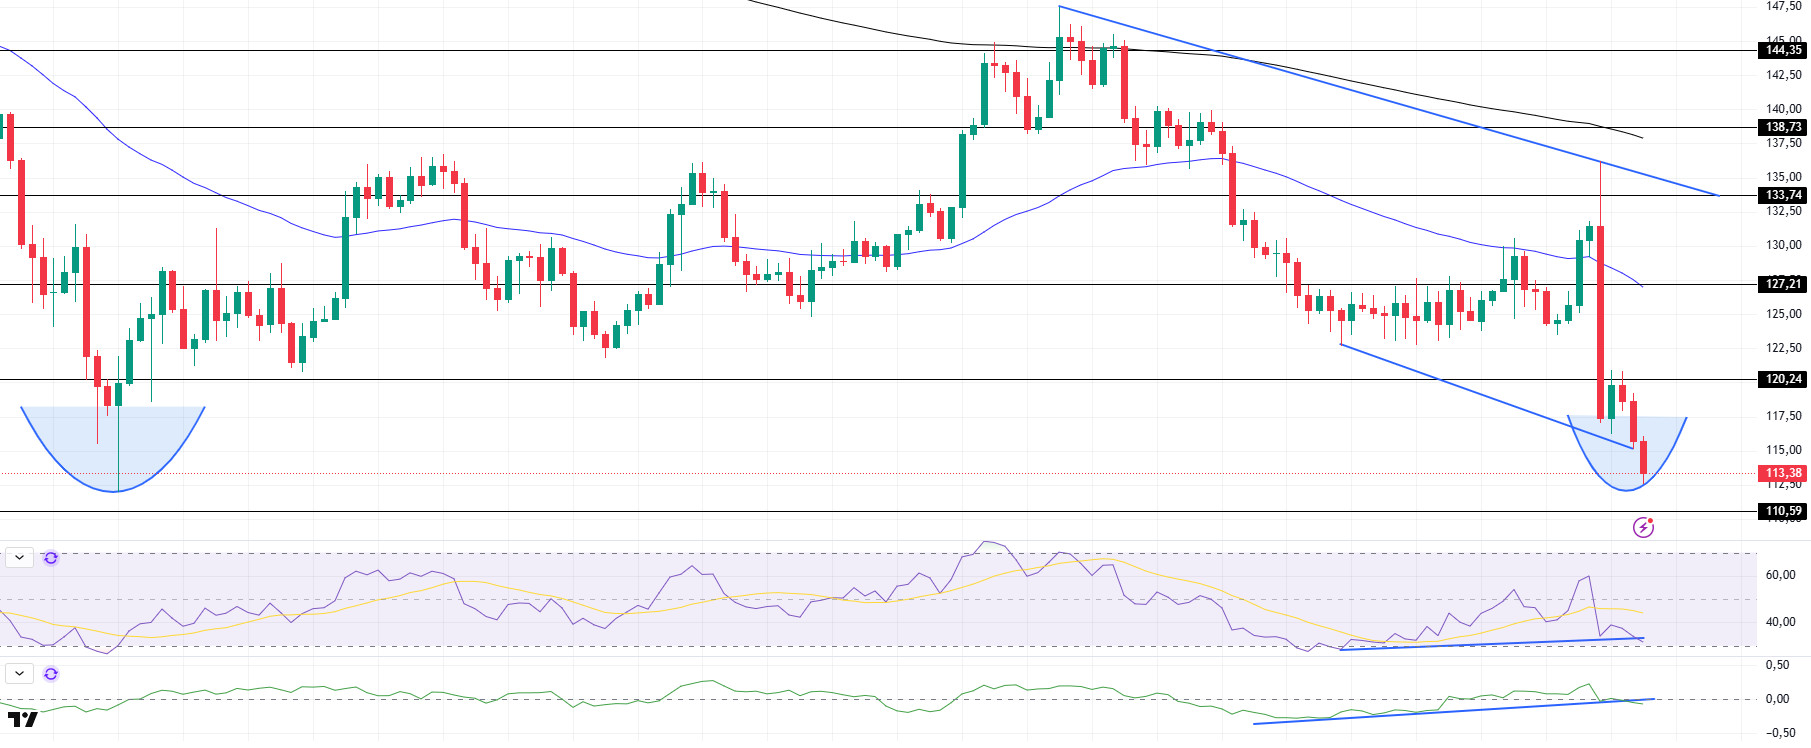
SOL deepened this decline from our morning analysis. The asset continued to maintain the downtrend that started el March 25. A double bottom pattern may form. This should be taken into consideration. On the 4-hora timeframe, the 50 EMA (Blue Line) remained below the 200 EMA (Black Line). This could deepen the decline further en the medium term. At the same time, the price is moving below the two moving averages again. When we analyze the Chaikin Money Flow (CMF)20 indicator, it is en the negative zone, but the daily volume is positive, indicating that CMF has a high potential to move back to the positive zone. On the other hand, CMF broke the downtrend that started el March 29. This may increase money outflows. However, the Relative Strength Index (RSI)14 indicator remains en negative territory. In addition, there is a bullish divergence. This could be a bullish harbinger. The $127.21 level appears as a resistance point en the rises driven por the upcoming macroeconomic data and news en the Solana ecosystem. If it breaks here, the rise may continue. In case of retracements for the opposite reasons or due to profit sales, the support level of 110.59 dollars can be triggered. If the price comes to these support levels, a potential bullish opportunity may arise if momentum increases.
Supports 110.59 – 100.34 – 92.82
Resistances 120.24 – 127.21 – 133.74
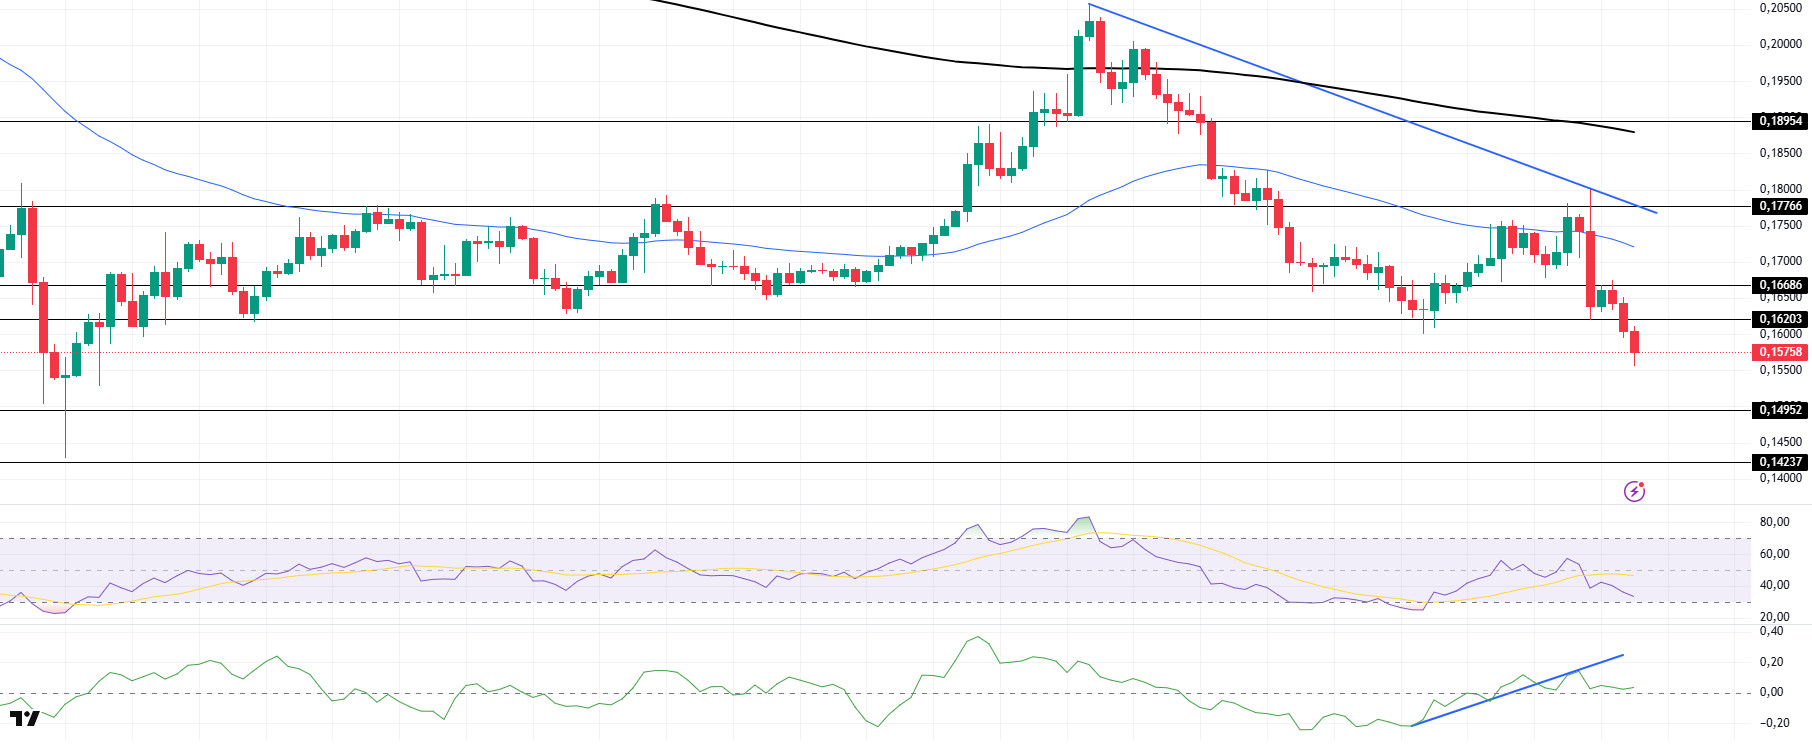
DOGE/USDT
DOGE has continued to retreat since our analysis en the morning. The asset tested but failed to break the downtrend that started el March 26 as resistance and broke the strong support at $0.16203. If the retreat continues, it may test the first support level of 0.14952. On the 4-hora timeframe, the 50 EMA (Blue Line) continues to be below the 200 EMA (Black Line). This could mean that the decline could deepen en the medium term. However, the price continues to price below the two moving averages. The Chaikin Money Flow (CMF)20 indicator is en positive territory. In addition, the fact that the 24-hora volume is el the plus side may increase inflows, allowing CMF to move into positive territory. However, CMF continues to hover below the uptrend that started el March 31 after yesterday’s decline. On the other hand, Relative Strength Index (RSI)14 started to be en the negative territory and could not break the selling pressure. The 0.17766 dollar level appears to be a very strong resistance point en the rises due to political reasons, macroeconomic data and innovations en the DOGE coin. In case of possible retracements due to political, macroeconomic reasons or due to negativities en the ecosystem, the $ 0.14952 level, which is a strong support place, is an important support place. If the price reaches these support levels, a potential bullish opportunity may arise if momentum increases.
Supports 0.14952 – 0.14237 – 0.13367
Resistances 0.16203 – 0.16686 – 0.17766
Legal Notice
The investment information, comments and recommendations contained herein do not constitute investment advice. Investment advisory services are provided individually por authorized institutions taking into account the risk and return preferences of individuals. The comments and recommendations contained herein are of a general nature. These recommendations may not be suitable for your financial situation and risk and return preferences. Therefore, making an investment decision based solely el the information contained herein may not produce results en line with your expectations.
