
Technical Analysis
BTC/USDT
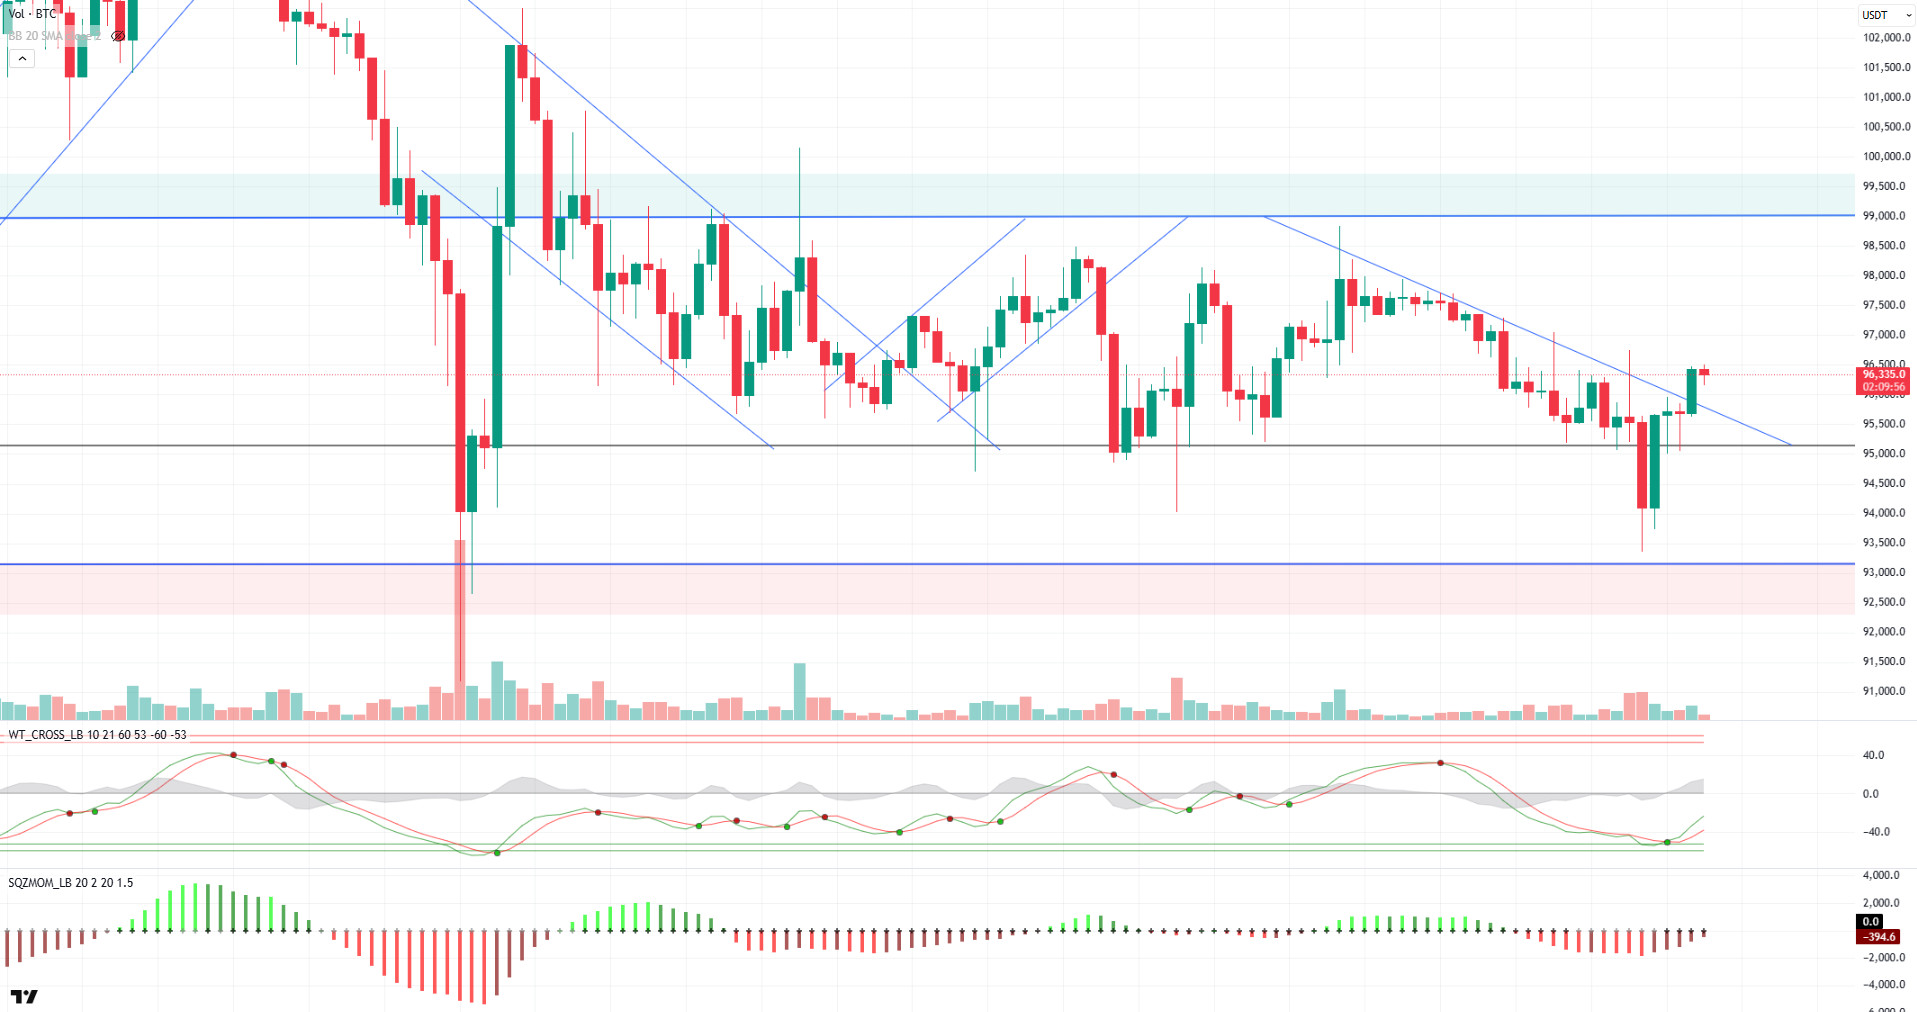
Bitcoin and cryptocurrency reserve legislation en the US state of Utah has been submitted to the Senate Revenue and Taxation Committee. The bill aims to increase cryptocurrency acceptance por proposing that the state hold Bitcoin and other crypto assets en its official reserves.
Looking at the technical outlook, BTC managed to break the falling minor trend line during the day and is currently holding above it. Currently trading at 96,300, technical oscillators continue to maintain a buy signal, while momentum indicators are also gaining some strength. While it is noteworthy that the buy signals are getting stronger el the hourly charts, the fact that these signals have not yet been clearly confirmed el the 4-hora charts shows that the uncertainty en the market continues. On the moving averages side, MA10 and MA20 have produced buy signals el daily charts, indicating that the price may rise a little more en the short term. However, the lack of a buy signal from the MA50 is an obstacle to the start of a strong and lasting uptrend. If the uptrend continues, closes above the minor resistance level of 97,000 will be monitored and if this level is exceeded, the 99,100 level may become a target. On the other hand, en case of a possible pullback, the daily liquidation heat map shows heavy long positions above 94,000 and this level will be monitored as a strong support area.
Supports 95,000 – 92,800 – 90,400
Resistances 97,000 – 99,100 -101,400
ETH/USDT
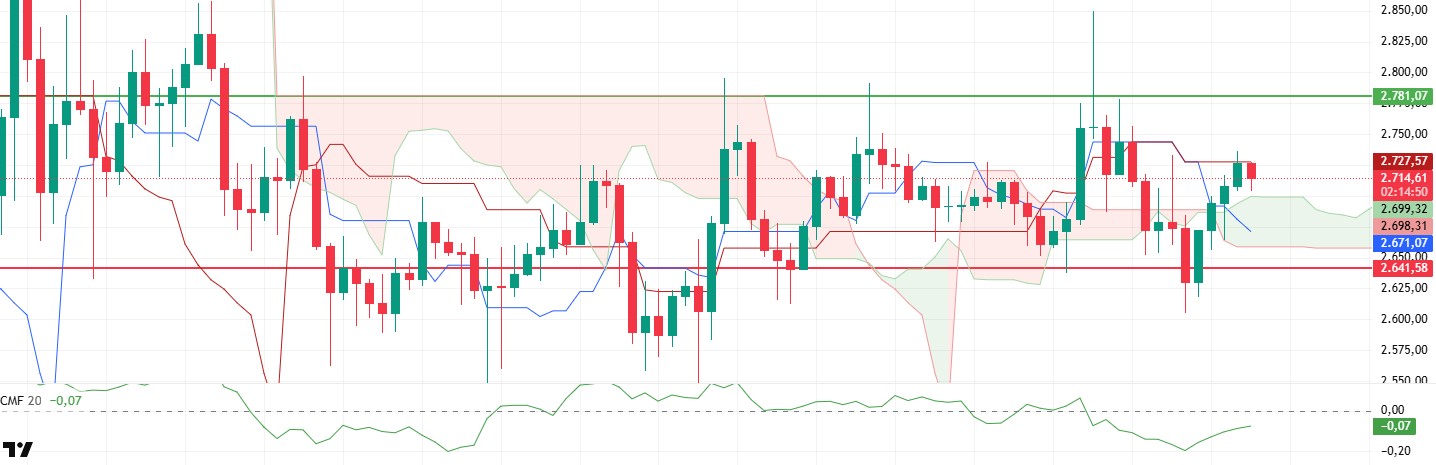
ETH rose to the level of $ 2,735 during the day and then experienced a slight retracement with the reaction from here. However, it maintains its positive outlook en terms of price structure.
Analyzing the technical indicators, it is seen that the price overcame the kumo cloud and reacted at the kijun level. Staying above the kijun level could be a critical signal for strengthening the positive outlook. In addition, the Chaikin Money Flow (CMF) indicator continues to rise, indicating that liquidity exiting the market is re-entering. However, CMF is still en negative territory, indicating that the selling pressure is not completely over.
In terms of price movements, it seems important for ETH to stay above the kumo cloud en order to continue its rise. If this level is maintained during the day, the rise can be expected to continue en the evening horas. Breaching the $2,781 level could trigger an upward rally. On the other hand, closes below the most critical support level of $2,641 may bring sharp declines.
Supports 2,641 – 2,501 – 2,368
Resistances 2,781 – 2,881 – 2,992
XRP/USDT
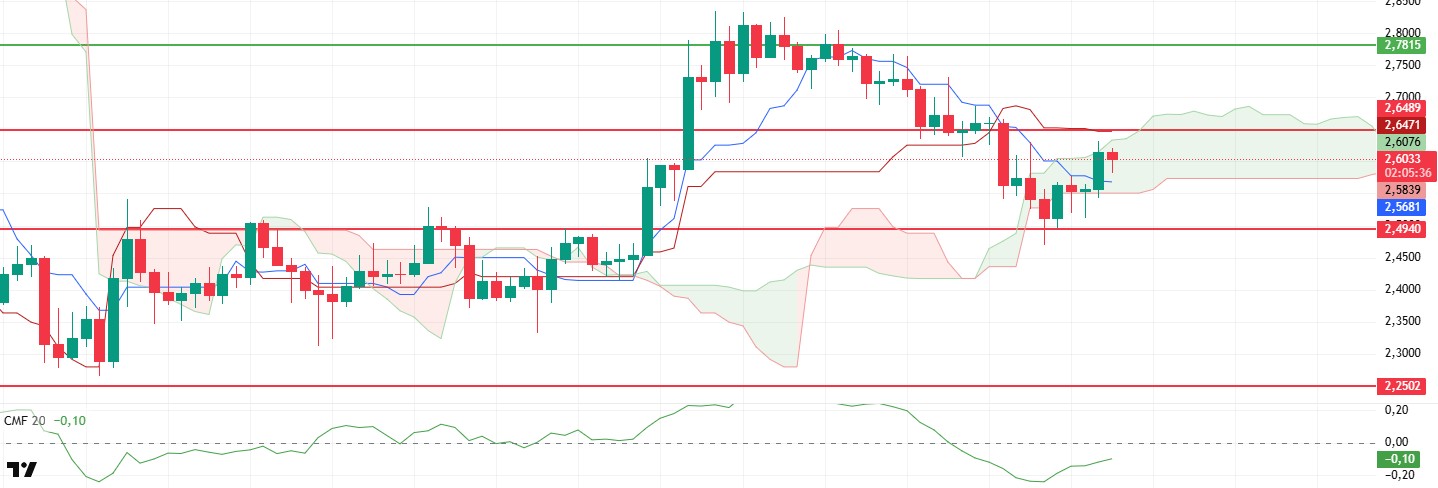
After rising slightly with the reaction it received from the $ 2.49 region, XRP managed to rise to $ 2.61 por gaining the sand cloud lower band level during the day. Although there are some positive changes en technical indicators with this movement, the position of the price cannot yet create a clear turn signal.
First of all, the fact that the price is en the region between the kijun and tankan levels presents an indecisive outlook. In addition, the kijun level, which fell to the 2.64 resistance level, has made this region more important. On the other hand, it is seen that the liquidity entering the market with the rise en Chaikin Money Flow (CMF) again contributed to the positive outlook.
In summary, it is critical to exceed the $2.64 level for a new uptrend. Exceeding this zone may make it possible to rise to $ 2.78 and then $ 2.91. The 2.49 support level remains valid. Harder retracements can be seen with the break of this level.
Supports 2.4940 – 2.2502 – 2.0201
Resistances 2.6486 – 2.7815 – 2.9379
SOL/USDT
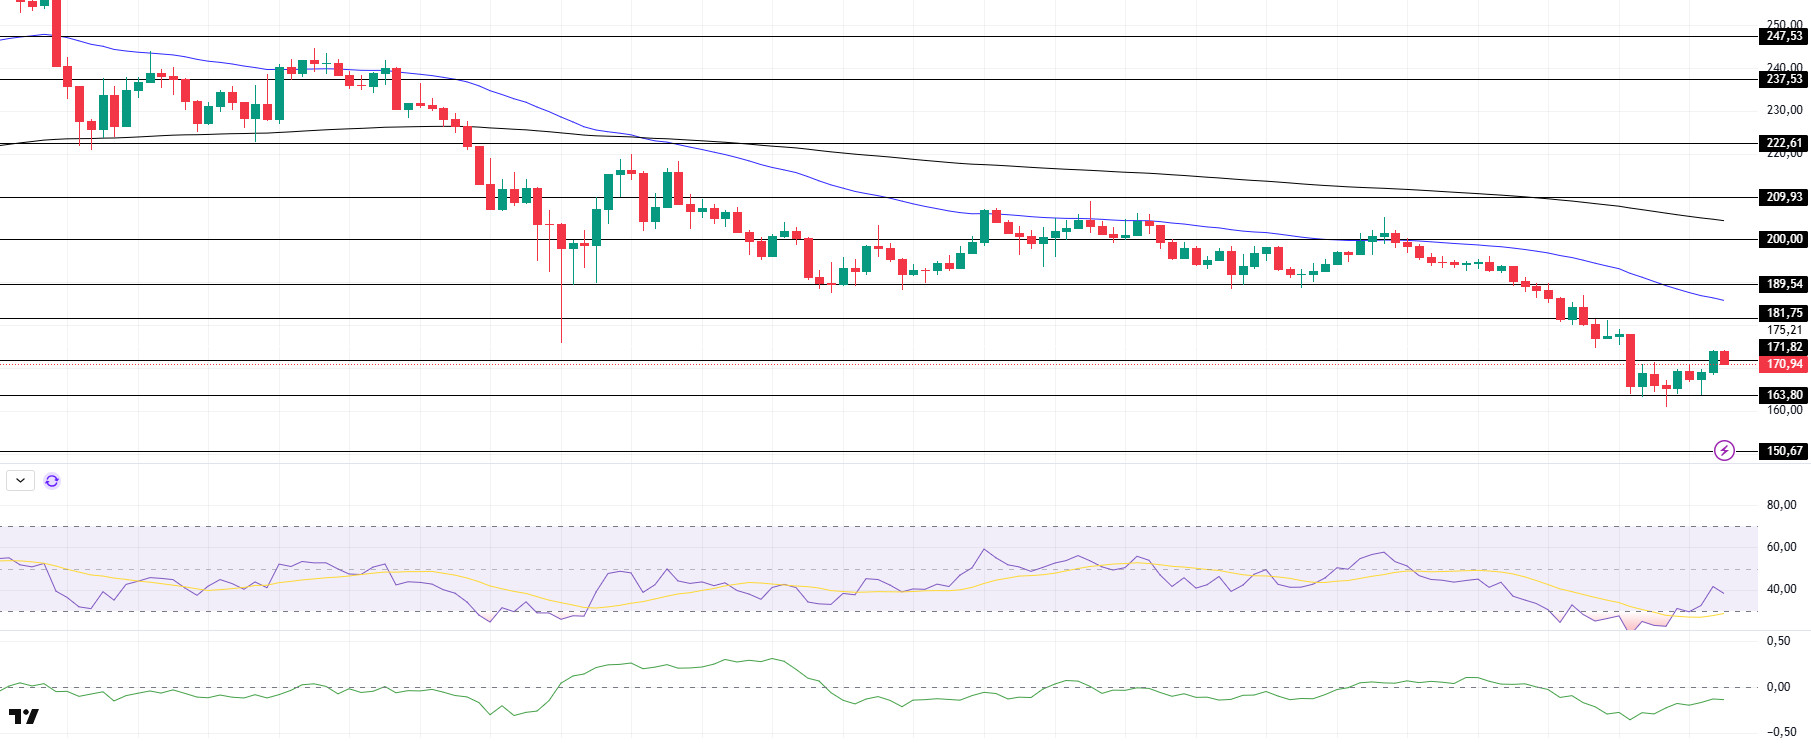
According to BlockBeats, Toronto-based cryptocurrency holding company Sol Strategies has announced an increase en its SOL holdings. The company purchased an additional 12,456 SOL tokens between February 7 and February 14, 2025. As of February 14, 2025, Sol Strategies and its affiliates collectively hold approximately 226,798 SOL tokens.
SOL has been slightly bullish since our morning analysis. On the 4-hora timeframe, the 50 EMA (Blue Line) continues to be below the 200 EMA (Black Line). This could continue to deepen the decline en the medium term. At the same time, the asset continued to hover below both moving averages. However, the higher level between the two moving averages may move the asset up. When we examine the Chaikin Money Flow (CMF)20 indicator, although it is at the middle level of the negative zone, the decrease en money outflows and the decrease en volume can be seen as a bearish sign. This may mean that sellers are more dominant. However, the Relative Strength Index (RSI)14 indicator came from the oversold zone to the middle levels of the negative zone. This may cause the asset to fall further por giving the opportunity for a downward movement. The $200.00 level appears to be a very strong resistance point en the rises driven por both the upcoming macroeconomic data and the news en the Solana ecosystem. If it breaks here, the rise may continue. In case of retracements for the opposite reasons or due to profit sales, the support level of $ 163.80 can be triggered again. If the price reaches these support levels, a potential bullish opportunity may arise if momentum increases.
Supports 171.82 – 163.80 – 150.67
Resistances 181.75 – 189.54 – 200.00
DOGE/USDT
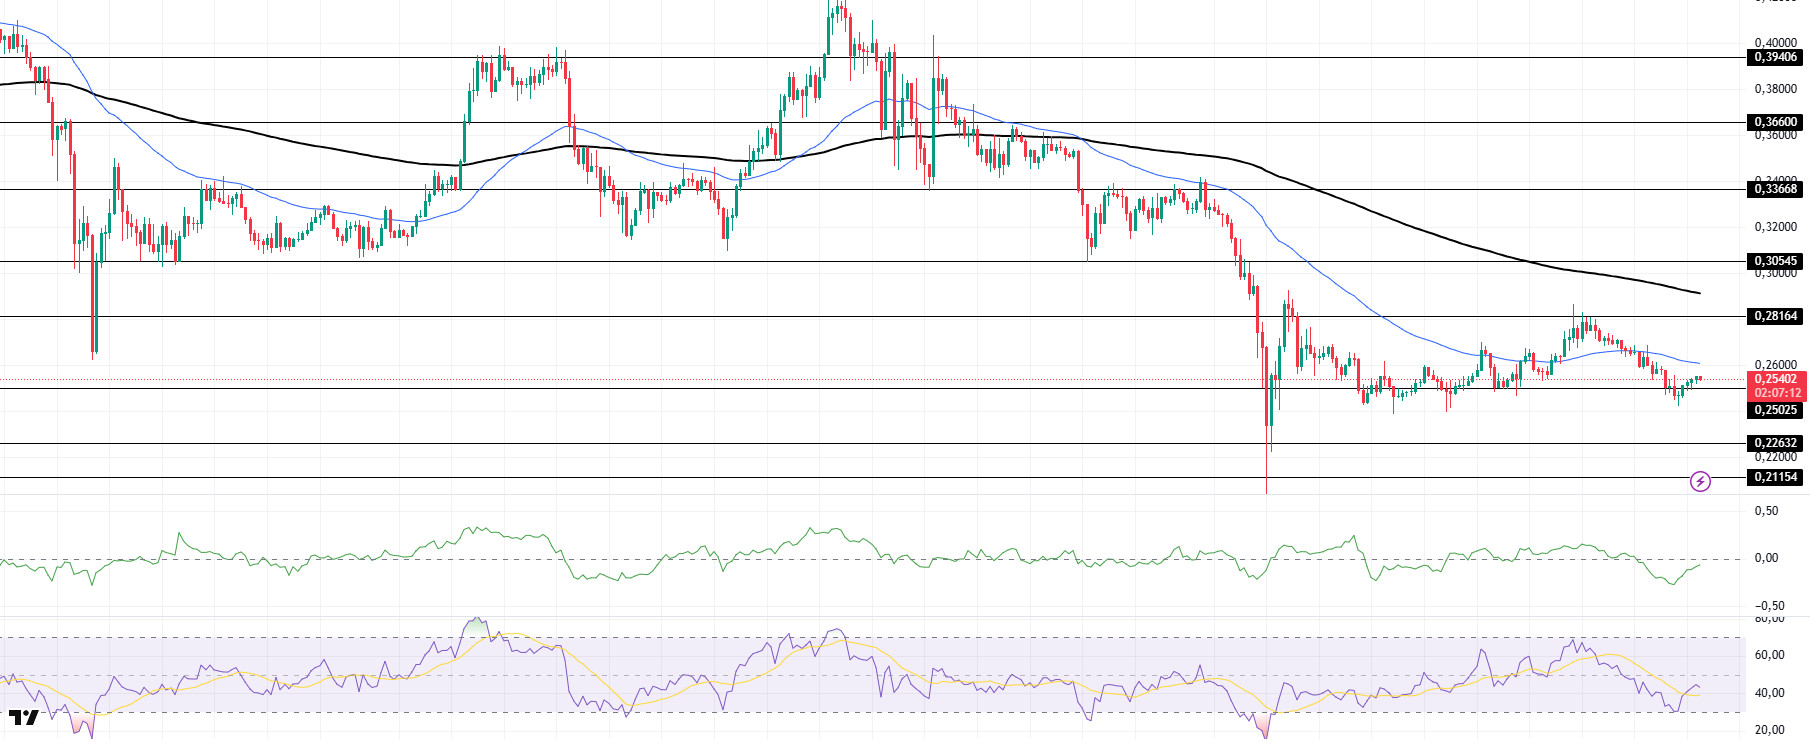
DOGE has been slightly bullish since our analysis en the morning, keeping pace with the broader market and is poised to test the 50 EMA (Blue Line) as a place of resistance. At the same time, the asset continued to remain below the 50 EMA (Blue Line) 200 EMA (Black Line) el the 4-hora timeframe. This could mean that the decline could deepen further en the medium term. The price, however, remains below the two moving averages. However, the larger gap between the two moving averages could further increase the probability of DOGE moving higher. The Chaikin Money Flow (CMF)20 indicator is en the negative zone near the neutral level. Although this means that money outflows are decreasing, the decline en volume shows us that the rise is not very strong. At the same time, Relative Strength Index (RSI)14 is en the negative zone. The $0.33668 level stands out as a very strong resistance point en the rises due to political reasons, macroeconomic data and innovations en the DOGE coin. In case of possible pullbacks due to political, macroeconomic reasons or negativities en the ecosystem, the $0.22632 level, which is the base level of the trend, is an important support. If the price reaches these support levels, a potential bullish opportunity may arise if momentum increases.
Supports 0.25025 – 0.22632 – 0.21154
Resistances 0.28164 – 0.30545 – 0.33668
LEGAL NOTICE
The investment information, comments and recommendations contained herein do not constitute investment advice. Investment advisory services are provided individually por authorized institutions taking into account the risk and return preferences of individuals. The comments and recommendations contained herein are of a general nature. These recommendations may not be suitable for your financial situation and risk and return preferences. Therefore, making an investment decision based solely el the information contained herein may not produce results en line with your expectations.

