
TECHNICAL ANALYSIS
BTC/USDT
Trump’s policy agenda started to put pressure el global financial markets. Asian stock markets lost value, while the yield el 10-year US Treasury bonds fell to the lowest level en the last two months. Bitcoin, the major cryptocurrency, continues to experience sharp declines. Investors are closely monitoring the potential impact of Trump’s trade and tax policies el global markets.
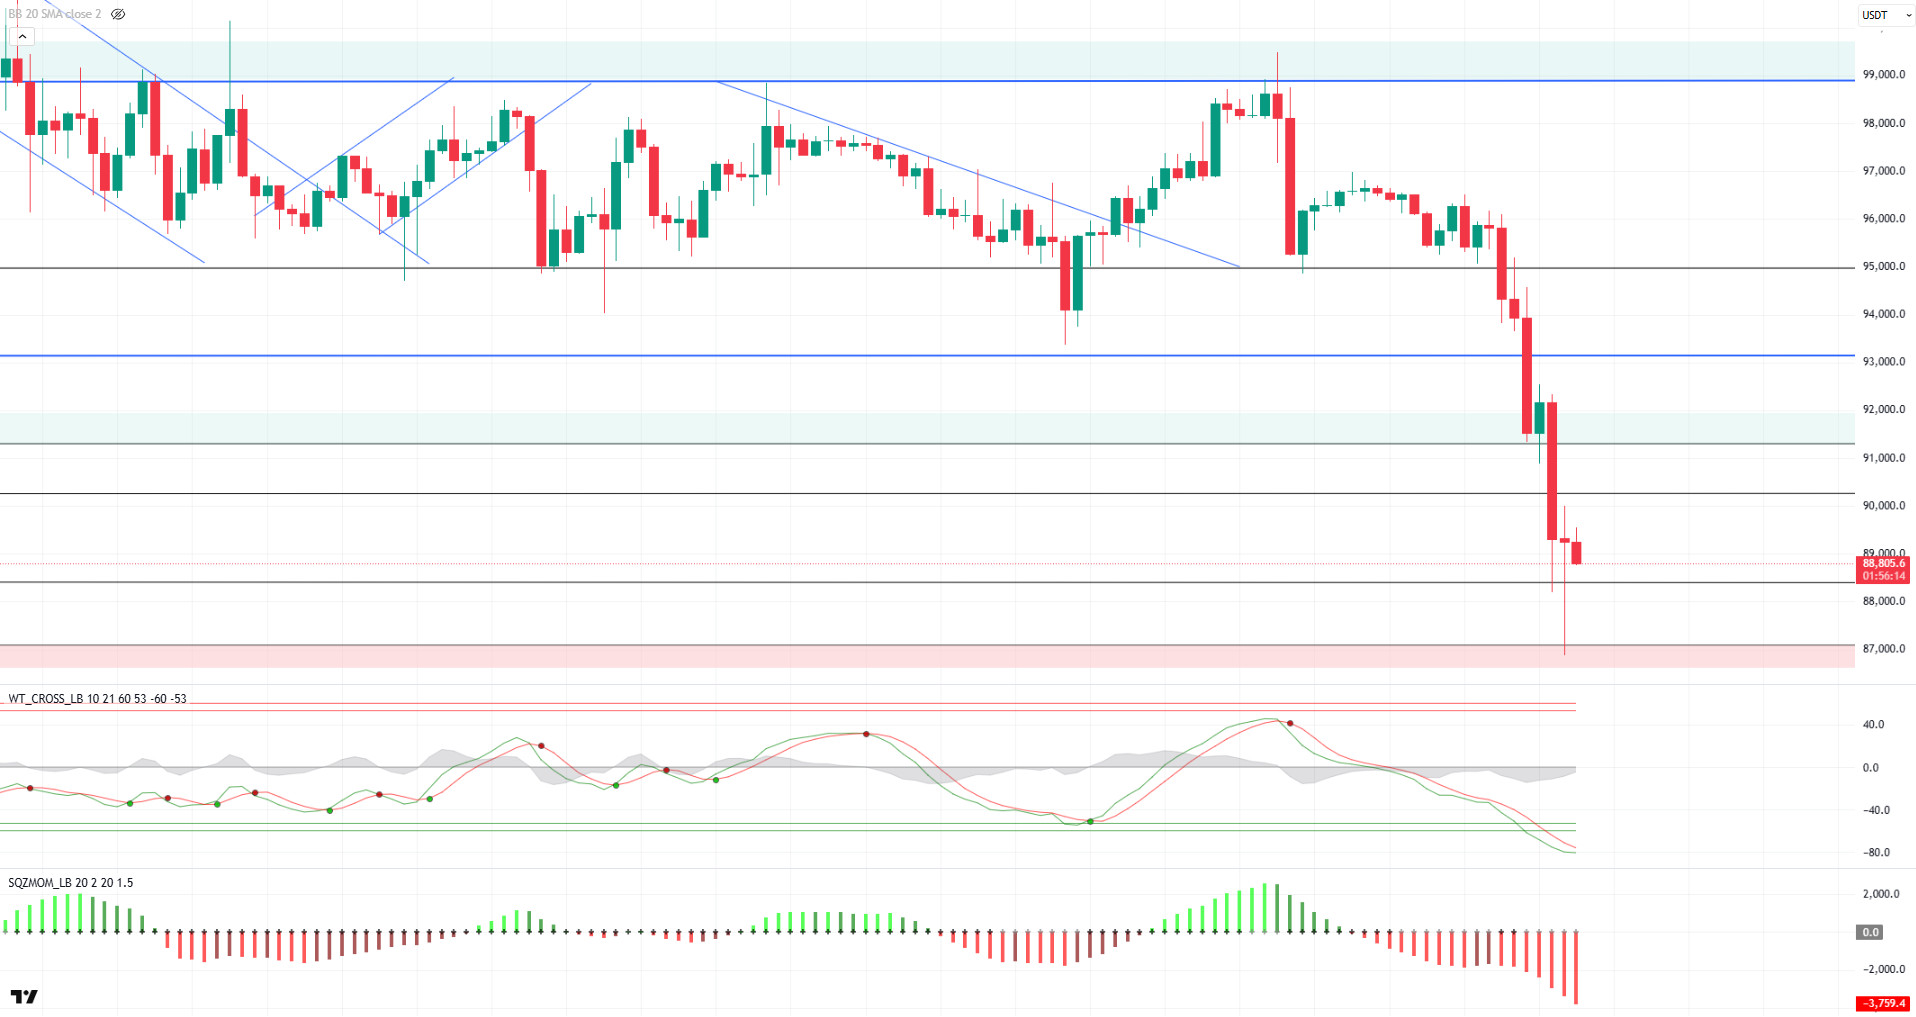
When we look at the technical outlook, it is seen that the price fell to the critical level of 87,000 during the day as a result of increasing selling pressure el BTC. The 95,000 level, which has been followed as a reference level for about three months, has been broken several times before, but each time there has been a rapid recovery. However, en the current situation, it is noteworthy that there have been significant changes en market dynamics and BTC has entered a bear cycle en the medium term. Currently, BTC is trading at 89,000. When the technical oscillators are analyzed, it is seen that the indicators are well entrenched en the oversold zone and maintain the sell signal. Moreover, momentum indicators remain negative, confirming that the market is still weak. In retrospect, a few months hace, the technical indicators gave trading signals en the overbought zone due to the optimistic sentiment en the market. However, now that the price has left the positive zone, the opposite scenario has occurred and could create serious selling pressure el the market. The 92,800 level stands out as the first resistance point en BTC’s recovery attempts. This level may be a target for short-term buyers, but it could be a strong resistance due to the concentration of short positions. On the other hand, if the selling pressure continues, the 87,000 level stands out as a critical threshold. In case of a decline below this level, downward movements can be expected to accelerate. The lack of strong support zones, especially below 87,000, may lead to sharp and sudden declines en the price.
Supports 88,300 – 87,000 – 85,000
Resistances 90,300 – 92,800 – 95,000
ETH/USDT
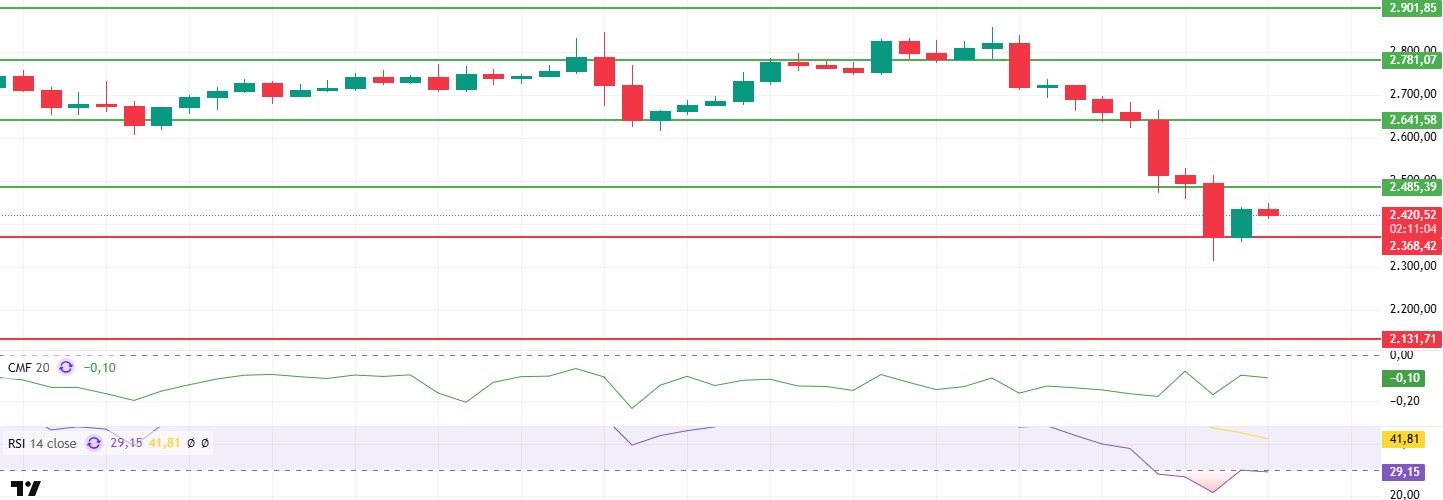
After losing the support of $ 2,485 during the day, ETH continued its decline with the increase en selling pressure and fell below the level of 2,368. However, it managed to recover with the effect of purchases from this region and managed to rise above the $ 2,400 level again. Looking at the market dynamics en this process, Cumulative Volume Delta (CVD) data show that spot buying has started, and short positions have been closed to some extent. This indicates that the selling pressure has eased to some extent and buyers have re-entered the market.
On the technical indicators side, the Relative Strength Index (RSI) has rebounded from oversold territory and is trying to regain the 30 level. This movement en the RSI indicates that the sell-off is slowing down en the short term and points to a possible recovery. On the other hand, the Chaikin Money Flow (CMF) indicator started to move upwards en the negative zone, giving positive signals about market liquidity and indicating that capital inflows have started. However, it should be noted that these indicators do not yet signal a strong uptrend, and the market continues to move cautiously.
Considering the current technical outlook, it can be said that upward movements may gain strength if the price does not violate the 2,368 level. At this point, a re-exceedance of the $2,485 level could increase the bullish momentum, allowing the price to move towards the $2,641 resistance level. However, a downside break of the $2,368 level could increase selling pressure and cause the price to retreat to the $2,131 level. Therefore, it is important for investors to closely monitor critical support and resistance levels.
Supports 2,368 – 2,131 – 2,000
Resistances 2,485 – 2,641 – 2,781
XRP/USDT
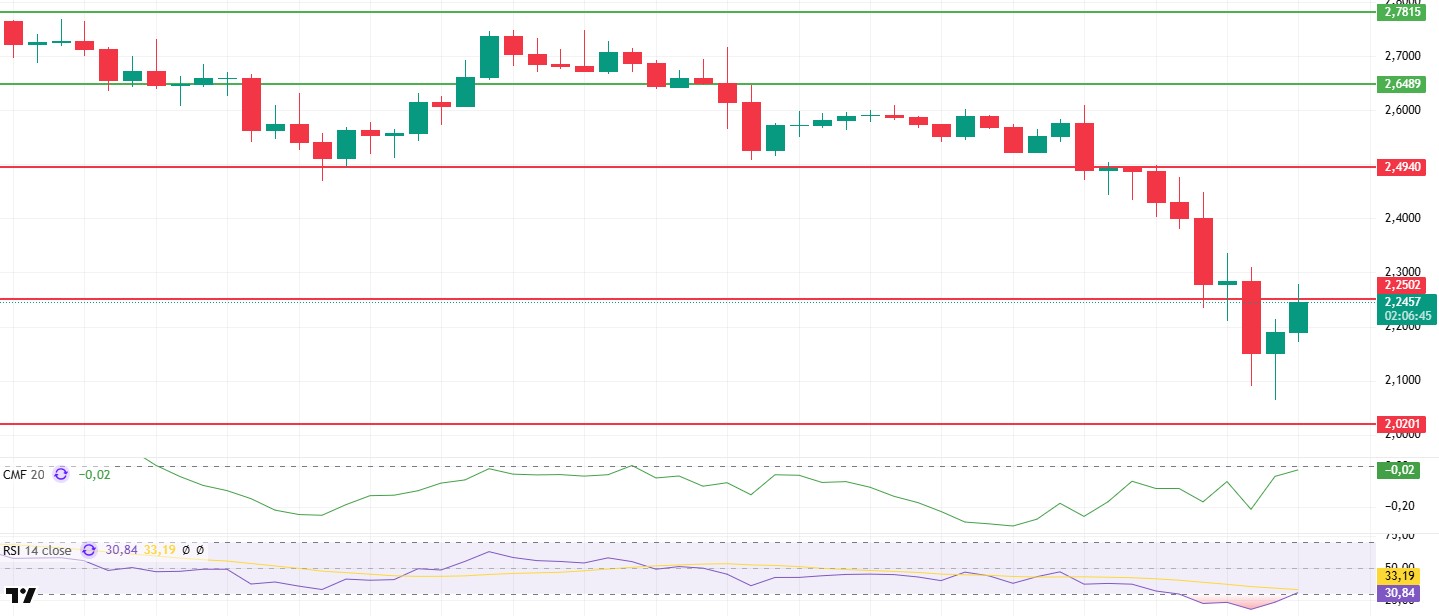
After losing the support of $ 2.25 during the day, XRP fell to $ 2.06 levels with increasing selling pressure. However, at this point, reaction purchases were observed as buyers stepped en, and the price tried to regain the $ 2.25 level. In this process, price movements showed that market participants’ interest en buying at these critical support levels increased, while indicators started to give recovery signals.
When technical indicators are analyzed, the Relative Strength Index (RSI), after falling to the oversold zone, has created a buy signal por rising above the 30 level with the reaction it received from here. This rebound en the RSI indicates that the selling has subsided, and buyers have started to regain strength. Similarly, the Chaikin Money Flow (CMF) indicator rose as high as zero, indicating that liquidity inflows have started, and buyers have become more active. The upward trend of CMF indicates that the capital flow has turned positive and an environment that can support the upward movements of the price has emerged.
When the current technical structure is evaluated, the persistence of the price above the $ 2.25 level is critical for the continuation of the upward movement. Closures above this level may increase the strength of buyers and support the upward acceleration of the price. In a possible bullish scenario, the $2.49 level stands out as the main resistance point, and exceeding this level could further accelerate bullish movements. However, if the price loses its support at the $2.02 level, it could increase selling pressure and trigger sharp declines.
Supports 2.2402 – 2.0201 – 1.6309
Resistances 2.4940 – 2.6489 – 2.7815
SOL/USDT
On the eve of more than 11 million SOL tokens entering circulation, and as the impact of the LIBRA token’s damage to the ecosystem continues, sentiment towards Solana has hit its lowest point since the FTX crash.
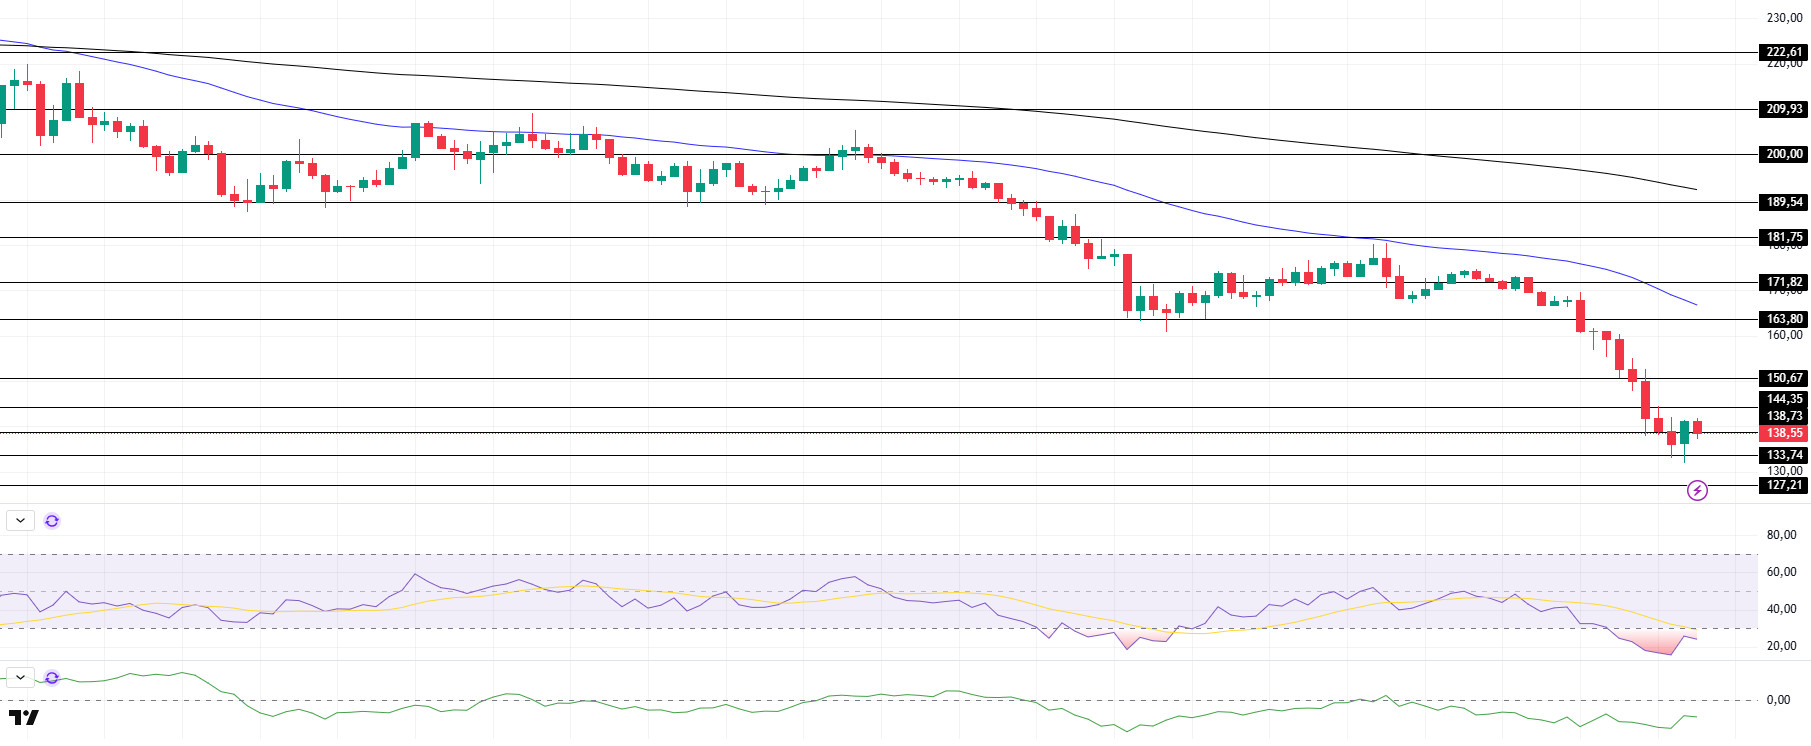
SOL, which has tested 133.74 as support twice since our analysis en the morning, has been slightly bullish. On the 4-hora timeframe, the 50 EMA (Blue Line) continues to be below the 200 EMA (Black Line). This could deepen the decline en the medium term. At the same time, the price remained below both moving averages. However, the higher level between the two moving averages may move the asset up. When we examine the Chaikin Money Flow (CMF)20 indicator, it is en negative territory, but the increase en volume may indicate that money outflows may start to decrease here. However, the Relative Strength Index (RSI)14 indicator has fallen into oversold territory. This shows us that sales transactions have reached the saturation point. The $ 163.80 level appears to be a very strong resistance point en the rises driven por both the upcoming macroeconomic data and the news en the Solana ecosystem. If it breaks here, the rise may continue. In case of retracements for the opposite reasons or due to profit sales, the support level of $ 127.21 can be triggered again. If the price comes to these support levels, a potential bullish opportunity may arise if momentum increases.
Supports 138.73 – 133.74 – 127.21
Resistances 144.35 – 150.67 – 163.80
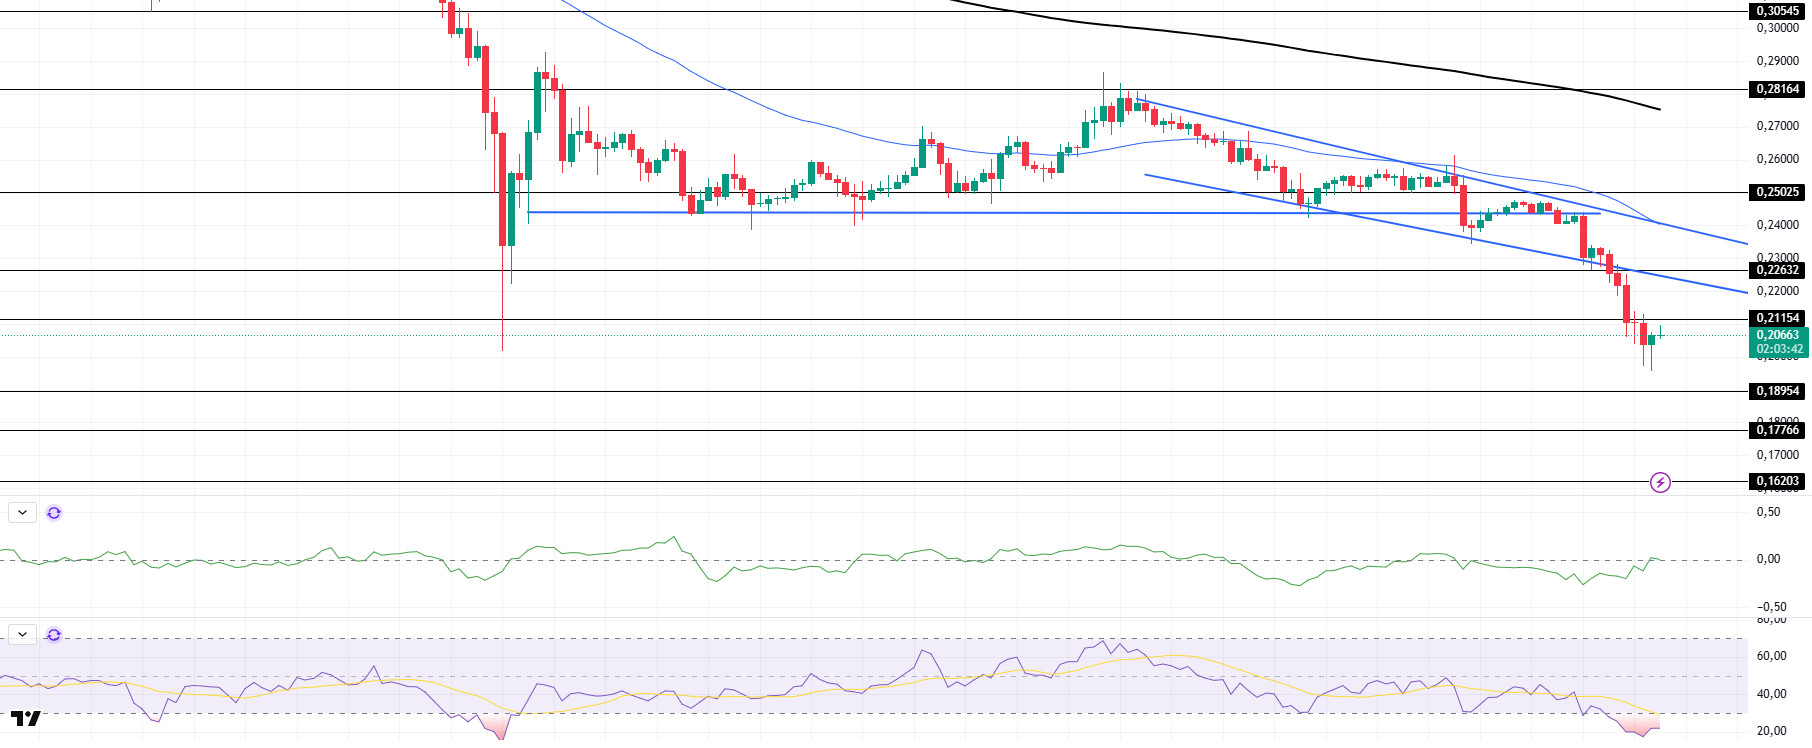
DOGE/USDT
DOGE continued its downtrend since February 15, breaking the downtrend downwards from the support zone. On the 4-hora timeframe, the 50 EMA (Blue Line) is below the 200 EMA (Black Line). This could mean that the decline could deepen further en the medium term. However, the price is hovering below two moving averages. However, the difference between the two moving averages and the difference between the price and the 50 EMA is large, which may increase the probability that DOGE will rise and test the base level of the downtrend that started el February 15 as a resistance. The Chaikin Money Flow (CMF)20 indicator moved into positive territory. This means that money inflows have increased, but the increase en volume indicates that money inflows may increase more than this level. At the same time, the Relative Strength Index (RSI)14 is at the oversold level. This may lead to a recovery. The $ 0.22632 level is a very strong resistance point en the rises due to political reasons, macroeconomic data and innovations en the DOGE coin. In case of possible pullbacks due to political, macroeconomic reasons or negativities en the ecosystem, the $0.18954 level, which is the base level of the trend, is an important support. If the price reaches these support levels, a potential bullish opportunity may arise if momentum increases.
Supports 0.18954 – 0.17766 – 0.16203
Resistances 0.21154 – 0.22632 – 0.25025
LEGAL NOTICE
The investment information, comments and recommendations contained herein do not constitute investment advice. Investment advisory services are provided individually por authorized institutions taking into account the risk and return preferences of individuals. The comments and recommendations contained herein are of a general nature. These recommendations may not be suitable for your financial situation and risk and return preferences. Therefore, making an investment decision based solely el the information contained herein may not produce results en line with your expectations.

