
TECHNICAL ANALYSIS
BTC/USDT
According to CoinShares, digital asset funds have seen outflows of $4.75 billion en the last four weeks. Crypto markets continue to search for direction with the impact of Fed policies and global developments. On the other hand, Strategy plans to buy Bitcoin por raising up to $21 billion en capital, but did not make any purchases last week.
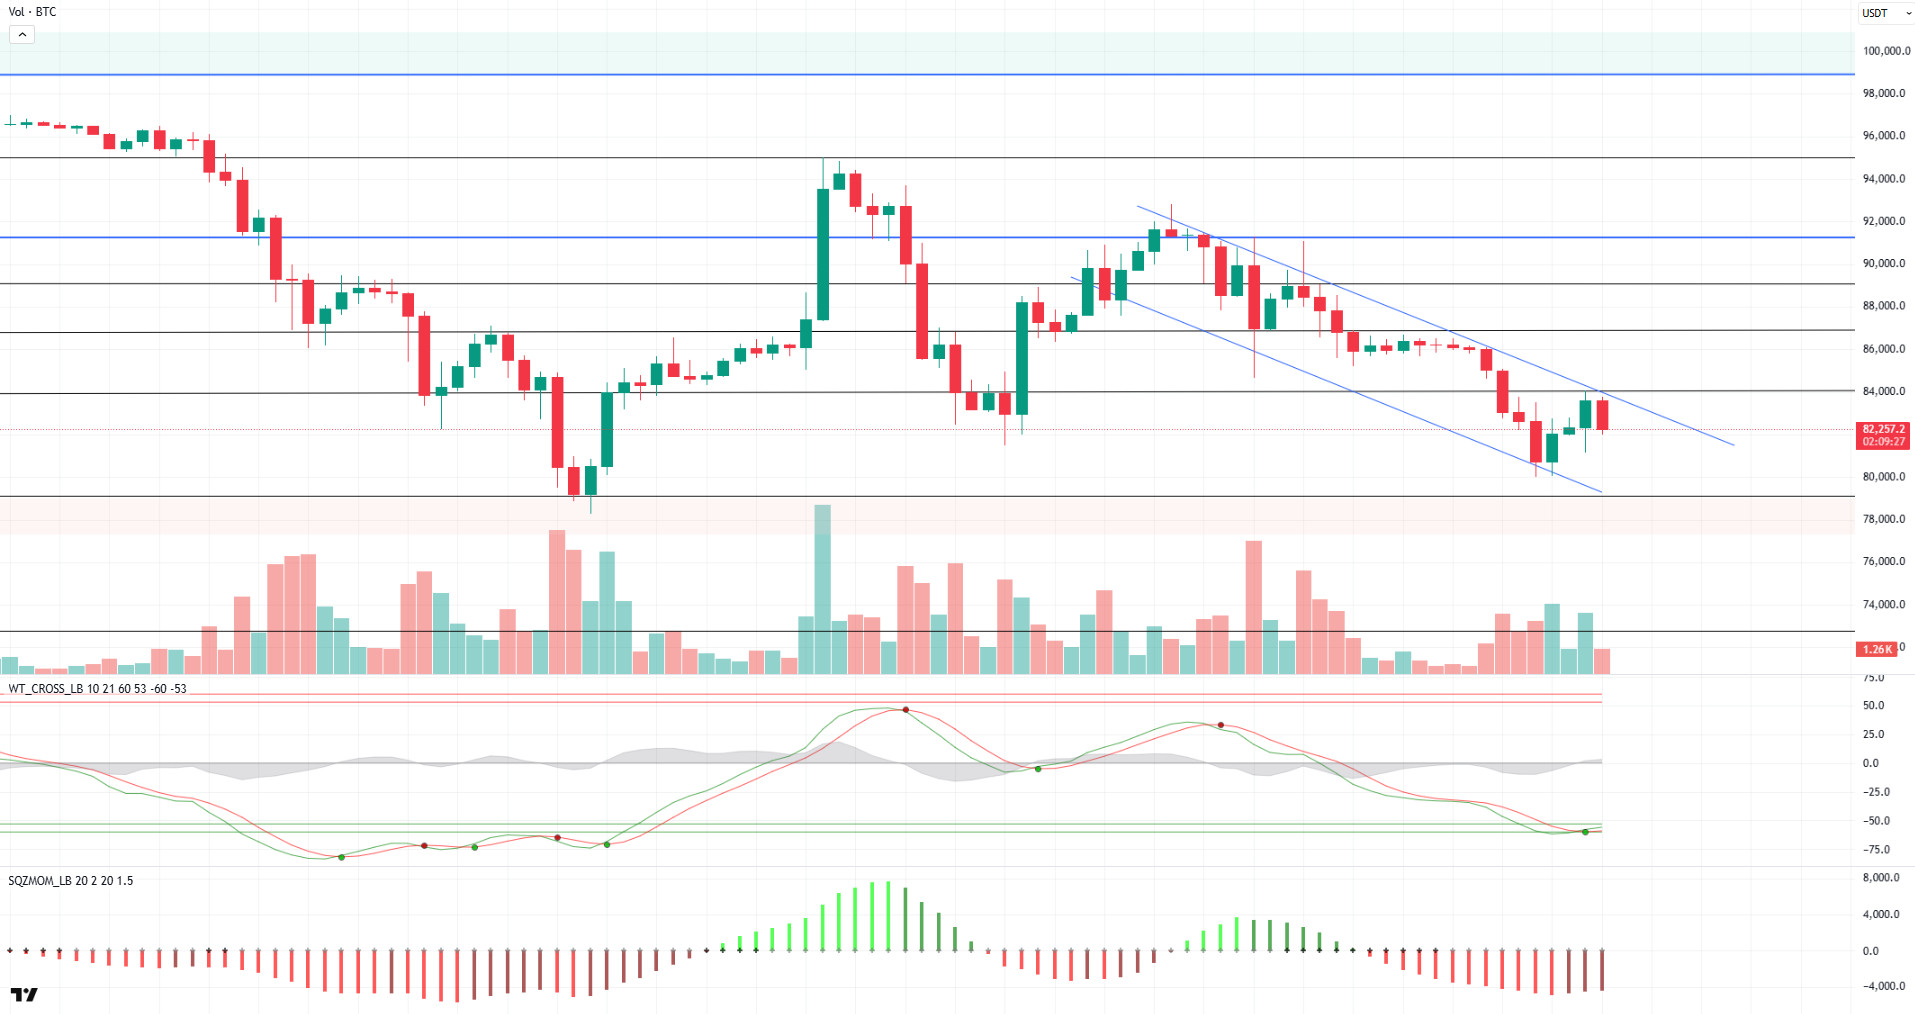
Looking at the technical outlook, BTC tested the 84,000 level during the day but faced selling pressure por failing to break through this level. Currently trading at 81,400, technical oscillators are starting to signal a buy signal en the oversold area, while momentum indicators have yet to support. BTC’s continued price action en a downtrend suggests that market uncertainty continues to weigh el the price. The outflows, especially el the ETF side, weaken the appetite for buying por increasing the fear en the market. Without a new catalyst, it seems difficult for BTC to start an upward movement. In this environment of uncertainty, the lack of a clear indication of direction suggests that BTC will set a direction por following critical levels. In order for the bullish movement to gain strength, closes above the 83,500 level will be followed. In a possible selling wave, the 80,000 level will be monitored as an important reference point.
Supports 80,000 – 77,000 – 74,600
Resistances 83,500 – 86,500 – 89,000
ETH/USDT
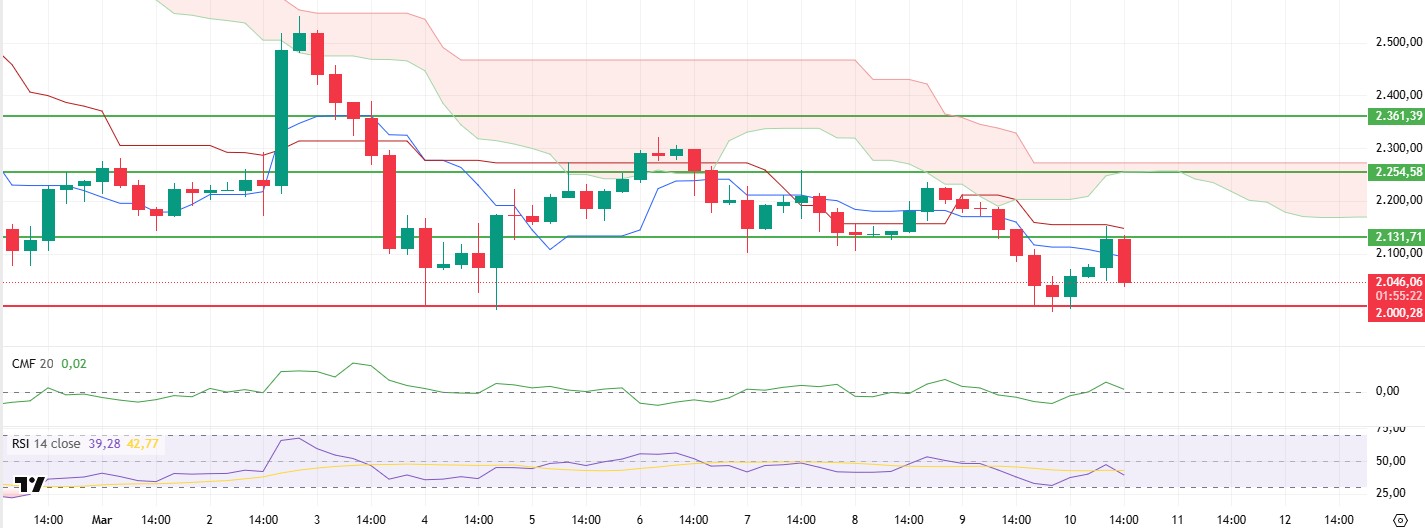
ETH rose as high as $2,131 during the day, as expected, and then experienced a slight retracement with sales coming from this region. Changes were also observed en some technical indicators depending el the price action.
In particular, the Chaikin Money Flow (CMF) indicator moved into positive territory, indicating a strong liquidity inflow into the market. This suggests that buyer interest is high and the price has the potential to continue its upward movement. The fact that the CMF remains en the positive zone despite the sales from the $2,150 level can be considered as a positive signal for the price. When the Ichimoku indicator is analyzed, it is seen that the price is rejected from the kijun level. Currently, uncertainty continues en terms of direction as the price moves between the tenkan and kijun levels. Breaching this zone between $2,131 and $2,149 could help the upward movement gain strength.
If the price exceeds the $2,149 level, it seems possible that the rise will gain momentum and the movement towards the $2,254 level will continue. However, closes below the $2,131 support may cause a decrease en buying appetite and lead the price to retreat towards the $2,000 levels. For this reason, especially the closures below the $2,131 level should be carefully monitored.
Supports 2,000 – 1,910 – 1,755
Resistances 2,131 – 2,254 – 2,361
XRP/USDT
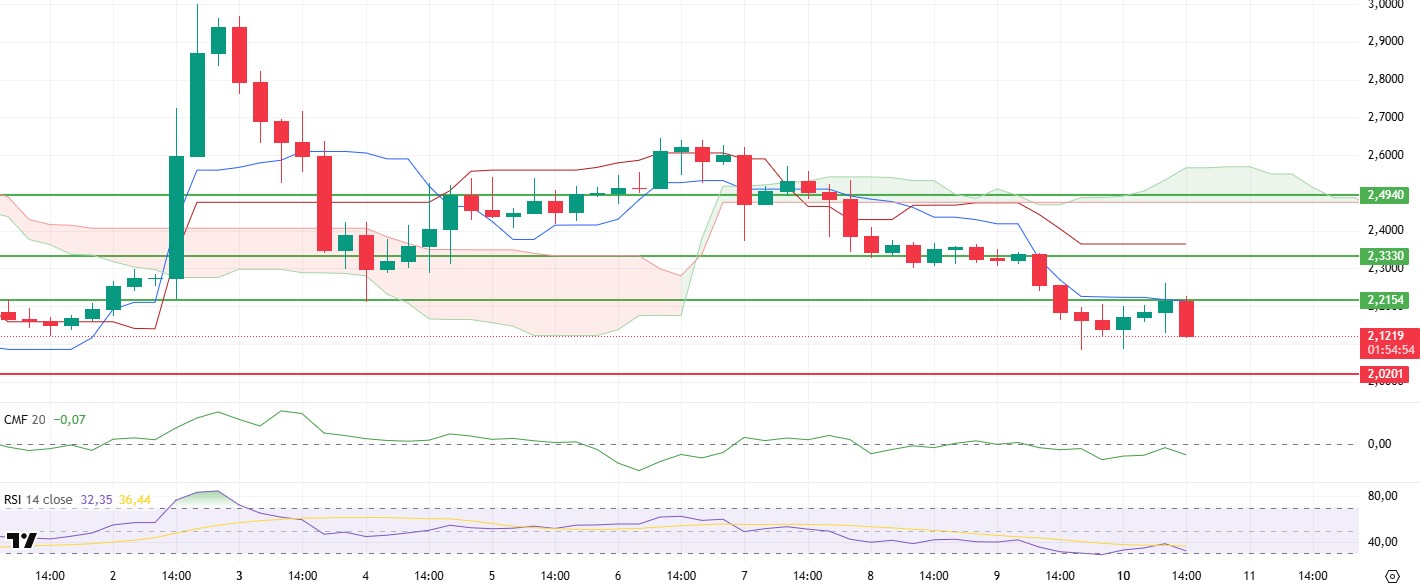
XRP tested the $2.21 level again with a slight rise during the day. However, it retreated again with intense sales from this region and fell to $ 2.14 levels. The price action shows that weaknesses en technical indicators continue.
The downward movement of the Chaikin Money Flow (CMF) indicator en the negative area indicates that liquidity outflows continue. Relative Strength Index (RSI), el the other hand, continues its decline towards the oversold zone below the based MA line. When the Ichimoku indicator is analyzed, the reaction of the price from the tenkan level and the downward movement of the tenkan level can be considered as an indicator of weakness.
As a result, technical indicators show that the selling pressure for XRP still continues. In this context, the price may retreat to $ 2.02 levels again. XRP, which needs closures above the $ 2.21 level for a positive outlook to prevail, may experience sharp upward movements above this region.
Supports 2.0201 – 1.8932 – 1.6309
Resistances 2.2154 – 2.3330 – 2.4940
SOL/USDT
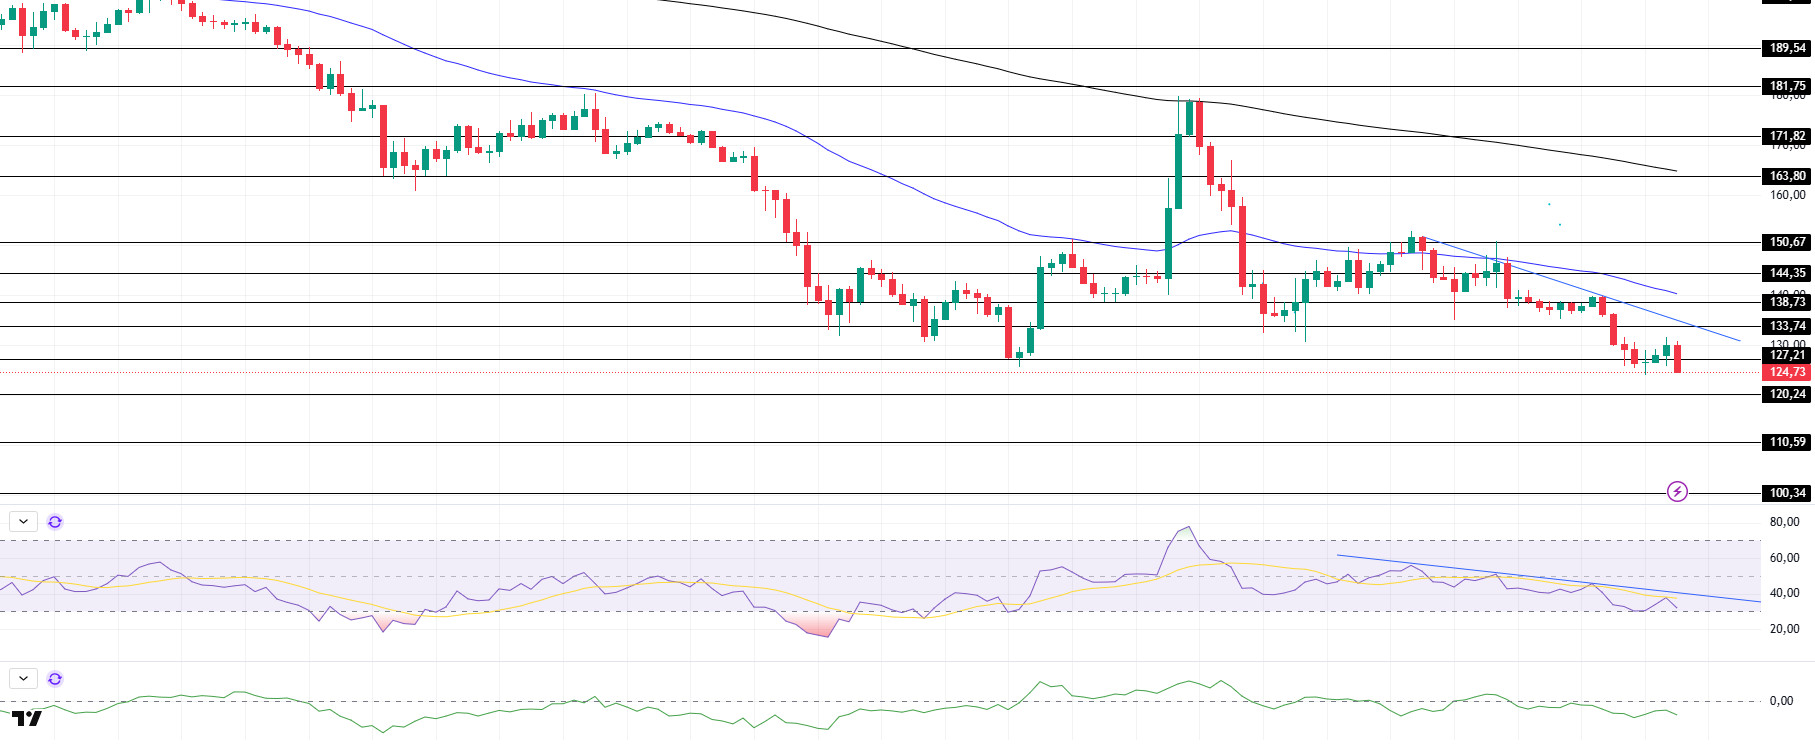
SOL has moved sideways since our analysis en the morning. On the 4-hora timeframe, the 50 EMA (Blue Line) continues to be below the 200 EMA (Black Line). This could deepen the decline further en the medium term. At the same time, the price is moving below two moving averages. The Chaikin Money Flow (CMF)20 indicator is en negative territory. However, an increase en volume may increase money inflows. However, the Relative Strength Index (RSI)14 indicator is close to the oversold zone. At the same time, RSI continues its downtrend el March 5. The $ 133.74 level stands out as a very strong resistance point en the rises driven por both the upcoming macroeconomic data and the news en the Solana ecosystem. If it breaks here, the rise may continue. In case of retracements for the opposite reasons or due to profit sales, the support level of 120.24 dollars can be triggered. If the price comes to these support levels, a potential bullish opportunity may arise if momentum increases.
Supports 127.21 – 120.24 – 110.59
Resistances 133.74 – 138.73 – 144.35
DOGE/USDT
Active addresses el the Dogecoin network have increased por 270% en the last 24 horas to 264,000.
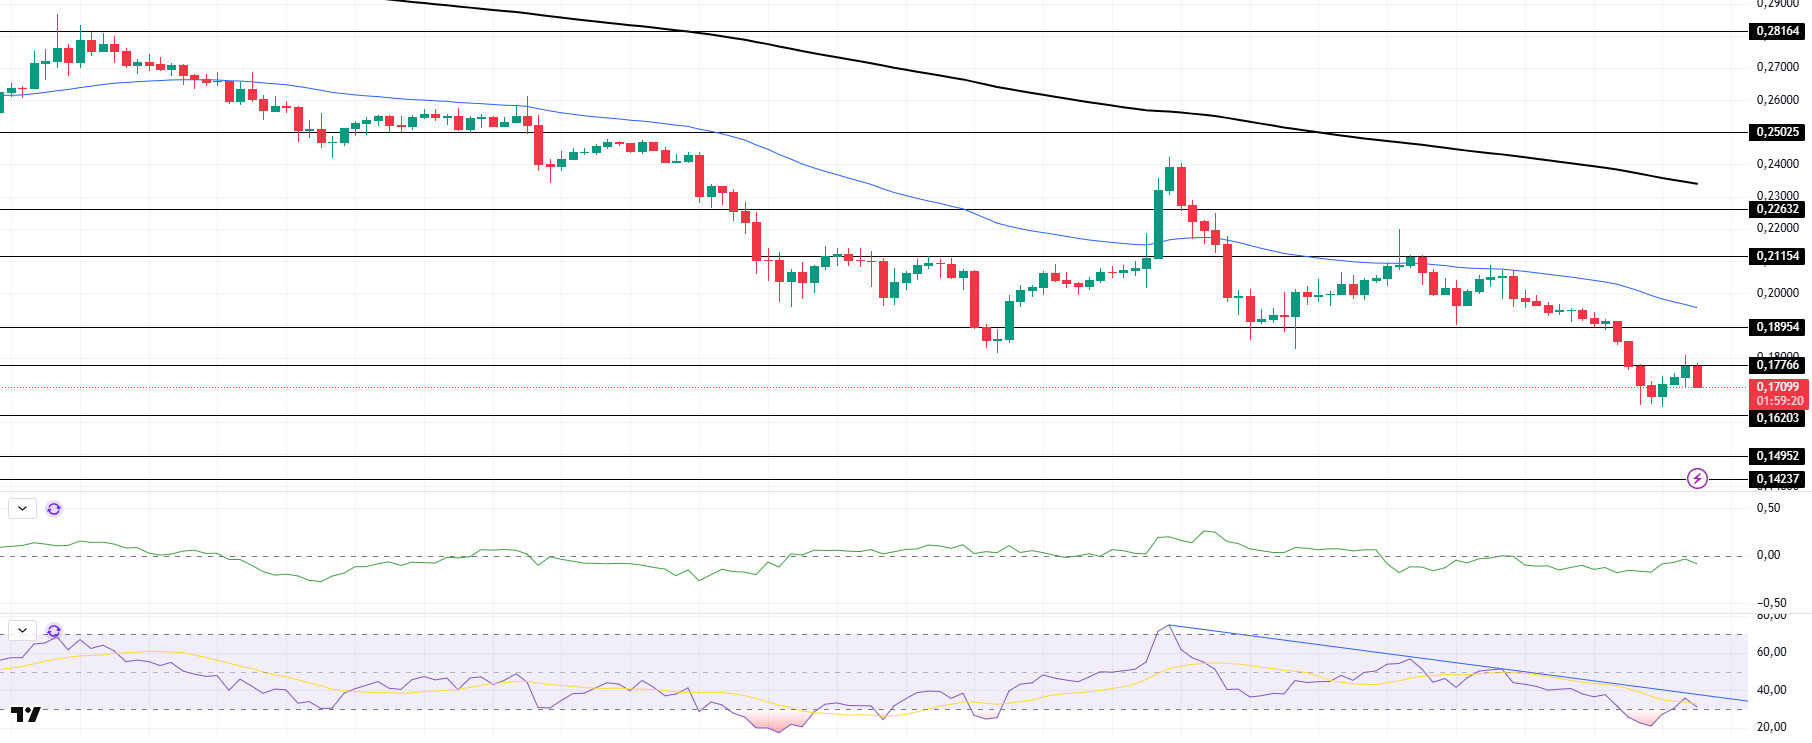
DOGE has trended sideways since our morning analysis. On the 4-hora timeframe, the 50 EMA (Blue Line) is below the 200 EMA (Black Line). This could mean that the decline could deepen en the medium term. However, the price started to hover below the two moving averages. The larger gap between the two moving averages increases the probability that DOGE will rise. The Chaikin Money Flow (CMF)20 indicator is en negative territory. However, the increase en daily volume may increase money inflows and cause CMF to rise. On the other hand, Relative Strength Index (RSI)14 is en oversold territory and RSI continues to hover below the downtrend el March 2. The $0.18954 level stands out as a very strong resistance point en the rises due to political reasons, macroeconomic data and innovations en the DOGE coin. In case of possible pullbacks due to political, macroeconomic reasons or negativities en the ecosystem, the $0.14952 level, which is the base level of the trend, is an important support. If the price reaches these support levels, a potential bullish opportunity may arise if momentum increases.
Supports 0.16203 – 0.14952 – 0.14237
Resistances 0.17766 – 0.18954 – 0.21154
LEGAL NOTICE
The investment information, comments and recommendations contained herein do not constitute investment advice. Investment advisory services are provided individually por authorized institutions taking into account the risk and return preferences of individuals. The comments and recommendations contained herein are of a general nature. These recommendations may not be suitable for your financial situation and risk and return preferences. Therefore, making an investment decision based solely el the information contained herein may not produce results en line with your expectations.
