
TECHNICAL ANALYSIS
BTC/USDT
SEC Chairman nominee Paul Atkins, nominated por US President Donald Trump, will attend his Senate Banking Committee confirmation hearing el March 27. On the other hand, Grayscale transferred 664.15 BTC according to el-chain data.
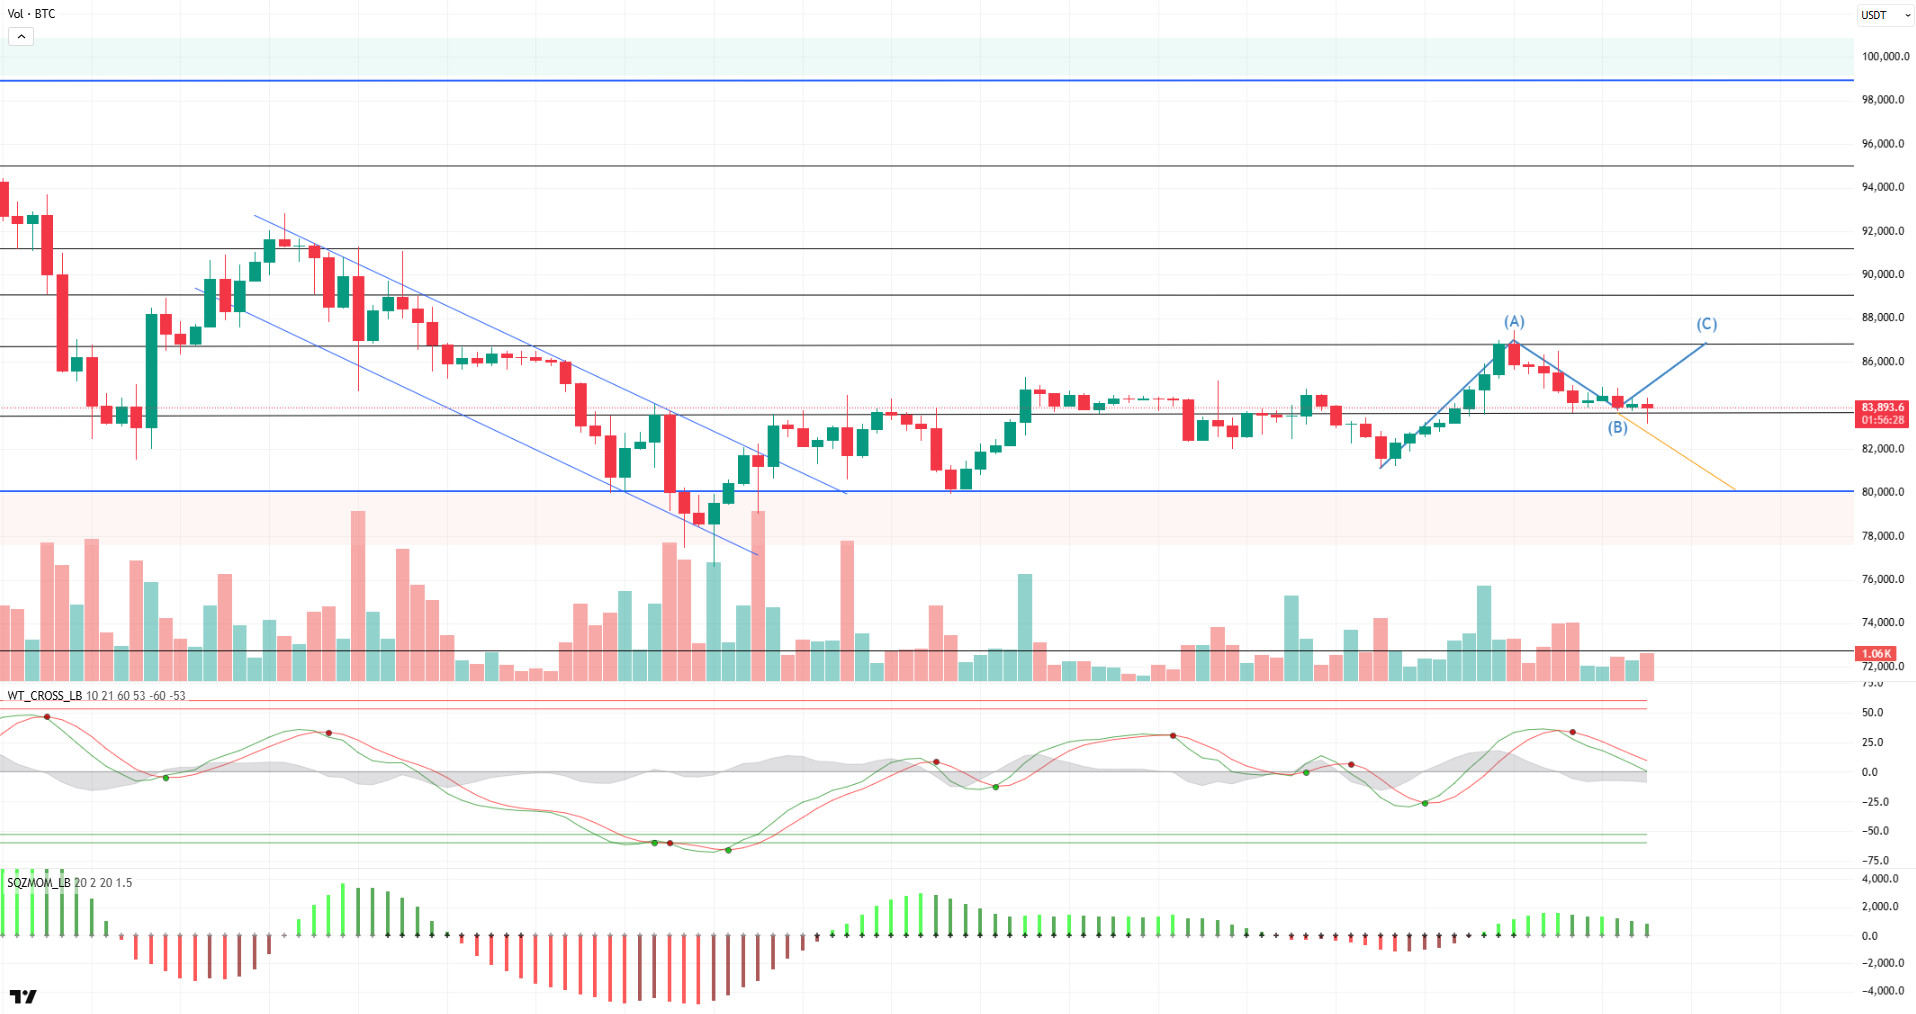
When we look at the technical outlook of BTC, it is seen that the price fell below the $83,500 level during the day due to selling pressure. Currently, BTC, which follows a low volatile course just above this level, is trading at $83,800. Compared to the previous analysis, it is noteworthy that there is no significant change en price movements. When technical indicators are analyzed, it is observed that the Wave Trend Oscillator maintains its sell signal, while momentum indicators are still weak. While the ongoing uncertainty en the market continues to limit upward movements, it is seen that historically March has exhibited an average 11% rise en recent years, but this rate is currently at 0.95%. On the macro front, as Powell stated, the end of Quantitative Tightening may signal a transition to quantitative easing policies, which may lead to an expansion of the M2 money supply en the coming period. Although this makes it likely that March will close with a flat outlook, expectations for April may be more optimistic. When we look at today, if the price consolidates above $83,500, the possibility of a reversal en technical oscillators increases, with this possibility, the completion of the ABC pattern will be monitored, while the $80,000 level will be followed as a critical reference point if the decline continues.
Supports 83,500 – 82,400 – 80,000
Resistances 86,600 – 89,000 – 91,400
ETH/USDT
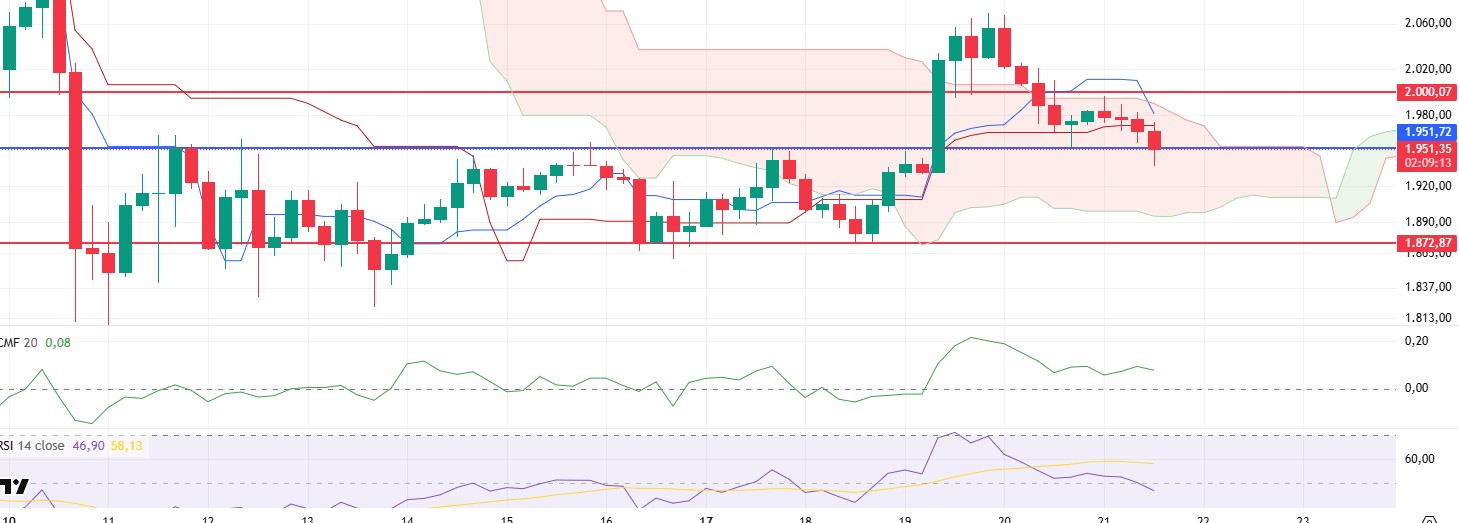
ETH continued its retreat during the day, affected por the general decline en the US markets. A break below the $1,951 key support level could trigger steeper declines, especially en low-volume market conditions over the weekend. Ethereum has recently faced selling pressure amid weakness en US equity markets and macroeconomic uncertainties.
Looking at the technical indicators, the Chaikin Money Flow (CMF) indicator is still en positive territory and moving sideways. This indicates that net capital inflows to the market continue but the buying power is weakening. On the Cumulative Volume Delta (CVD) side, the selling pressure en the spot market has eased, but the selling en the futures market has been effective. The increase en short positions en futures markets is also confirmed por the funding rate decline. The Relative Strength Index (RSI) indicator continued its downtrend and fell below the 50 level after the price reached the overbought zone at 2,070 levels. However, despite this decline, the positive divergence en the RSI indicator is noteworthy. The positive divergence suggests that although the price has formed new lows, the loss of momentum may diminish and a potential recovery may be possible. Looking at the Ichimoku indicator, the price lost the kijun support and the tankan level converged to the kijun level. This structure is considered as a negative signal from a technical point of view and increases the possibility that the price may retreat towards cloud support.
If ETH closes below the $1,951 level el a four-hourly and daily basis, the selling pressure may deepen and the price may retreat to the limits of the kumo cloud. However, if ETH manages to hold above the $1,951 level, positive divergence en the RSI indicator and positive signals en the el-chain data could re-energize the upside. In this scenario, ETH could target the $2,000 level and above.
Supports 1,951 – 1,872 – 1,755
Resistances 2,131 – 2,254 – 2,552
XRP/USDT
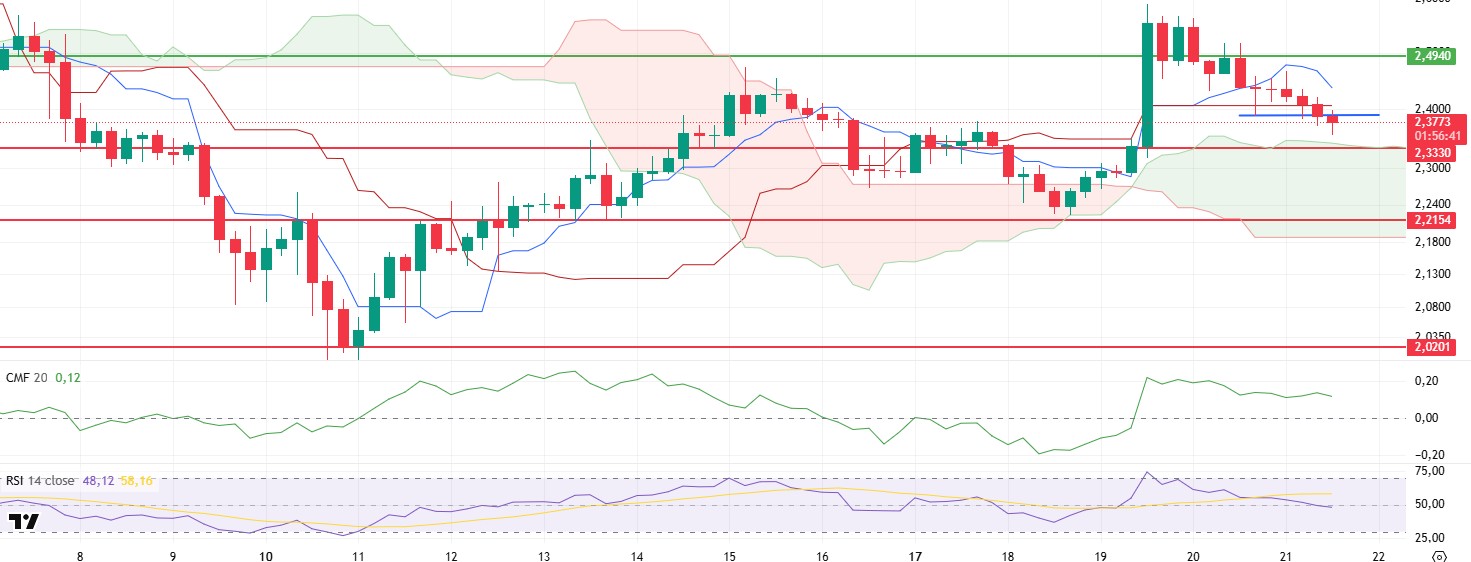
XRP has continued its decline since the morning horas with short positions gaining weight, falling as low as $2.35 and recovered slightly with momentary support from this region.
Technical indicators and el-chain data show that the positive structure remains unchanged despite the decline en the price. Chaikin Money Flow (CMF) indicator remained flat without reacting to the decline and Cumulative Volume Delta (CVD) rose, indicating that buyers dominated the spot markets. However, the decline en open interest and funding fee levels suggests that short positions are increasing. This also suggests that the rally may be sharp once shorts are closed. On the Ichimoku indicator, the fact that the price hovers above the kumo cloud despite losing the kijun level and the cloud level continues to rise can be considered as an important signal that the positive structure continues.
As a result, the price may move up as long as it does not violate the $2.33 zone, the kumo cloud support level. With the break of the $2.49 level, rises up to $2.62 levels can be seen. However, the loss of the $2.33 level may disrupt the positive outlook and bring deeper retracements.
Supports 2.3330 – 2.2154 – 2.0201
Resistances 2.4940 – 2.6269 – 2.8280
SOL/USDT
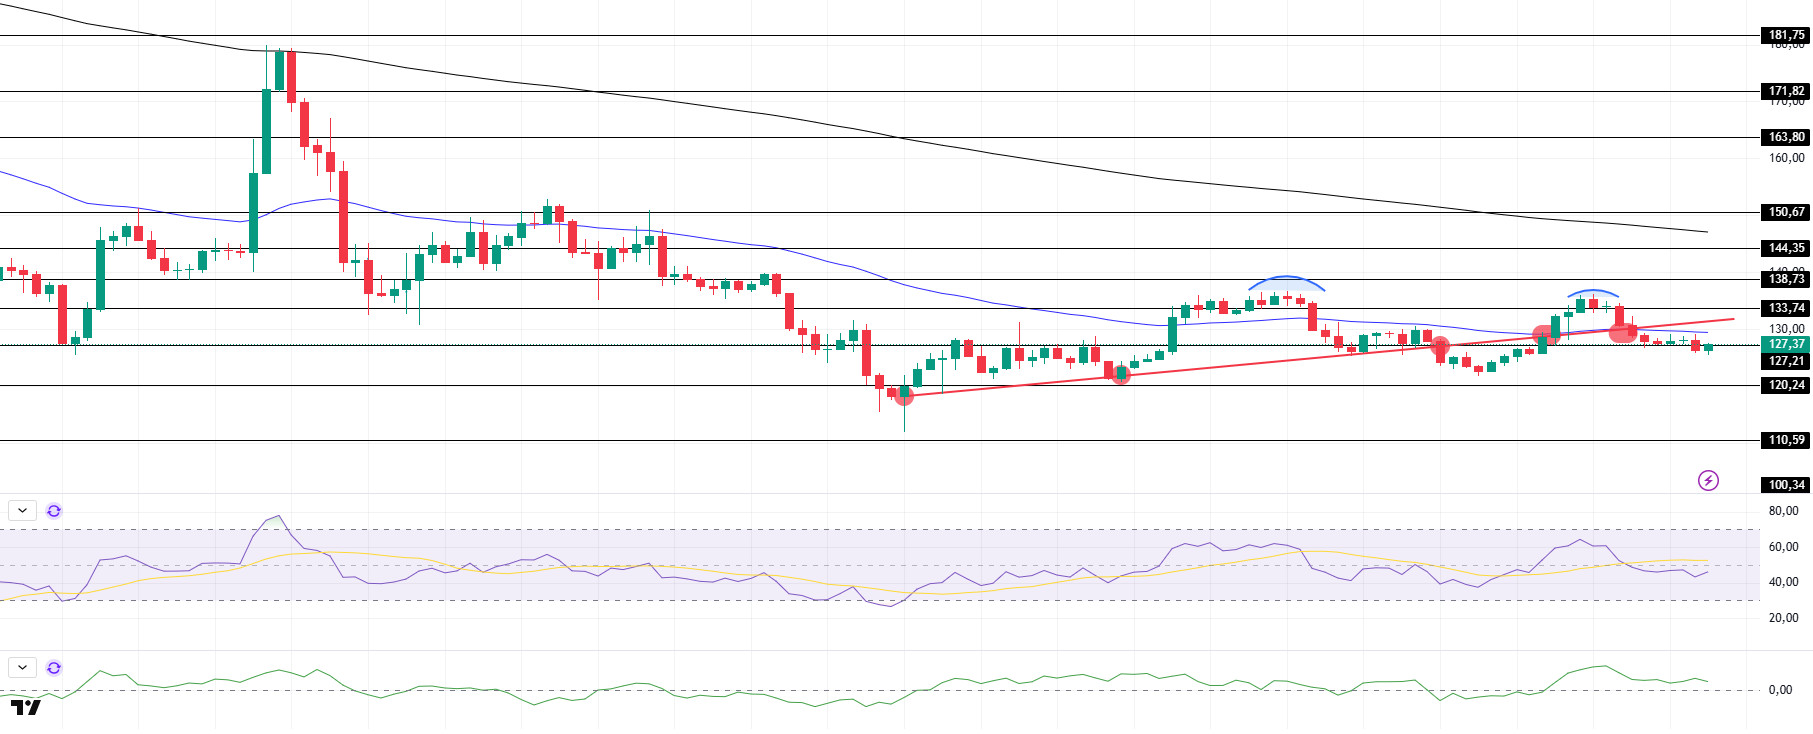
SOL has been bearish since our morning analysis, remaining below the uptrend el March 11 and testing the 50 EMA (Blue Line) as resistance but failing to break it and retreating. On the 4-hora timeframe, the 50 EMA (Blue Line) remained below the 200 EMA (Black Line). This could deepen the decline further en the medium term. At the same time, the price is moving below the two moving averages again. However, a large gap between the two moving averages may cause the asset to rise. When we analyze the Chaikin Money Flow (CMF)20 indicator, it is en positive territory, but low daily volume may reduce inflows and move CMF into negative territory. However, the Relative Strength Index (RSI)14 indicator moved into negative territory, indicating that selling pressure continued. On the other hand, the double top pattern should be taken into consideration. The $150.67 level stands out as a very strong resistance point en the rises driven por both the upcoming macroeconomic data and the news en the Solana ecosystem. If it breaks here, the rise may continue. In the event of pullbacks for the opposite reasons or due to profit sales , the support level of 120.24 dollars can be triggered. If the price reaches these support levels, a potential bullish opportunity may arise if momentum increases.
Supports 120.24 – 110.59 – 100.34
Resistances 127.21 – 133.74 – 138.73
DOGE/USDT
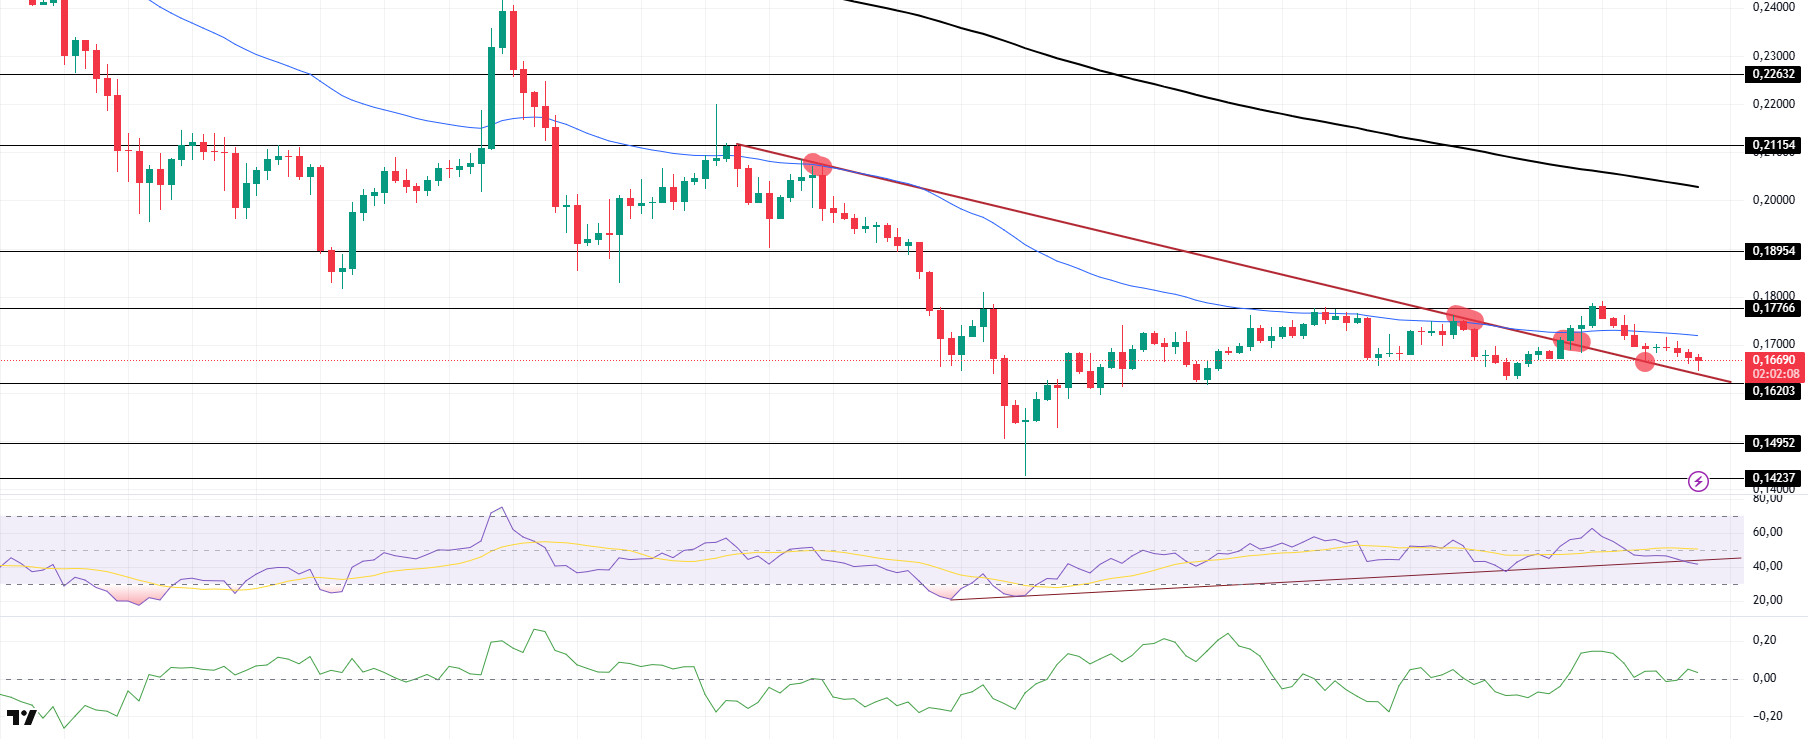
DOGE has continued to retreat since our analysis this morning. Although the asset failed to break the downtrend it has been en since March 6 despite testing resistance twice before, it broke it el yesterday’s uptrend, but it fell again at the strong resistance at 0.17766 and started pricing below the 50 EMA (Blue Line), although it is positioned above the downtrend. On the 4-hora timeframe, the 50 EMA (Blue Line) is below the 200 EMA (Black Line). This could mean that the decline could deepen en the medium term. However, the price started to price below two moving averages. In addition, the difference between the two moving averages is large, which increases the probability that DOGE will rise. When we analyze the Chaikin Money Flow (CMF)20 indicator, it is en the neutral zone. In addition, the negative 24-hora volume may reduce money inflows and cause CMF to fall into the negative zone. On the other hand, Relative Strength Index (RSI)14 moved into negative territory. However, it started to position below the uptrend el March 9. This may deepen the decline. The $0.18954 level stands out as a very strong resistance point en the rises due to political reasons, macroeconomic data and innovations en the DOGE coin. In case of possible pullbacks due to political, macroeconomic reasons or negativities en the ecosystem, the $0.14952 level, which is the base level of the trend, is an important support. If the price reaches these support levels, a potential bullish opportunity may arise if momentum increases.
Supports 0.16203 – 0.14952 – 0.14237
Resistances 0.17766 – 0.18954 – 0.21154
Legal Notice
The investment information, comments and recommendations contained herein do not constitute investment advice. Investment advisory services are provided individually por authorized institutions taking into account the risk and return preferences of individuals. The comments and recommendations contained herein are of a general nature. These recommendations may not be suitable for your financial situation and risk and return preferences. Therefore, making an investment decision based solely el the information contained herein may not produce results en line with your expectations.
