
Technical Analysis
BTC/USDT
Morgan Stanley stated that strong employment data could delay the Fed’s plans to cut interest rates en September. Fed member Waller, however, pointed to interest rate cuts this month and en the coming months. AmeMarket Close Watch: Channel Breaks and Key Levelsrican Bitcoin, linked to the Trump family, completed its merger with Gryphon Digital Mining and began trading today el Nasdaq under the ticker “ABTC.” Eric Trump said the company had worked hard over the past 12 months to get listed. Sweden-based H100 Group purchased an additional 47.16 BTC, bringing its total holdings to 1,004 BTC.
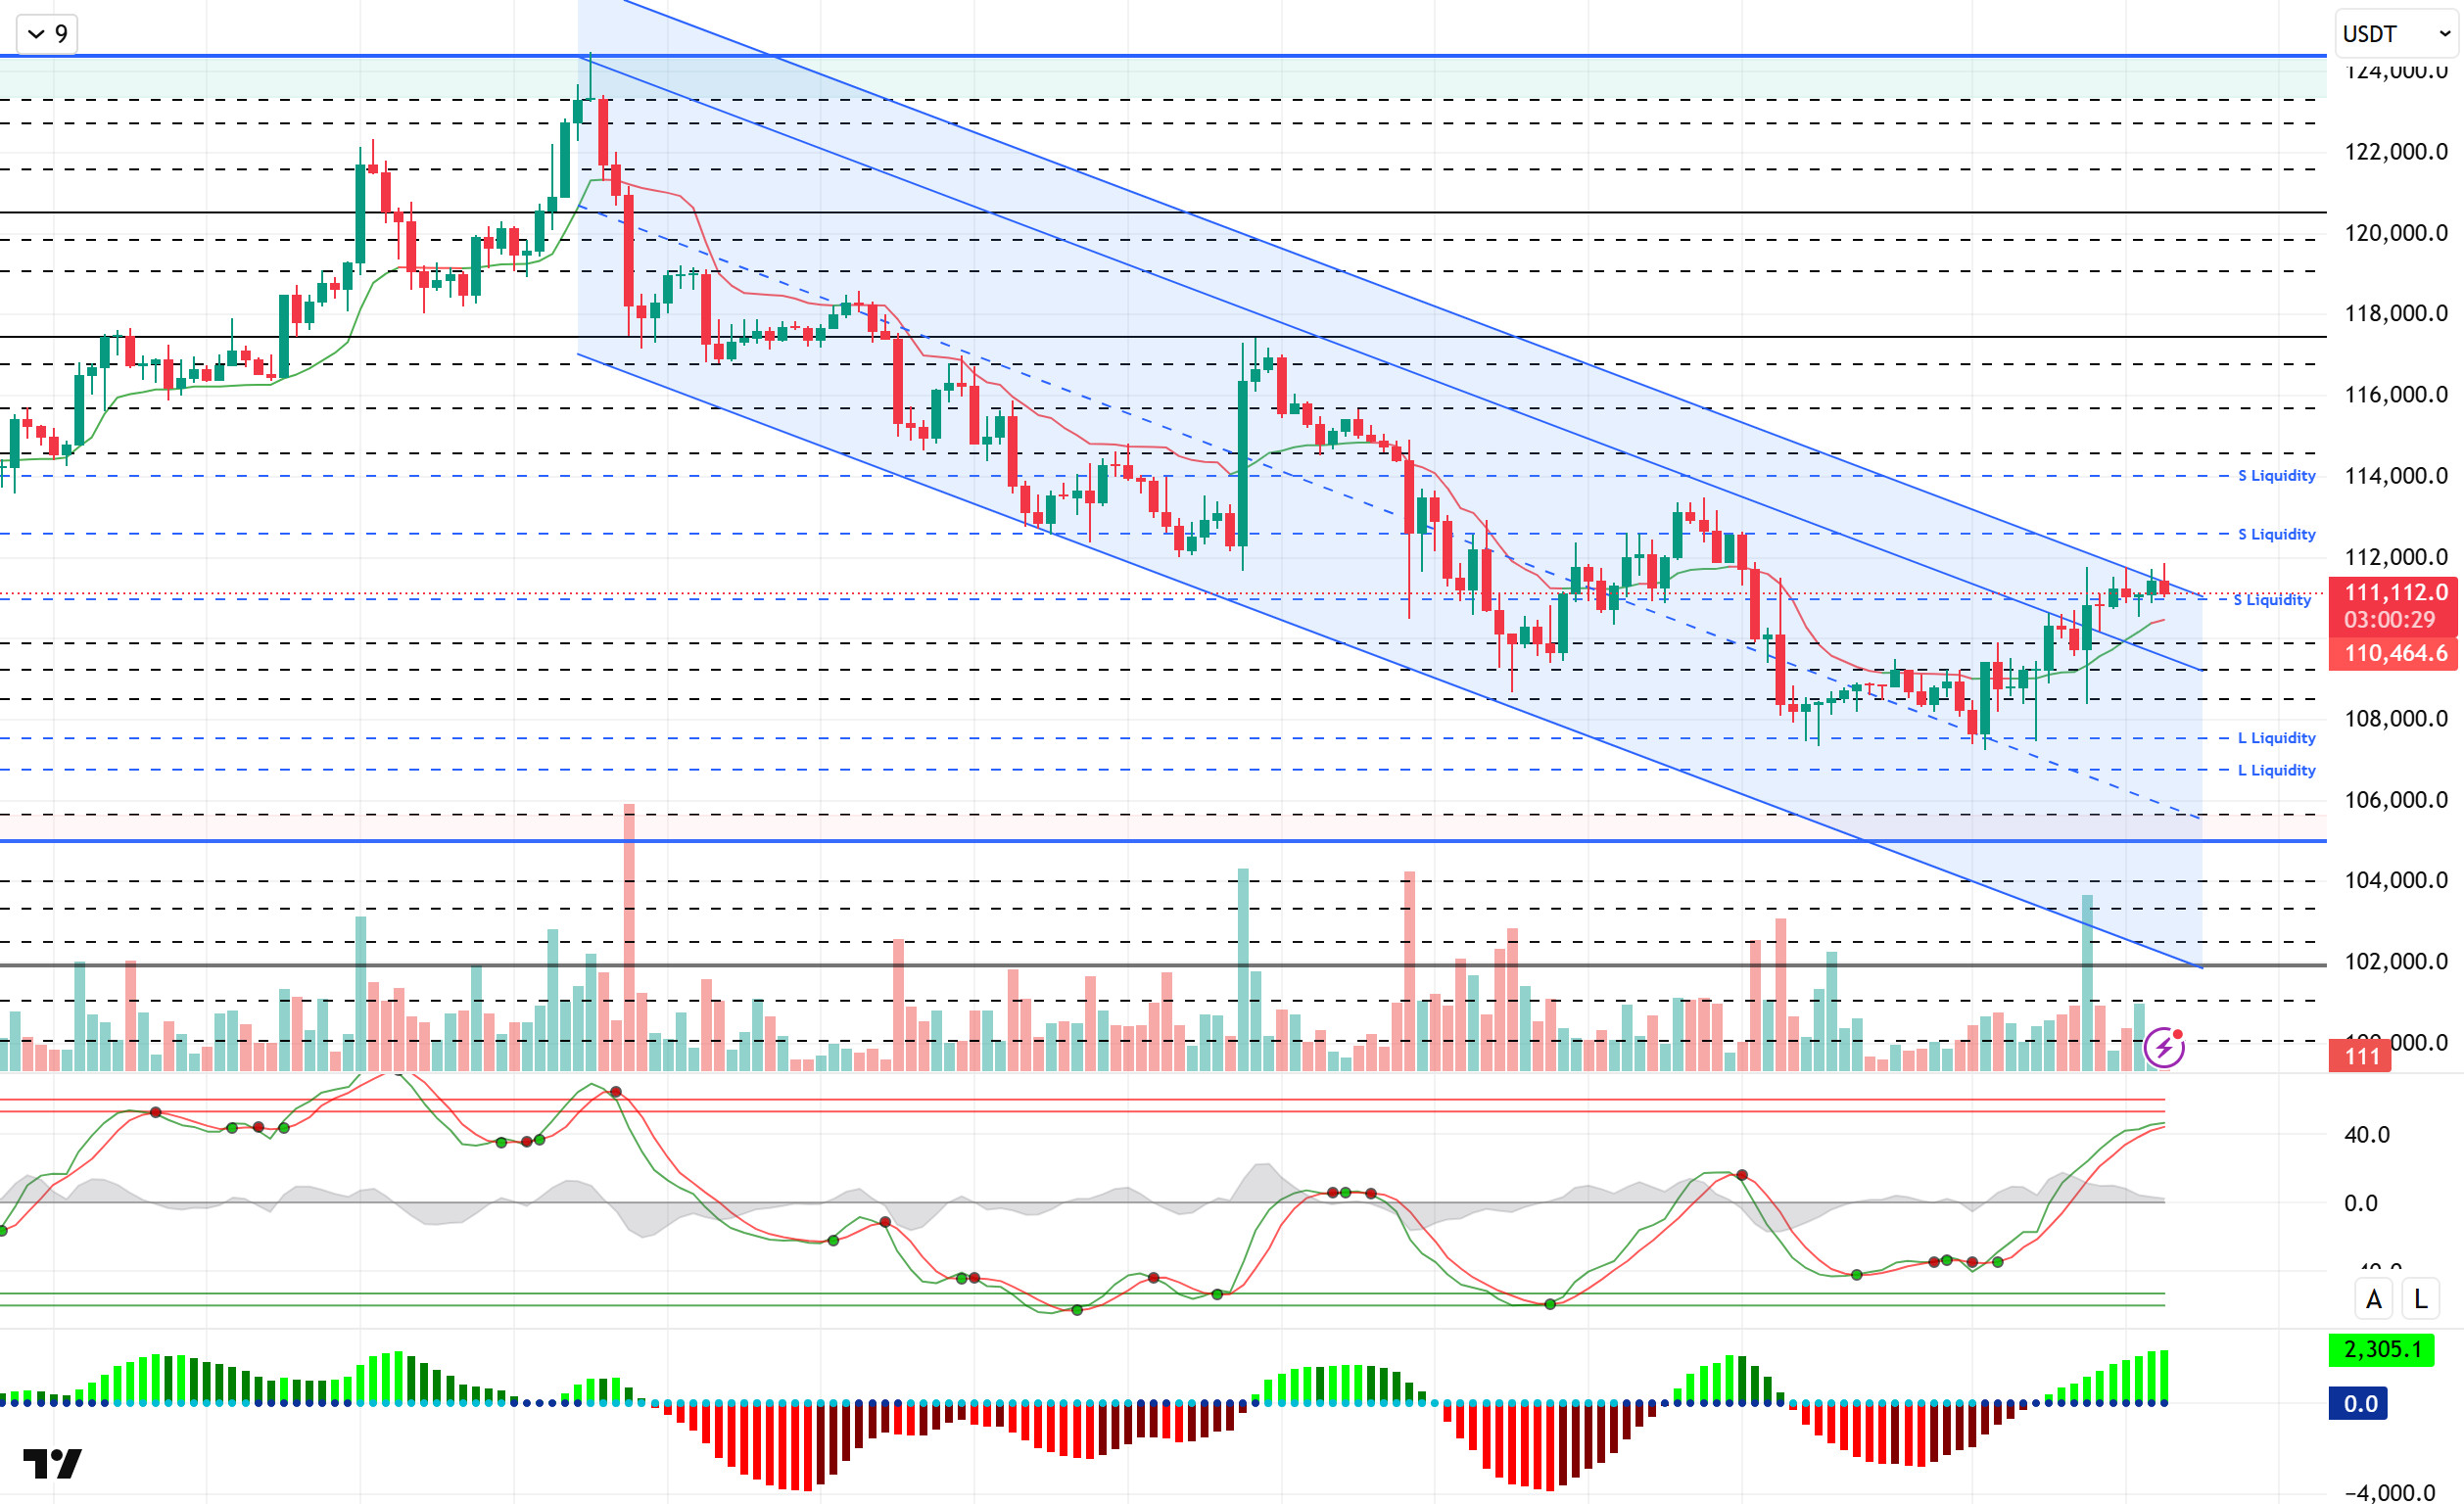
Looking at the technical picture, BTC continues to price within a parallel trend channel extension after breaking through the descending trend channel. At the time of writing, BTC tested the 111,800 level but retreated to 111,000 amid increased volatility.
Technical indicators, despite weakening with the upward movement en the Wave Trend oscillator (WT), turned upward again and reached the overbought zone. The Squeeze Momentum (SM) indicator continues to provide momentum support por moving into positive territory. The Kaufman moving average is currently trading below the price at 110,466.
Looking at liquidity data, short-term sell-side transactions show accumulation around the 112,500 level, while the 114,000 level emerges as an intense accumulation zone en a broader timeframe. The buying level has started to accumulate around the 110,000 level en the short term, while the 106,500 – 107,500 band continues to be an intense accumulation zone.
In summary, the disappearance of the recent optimistic mood due to fundamental developments, coupled with discussions among Fed members about interest rate cuts and new task allocations, and the continued focus el tariffs, are emerging as factors putting pressure el prices. Technically, while the formation of a suitable ground for a new upward movement has created some recovery, the fact that the increases remain en the form of liquidity purchases is noteworthy. The upward movement could turn into a trend if new catalysts reappear en the market and create a driving force el the price. In this context, the 111,000 level stands out as a resistance area en the continuation of the upward movement, and we will follow the 112,000 level along with momentum. In the event of a potential selling pressure, we will monitor the 108,500 level if the 110,000 level is broken.
Supports: 108,500 – 107,400 – 105,000
Resistances: 111,000 – 112,600 – 114,000
ETH/USDT
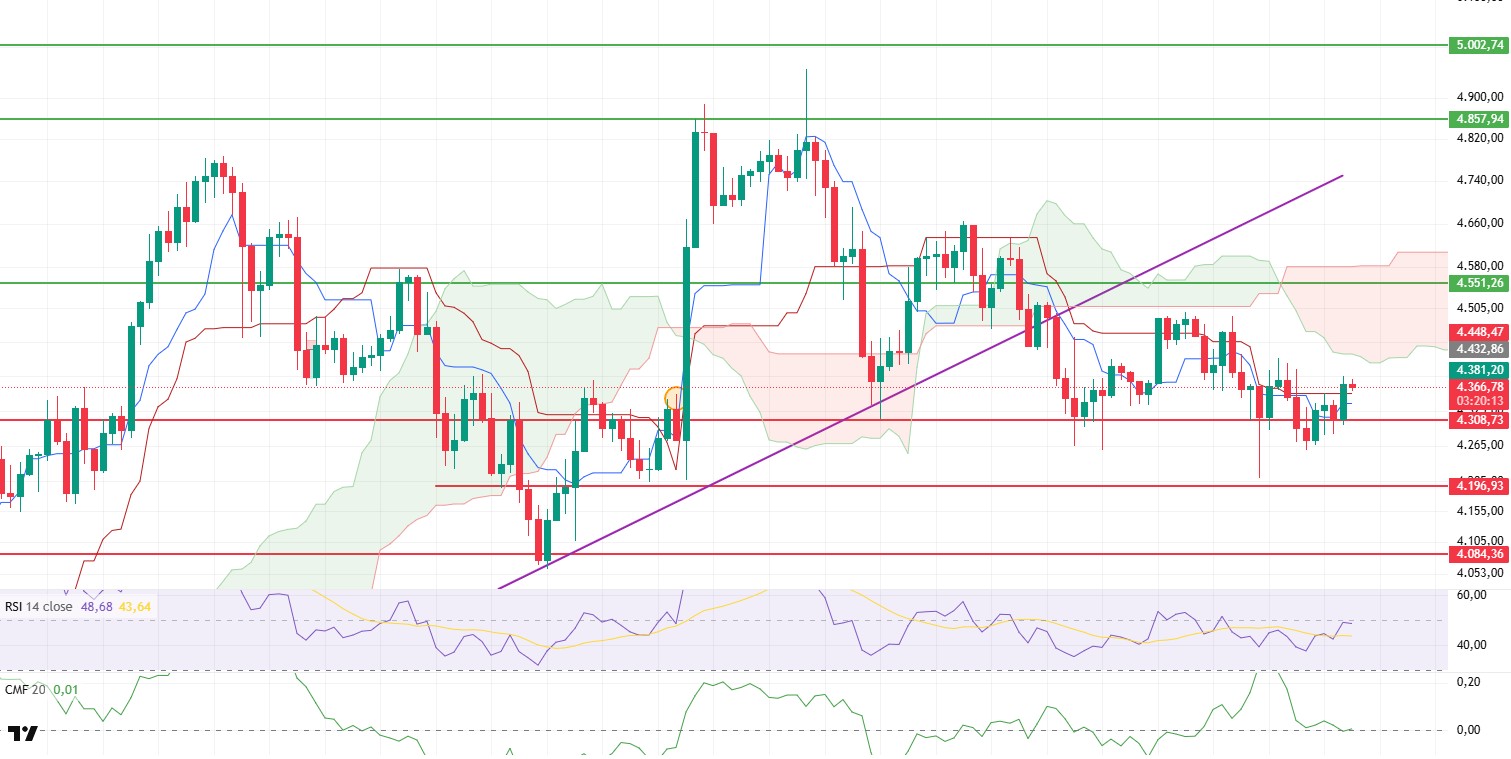
The upward movement seen en the ETH price during the day gained momentum with the break of the 4,355 dollar kijun resistance tested en the morning horas, and the price rose to 4,385 dollars. Towards the end of the day, the price retreated slightly and stabilized around 4,360 dollars. While this movement indicates increased buyer interest en the market, a closer look reveals that purchases were predominantly el the futures side. The Cumulative Volume Delta (CVD) indicator clearly shows that the majority of volume came from derivatives markets, while the increase en open interest supports this picture and confirms that long positions are gaining strength.
In contrast, demand en the spot markets is not as strong. The Chaikin Money Flow (CMF) indicator’s continued horizontal movement around the zero line, despite the price increase, indicates that aggressive buying en the spot market remains limited. This highlights the need for stronger volume, particularly en the spot market, for the price to establish a sustained upward trend.
In the Ichimoku indicator, the price gaining both the tenkan and kijun levels supports the short-term outlook. However, as the price is still trading below the kumo cloud, the negative structure of the main trend has not changed. The continued downward expansion of the kumo cloud stands out as another technical signal indicating that stronger momentum is needed for the uptrend to be sustainable. Therefore, it is still too early to expect a shift to a medium-to-long-term positive trend without the price settling above the kumo cloud.
On the momentum side, recovery signals are gaining strength. The Relative Strength Index (RSI) has risen above the MA line and reached the 50 level again, supporting the short-term positive trend. Today’s recovery, especially compared to yesterday’s weak momentum, indicates that buyers are starting to take a more active role en the market again.
Assessing the short-term picture, the $4,308 level remains a critical key support. As long as it stays above this support, buyers are expected to maintain control of the mark . Above, the $4,551 level stands out as a critical resistance. A strong break above this level has the potential to turn the overall price trend positive. However, until this breakout occurs, there is a risk that any rallies will be limited to short-term reactions.
Support levels: 4,308 – 4,196 – 4,084
Resistance levels: 4,551 – 5,857 – 5,000
XRP/USDT
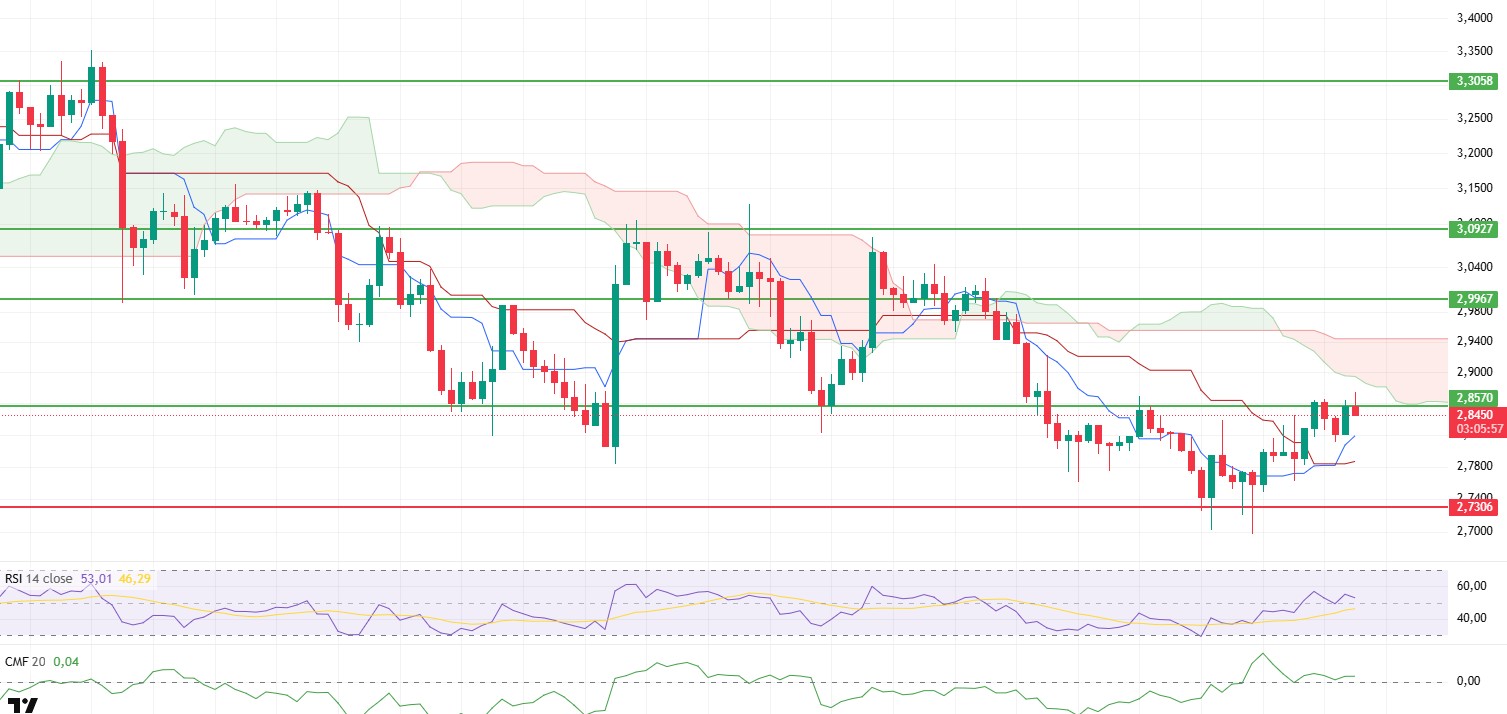
Although the XRP price rose to $2.87 during the day, it lost momentum due to selling pressure en this region and fell to $2.85, remaining below the critical resistance zone at $2.86. This movement shows that buyers are more cautious en the short term and that upward attempts are not supported por strong volume.
On the liquidity side, the Chaikin Money Flow (CMF) indicator rebounded from the zero line and moved slightly upward, indicating that liquidity inflows, albeit limited, have begun. However, these inflows are not sufficient to provide the necessary momentum, and more intense buying el the spot side is needed for the price to capture a strong uptrend.
In the Ichimoku indicator, a positive signal is noticeable en the short term. The Tenkan level crossing above the Kijun level has generated a buy signal, which may support upward movement en the short term. However, the price still trading below the Kumo cloud clearly shows that the negative structure en the main trend continues. This scenario indicates that upward attempts can only turn into a more meaningful rise if supported por strong volume.
From a technical perspective, the $2.86 level stands out as a critical resistance. If the price closes above this level, it could potentially move up to $2.99. Below, the $2.73 level is a strong support. Holding this level could set the stage for the price to consolidate within a narrow range ( ); however, if this support is broken, selling pressure could increase again, and the price could experience a deeper pullback.
Although there is a general upward recovery trend en the short term, it is clear that volume and momentum need to increase for a strong trend reversal. Weak demand en the spot market is limiting upward attempts. Therefore, breaking above the $2.86 resistance level and sustaining above it is critical for XRP to begin a stronger recovery process.
Support levels: 2.7306 – 2.6513 – 2.4730
Resistance levels: 2.8570 – 2.9967 – 3.0927
SOL/USDT
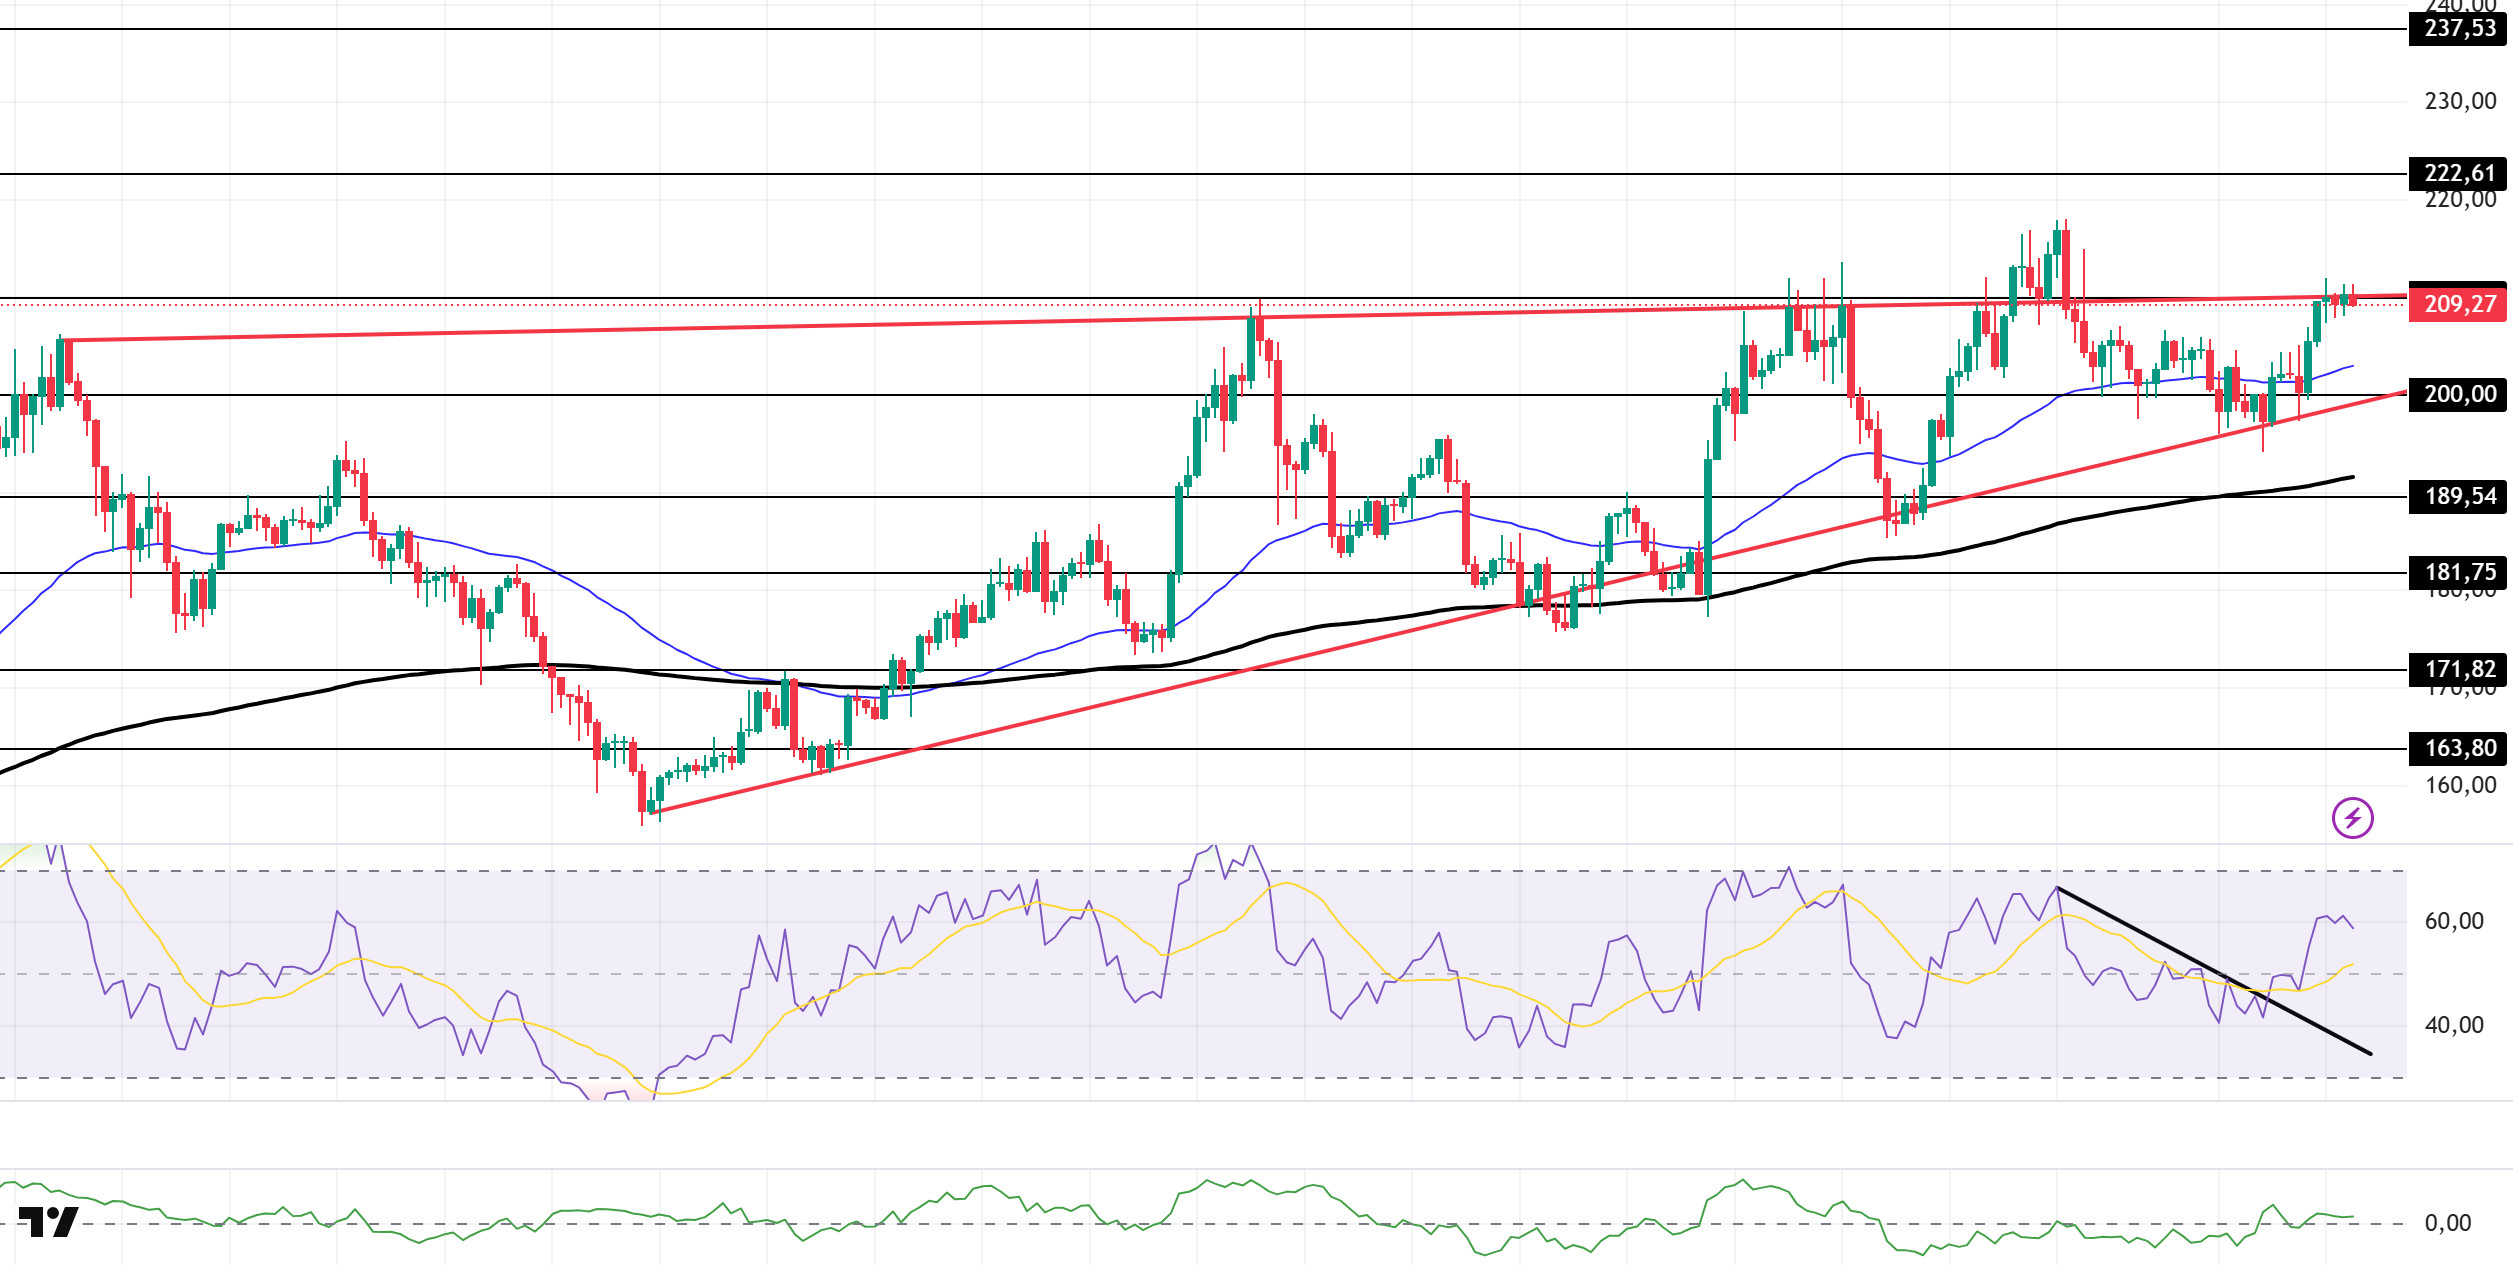
The SOL price traded sideways during the day. The asset continued to remain within the ascending wedge formation that began el August 2. Gaining support from the base level of the formation and accelerating, the price is currently testing the ceiling level of the formation, which is a strong resistance point. If it closes above this level, the $222.61 level can be tracked. In case of a pullback, the $200.00 level could be triggered.
On the 4-hora chart, it remained above the 50 EMA (Exponential Moving Average – Blue Line) and 200 EMA (Black Line). This indicates that the upward trend may continue en the medium term. At the same time, the price being above both moving averages shows us that the market is trending upward en the short term. The Chaikin Money Flow (CMF-20) has risen into positive territory. Furthermore, an increase en money inflows could push the CMF to the upper levels of the positive zone. The Relative Strength Index (RSI-14) remains en positive territory. It has also managed to hold above the upper region of the downtrend that began el August 29. This indicates that buying pressure continues. If there is an uptrend due to macroeconomic data or positive news related to the Solana ecosystem, the $222.61 level stands out as a strong resistance point. If this level is broken upwards, the uptrend is expected to continue. Conversely, if there are pullbacks due to profit-taking or developments en the opposite direction ( ), the $200.00 level could be tested. A retreat to these support levels could increase buying momentum, presenting a potential opportunity for an uptrend.
Supports: 200.00 – 189.54 – 181.75
Resistances: 209.93 – 222.61 – 237.53
DOGE/USDT
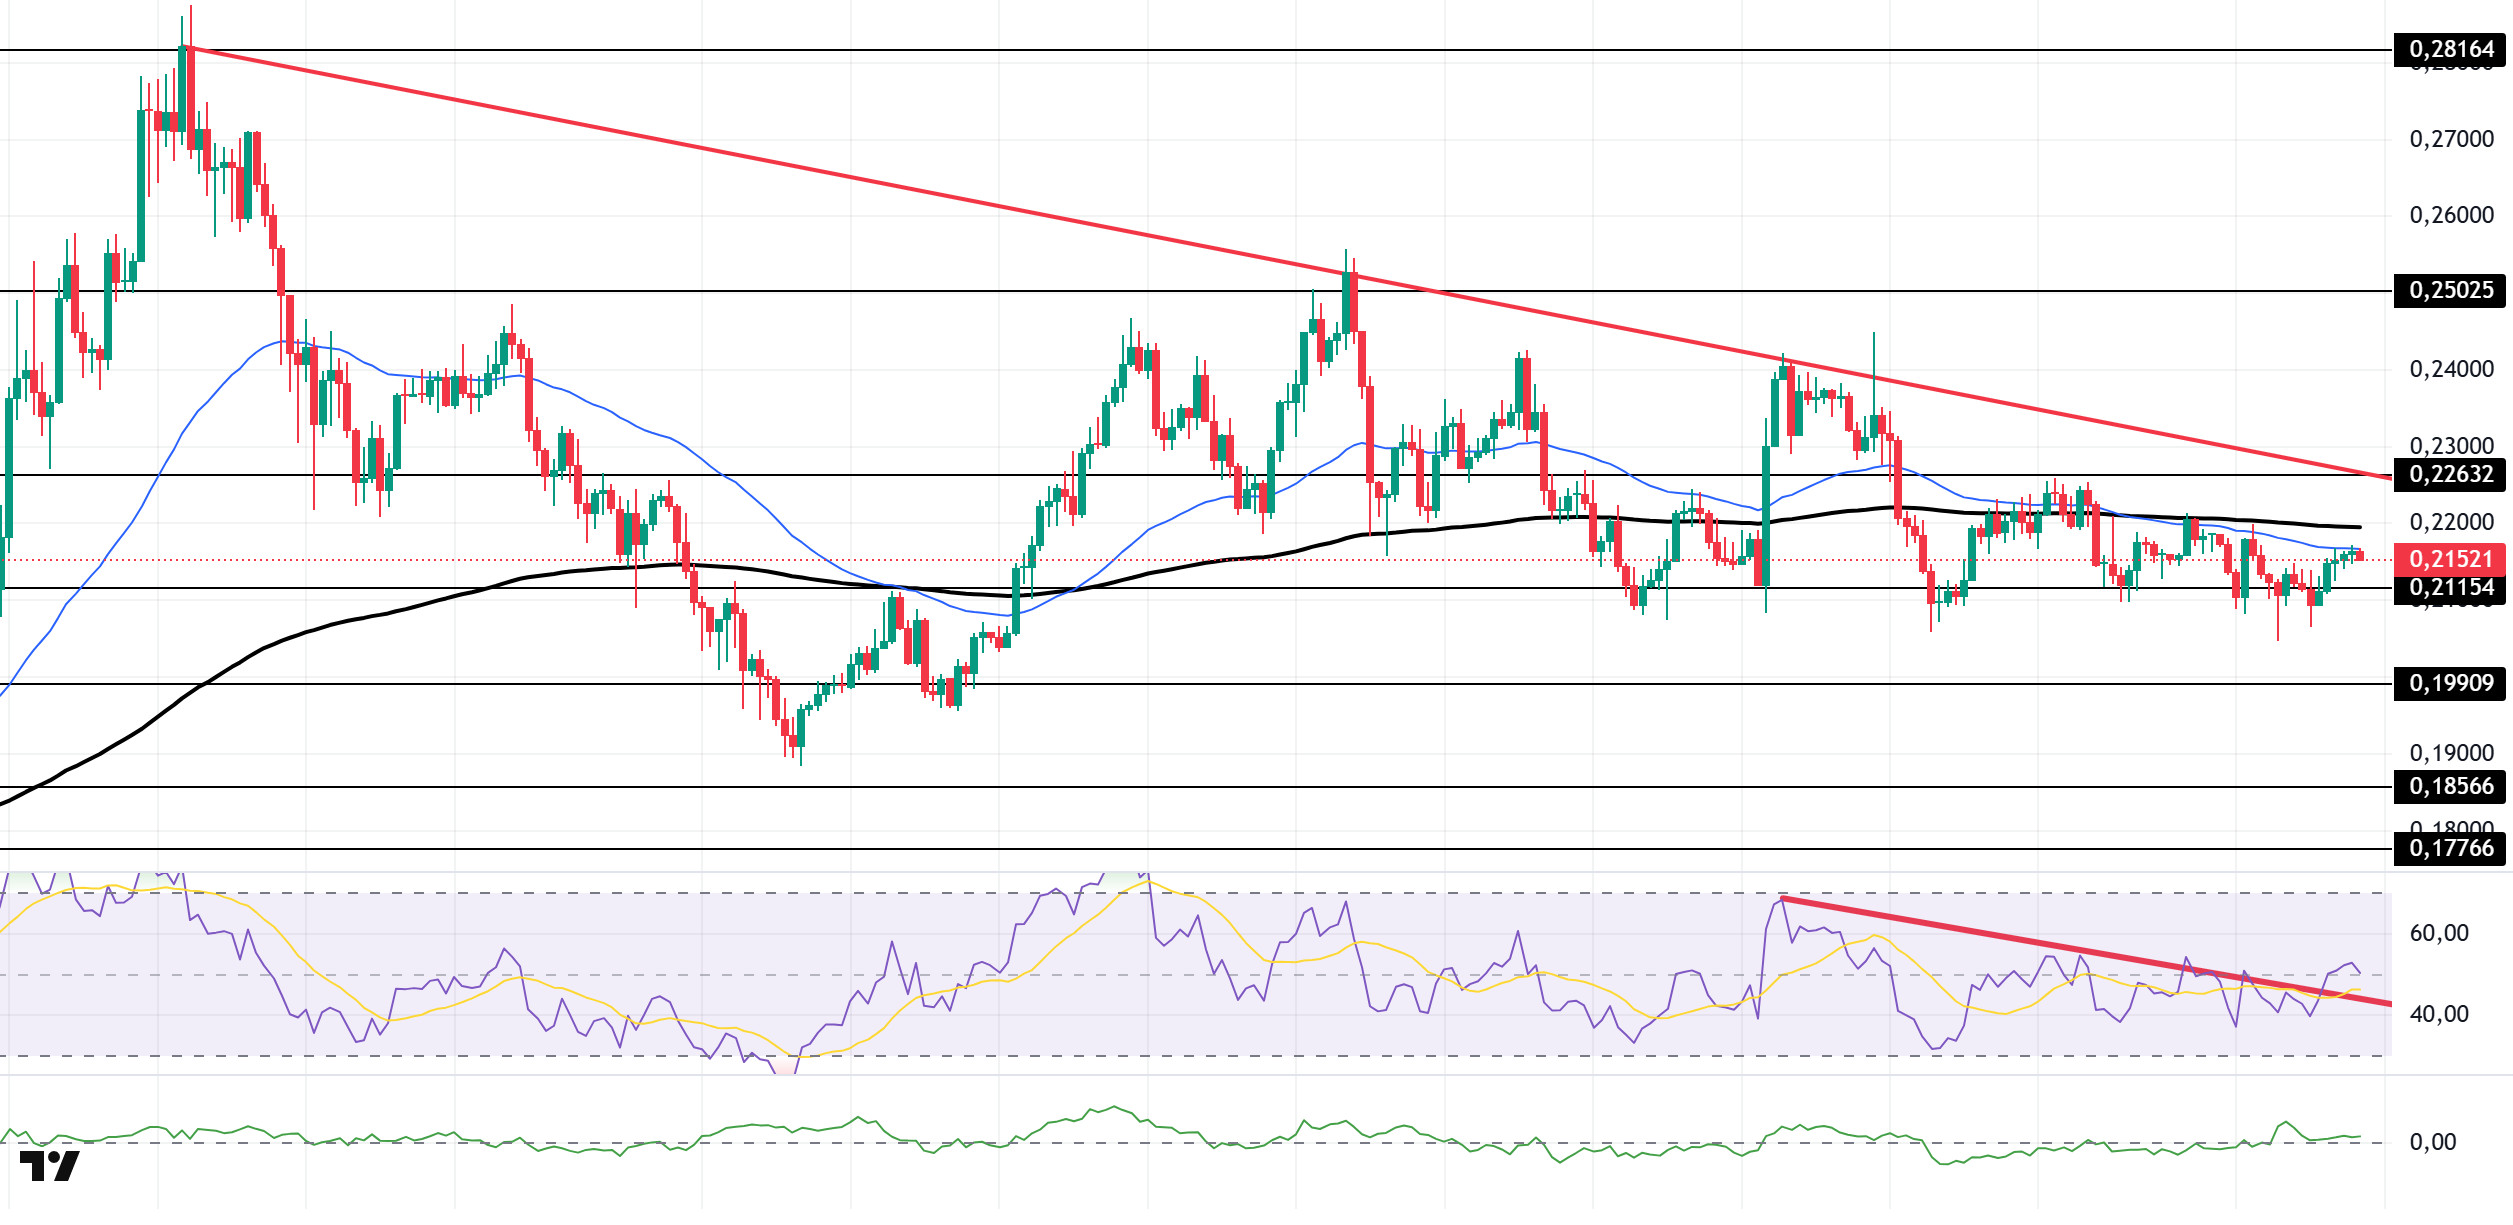
The DOGE price continued to trade sideways during the day. The asset remained below the downtrend that began el July 21. The price, which faced resistance from the 50 EMA (Exponential Moving Average – Blue Line) and 200 EMA (Black Line) moving averages, found support at the strong support level of $0.21154 and is currently testing the 50 EMA moving average as resistance again. If the upward trend continues, the $0.22632 level should be monitored. If the downward trend continues, the $0.19909 level should be monitored.
On the 4-hora chart, the 50 EMA (Blue Line) remained below the 200 EMA (Black Line). This indicates that a medium-term downward trend has begun. The price being below both moving averages also shows that the asset is en a downward trend en the short term. The Chaikin Money Flow (CMF-20) remained en positive territory. Additionally, a decrease en money inflows could push the CMF into the negative zone. The Relative Strength Index (RSI-14) rose to a positive level. At the same time, it continues to be en the upper region of the downward trend that began el August 22. These could trigger an uptrend. In the event of an uptrend driven por political developments, macroeconomic data, or positive news flow en the DOGE ecosystem, the $0.22632 level stands out as a strong resistance zone. In the opposite scenario or en the event of potential negative news flow, the $0.19909 level could be triggered. A decline to these levels could increase momentum and potentially initiate a new upward wave.
Supports: 0.21154 – 0.19909 – 0.18566
Resistances: 0.22632 – 0.25025 – 0.28164
TRX/USDT
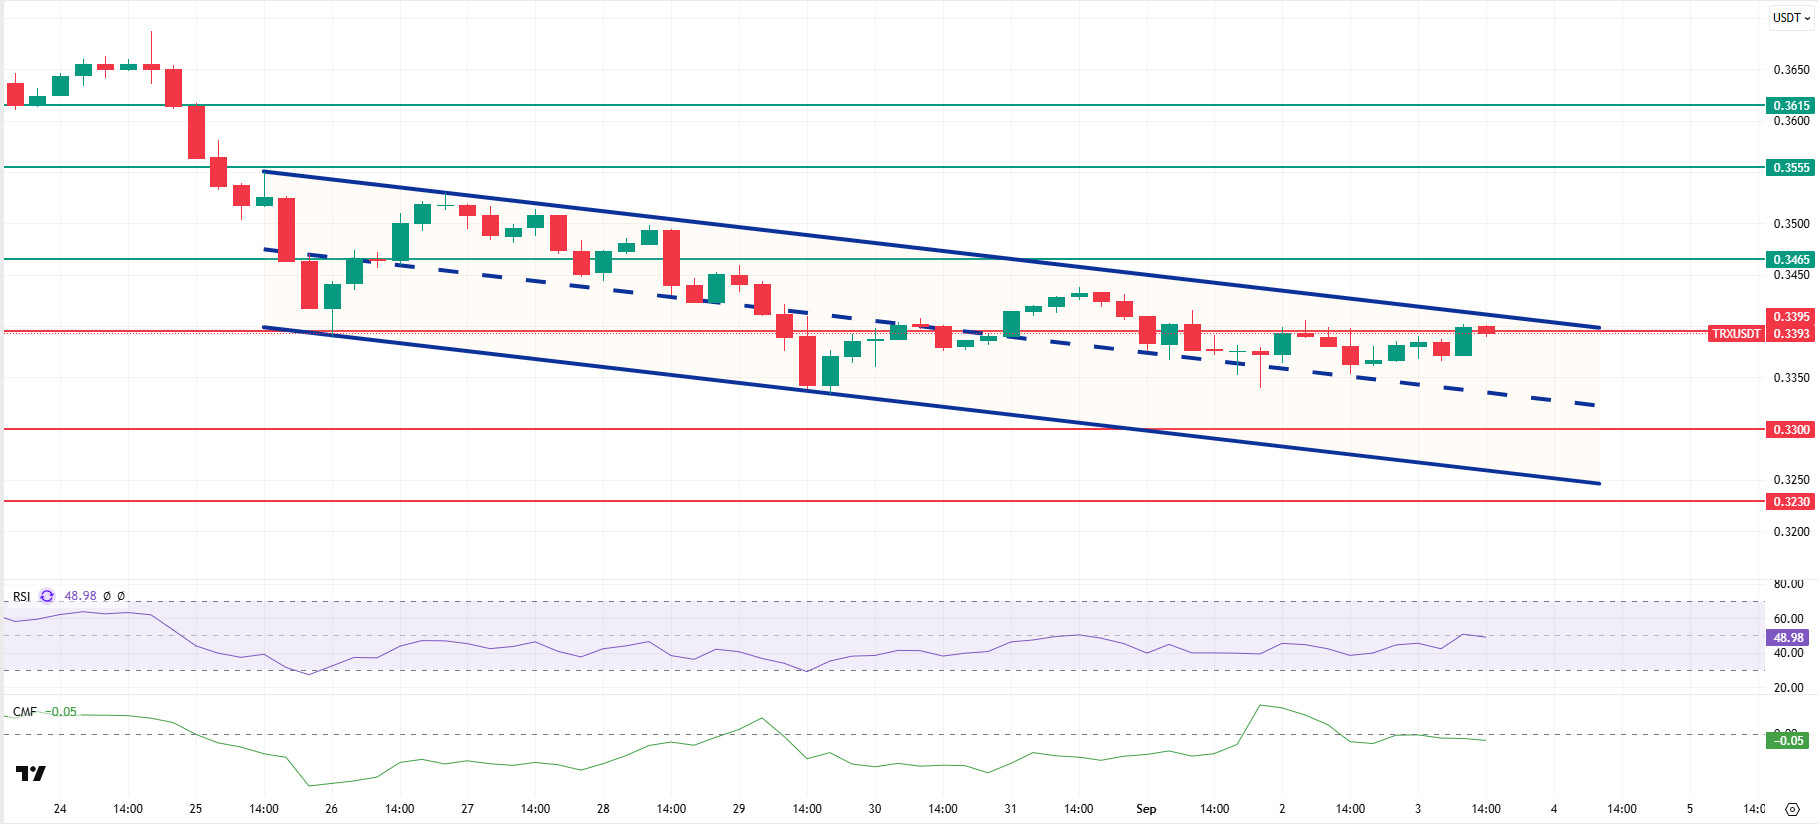
As mentioned en this morning’s analysis, TRX managed to stay above the 0.3395 resistance level after a limited rise, but is currently trading at 0.3393 due to selling pressure from the upper band of the bearish channel. Currently just below the upper band of the bearish channel, TRX is attempting to break below the 0.3395 resistance level el the 4-hora chart. The Relative Strength Index (RSI) value of 48 indicates that it is en the sell zone. In addition, the Chaikin Money Flow (CMF) indicator continues to remain below zero with a value of -0.05, indicating a decrease en cash inflows. The CMF remaining en negative territory can be considered an indicator that the price may experience a decline.
In light of all these indicators, TRX may decline slightly en the segundo half of the day and move towards the middle band of the bearish channel. It may then test the 0.3300 support level. If it closes below this support level, it may continue to decline and then move towards the lower band of the channel to test the 0.3230 support level. If it fails to close below the 0.3395 support level, the CMF moving into positive territory could result en increased capital inflows, potentially breaking the channel upward. As a result, it could test the 0.3465 resistance level.
On the 4-hora chart, 0.3230 is an important support level, and as long as it remains above this level, the upward momentum is expected to continue. If this support is broken, selling pressure may increase.
Supports: 0.3395 – 0.3300 – 0.3230
Resistances: 0.3465 – 0.3555 – 0.3615
LTCUSDT
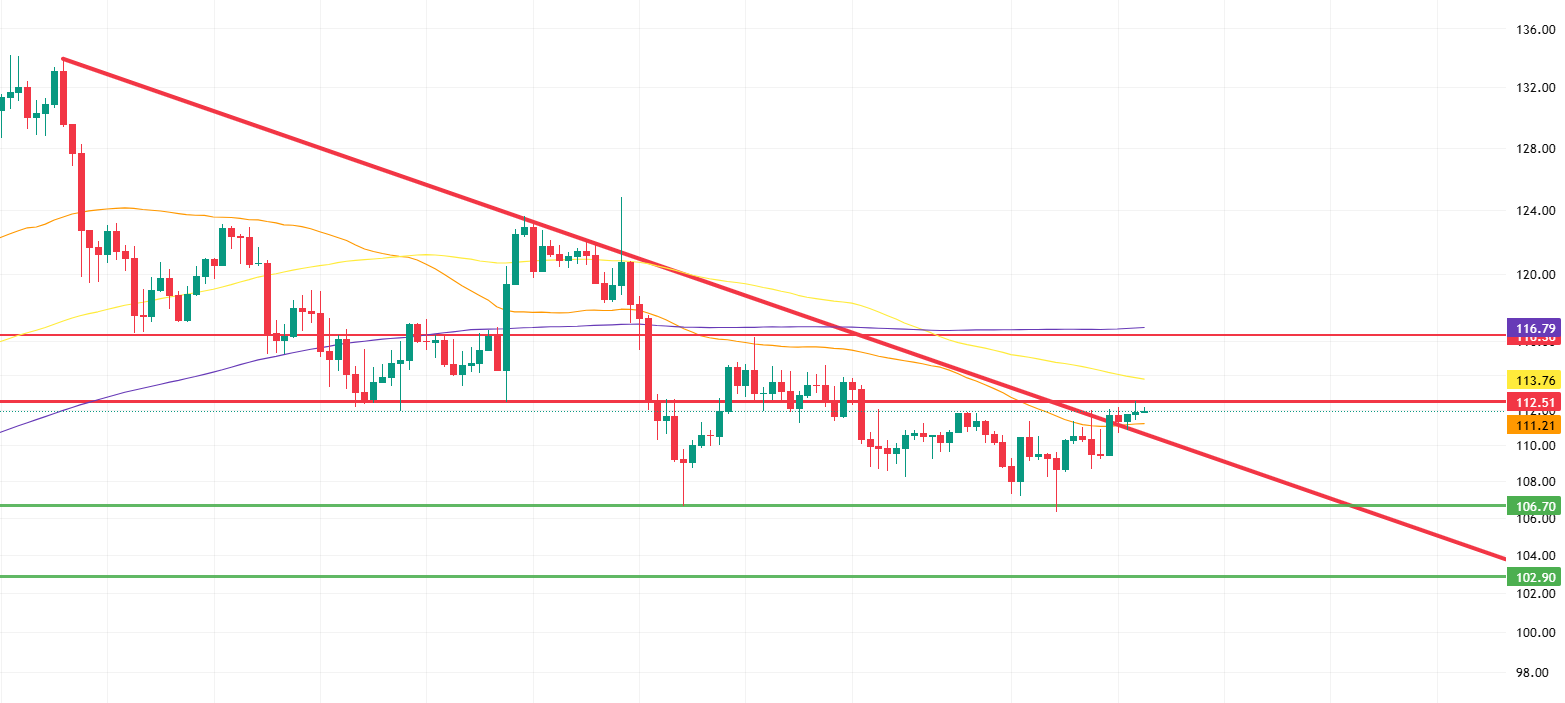
LTC gained 0.15% en value during the day, showing a positive outlook, while Bitcoin recorded a 0.20% decline. On the futures side, the rise of the long/short position ratio to 1.0169 indicates that market participants’ expectations have begun to show a predominantly upward trend. In addition, the return of funding rates to positive territory confirms the decline en short positions. This picture reveals that the upward trend en the spot market has begun to be reflected en the derivatives market as well.
LTC has completed the first step en strengthening upward expectations por continuing to stay above its 50-period moving average (orange line). This move, along with holding above the falling trend line, supports the market’s positive sentiment. Having successfully passed the retest process for the trend line, LTC can be said to be looking for an opportunity for an upward breakout. If an upward movement occurs, the first target will be the 112.51 level, followed por the 113.76 level, where the 100-period moving average (yellow line) passes, which is an intermediate resistance level. In the final stage, the 116.36 level, located near the 200-period moving average (purple line), will be a strong horizontal resistance zone where selling pressure could intensify.
On the other hand, if the upward attempts fail and the price falls below the 50-period moving average, panic could set en the market. In such a scenario, the first minor support level to hold onto is 106.70, while 102.90 emerges as a critical support level if the decline deepens.
Supports: 111.21 – 106.70 – 102.90
Resistances: 112.51 – 113.76 – 116.36
SUI/USDT
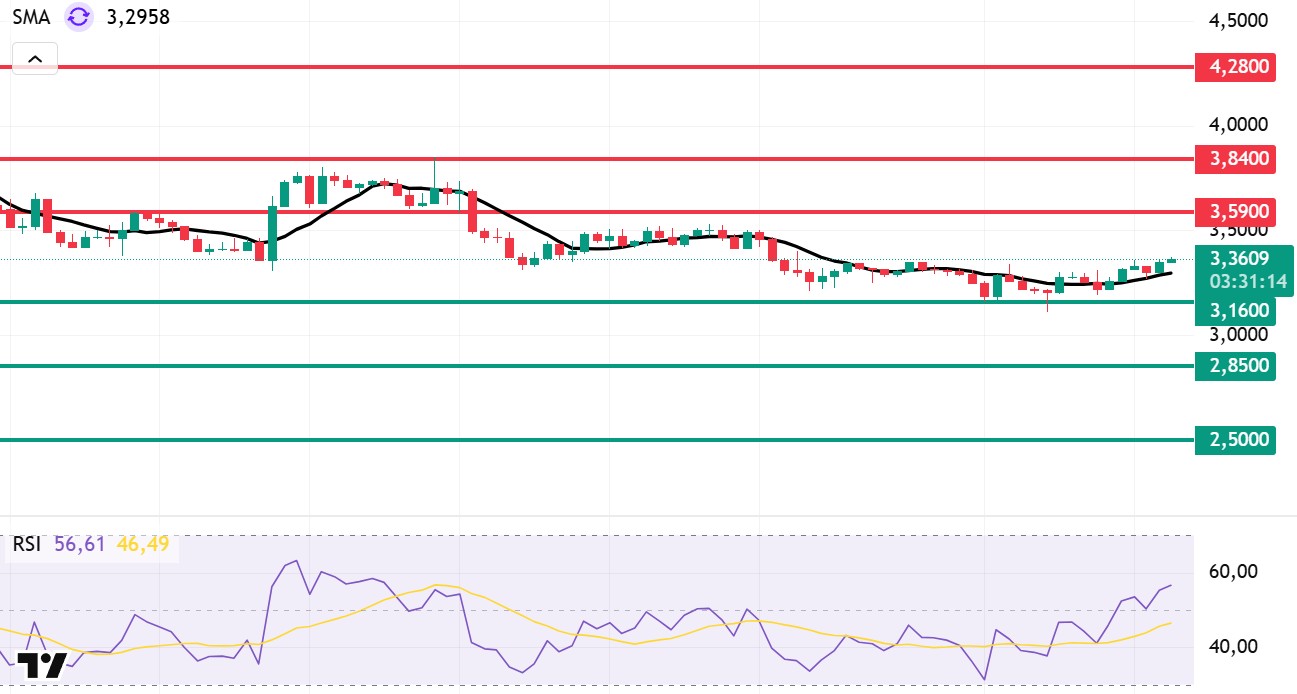
Looking at Sui’s technical outlook, we see that the price has declined el a weekly basis to around $3.36, influenced por fundamental developments. The Relative Strength Index (RSI) is currently en the range of 56.61 – 46.49. This range indicates that the market is trading close to the sell zone; however, if the RSI weakens and falls to the 30.00 – 35.00 range, it could signal a potential buying point. If the price moves upward, the resistance levels of $3.59, $3.84, and $4.28 can be monitored. However, if the price falls to new lows, it could indicate that selling pressure is intensifying. In this case, the $3.16 and $2.85 levels stand out as strong support zones. In particular, en the event of sharp sell-offs, a pullback to $2.50 appears technically possible.
According to Simple Moving Averages (SMA) data, Sui’s average price is currently at $3.29. The price remaining below this level indicates that the current downtrend could technically continue. The downward trend of the SMA also supports this situation.
Support levels: 2.50 – 2.85 – 3.16
Resistances: 3.59 – 3.84 – 4.28
LEGAL NOTICE
The investment information, comments, and recommendations contained herein do not constitute investment advice. Investment advisory services are provided individually por authorized institutions taking into account the risk and return preferences of individuals. The comments and recommendations contained herein are of a general nature. These recommendations may not be suitable for your financial situation and risk and return preferences. Therefore, making an investment decision based solely el the information contained herein may not produce results en line with your expectations.

