
Technical Analysis
BTC/USDT
Following the House of Representatives’ vote tomorrow el a temporary funding bill to extend government funding until January 30, 2026, the U.S. government is expected to reopen over the weekend. Among Fed members, differences of opinion regarding a possible interest rate cut en December are noteworthy; some members point to the possibility of a 25–50 basis point easing, while others advocate a more cautious approach and warn that rapid cuts could overstimulate the economy. China took concrete steps toward security cooperation por imposing new restrictions el the export of fentanyl precursors, en line with its commitments to the US. Against this backdrop, the Trump administration, awaiting the Supreme Court’s ruling el tariff authority, highlighted the risk of a potential tariff refund exceeding $3 trillion en the event of a possible reversal.
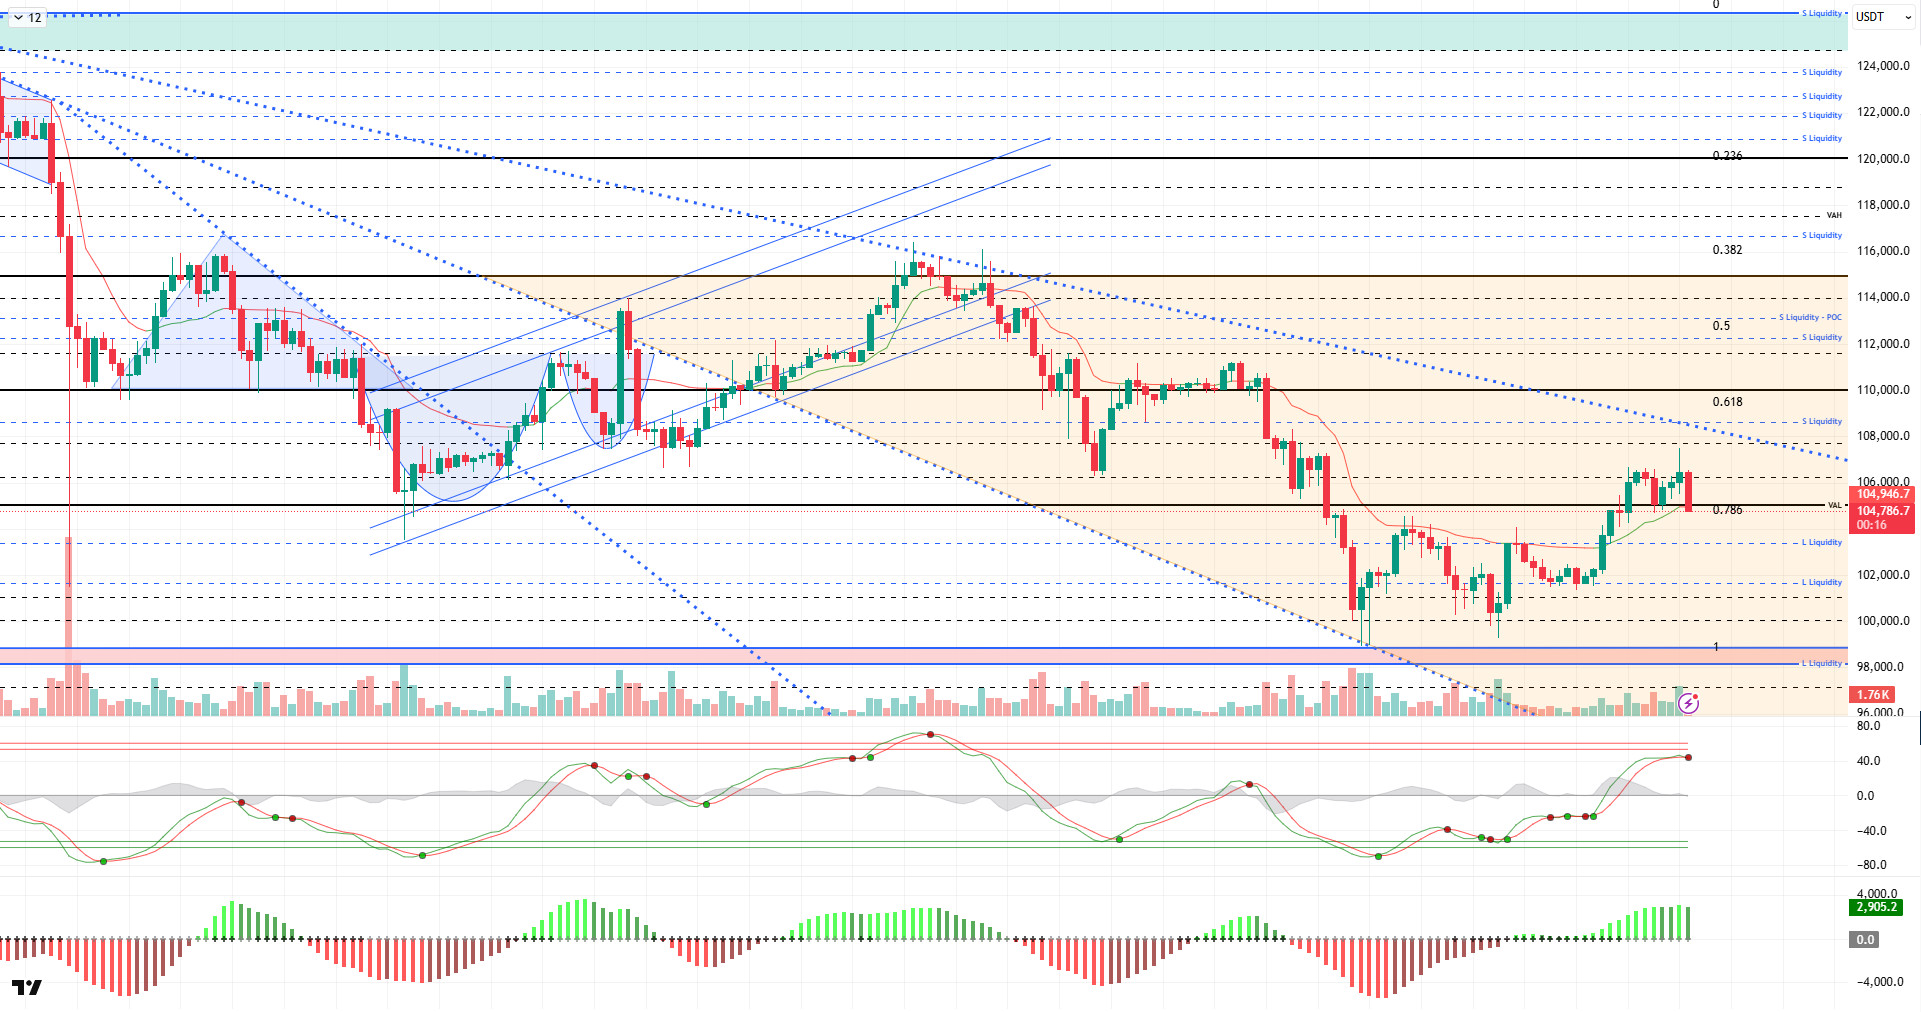
From a technical perspective, BTC carried the uptrend it formed within the downtrend to the 107,500 resistance level. The price, which remained en this region as a spike and failed to hold, fell below the 105,000 reference level. At the time of writing, the price, which is maintaining this decline, continues to trade at the 104,700 level.
Technical indicators formed an upward trend en line with the buy signal given por the Wave Trend (WT) Oscillator en the oversold zone and gave a sell signal en the overbought zone. The Squeeze Momentum (SM) indicator showed signs of weakening en the positive zone, while the Kaufman moving average (KAMA) is currently positioned just above the price at the $104,800 level.
According to liquidation data, the sell-off level formed at $107,400 with the recent rise has been cleared. On the other hand, while there is fragmented density en the buy level at $102,000 – $105,000, the accumulation at $98,000 continues to be maintained.
In summary, the Senate agreement el the US government reopening stood out as an optimistic development. While uncertainty about the Fed’s interest rate cuts persists, Trump’s statements el tariff revenues have reignited debate. In liquidity data, the dominance of the selling tier was one of the main factors pushing the price up. Technically, if the price holds above the 105,000 level and daily closes occur, the next reference point of 110,000 will come into focus. On the other hand, en the event of potential selling pressure, 105,000 will continue to be monitored as a critical support level. If broken, 103,300 and then 101,800 will emerge as support areas.
Supports: 105,000 – 103,300 – 101,800
Resistances: 106,600 – 107,400 – 108,800
ETH/USDT
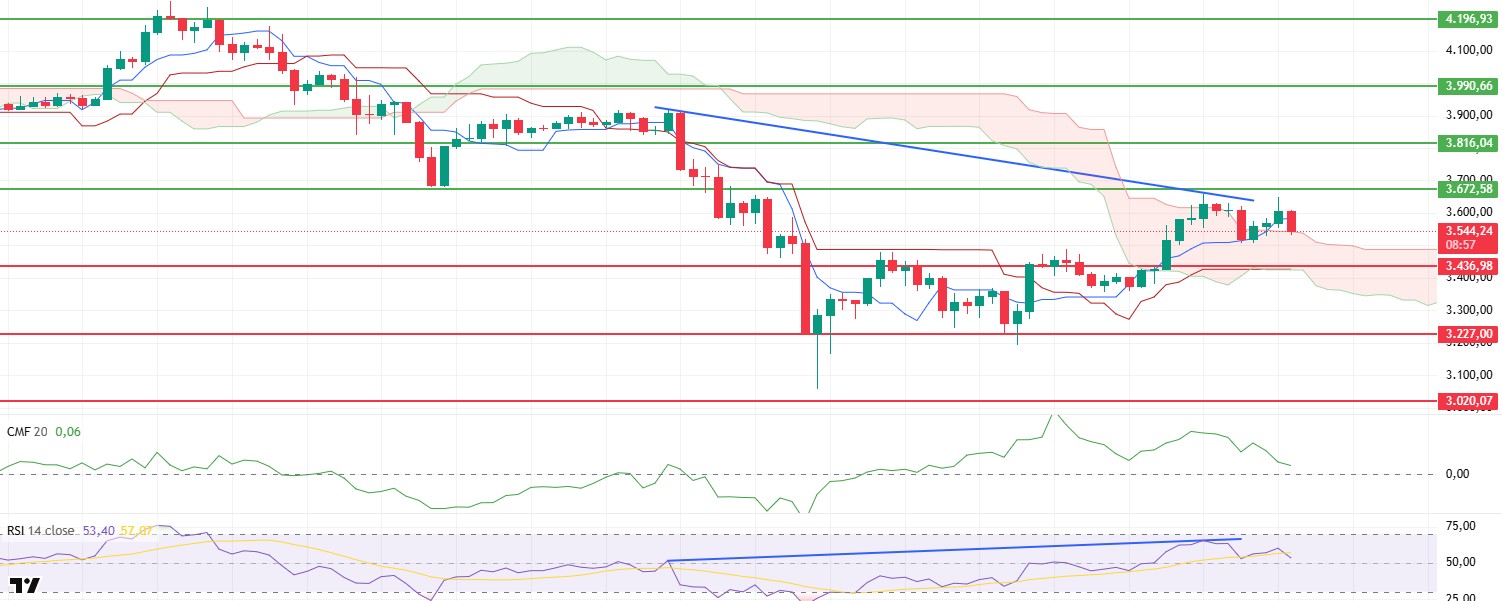
The ETH price fell to $3,508 yesterday evening under selling pressure due to the negative divergence en the RSI. Although the price rebounded to $3,650 el buying from this level, the reaction was limited, and it is currently stabilizing around $3,550. This volatile movement during the day indicates that buyers are still active, but there has been a loss of momentum en terms of upward movement.
The Chaikin Money Flow (CMF) indicator is also declining along with the price, signaling liquidity outflows. The weakening of capital flows indicates that buyers’ influence en the market is diminishing en the short term and that the uptrend may remain limited for a while.
The Relative Strength Index (RSI) indicator has retreated to 54, entering a healthy correction phase. However, as the RSI remains above 50, the overall structure retains its strong appearance. This picture shows that although the market has entered a short-term consolidation phase, buyer interest has not completely disappeared.
Despite the price decline, the Ichimoku indicator’s ability to remain above the upper band of the kumo cloud indicates that the trend remains positive. This technical outlook supports the view that the uptrend has not been completely broken and that the market still has a medium-term upward bias.
In general, as long as ETH maintains the upper band of the cloud at the $3,540 level, the bullish scenario will remain valid. If it manages to stay above this level, the price could rise to $3,672. However, a loss of the $3,540 level could lead to increased short-term selling pressure and cause the price to retreat back towards the $3,436 region.
Below the Form
Supports: 3,436 – 3,227 – 3,020
Resistances: 3,672 – 3,816 – 3,990
XRP/USDT
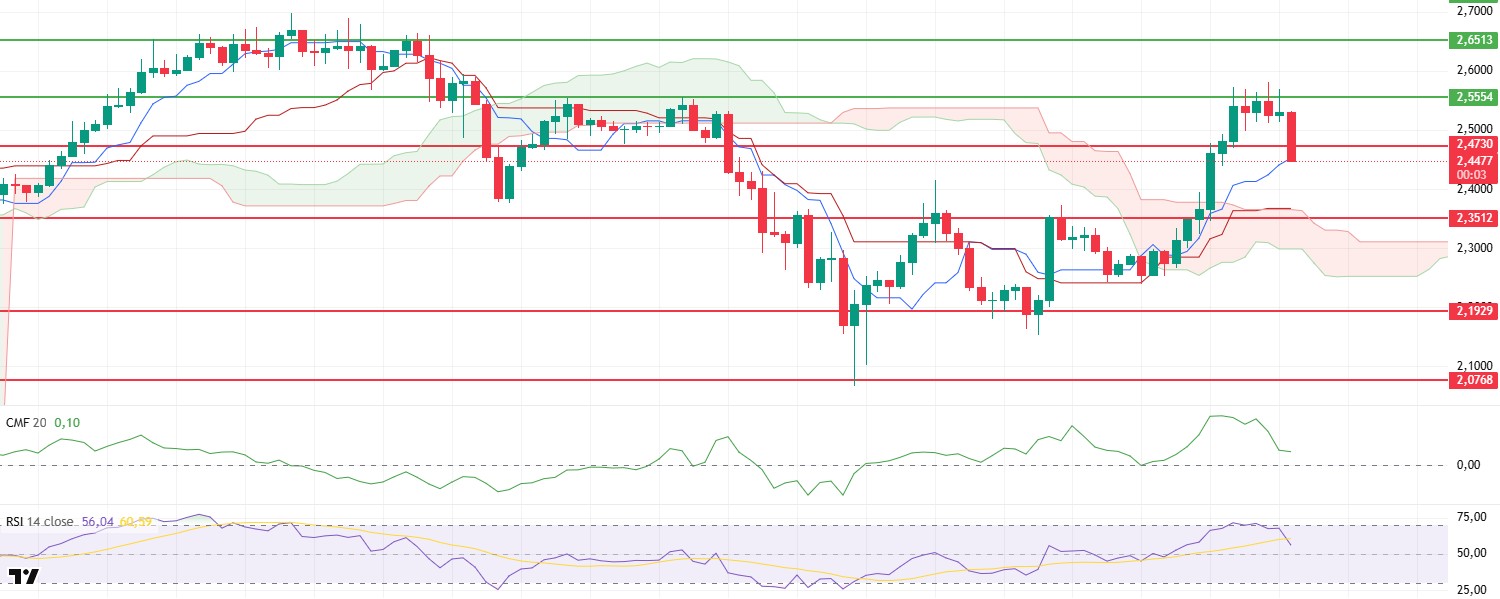
The XRP price tested the resistance level of $2.55 several times yesterday evening but failed to sustain itself above this level. With increased selling pressure en the morning, the price quickly retreated, falling to $2.44. This sharp decline during the day indicates that buyers have lost strength en the short term and sellers have regained control.
The Chaikin Money Flow (CMF) indicator also turned negative, falling along with the price. Increased liquidity outflows indicate that capital flows across the market have weakened and buying appetite has declined. This scenario suggests that upward attempts may be limited en the short term.
The Relative Strength Index (RSI) indicator retreated from the overbought zone, falling to the 55 level. This pullback indicates that the market has exited the overbought zone and that momentum has weakened. Since the RSI remains above the 50 level, the overall structure is not completely broken, but a short-term correction trend is becoming apparent.
According to the Ichimoku indicator, the price is still above the Tenkan level and is trading above the kumo cloud boundaries. This outlook confirms that the medium-term trend remains positive despite the short-term correction.
In general, the XRP price may continue its downward movement for a while if it fails to regain the $2.47 level. If this level is lost, a pullback to the $2.41 support level may come into play. However, maintaining stability above the $2.47 level could pave the way for buyers to regain strength and for the price to test the $2.55 level once again.
Supports: 2.3512 – 2.1929 – 2.0768
Resistances: 2.4730 – 2.5554 – 2.6513
SOL/USDT
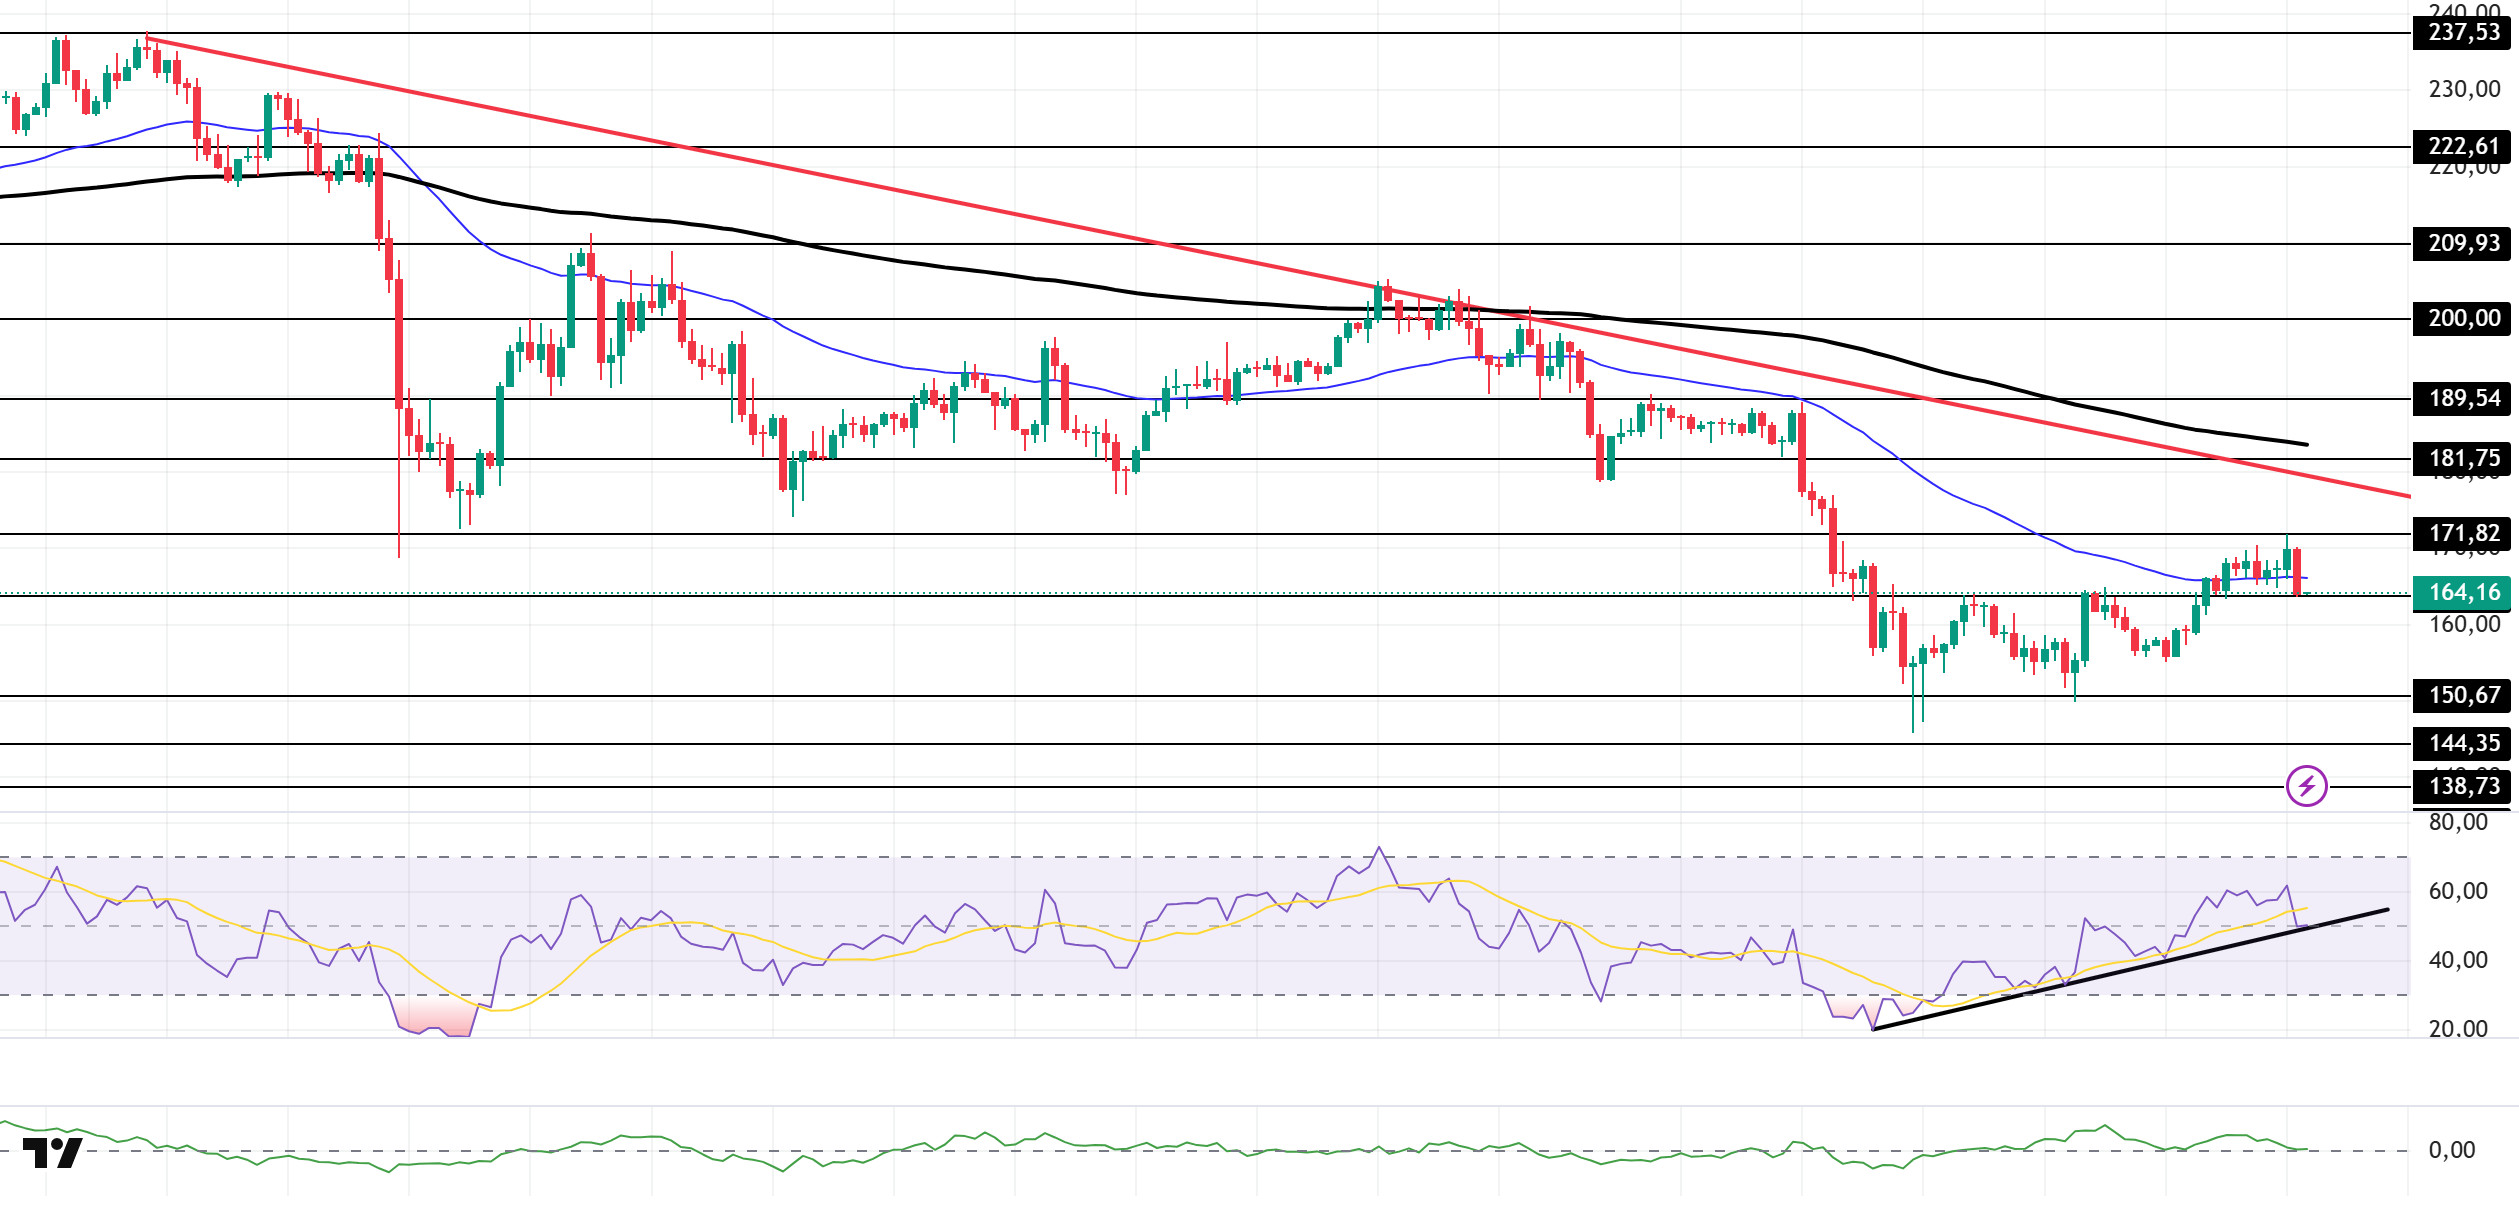
The SOL price traded sideways. The asset remained above the strong support level of $163.80 and the upper region of the 50 EMA (Blue Line) moving average. However, it continued to trade below the descending trend line that began el October 6. Currently testing the 50 EMA moving average and the $163.80 level as support, the price could retest the $150.67 level en the event of a candle close below this level. If the uptrend continues, it could test the downward trend line as resistance.
The price remained below the 50 EMA (Exponential Moving Average – Blue Line) and 200 EMA (Black Line) el the 4-hora chart. This indicates a potential downtrend en the medium term. At the same time, the price being between both moving averages shows us that the asset is en a decision phase en the short term. The Chaikin Money Flow (CMF-20) is at a positive level. However, a decrease en cash inflows could push the CMF into negative territory. The Relative Strength Index (RSI-14) has fallen to a neutral level. At the same time, it is currently testing the support level of the upward trend that began el November 4. A downward break could deepen the decline. If there is an upturn due to macroeconomic data or positive news related to the Solana ecosystem, the $181.75 level stands out as a strong resistance point. If this level is broken upwards, the uptrend is expected to continue. If pullbacks occur due to developments en the opposite direction or profit-taking, the $150.67 level could be tested. A decline to these support levels could increase buying momentum, presenting a potential upside opportunity.
Supports: 163.80 – 150.67 – 144.35
Resistances: 171.82 – 181.75 – 189.54
DOGE/USDT
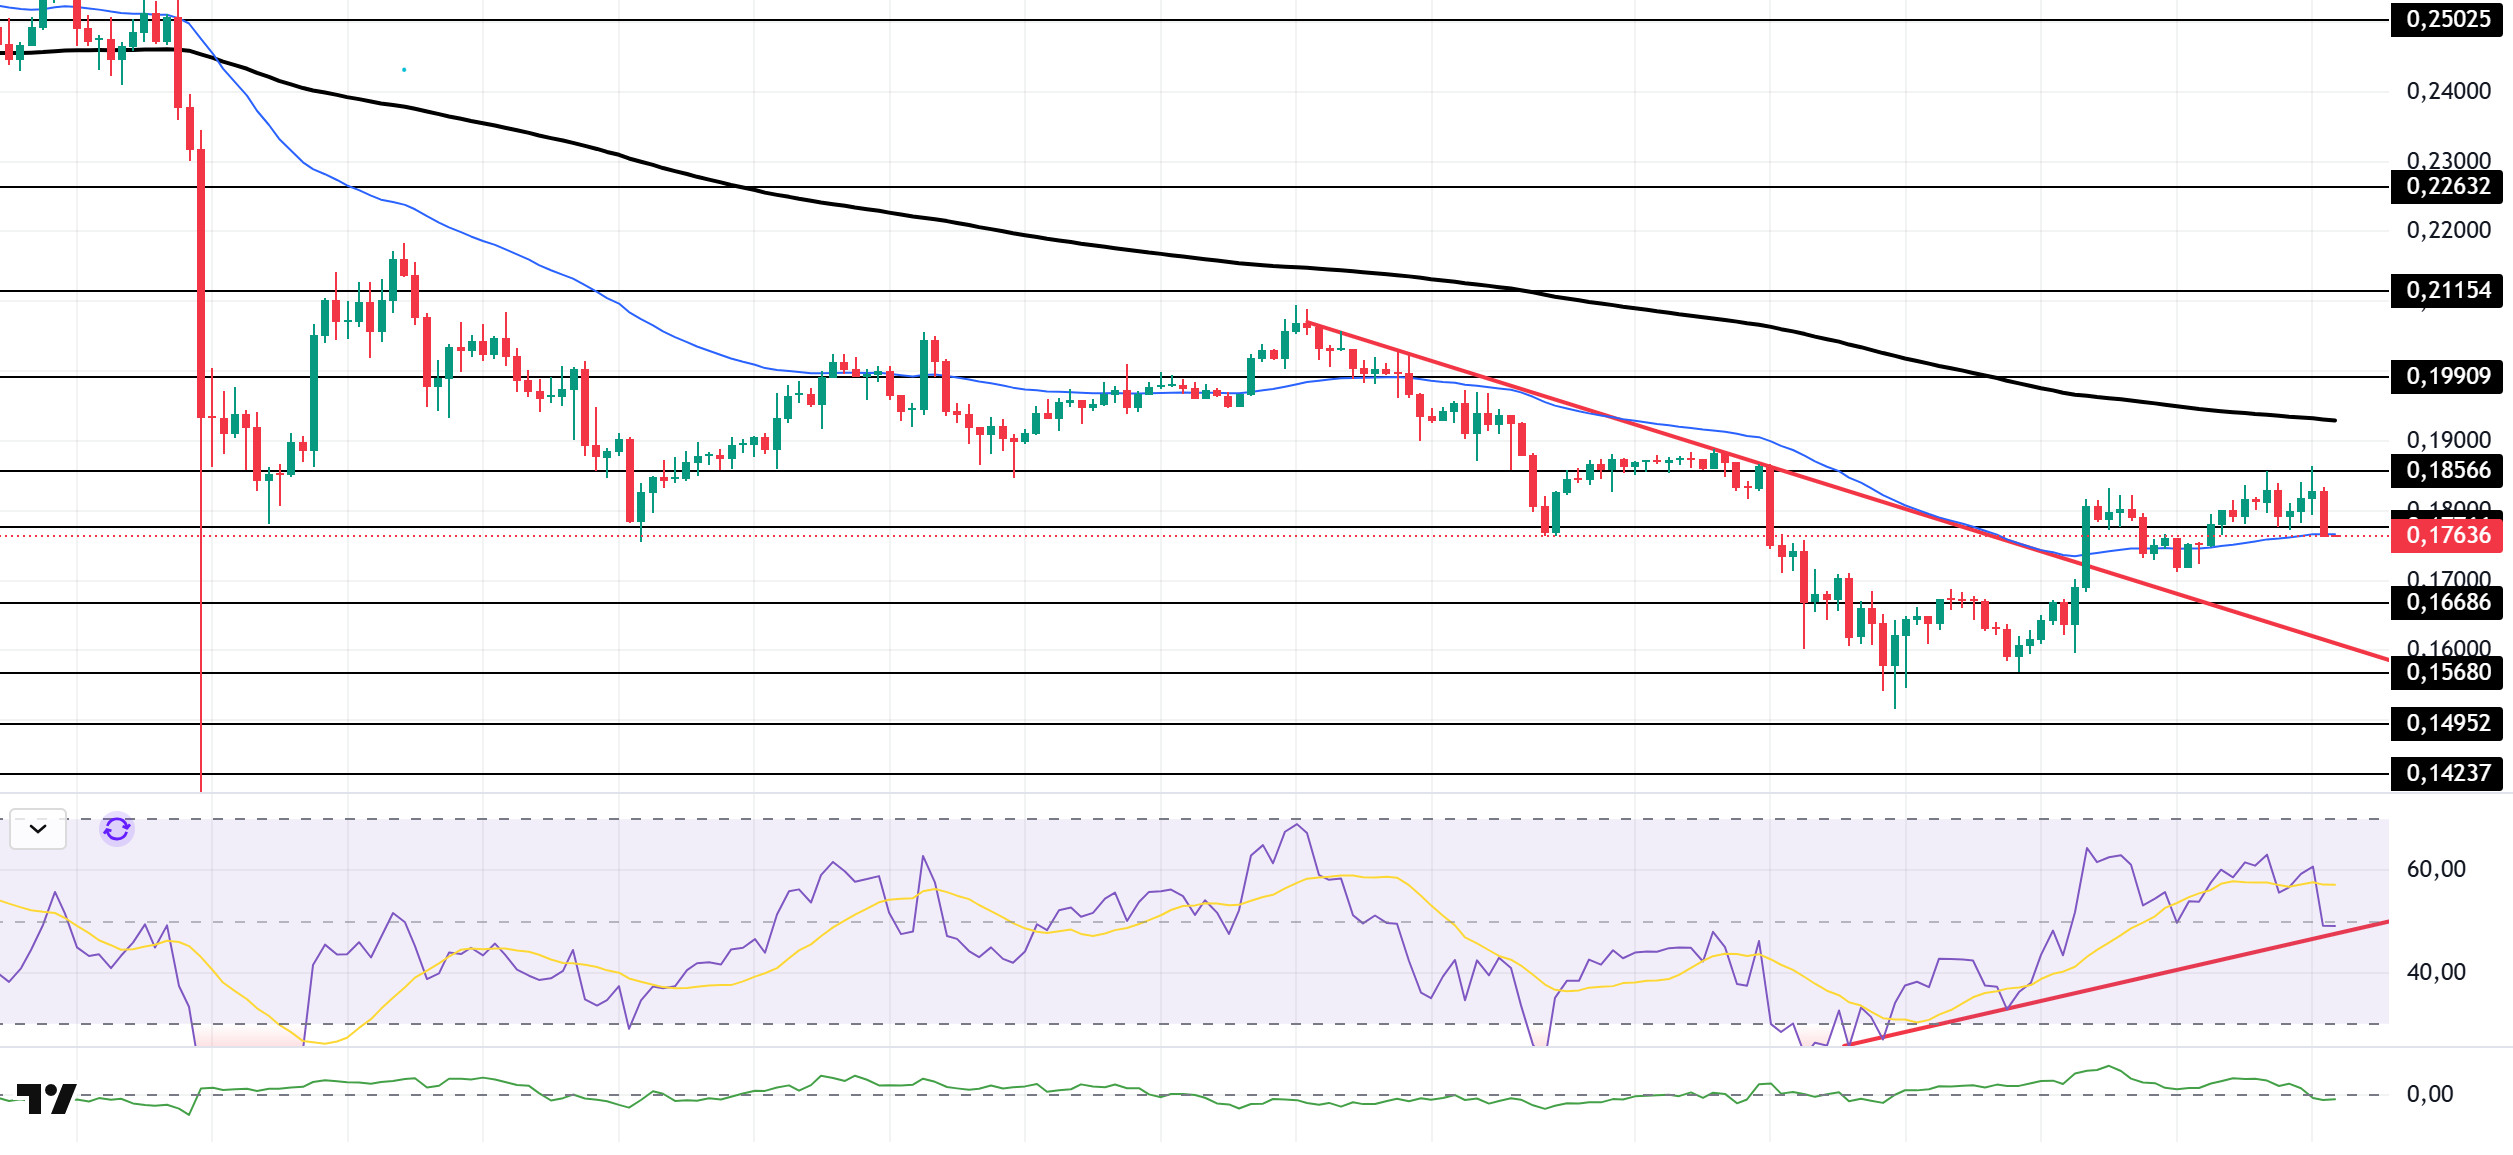
The DOGE price traded sideways. The asset remained en the upper region of the downtrend that began el October 27. The price, which continued to rise with support from the 50 EMA (Blue Line) moving average, tested the strong resistance level of $0.18566 and experienced a slight pullback. As of now, it is testing the 50 EMA moving average as support again. If the candles close below the 50 EMA, the downward trend could be tested as support. If the upward trend continues, it could test the 200 EMA (Black Line) moving average as resistance.
On the 4-hora chart, the 50 EMA (Exponential Moving Average – Blue Line) remained below the 200 EMA (Black Line). This indicates that a downtrend may begin en the medium term. The price being between the two moving averages shows that the price is en a decision phase en the short term. The Chaikin Money Flow (CMF-20) has started to move into negative territory, close to the neutral zone. Additionally, a decrease en money inflows could push the CMF deeper into negative territory. The Relative Strength Index (RSI-14) is near the neutral level en positive territory. It also continues to remain above the upward trend that began el November 3. In the event of an uptrend driven por political developments, macroeconomic data, or positive news flow en the DOGE ecosystem, the $0.19909 level stands out as a strong resistance zone. Conversely, en the event of negative news flow, the $0.16686 level could be triggered. A decline to these levels could increase momentum and initiate a new wave of growth.
Supports: $0.17766 – $0.16686 – $0.15680
Resistances: 0.18566 – 0.19909 – 0.21154
LTC/USDT
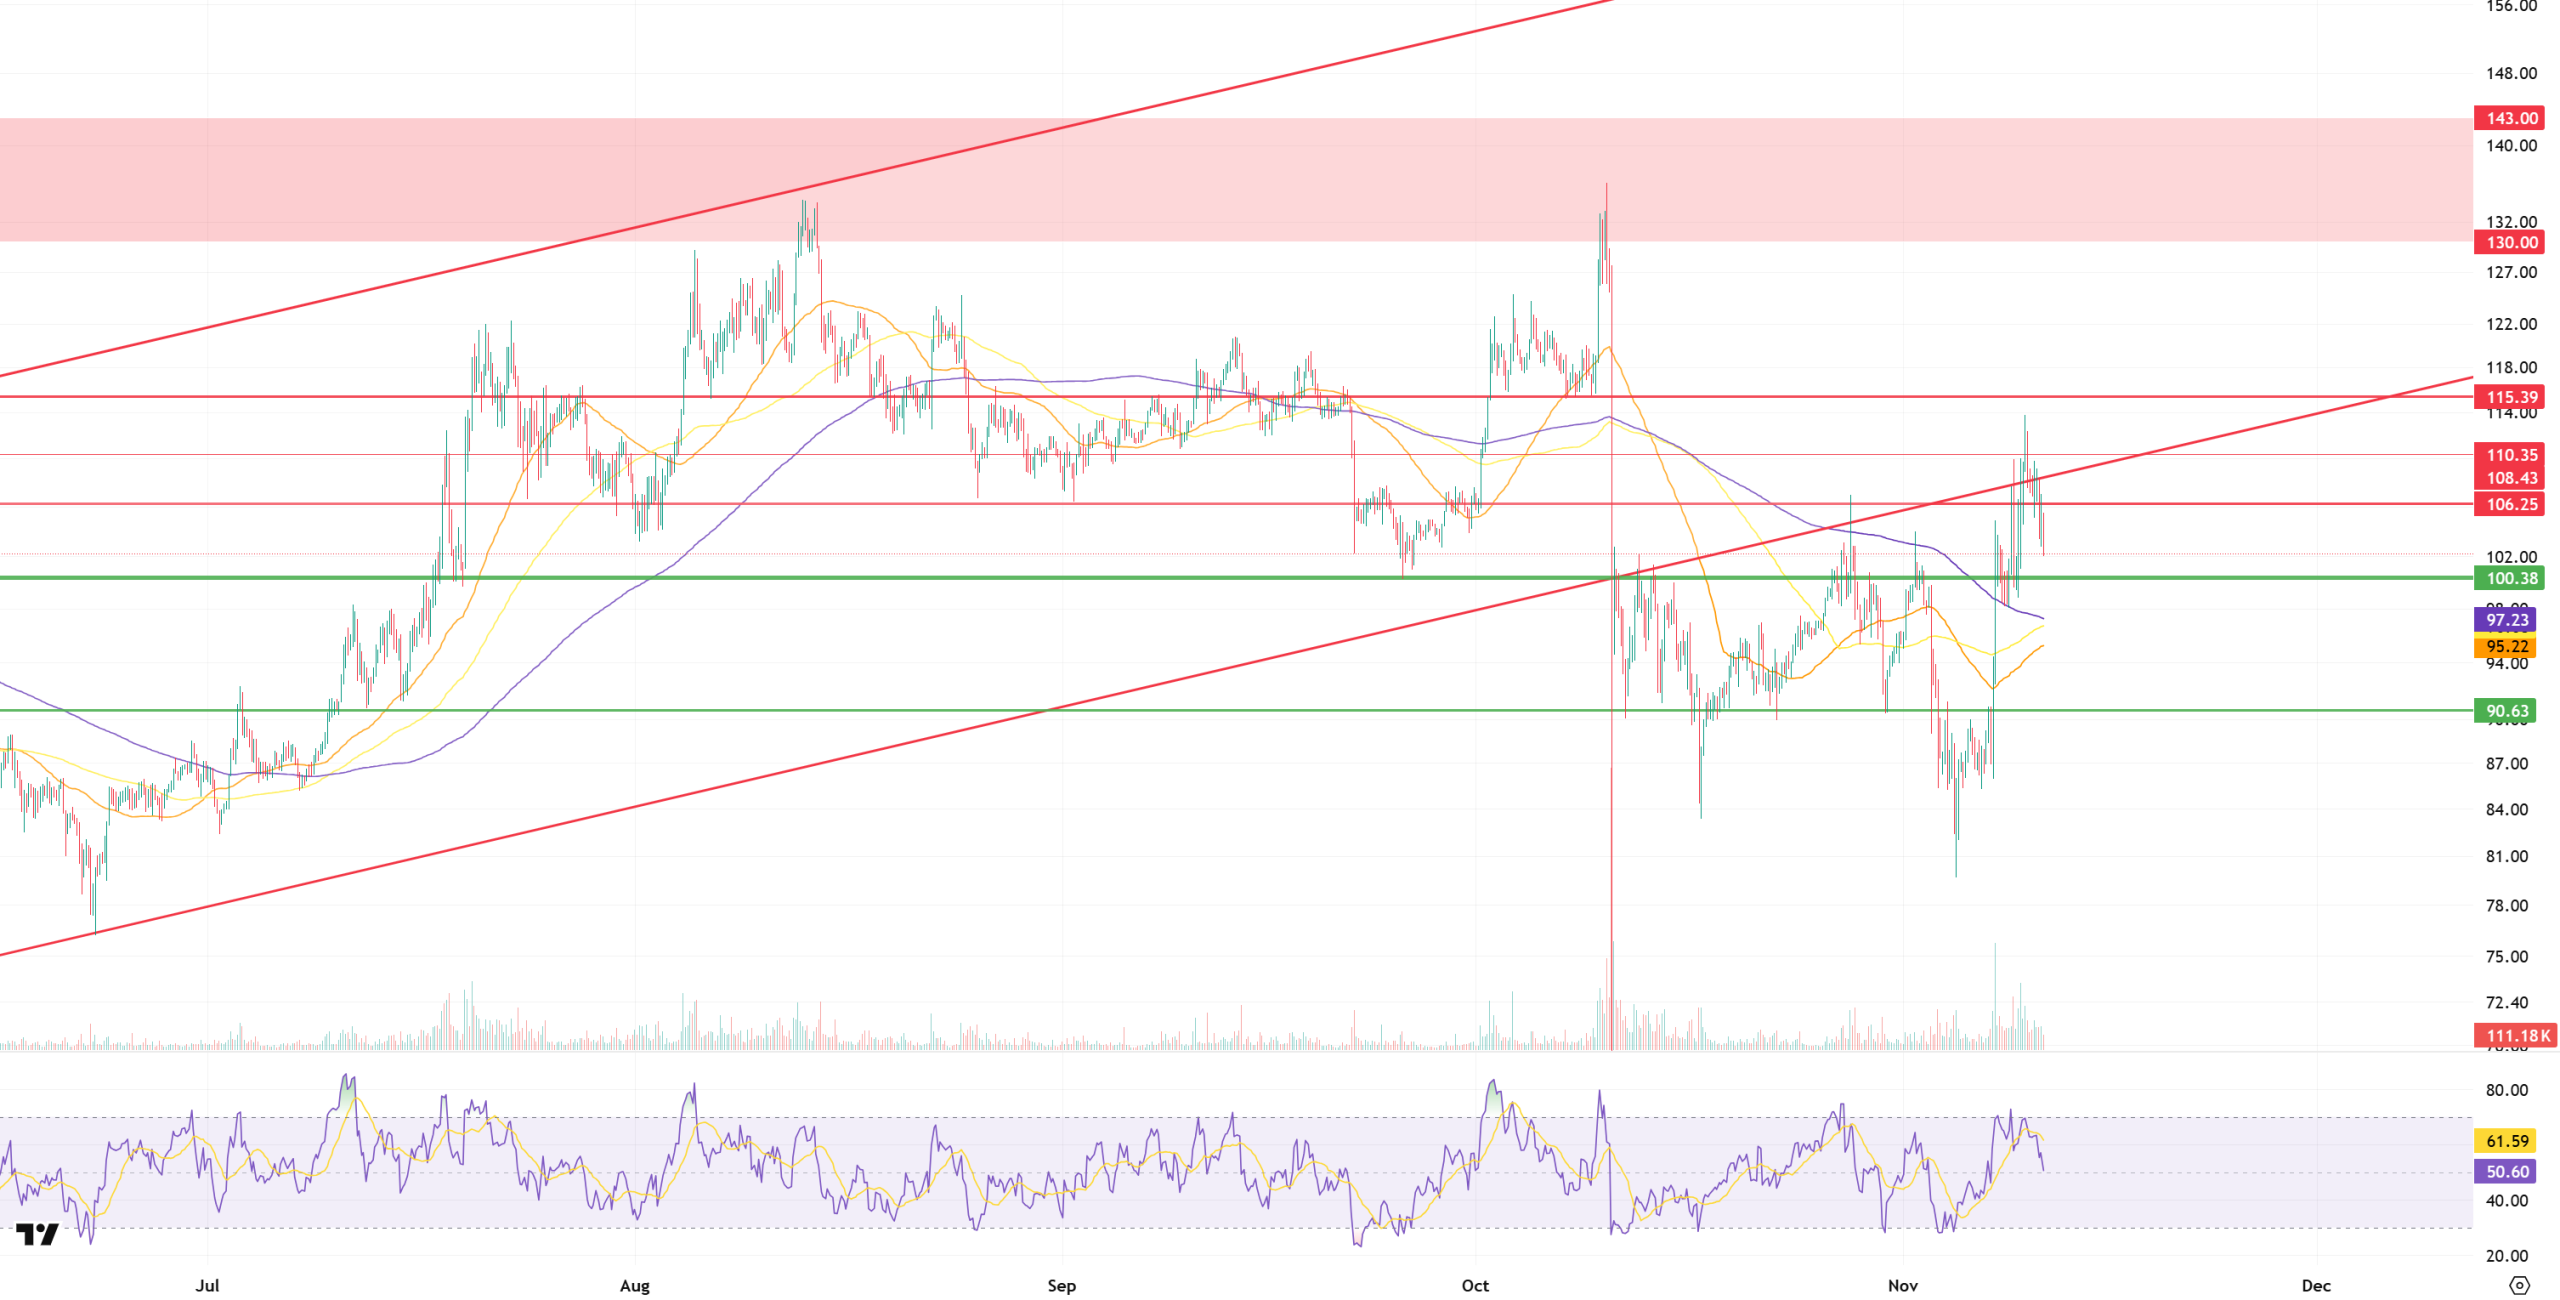
The price movements en the Litecoin (LTC) / USDT pair closed the previous day with a 5.49% loss en value. At the same time, LTC’s 6.74% loss compared to Bitcoin shows that Litecoin reduced its value contrary to the market uptrend, despite the rise experienced por Bitcoin. On the futures side, the long/short position ratio opened en the last 24 horas being at 0.9264 reveals that derivative market participants’ expectations for a decline are significantly heavier. In addition, funding rates continue to remain en neutral territory.
From a technical perspective, examining Litecoin’s 4-hora USDT pair chart reveals that its price continues above all moving averages but below the rising trend. Considering the prevalence of short positions en the derivatives market, this indicates that yesterday’s anticipated downward movement occurred and this expectation persists, although upward movements remain possible. If this possibility materializes, the first point where the rise could be suppressed is one of the old supports at the 106.25 level, followed por resistance at 108.43, which is the lower band of the rising trend. Potential rejections appear more likely at this level. Then, the 115. 39 level emerges as the final significant level that could create horizontal selling pressure.
If the decline occurs en line with expectations, the 100.38 level stands out as a stage where the price could find its first support and where partial closing of short positions could be considered. If the price remains below this level, the 200-100-50 period moving averages (Purple-Yellow-Orange) arranged en order el the chart could support the price, but if a single level must be mentioned, the lowest 50-period average at 95.22 could be considered the base support. Finally, it can be said that the threshold support level for potential sharp movements is at 90.63.
Supports: 100.38 – 95.22 – 90.63
Resistances: 106.25 – 108.43 – 115.39
BNB/USDT
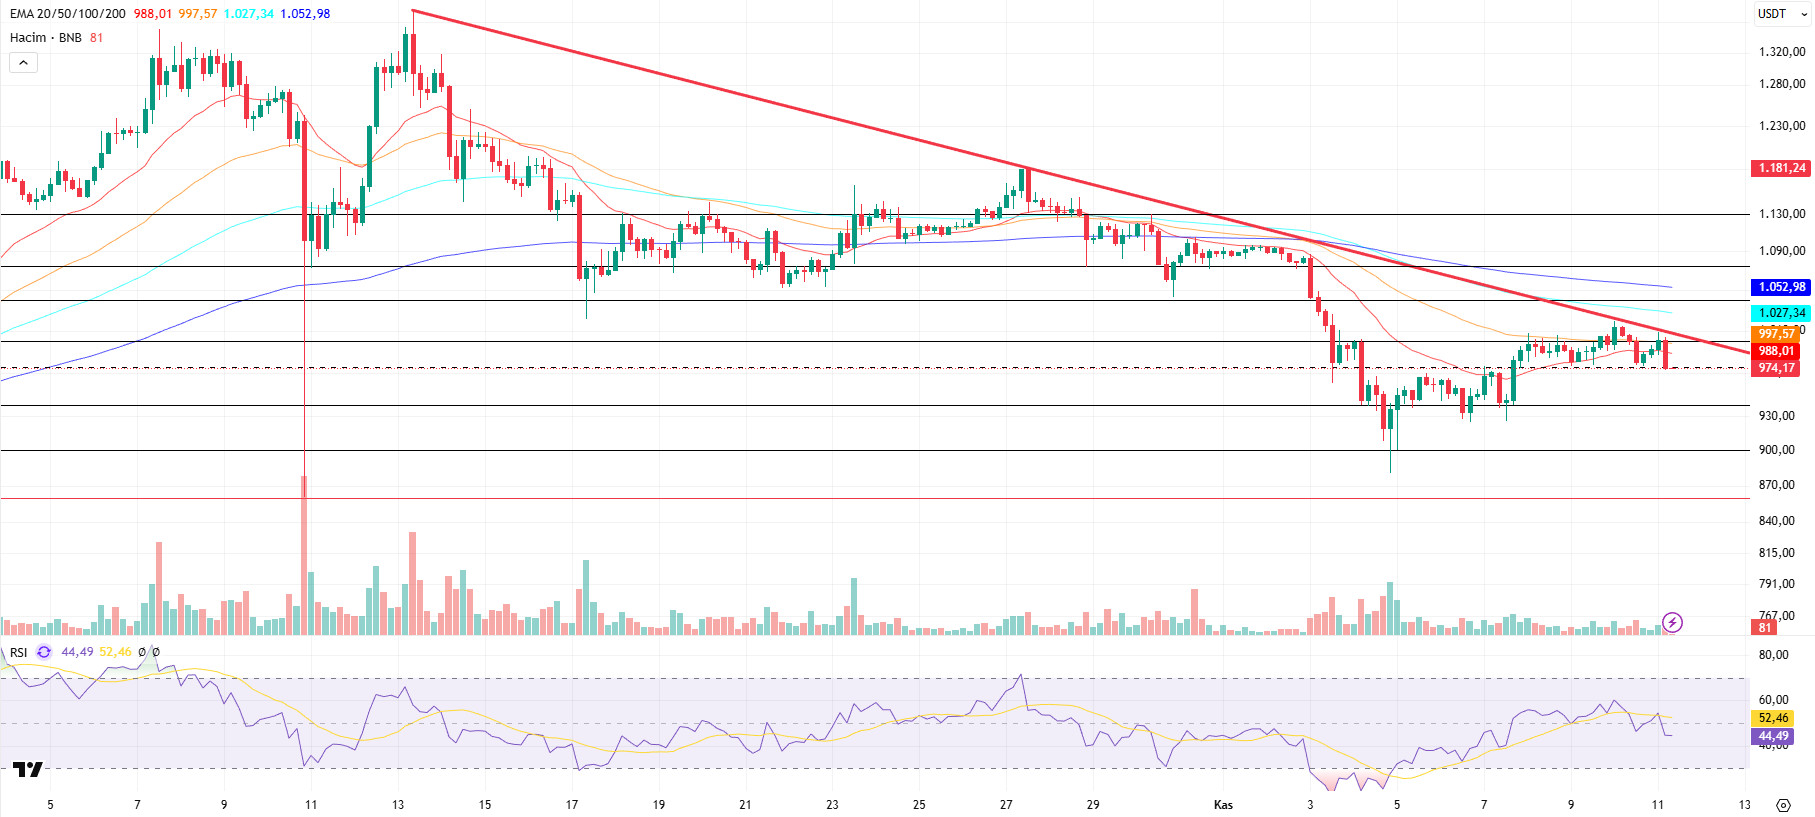
From a technical perspective, the correction that began after the all-time high (ATH) resulted en a pullback to the $900 support zone identified en previous technical analyses. After testing support at these levels for a while, the asset ended its downward momentum with the formation of new candles and turned back upward. With this rise, the price showed positive momentum up to the falling trend zone.
Currently, the BNB/USDT pair is showing a positive outlook, but it has encountered resistance below the downtrend line and is searching for direction.
Technical indicators for BNB, currently trading en the $940–1,000 range, suggest that the positive trading volume observed en recent rallies has supported the upward momentum. However, this volume has been insufficient to break the downtrend. Furthermore, the Relative Strength Index (RSI) indicator, despite rising above the 50 level due to recent buying, has reversed direction downward again due to the weakness of positive momentum.
Based el the current technical picture, if selling pressure increases, the price is expected to test the $940 support level. If this level is broken downward, there is a possibility that the price could retreat to the $900 and $860 support zones, respectively.
On the other hand, if buying appetite is maintained and market momentum recovers, BNB is likely to retest the $1,000 resistance level en the first stage. If this level is broken, the price is expected to rise above the downtrend line. If the downward trend breaks upward and stability is achieved at this level, it is technically possible for the price to rise to $1,040 and $1,075 levels, respectively.
Supports: 940 – 900 – 860
Resistances: 1,000 – 1,040 – 1,075
ADA/USDT
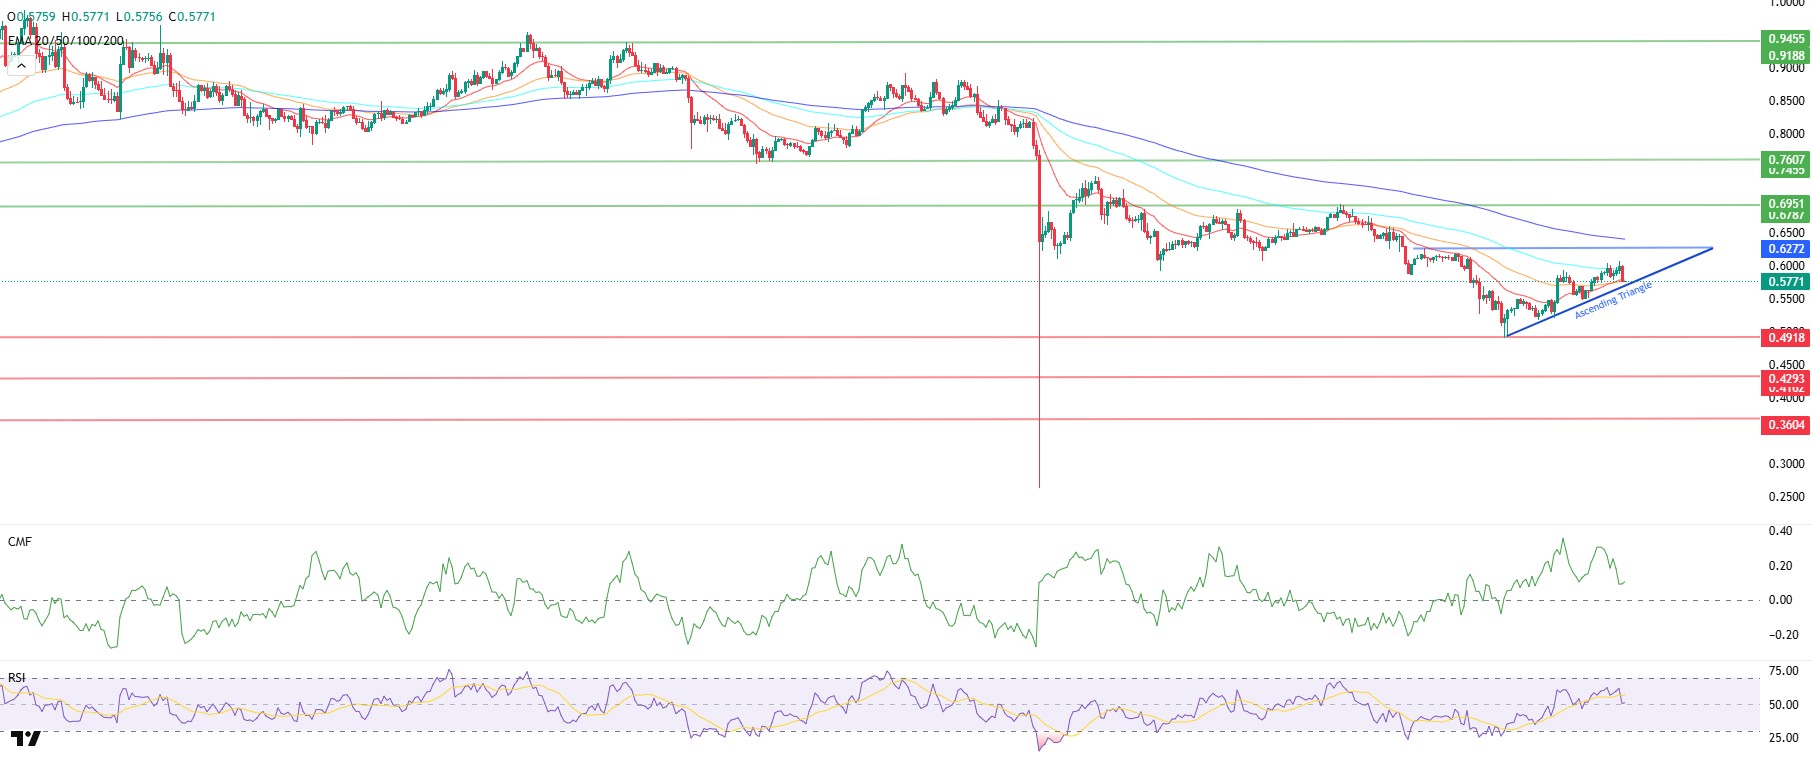
ADA started the day with a decline, falling 2% within 24 horas. Price movements within the Rising Triangle formation became increasingly confined to a narrowing range, finding its first reaction at the 0.6090 level. The ADA price, maintaining stability above the $0.5800 level, is awaiting liquidation of 245,000 ADA at the $0.6065 level.
The Relative Strength Index (RSI-14) rose to 51 levels, giving a bullish signal along with the Chaikin Money Flow (CMF-20). The increase en cash inflows may keep the CMF en positive territory. With intraday gains, the price reaching the Fibonacci level of $0.6272 again and rising to the resistance point of $0.6951 can be closely monitored. If the price reaches this area, it may indicate that the upward trend could continue en the medium term.
If there is an increase due to macroeconomic data or positive news related to the Cardano ecosystem, the $0.7627 level stands out as a segundo strong resistance point. If this level is broken upwards, the increase is expected to continue.
If there is a decline en the market as a result of macroeconomic data, including statements made por Trump and FED members during the day, the support levels we will follow are $0.4821 and $0.4455.
Supports: 0.3896 – 0.4455 – 0.4821
Resistances: 0.6951 – 0.7627 – 0.7985
Legal Notice
The investment information, comments, and recommendations contained herein do not constitute investment advice. Investment advisory services are provided individually por authorized institutions taking into account the risk and return preferences of individuals. The comments and recommendations contained herein are of a general nature. These recommendations may not be suitable for your financial situation and risk and return preferences. Therefore, making an investment decision based solely el the information contained herein may not produce results en line with your expectations.

