
BTC/USDT
While the risk of a government shutdown decreased with the temporary budget agreement en the US, escalating military rhetoric between the US and Iran en the Middle East increased regional risk perception. On the corporate front, Apple’s better-than-expected financial results provided positive divergence, while Trump’s steps to increase pressure through trade and customs duties kept concerns about global trade balances alive. The strategic rapprochement between China and the UK drew attention, while the emergence of Warsh’s name among the possible candidates for the Fed chairmanship created a contradiction with his previous hawkish stance.
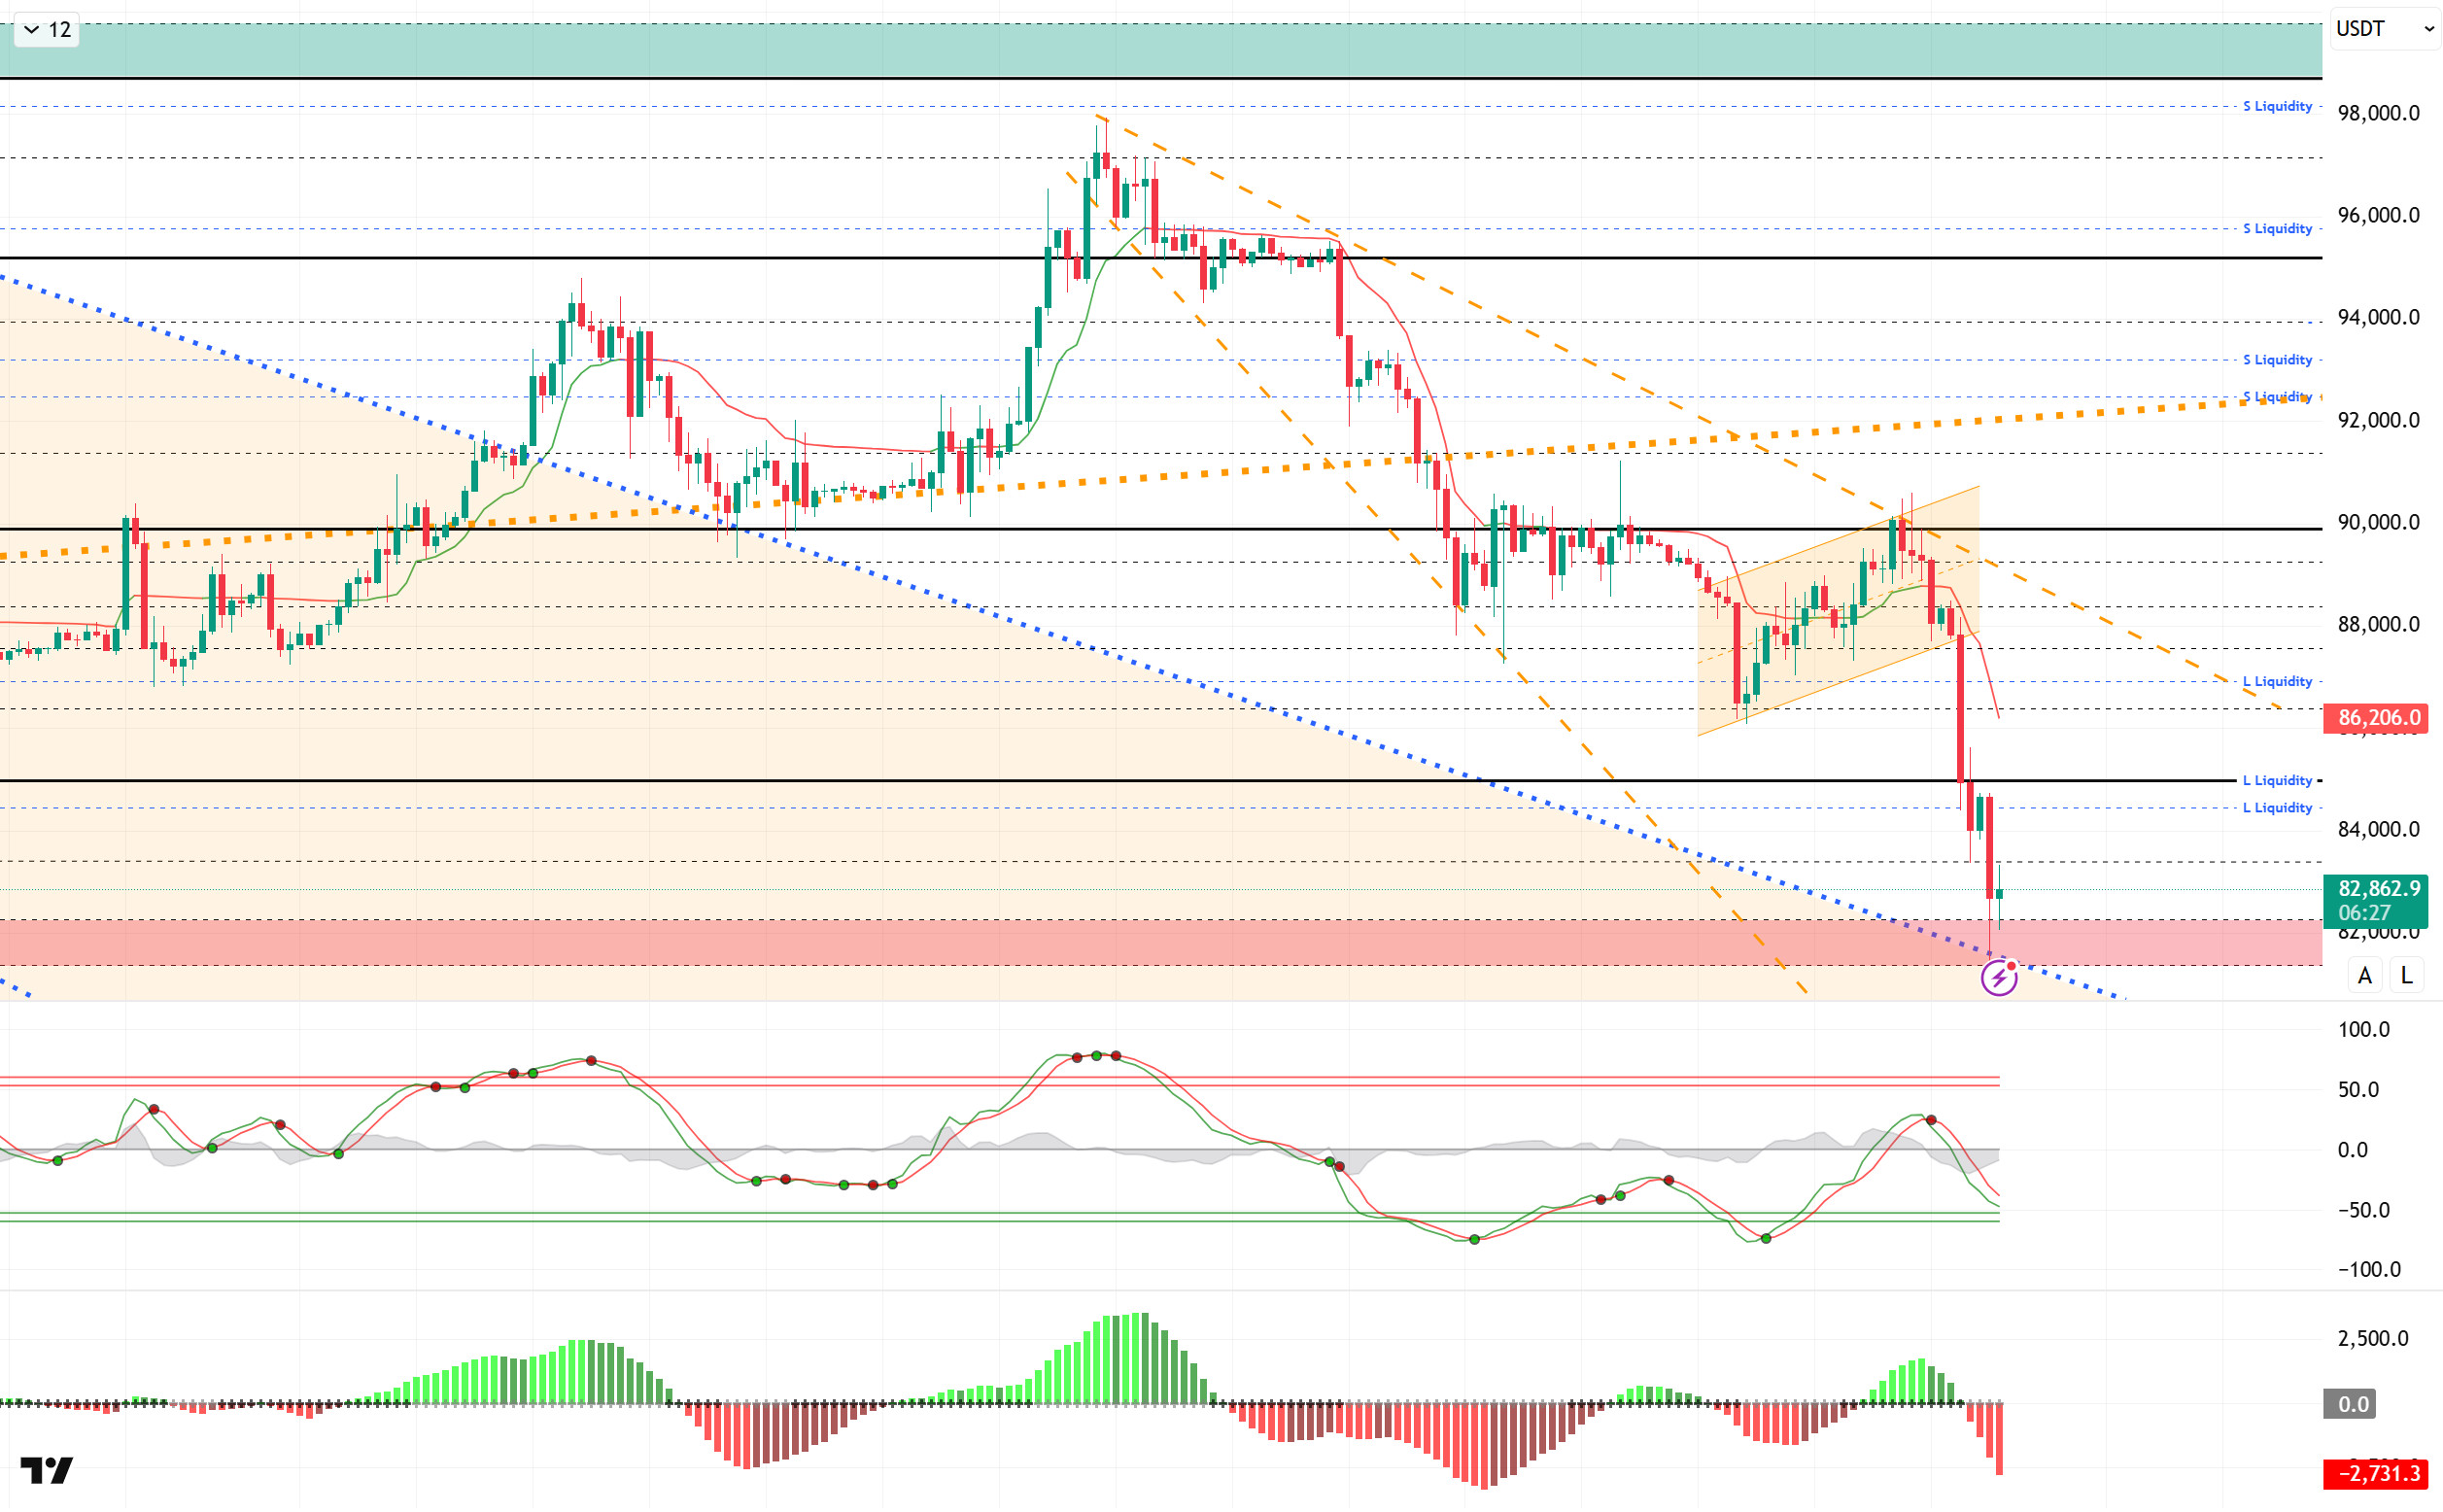
From a technical perspective, BTC fell to the 81,000 level for the first time since November 21 following yesterday’s sharp sell-off. Having previously tested this level, the price carried the momentum gained here to the 98,000 level. Retesting this level, the price formed a double bottom while creating depth within the descending wedge. Having lost the reference levels of 95,000, 90,000, and 85,000 since its last peak, BTC is now approaching the critical reference level of 80,000. It is crucial that this level is not lost en the next phase. At the time of writing, BTC is experiencing a weak rebound at the 82,600 level, and the filling of the spike at the 81,000 level later en the day will be monitored.
Technical indicators, the Wave Trend (WT) oscillator maintained its sell signal and moved into the oversold zone. The histogram el the Squeeze Momentum (SM) indicator is gaining momentum within the negative zone. The Kaufman Moving Average (KAMA) is currently trading above the price level at $86.075.
When examining liquidation data, the buy levels resulted en complete liquidation en the short and medium term. The sell level, el the other hand, increased its intensity en the short term within the 85,000 – 86,000 band. In the long term, the intensity of positions above the 91,000 level continues.
In summary, while the risk of a government shutdown en the US is decreasing, the possibility of military operations against Iran en the Middle East is increasing. As Trump’s initiatives towards Cuba continue, Chinese President Xi held extensive talks with British Prime Minister Starmer. Trump is expected to make an announcement today regarding the Fed chairmanship.Looking at liquidity data, the recent decline has completely cleared the buying levels en the short and medium term, while the selling level has increased en intensity. In technical terms, BTC started the new year with positive momentum, but after testing the 98,000 level, it entered a new selling pressure with profit-taking at , falling back to the 81,000 level. Having lost its minor upward trend and reference points, the price has reached a decision point within a critical band. Previously gathering demand from this point, the price gained upward momentum and approached six-digit levels. If it repeats the same scenario this time, the price could complete a double bottom movement. In this context, while monitoring the breakout of the 85,000 reference area, the 81,000 level followed por the 80,000 level will be critical reference points to watch if selling pressure continues.
Supports: 81,000 – 80,000 – 78,000
Resistances: 83,300 – 84,000 – 85,000
ETH/USDT
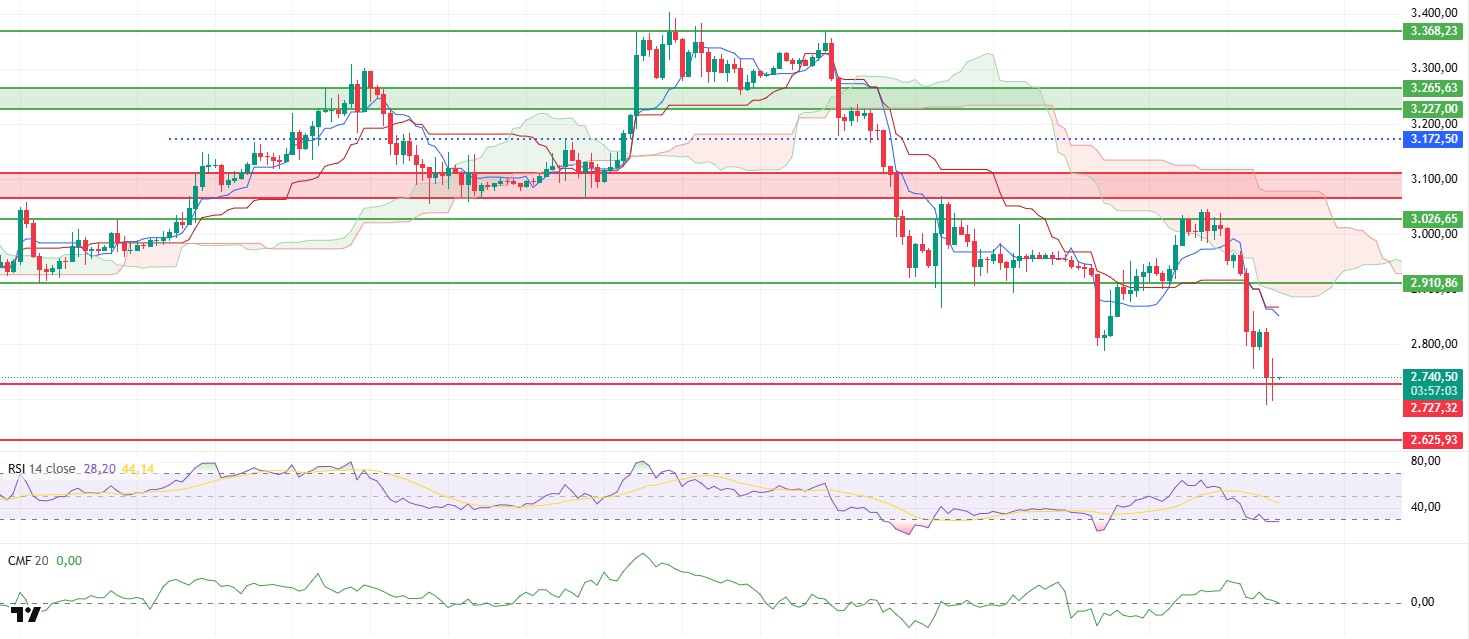
The selling pressure el the ETH price deepened as expected during the day, and after testing the $2,910 support level en the evening, the decline accelerated with the downward break of this region. With the sharp sell-off, the price dropped below the next major support level of $2,727. Currently, the price is attempting to hold en this region, but the technical structure indicates that the market has not yet established a strong foundation for recovery. The current pricing signals a process where buyers are attempting to defend around the critical support level, but the risk has not yet been completely eliminated.
Weakness is also becoming apparent el the liquidity side. The Chaikin Money Flow (CMF) has fallen sharply to the zero line. This movement indicates that the amount of money entering the market has decreased significantly and liquidity outflows have accelerated. It seems difficult for the price to produce a sustained rise without a strong recovery el the liquidity side.
The momentum picture has weakened further. The Relative Strength Index (RSI) has fallen into oversold territory, indicating that selling pressure has intensified significantly and momentum has weakened considerably. While these levels would normally increase the likelihood of a rebound, there is no clear sign of recovery en the indicator at this stage.
The technical outlook is also distinctly negative from the Ichimoku indicator perspective. The price has fallen below the kumo cloud, and the loss of both the Tenkan and Kijun levels indicates that technical pressure remains strong. This structure suggests that upward attempts may encounter selling pressure again at resistance levels.
In the overall picture, the critical threshold now stands out as the $2,727 support zone. If prices remain below this level, selling pressure is expected to continue, pushing the price towards the $2,625 level. Conversely, if prices manage to hold above $2,727, it is possible that the price will rebound towards the $2,910 level. At this stage, the market’s direction remains dependent el the reaction at this support zone.
Supports: 2,727 – 2,625 – 2,470
Resistances: 2,910 – 3,026 – 3,111
XRP/USDT
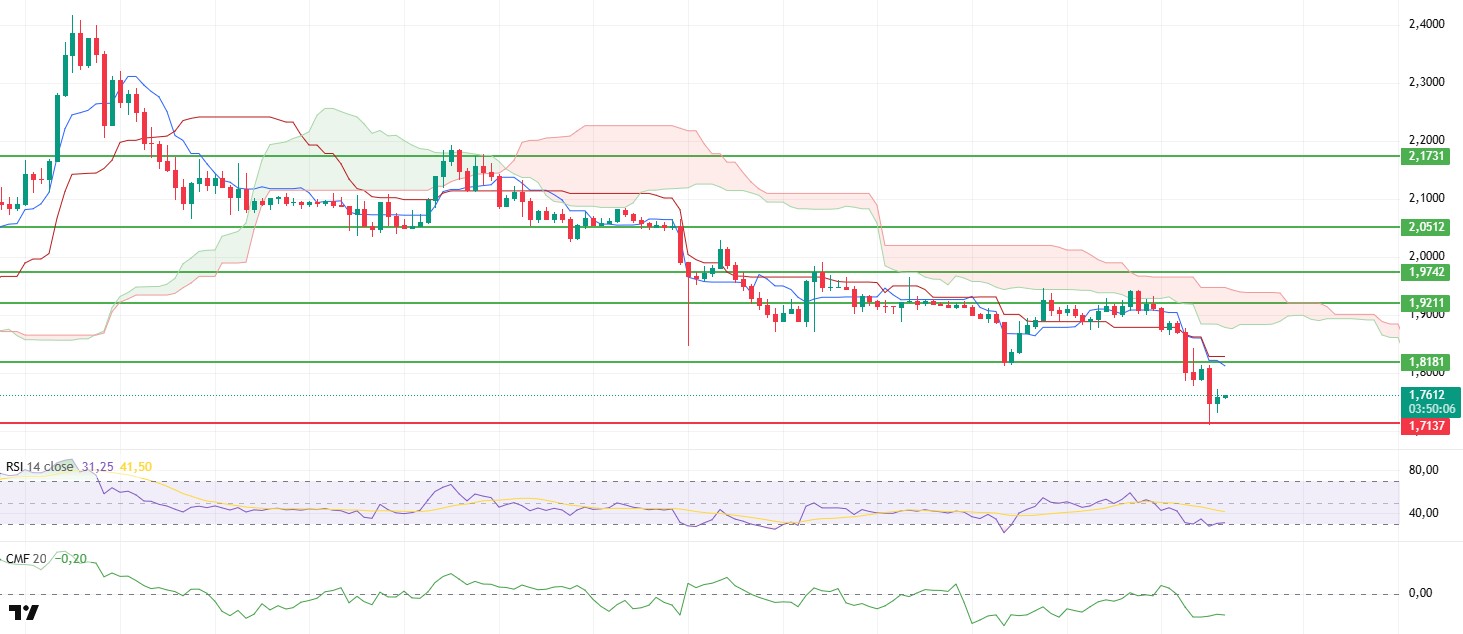
The weak trend en the XRP price during the day intensified en the evening horas, and selling pressure accelerated with the downward break of the $1.81 support zone. Following this break, the decline deepened, pushing the price down to the next support area at $1.71. The price rebounded from this area to around $1.76 el buying interest, but the overall picture shows that buyers have yet to establish strong control.
The liquidity picture has deteriorated significantly. The Chaikin Money Flow (CMF) has fallen sharply into negative territory, indicating accelerated outflows from the market. This suggests that the selling is not only technical but also liquidity-driven, and that the buying side remains weak for now. Without a recovery en liquidity, sustained gains appear unlikely.
Pressure el the momentum front has increased further. The Relative Strength Index (RSI) has fallen to oversold territory, indicating that selling pressure is quite strong and momentum has weakened significantly. While these levels increase the likelihood of a short-term rebound, the indicator has not yet shown any strong signs of recovery.
The technical outlook remains quite weak from the Ichimoku indicator perspective. The price remaining below the Tenkan and Kijun levels and the loss of the kumo cloud indicate that technical pressure will continue en the short term. This structure suggests that upward attempts may encounter renewed selling at resistance levels.
In the overall assessment, the main threshold is now back at the $1.81 level. As long as the price remains below this region, downward risk is expected to continue and lower supports may be retested . Conversely, if the $1.81 level is regained, selling pressure may weaken and the price may be able to continue its upward recovery attempts. At this stage, the market is still under pressure, and the direction appears to depend el the reaction at the support zone.
Supports: 1.7137 – 1.6224 – 1.4119
Resistances: 1.8181 – 1.9211 – 1.9742
SOL/USDT
21Shares launched a JitoSOL-based Solana staking ETP en Europe.
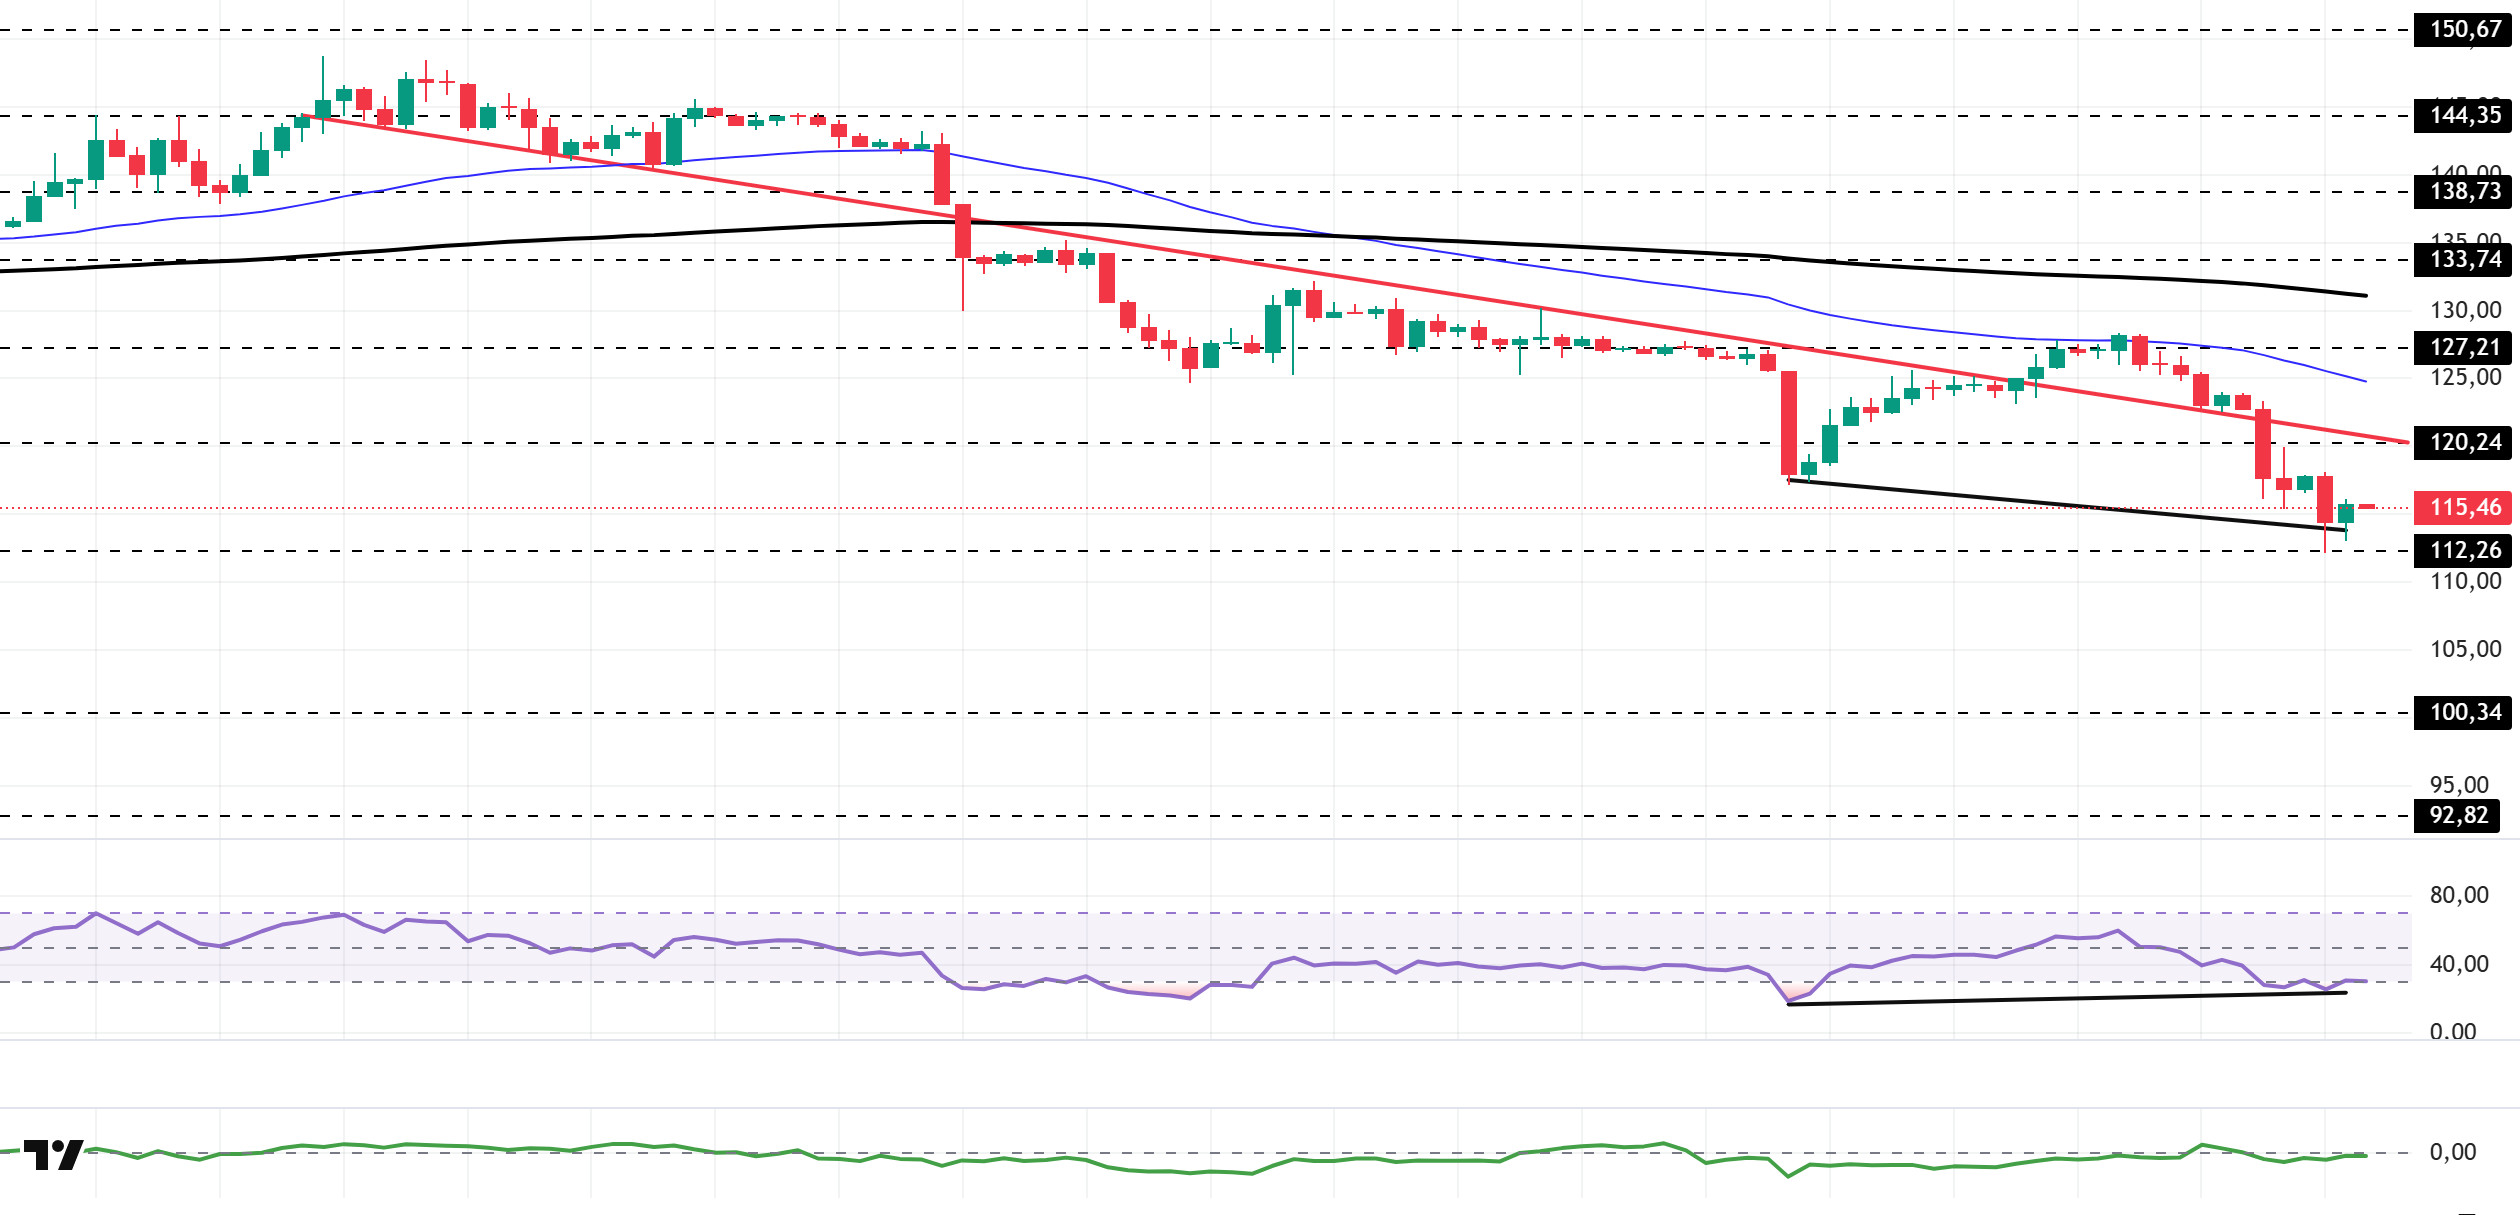
The SOL price experienced a pullback. The asset moved into the lower region of the downtrend that began el January 13, signaling selling pressure. Testing the strong resistance level of $127.21 and the 50 EMA (Blue Line) moving average, the asset experienced a pullback from this level and remained en the lower region of the downtrend. Currently testing the $112.26 level as support, the price could test the $100.34 level as support if it breaks below this level. If it gains momentum from here, it could test the downtrend line as resistance.
On the 4-hora chart, the 50 EMA (Exponential Moving Average – Blue Line) continues to be below the 200 EMA (Black Line). This indicates that a downtrend may begin en the medium term. At the same time, the price being below both moving averages shows that the asset is trending downward en the short term. The Chaikin Money Flow (CMF-20) has moved into negative territory. However, the decrease en money inflows could pull the CMF deeper into this zone. The Relative Strength Index (RSI-14) has fallen from the middle of the negative zone to the oversold zone. This could trigger profit-taking, causing the price to rebound from this level. At the same time, positive divergence should be monitored. If there is an uptrend due to macroeconomic data or positive news related to the Solana ecosystem, the $150.67 level stands out as a strong resistance point. If this level is broken upwards, the uptrend is expected to continue. If pullbacks occur due to developments en the opposite direction or profit-taking, the price may test the $100.34 level. A decline to these support levels could increase buying momentum, presenting a potential upside opportunity.
Supports: 112.26 – 100.34 – 92.82
Resistances: 120.24 – 127.21 – 133.74
DOGE/USDT
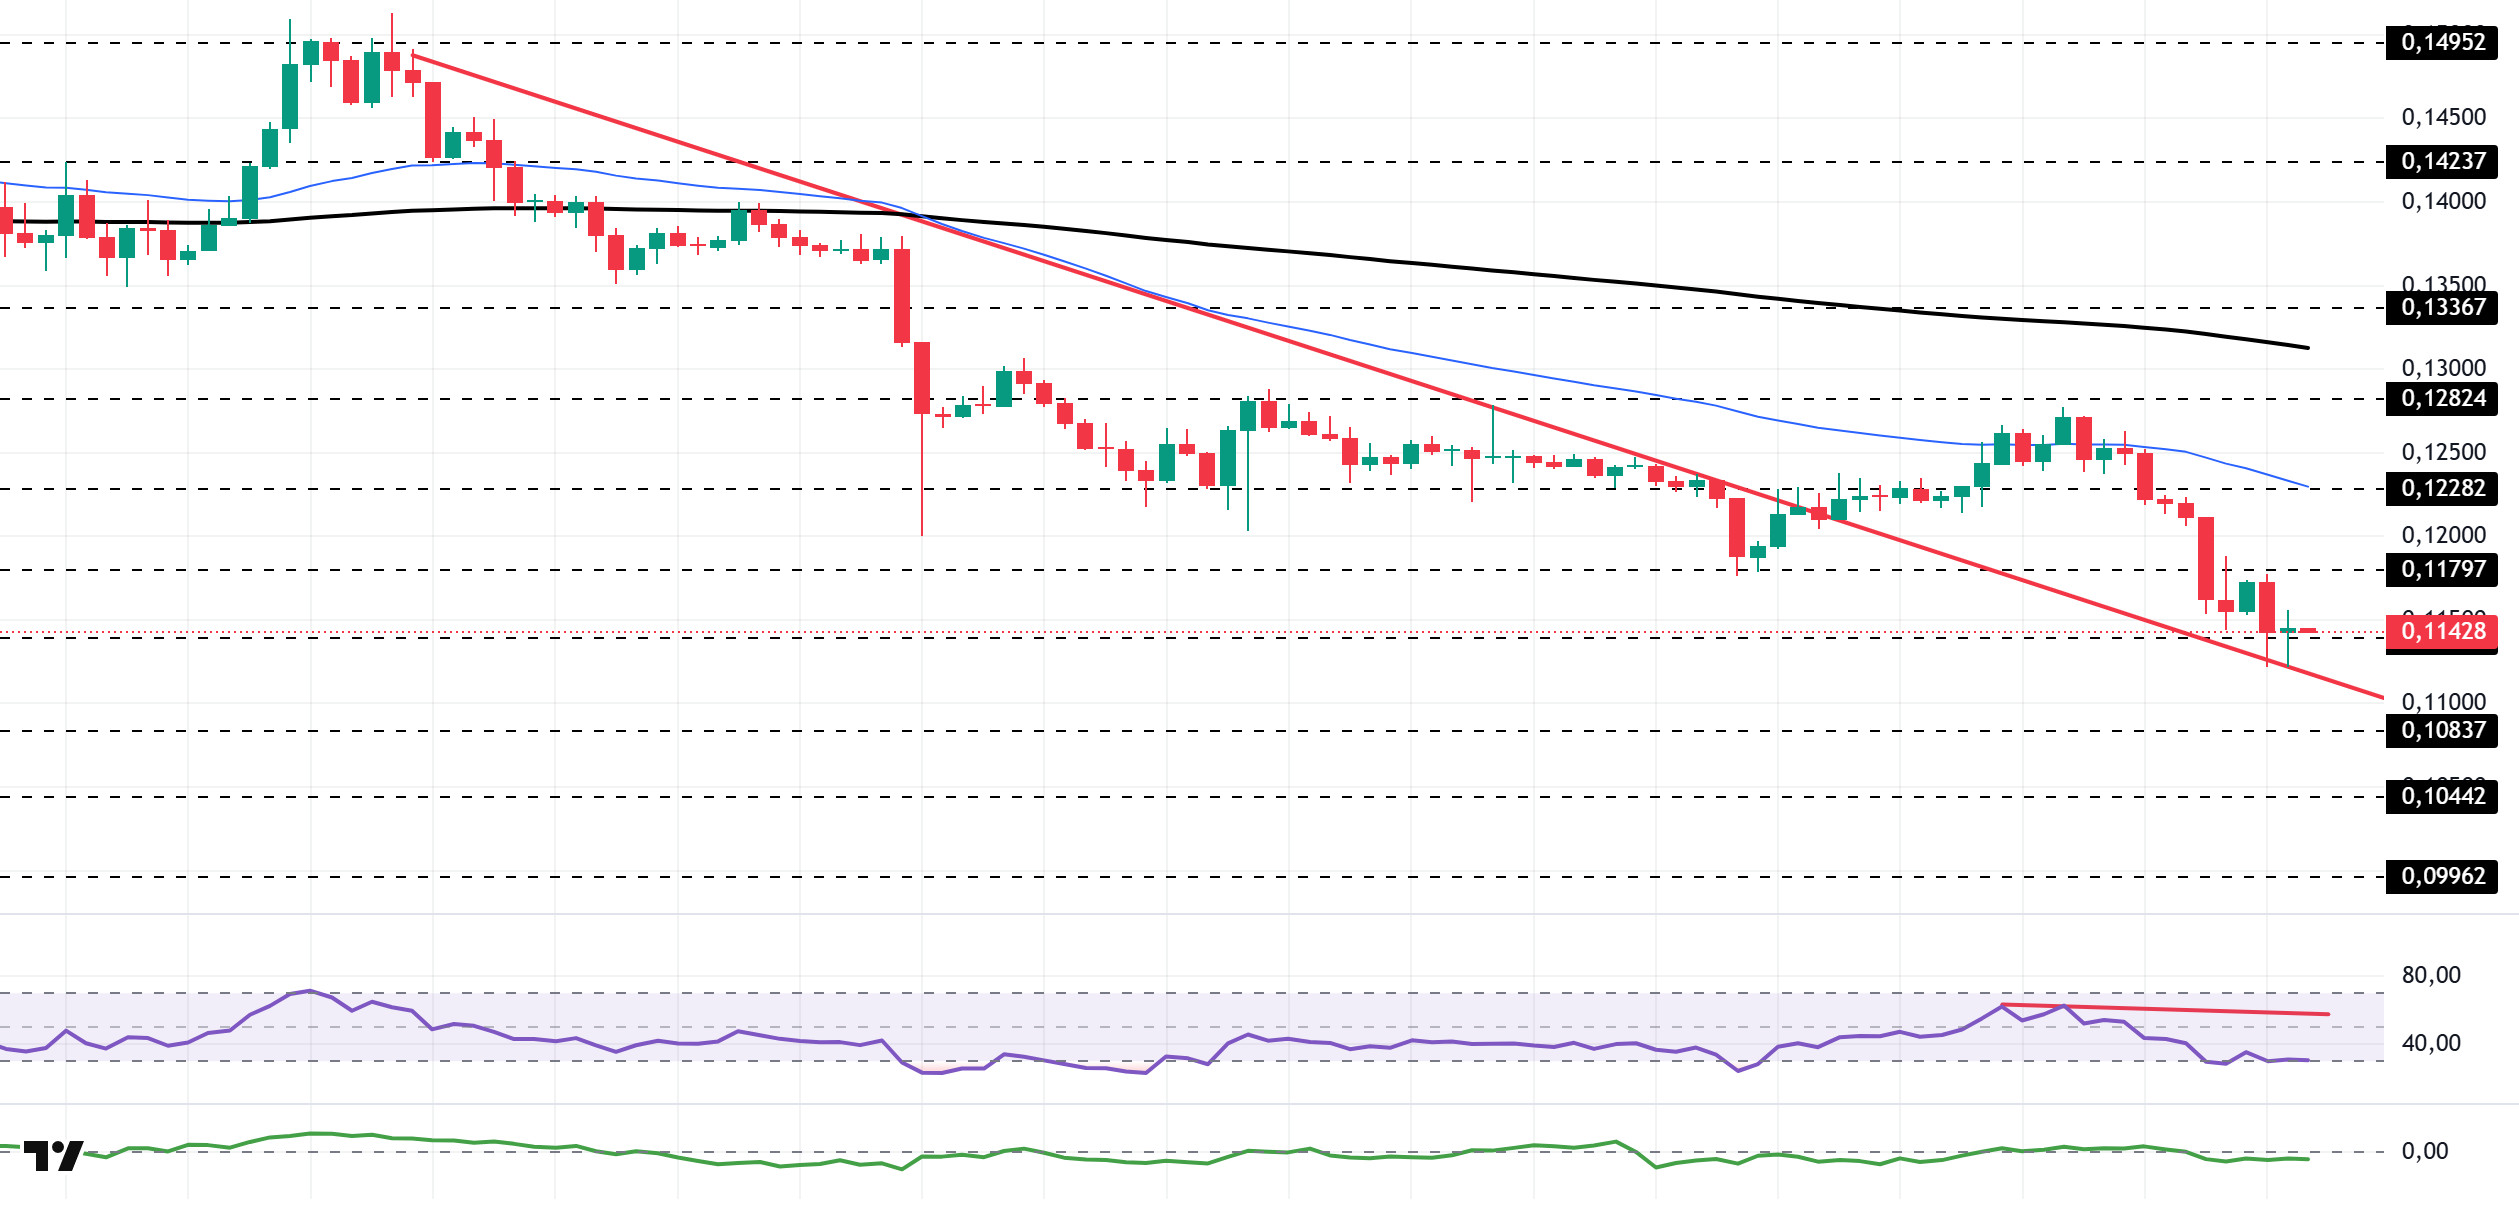
The DOGE price continued to lose value. The asset remained above the downward trend that began el January 14. Testing the strong resistance level of $0.12824, the asset experienced a pullback and failed to maintain its momentum. Currently below the 50 EMA (Blue Line) moving average, the asset is testing the downward trend as a support level. If the candle closes below this level, the $0.10837 level should be monitored as a support level. If it gains momentum, the 50 EMA (Blue Line) moving average can be monitored as a resistance level.
On the 4-hora chart, the 50 EMA (Exponential Moving Average – Blue Line) remained below the 200 EMA (Black Line). This indicated that a medium-term downtrend was forming. The price being below both moving averages indicates that the price may be trending downward en the short term. Chaikin Money Flow (CMF-20) moved into negative territory. Additionally, the decrease en money inflows could pull CMF deeper into negative territory. The Relative Strength Index (RSI-14) retreated from the middle of the negative zone to the oversold zone. This could bring profit-taking and provide upward momentum. At the same time, it remained below the downward trend line that began el January 27, indicating that selling pressure continues. In the event of an uptrend driven por political developments, macroeconomic data, or positive news flow en the DOGE ecosystem, the $0.12824 level stands out as a strong resistance zone. Conversely, en the event of negative news flow, the $0.09962 level could be triggered. A decline to these levels could increase momentum and initiate a new wave of growth.
Supports: 0.10837 – 0.10442 – 0.09962
Resistances: 0.11391 – 0.11797 – 0.12282
TRX/USDT
Tron Inc. announced en a post this morning that it purchased 170,014 TRX at an average price of $0.29, bringing its total holdings to over 678.9 million TRX. The company stated en its announcement that it aims to further increase its Tron holdings to boost share value en the long term.
As of January 29, 2026, the total amount of TRX staked is 46,033,902,706, representing 48.60% of the circulating supply. Compared to the previous day, there has been an increase of approximately 0.03% en the amount staked. Meanwhile, the market value of TRX has reached $27.9 billion. Furthermore, a total of 4,164,554 TRX was burned yesterday, permanently removing 248,842 TRX from the circulating supply. This situation leads to a decrease en inflationary pressure el Tron.
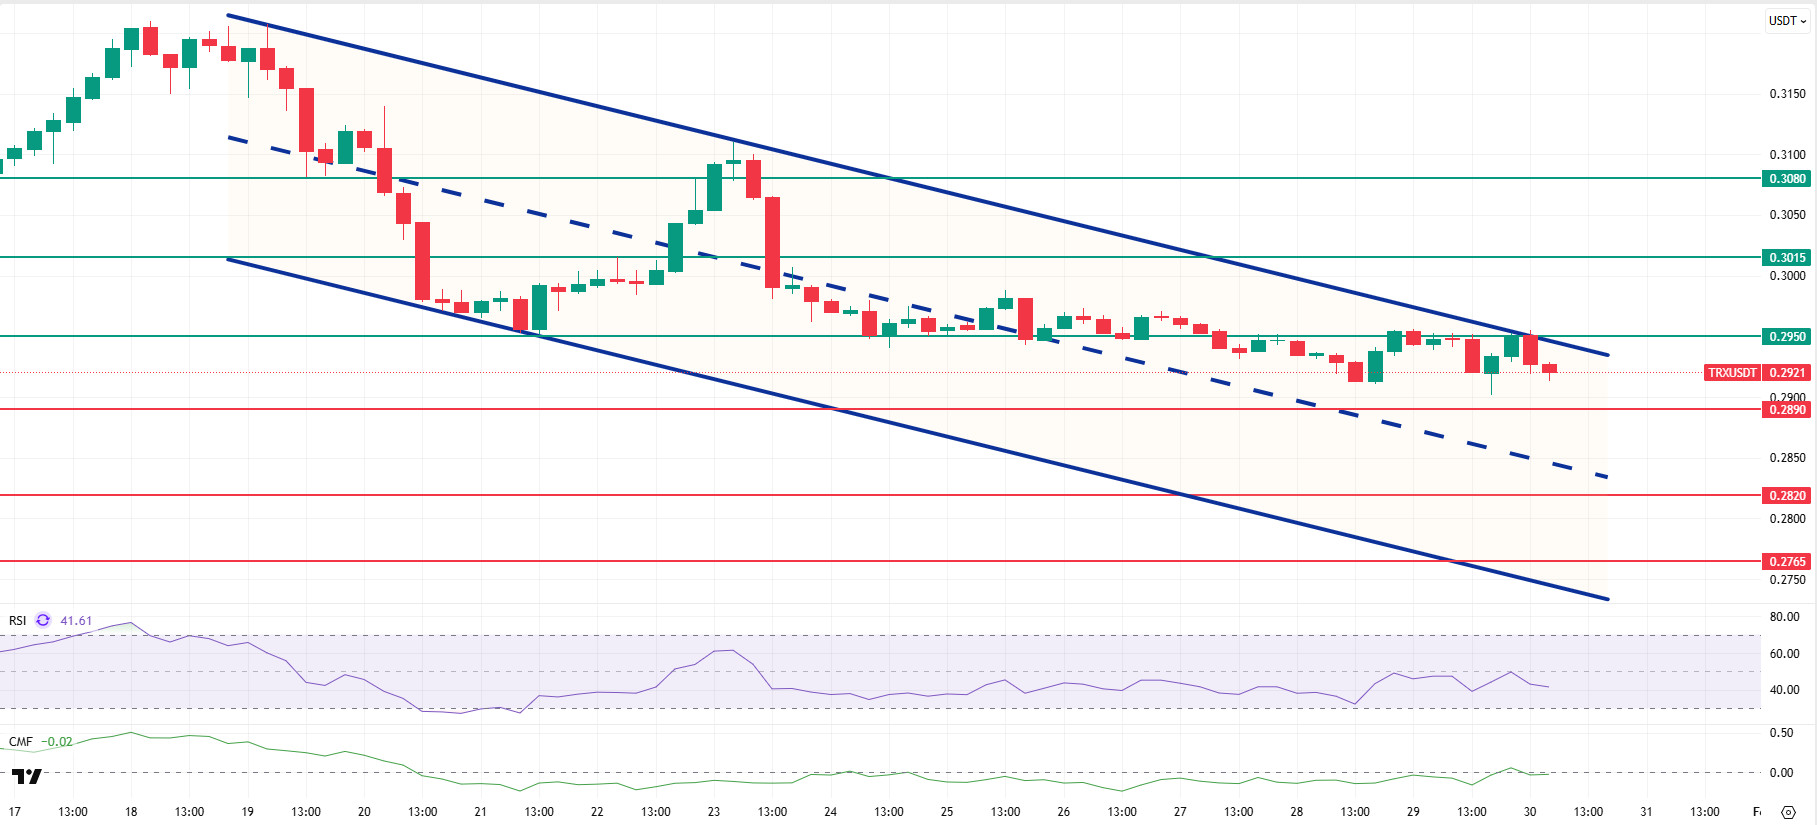
Technically speaking, TRX closed yesterday at 0.2950 after a limited decline en the evening, retreated a little more en the morning horas, and is currently trading at 0.2921. Currently en the upper band of the bearish channel, TRX is priced below the 0.2950 resistance el the 4-hora chart. The Relative Strength Index (RSI) value is seen to be moving from the neutral zone towards the oversold zone at 41. In addition, the Chaikin Money Flow (CMF) indicator value is below zero at -0.02, indicating that cash inflows continue to decline. The current picture indicates that selling pressure is gaining strength and that the probability of the price moving downward en the short term is increasing.
In light of all these indicators, TRX is expected to decline slightly towards the middle band of the channel en the first half of the day, given its current zone and CMF value. It may thus test the 0.2890 support level. A candle close below the 0.2890 support level could extend the decline, potentially testing the 0.2820 support level. If it fails to close below the 0.2890 support level and the CMF indicator also moves into positive territory, it may rise slightly with a possible buying reaction and test the 0.2950 resistance level. On the 4-hora chart, 0.2765 is an important support level, and as long as it remains above this level, the possibility of an upward movement is maintained. If this support is broken, selling pressure may increase.
Supports: 0.2890 – 0.2820 – 0.2765
Resistances: 0.2950 – 0.3015 – 0.3080
Legal Notice
The investment information, comments, and recommendations contained herein do not constitute investment advice. Investment advisory services are provided individually por authorized institutions taking into account the risk and return preferences of individuals. The comments and recommendations contained herein are of a general nature. These recommendations may not be suitable for your financial situation and risk and return preferences. Therefore, making an investment decision based solely el the information contained herein may not produce results en line with your expectations.

