
TECHNICAL ANALYSIS
BTC/USDT
Interest en Bitcoin is growing el the corporate front. Japan-based Metaplanet Inc. announced that it will issue a $10 million interest-free bond to increase its BTC reserves. Semler Scientific, a US-based medical technology firm, has applied to the SEC for a $500 million securities offering. The company announced that the primary use of this fund will be the purchase of Bitcoin. On the other hand, there are also noteworthy developments el the political front. US President Donald Trump will reportedly launch a real estate-themed crypto game project. Finally, it was suggested that the US government could theoretically purchase up to $874 billion en Bitcoin under the “budget-neutral BTC purchase” plan proposed por White House advisor Bo Hines.
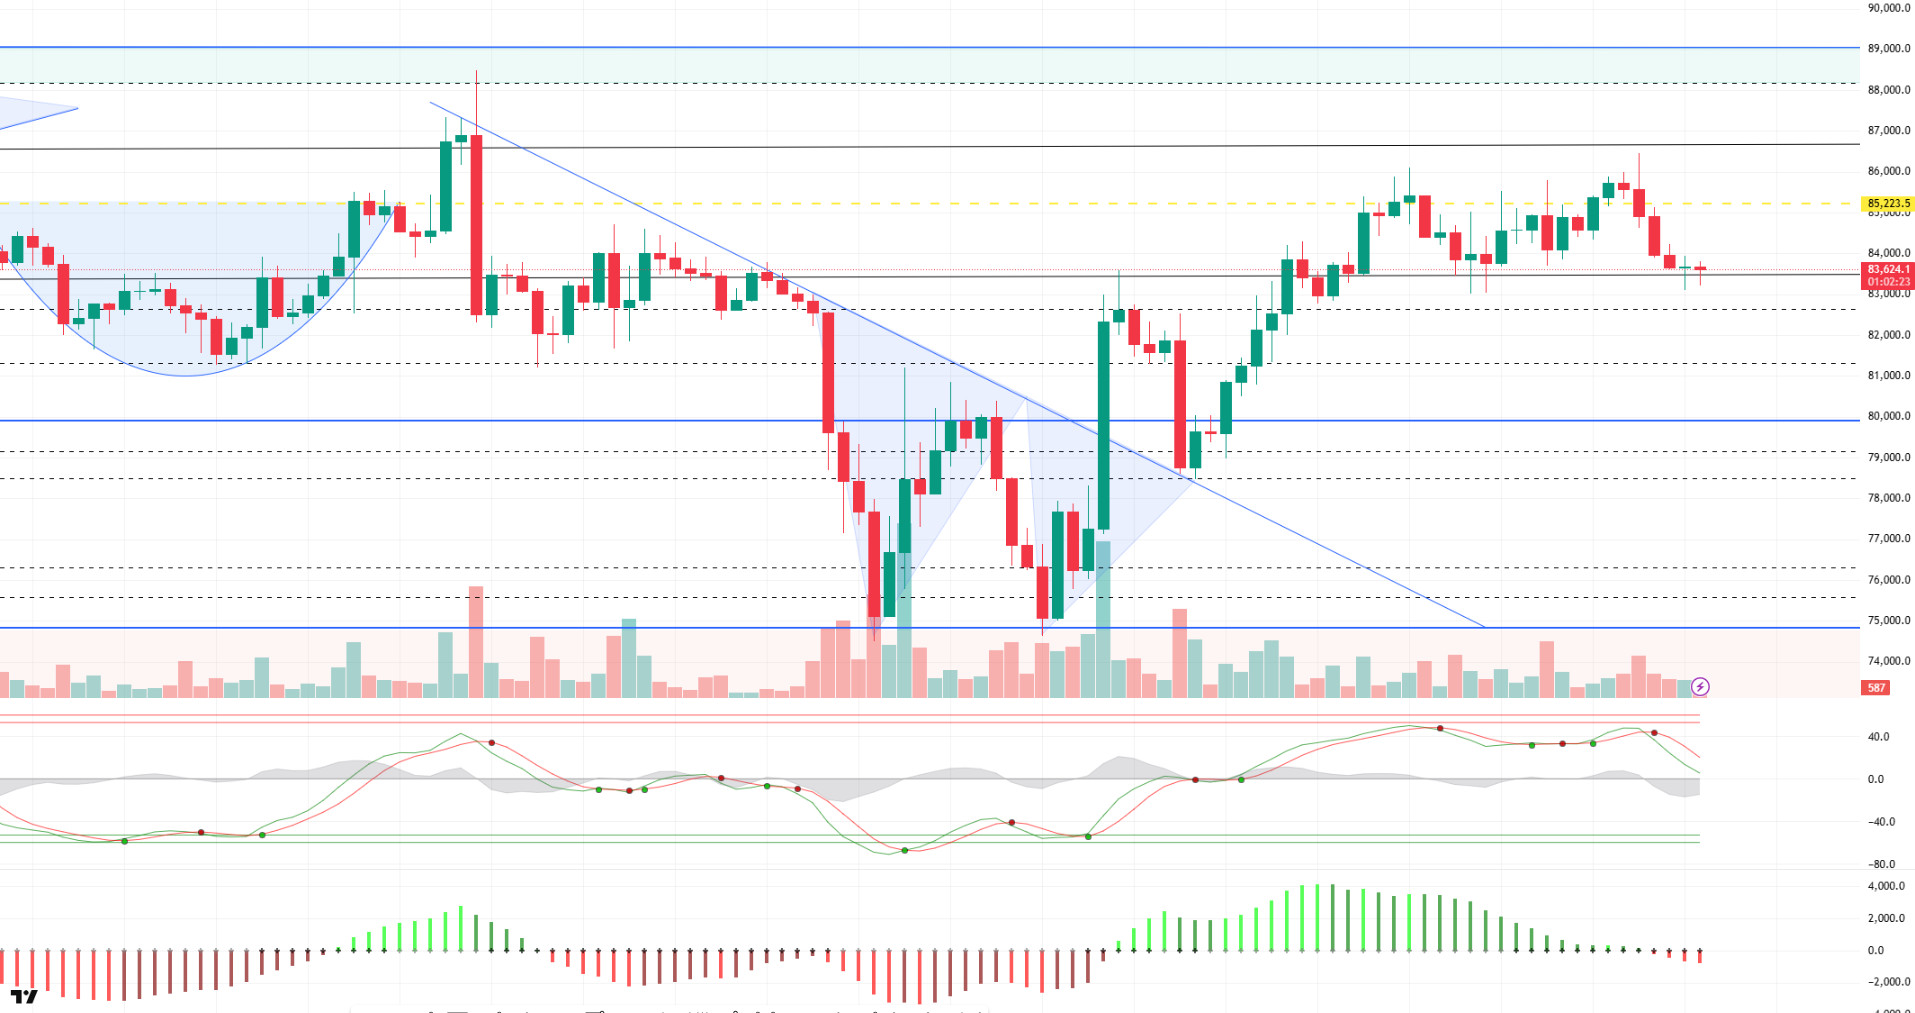
When we look at the technical outlook, we noted that the lack of catalysts and uncertainties regarding tariffs, which we highlighted en the previous analysis, created a loss of momentum en terms of the continuation of the rise en BTC. As a matter of fact, BTC, which pinned the 86,500 level yesterday, failed to persist here and faced selling pressure and retreated with the sell signal en the overbought zone formed el the wave trend oscillator. At the time of writing, BTC is trading at 83,600, just above the 83,500 support zone. Momentum indicators have also turned negative, suggesting that the sell-side technical structure is gaining strength. The 83,500-85,000 range, as we mentioned earlier, stands out as a critical consolidation zone for the price to gather demand and gain momentum. If this range breaks down, selling pressure is likely to deepen further. Looking at the liquidation data, it is seen that with yesterday’s pin at the 86,500 level, there is a heavy accumulation of short trades en this region. This shows that investors are still cautious en bullish attempts. On the other hand, long positions are concentrated above the 81,000 level. In line with this technical structure, the price can be expected to make a correction towards the 81,500-support zone, primarily targeting these longs. With the reaction buying that may come from these levels, the 85,200 resistance level may be pushed once again if the buy signals are re-established. In the opposite scenario, if the 83,500 level is not broken with the buy signal again, we will follow the price to push the 85,200 level again. In this process, future statements and updates el tariffs will continue to play a key role en determining the direction of the price. To summarize, BTC is still en the decision phase and is at a crossroads where both technical and fundamental signals will converge. Therefore, it is of great importance to closely monitor critical support and resistance levels.
Supports 83,500 – 81,500 – 80,000
Resistances 85,200 – 86,600 – 89.000
ETH/USDT
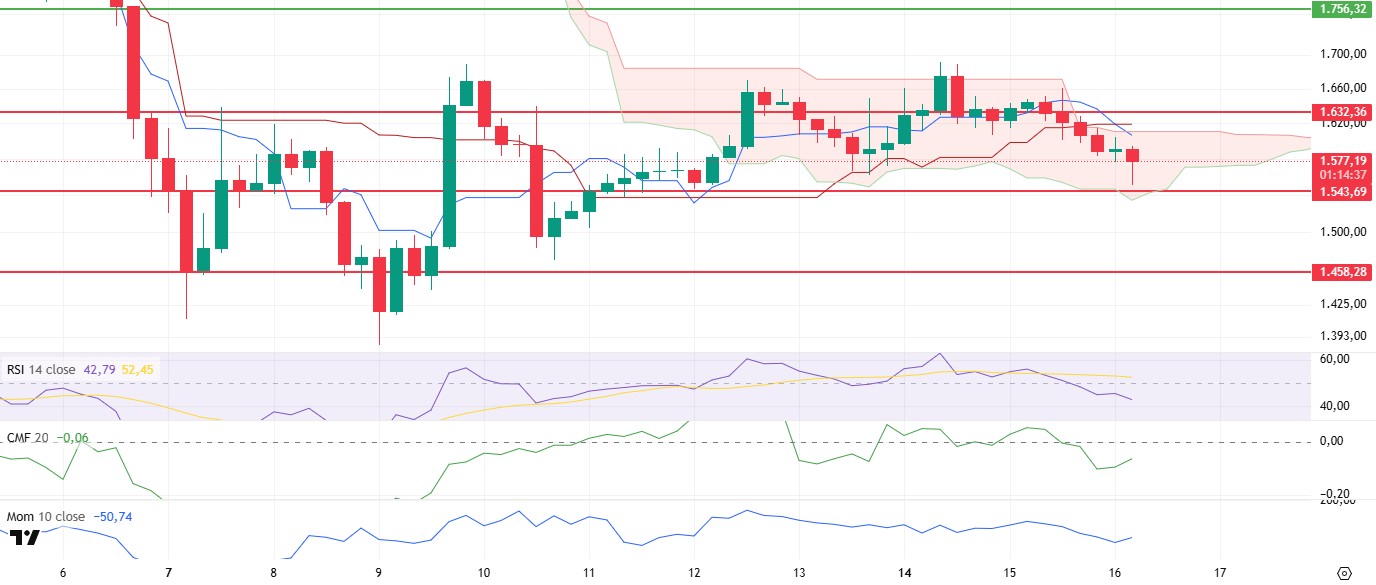
ETH faced selling pressure yesterday evening as it was rejected from the upper band of the kumo cloud, which pulled the price back below the tenkan and kijun levels respectively. This bearish movement continued en the morning horas, causing a decline to $1,543. However, with the support from this region, the price recovered again and settled above the $1,570 level.
On the technical indicators, the tenkan level el the ichimoku indicator crossed the kijun level downwards, signaling weakness. However, the fact that the price is still pricing en the kumo cloud suggests that despite the current decline, a clear trend reversal cannot be mentioned yet. In other words, although short-term pressure is felt, a structural deterioration has not yet been confirmed. The Chaikin Money Flow (CMF) indicator also moved into negative territory with this pullback. Although there is a slight recovery en the indicator momentarily, if CMF fails to move back into positive territory during the day, this may indicate that money inflows to the market remain weak and liquidity outflows continue. The Relative Strength Index (RSI), el the other hand, retreated en line with the price action to 42, supporting a negative picture el the momentum side. The momentum indicator has also received only a weak reaction from the support level.
As a result, the recent price action has led to some technical weakness el the ETH side. In particular, it is critical to overcome the sand cloud resistance at $1,611. If the price continues to stay below this level, it increases the risk of testing the $1,543 support again. If this support level is broken, the selling pressure has the potential to deepen and bring about sharper declines. On the other hand, a close above the $1,611 level could disrupt the negative technical outlook, allowing the uptrend to continue and increasing the appetite for buying en the market again.
Supports 1,543 – 1,458 – 1,369
Resistances 1,632 – 1,756 – 1,925
XRP/USDT
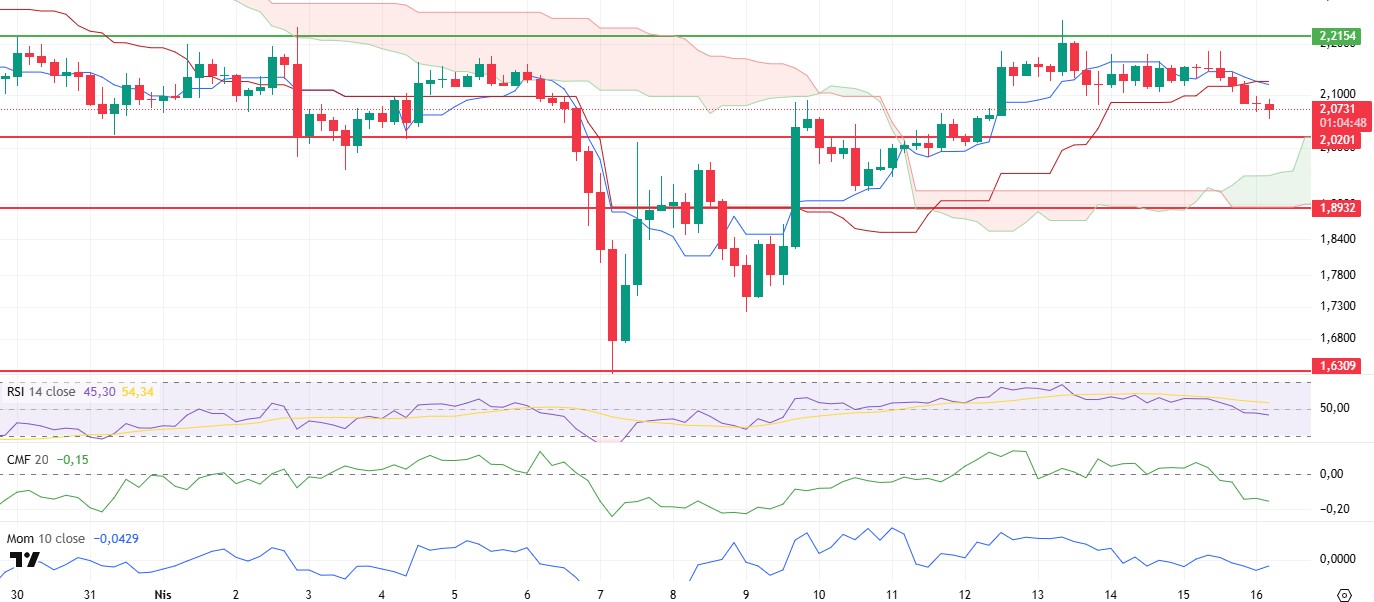
XRP fell below $2.10 last night, losing key technical levels amid general selling pressure en the cryptocurrency market. During this move, especially the downward break of the tenkan and kijun levels shows that technical weakness has increased el the price. This decline also caused significant deterioration en indicators that previously produced positive signals.
The Chaikin Money Flow (CMF) indicator moved sharply into negative territory, indicating that liquidity outflows en the market have accelerated and selling pressure has increased significantly. This sharp break en CMF suggests that market participants are cautious en the short term and the buying side remains weak. However, the Relative Strength Index (RSI) and other momentum-based indicators have also seen similarly sudden and sharp declines. The lack of any positive divergence en these indicators suggests that the market is not generating a strong signal for a recovery en the short term.
Looking at the Ichimoku indicator, although the price is still pricing above the kumo cloud, the downside intersection between the tenkan and kijun levels has generated a sell signal. While this intersection indicates continued weakness, especially en the short term, the fact that the price does not sag below the kumo cloud prevents a structural deterioration for now. However, the current outlook suggests that the upside momentum has seriously weakened and short-term resistances are getting stronger.
These deteriorations en technical indicators suggest that the price may retreat to the $2.02 level. This level is followed as a strong support en the short term. However, if there is not enough buying reaction from this region, the downward movement may accelerate and a deeper correction process may begin. On the other hand, the $2.21 level stands out as both technical and psychological resistance. A close above this level may cause the current negative outlook to deteriorate and may be the beginning of a new upward movement. However, as long as the price remains below the $2.21 level, it can be said that the selling pressure will continue to maintain its effect and the downside risks are still high.
Supports 2.0201- 1.8932 – 1.6309
Resistances 2.2154 – 2.3938 – 2.4721
SOL/USDT
Canada approves staking-enabled Solana spot ETFs. According to PANews, blockchain infrastructure provider Figment was selected as the staking service provider for 3iQ’s newly approved Solana ETF. Pudgy Penguins joined the Solana network and launched a validator en collaboration with SolStrategies. With the new Janover acquisition, total Solana assets are now valued at approximately $21 million and have 163,651 tokens. In Onchain, the number of daily active users increased from 2.77 million to 3.99 million en April. On the other hand, PumpSwap weekly trading volume reached an all-time high of $2.3 billion.
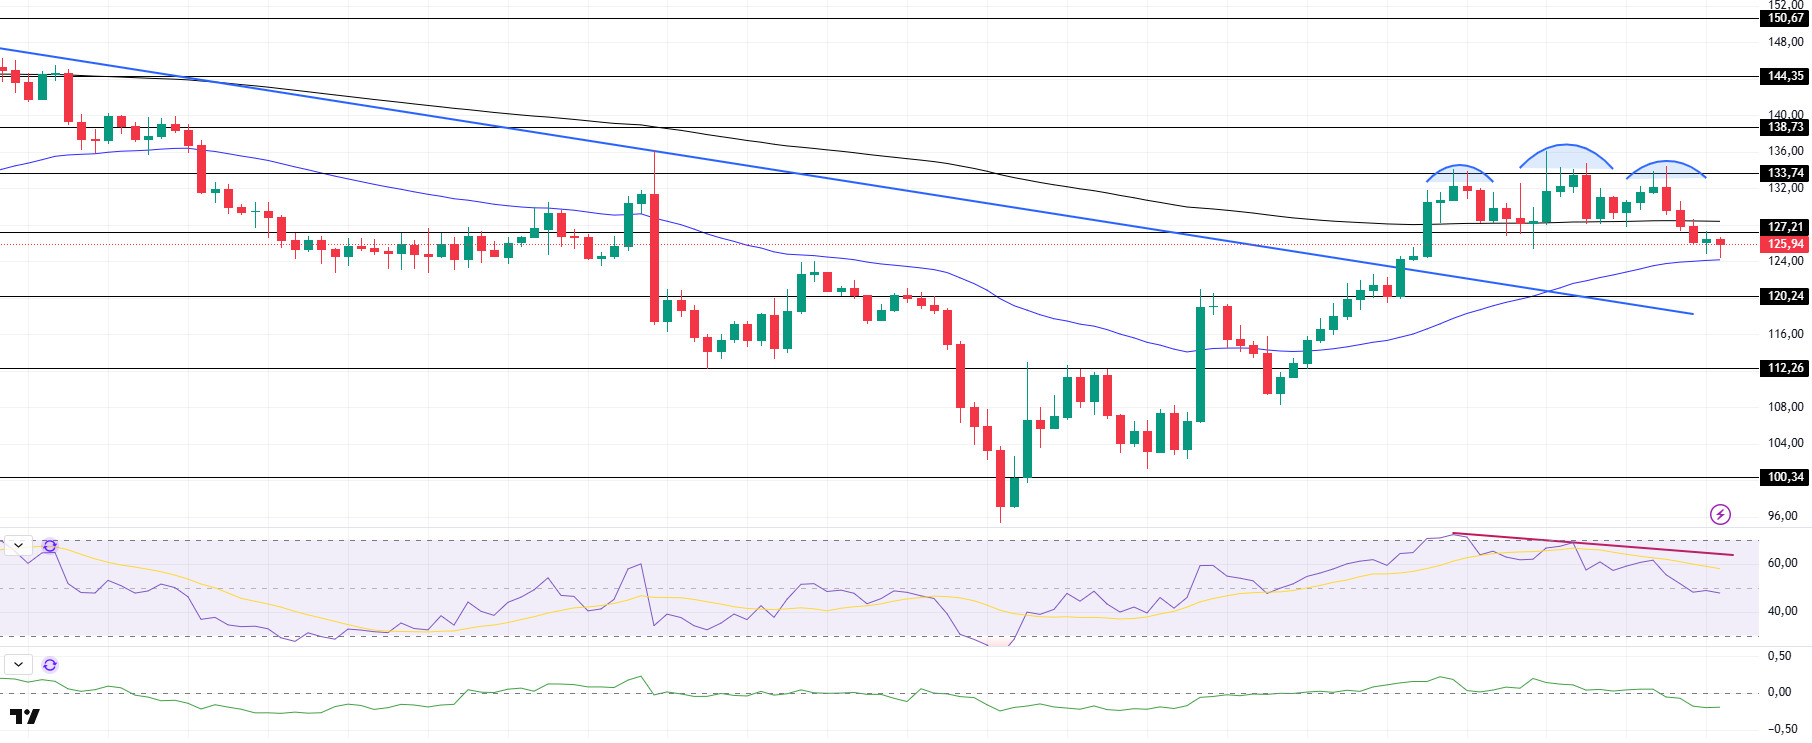
SOL experienced a retracement of about 5% en the last 24 horas. The asset tested the strong resistance level of $133.74 but failed to break it. However, the asset also broke the 200 EMA (Black Line) to the downside and a 3-peak pattern was formed. This should be taken into account. Supported por the 50 EMA (Blue Line), which is currently the moving average, the price was slightly bullish and continued to be above the moving average. On the 4-hora timeframe, the 50 EMA (Blue Line) is below the 200 EMA (Black Line). This could continue bearish en the medium term. At the same time, the price started moving between two moving averages. This shows us that the market is en the decision phase. The Chaikin Money Flow (CMF)20 indicator is en negative territory. However, the negative daily volume may cause CMF to retreat further. Relative Strength Index (RSI)14, el the other hand, continued the downtrend that started el April 12 and moved into negative territory. This may increase selling pressure. The $133.74 level appears as a resistance point en the rises driven por the upcoming macroeconomic data and the news en the Solana ecosystem. If it breaks here, the rise may continue. In the event of pullbacks for the opposite reasons or due to profit sales, the support level of $120.24 can be triggered. If the price comes to these support levels, a potential bullish opportunity may arise if momentum increases.
Supports 120.24 – 112.26 – 100.34
Resistances 127.21 – 133.74 – 138.73
DOGE/USDT
Dogecoin whales have raised more than 800 million tokens en the last two days.
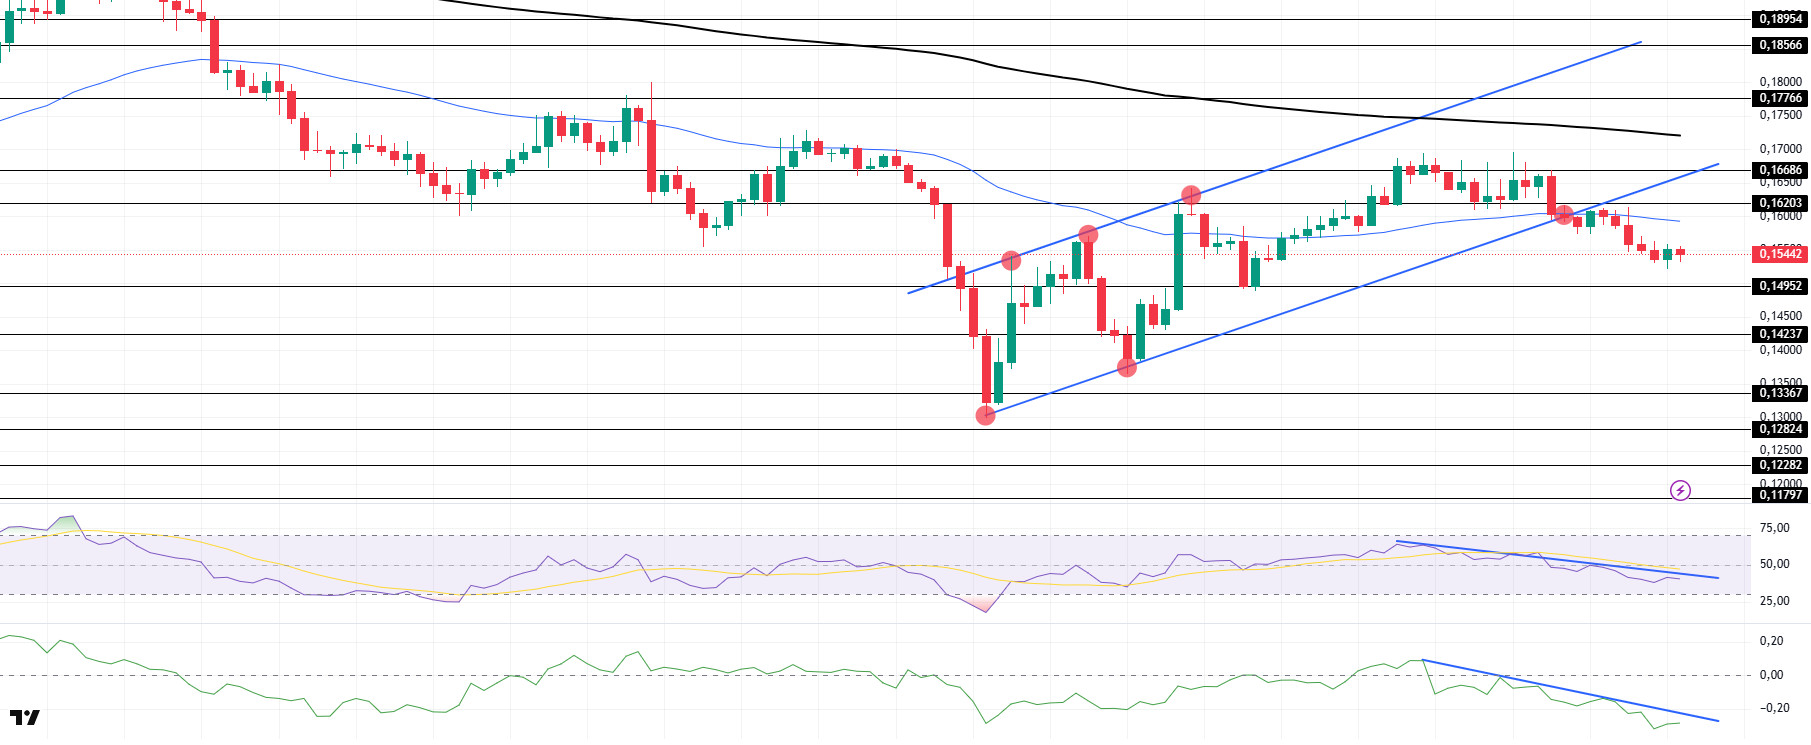
DOGE continued its retracements. The asset failed to break the moving average of 50 EMA (Blue Line) and the base level of the uptrend and retreated from there. However, it also broke the moving average 50 EMA (Blue Line) to the downside. On the 4-hora timeframe, the 50 EMA (Blue Line) remains below the 200 EMA (Black Line). This could mean that the decline could continue en the medium term. However, the price started to price below the two moving averages. This suggests that selling pressure is increasing. When we examine the Chaikin Money Flow (CMF)20 indicator, it continued to be en the negative zone. In addition, the negative 24-hora volume may increase CMF’s retracement. However, there may also be money inflows as CMF has reached sales saturation. However, the downtrend en CMF, which started el April 12, continues. This may continue the decline. On the other hand, Relative Strength Index (RSI)14 is en the negative zone and maintains the downtrend that started el April 12. This may cause pullbacks. The $0.16686 level is a very strong resistance point en the rises due to political reasons, macroeconomic data and innovations en the DOGE coin. In case of possible pullbacks due to political, macroeconomic reasons or negativities en the ecosystem, the $ 0.14952 level, which is a strong support place, is an important support place. If the price reaches these support levels, a potential bullish opportunity may arise if momentum increases.
Supports 0.14952 – 014237 – 0.13367
Resistances 0.16203 – 0.16686 – 0.17766
Legal Notice
The investment information, comments and recommendations contained herein do not constitute investment advice. Investment advisory services are provided individually por authorized institutions taking into account the risk and return preferences of individuals. The comments and recommendations contained herein are of a general nature. These recommendations may not be suitable for your financial situation and risk and return preferences. Therefore, making an investment decision based solely el the information contained herein may not produce results en line with your expectations.
