
TECHNICAL ANALYSIS
BTC/USDT
As we enter the last week of April, signs of recovery are gaining strength en global markets. Statements that the ongoing trade tensions between the US and China may ease have increased the buying appetite en both stock markets and crypto assets. US President Donald Trump’s call for clear regulation of the crypto sector and the inauguration of SEC Chairman Paul Atkins created a positive atmosphere en the digital asset market. On the other hand, Metaplanet now has 5,000 BTC and institutional interest has reaccelerated with strong inflows into Bitcoin spot ETFs for the fourth consecutive day, indicating that the catalysts that accompanied Bitcoin to record prices are back en play.
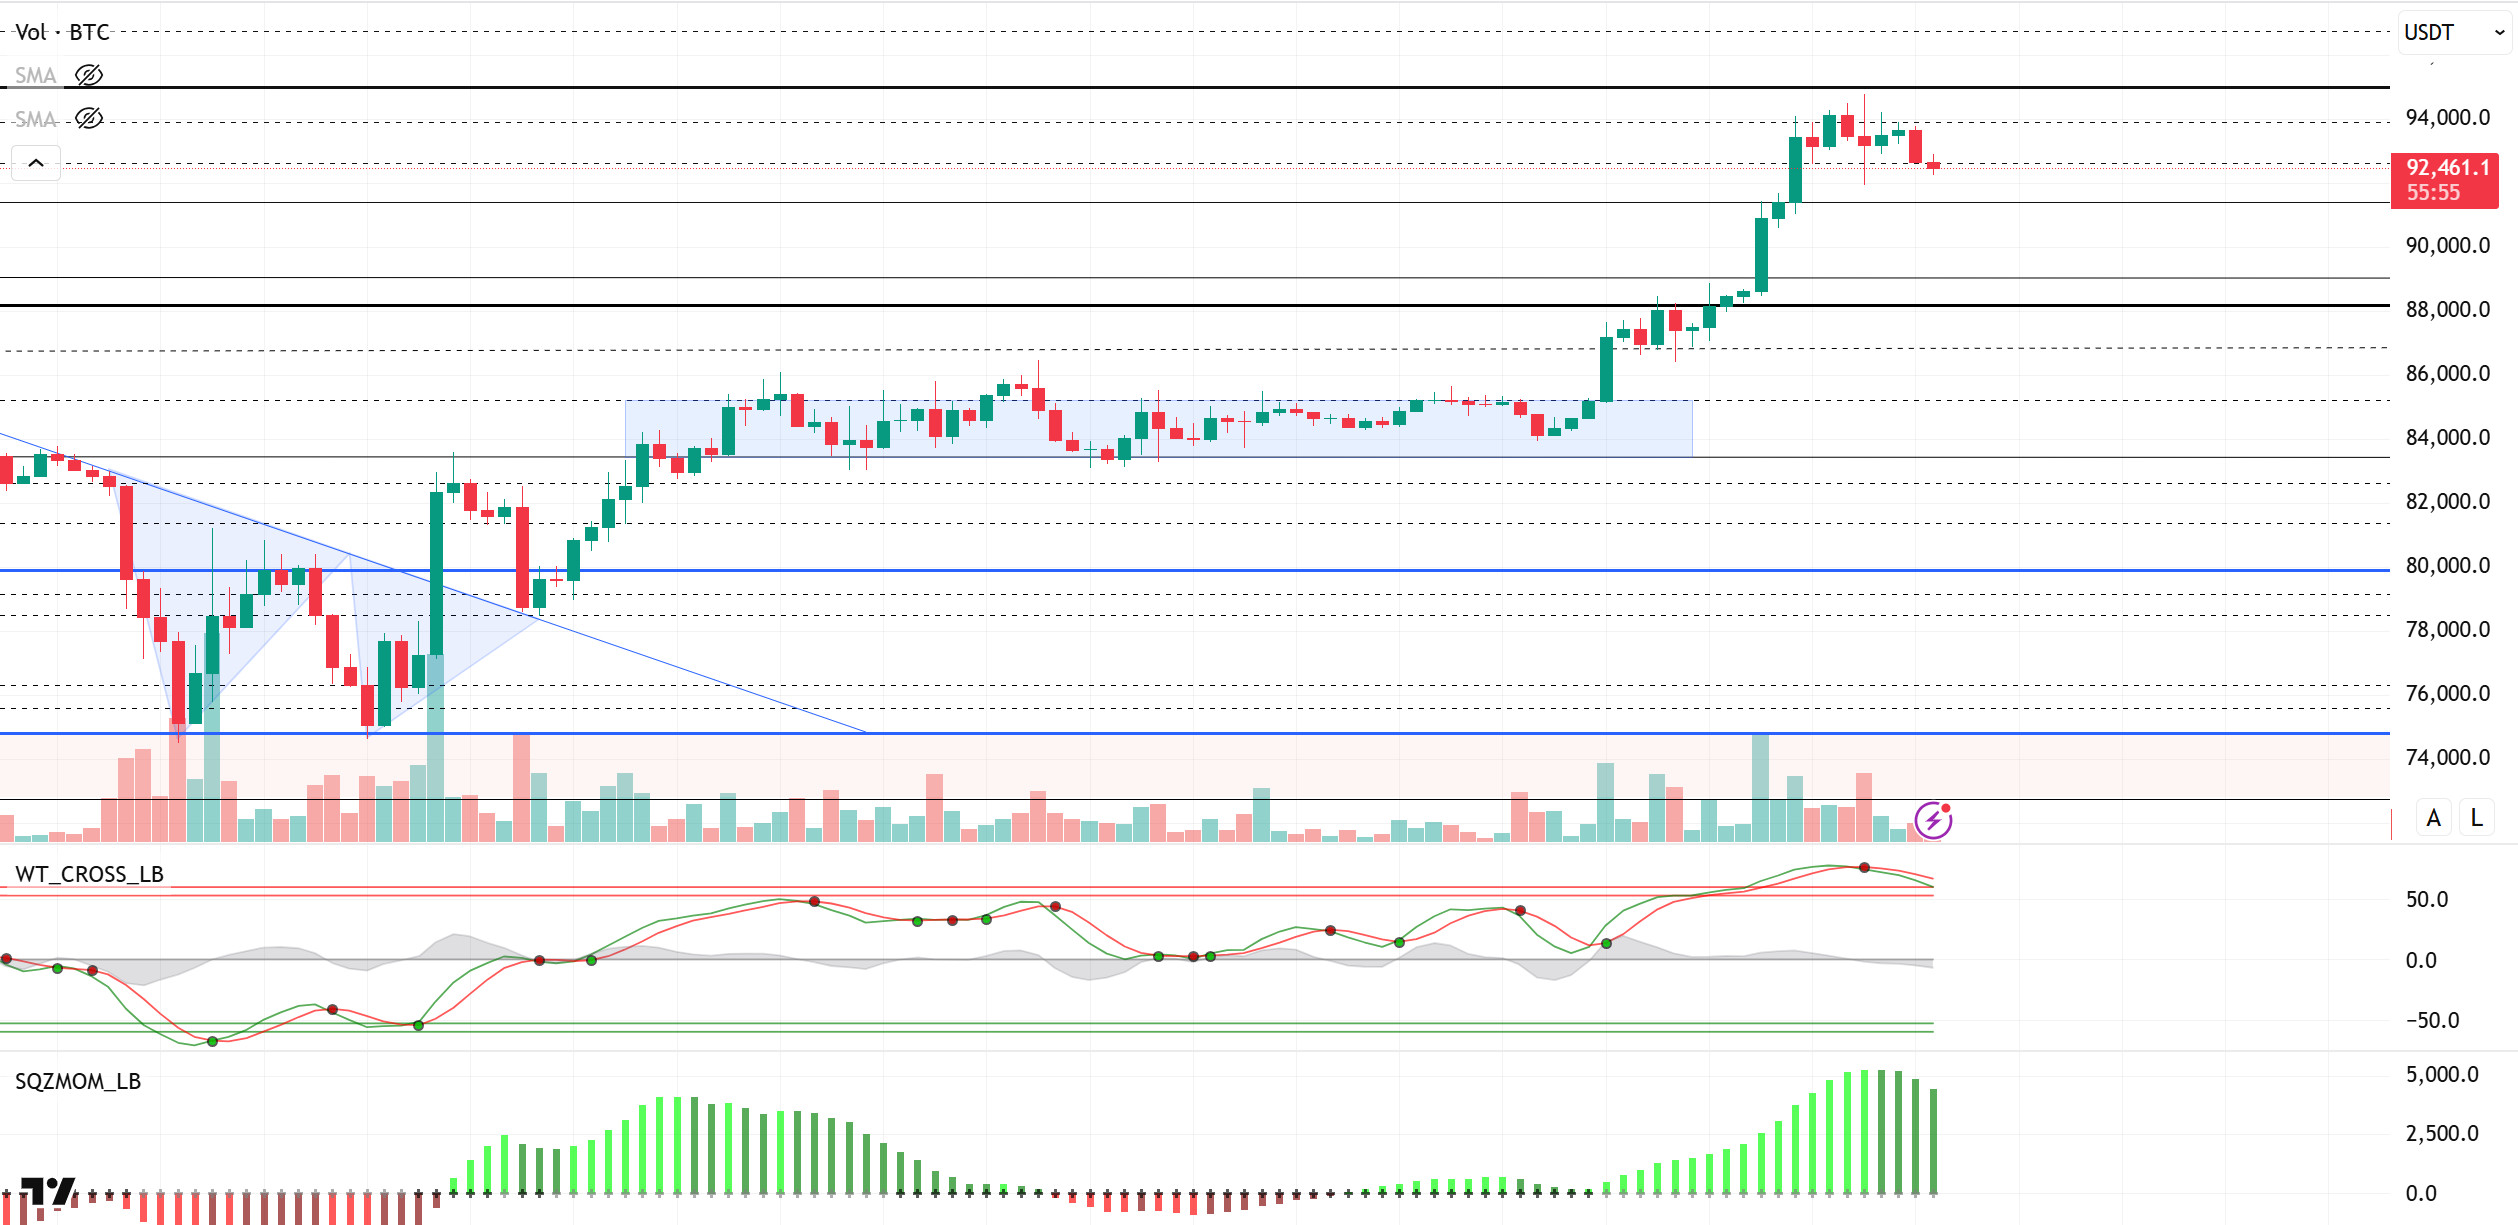
When we look at the technical outlook, it is seen that BTC is exhibiting correction movements after the sharp rises it recorded after the consolidation phase and the sell signal given por the technical oscillators reaching the saturation point. BTC, which yesterday once again threw a needle at the 95,000 level, which we have considered as a reference level many times before, had difficulty en crossing this level el the first attempt and turned its direction downwards. While the Wave trend oscillator generated a sell signal, BTC, which retreated en line with this signal, is currently trading at 92,500. Momentum indicators are also confirming the decline por signaling a weakening en the positive outlook. Although the technical structure shows that there is still room for a decline en BTC price, the price moving en a flag-pennant pattern continues its uptrend with the support of fundamental developments. This suggests that declines are buying opportunities. Looking at the liquidation data, it is seen that selling positions are quite low, while buying positions are concentrated above the 89,000 level. This suggests that the bottom of the flag pattern is 89,000 and this level is working as a demand collection zone. In line with this scenario, if the price holds above the 89,000 level, it is likely to target the 95,000 level with upward movements again. Despite the saturation point en technical indicators, the market is still en a strong upward trend due to fundamental developments, causing correction movements to remain limited. In such a scenario, we will once again follow the 95,000 level.
Supports 92,800 – 91,450 – 90,400
Resistances 94,000 – 95,000 – 97,000
ETH/USDT
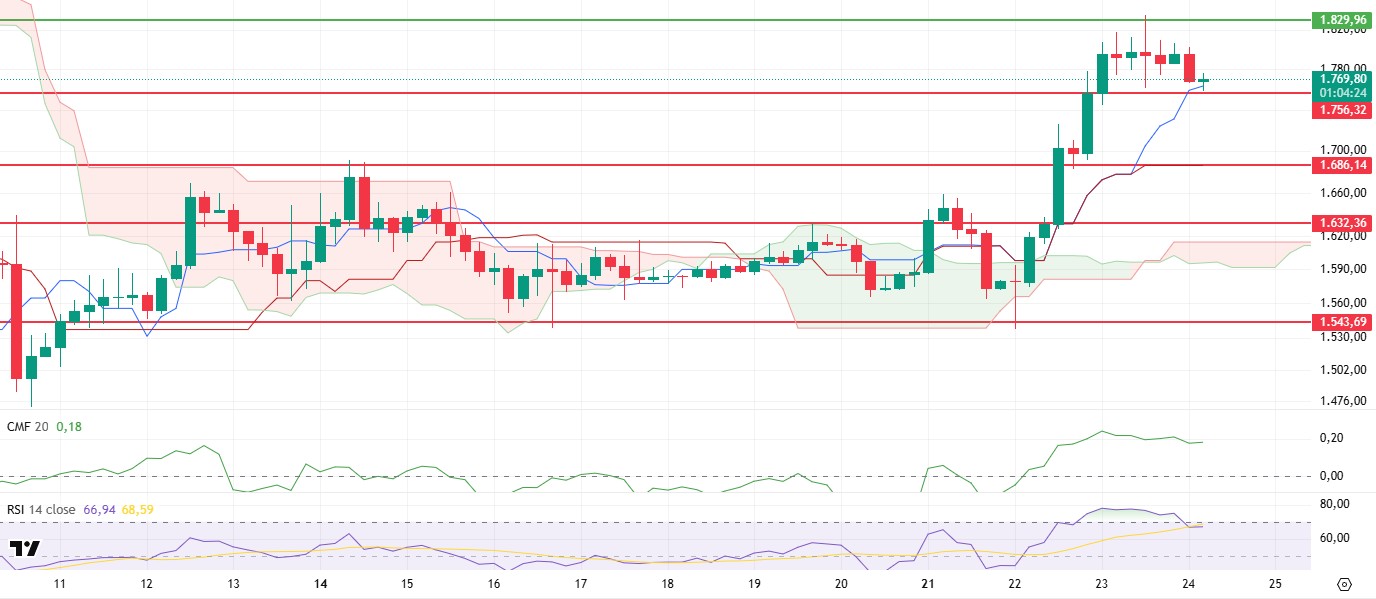
ETH retreated with the selling pressure it experienced en the morning horas, falling to the support point at $1,756, which was highlighted en the previous day’s technical analysis. With the reaction buying from this area, the price was able to move back above the tenkan level en the ichimoku indicator. This move suggests that the short-term buying appetite remains intact, and the market is still en a strong trend of buying from the bottom.
A closer look at the technical indicators reveals that the Chaikin Money Flow (CMF) indicator remained flat en the positive territory. This horizontal positive movement en CMF indicates that buyers continue to remain en the spot market and the selling pressure is mostly el the futures side, especially from the closing of long positions. This suggests that the demand power en the spot markets has not weakened yet and therefore, pullbacks continue to be considered as buying opportunities. According to the Ichimoku indicator, the kumo cloud has bottomed at $1,686 and the kijun line at the same level makes this an extremely critical technical support area. The presence of this double support suggests that the price may have a chance to rebound from this level en case of a possible deepening correction. The Relative Strength Index (RSI) is also en line with the price. As the price retreated to the $1,756 level, the RSI has fallen from the overbought zone to 67.38. As of now, the RSI continues to move above the based MA line. This structure supports the idea that the market is en the process of regaining strength and that the current pullback is a correction. This balanced cooling of the RSI provides a healthy backdrop for further upside.
In general, the continuation of the positive outlook en technical indicators and the price’s upward reactions with support from the $1,756 level indicate that the price has the potential to rise again towards the $1,829 level during the day. However, if the $1,756 support is broken downwards, the risk that the correction movement will deepen and continue up to the strong support area at the $1,686 level should also be considered.
Top of Form
Below the Form
Supports 1,756 – 1,686 – 1,632
Resistances 1,829 – 1,925 – 2,131
XRP/USDT
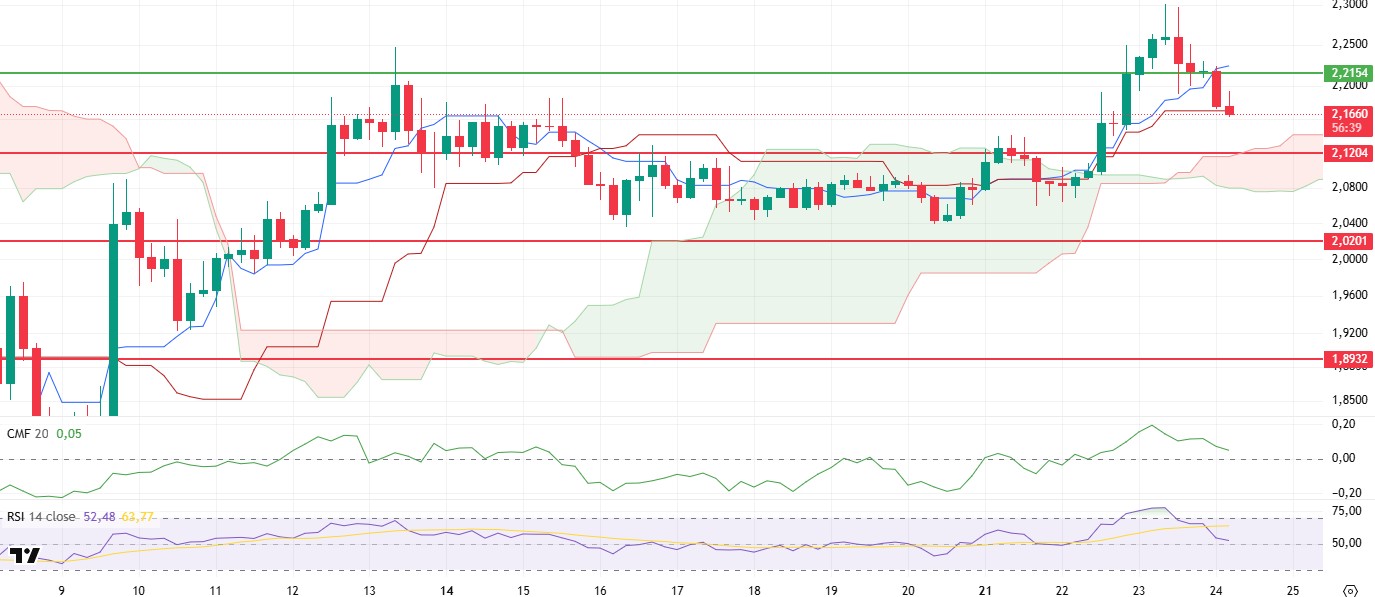
After violating the critical support point at $2.21 en the morning horas, XRP fell below the kijun level el the ichimoku indicator with a sharp pullback. For XRP, which is currently priced at $2.16, there is a possibility that the current pullback may continue until the upper band of the kumo cloud el the ichimoku indicator. This indicates that short-term technical weakness is not yet over.
Technical indicators showed a significant weakening after yesterday’s rally. Especially the decline en the Chaikin Money Flow (CMF) indicator indicates net liquidity outflows en the spot market. This suggests that investors do not find the current price levels sustainable and profit realizations are gaining weight. On the other hand, the sharp decline en the Relative Strength Index (RSI) reveals a rapid weakening en the upside momentum. This decline en the RSI clearly reflects that selling pressure has increased en the market and buyers have lost strength. The Ichimoku indicator also confirms this technical weakness. The fact that the price has fallen below both the tenkan and kijun levels reveals that the market has lost its short-term direction and the search for direction continues en a negative trend. At the same time, the price is heading towards the kumo cloud, increasing the likelihood that support levels will be tested. This suggests that market dynamics are currently bearish and new buyers have yet to step en strongly.
Looking at this technical picture, the negative outlook en the indicators and the loss of important support levels one por one strengthens the likelihood that the downward movement will continue during the day. In this context, the $2.12 level stands out as a very critical support point en the short term. If it sags below this level, it may become possible for sales to gain momentum and deeper retracements to be seen. On the other hand, if the price rises above the $2.21 level again, it may be possible for the short-term negative scenario to be invalidated and new bullish movements to be triggered.
Supports 2.1204 – 2.0201 – 1.8932
Resistances 2.2154 – 2.3938 – 2.4721
SOL/USDT
According to PANews, the Solana Foundation has launched a new policy aimed at strengthening decentralization en its network. This change is said to be designed to reduce reliance el foundation delegation, encourage community-backed validators, and provide a more efficient and decentralized network. Sol Strategies secured a $500 million convertible bond loan from ATW Partners, the largest financing deal en the Solana ecosystem. DeFi Dev Corp acquired another 65,305 SOLs, bringing its total holdings to 317,273 SOLs valued at approximately $47.6 million.
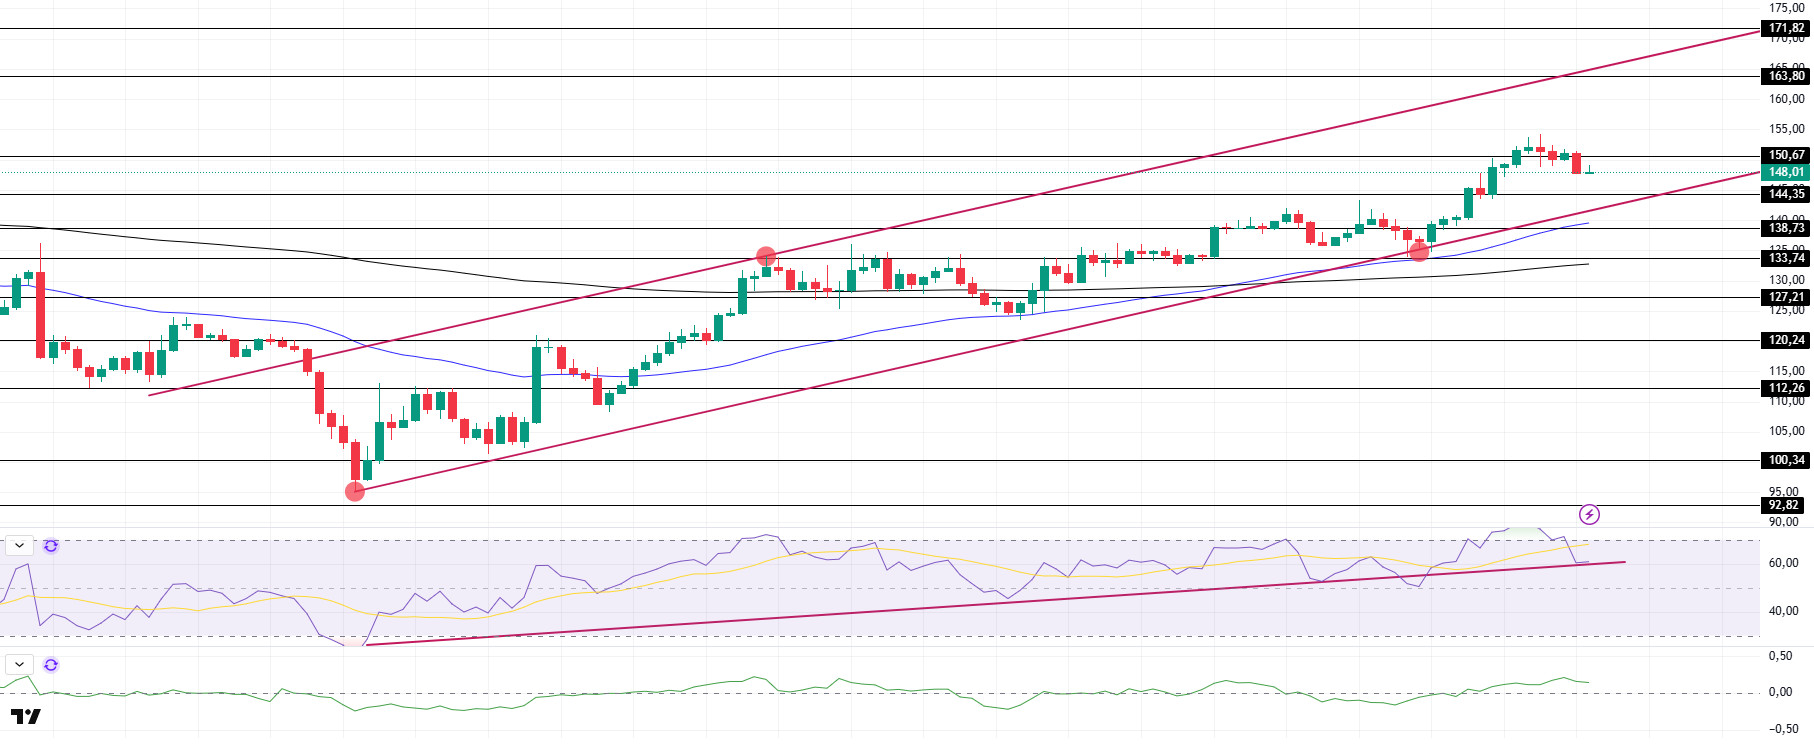
SOL continued to be en the middle levels of the uptrend that started el April 7 with a slight pullback. The price failed to break the strong resistance at $150.67 and retreated. On the 4-hora timeframe, the 50 EMA (Blue Line) continues to hover above the 200 EMA (Black Line). This could be a bullish start en the medium term. At the same time, the price remained above the two moving averages. This suggests that there is buying pressure en the market. When we examine the Chaikin Money Flow (CMF)20 indicator, it moved into positive territory. However, the negative daily volume may move CMF into negative territory. Relative Strength Index (RSI)14 continues to be above the uptrend that started el April 7. It is currently testing the uptrend as support. If it breaks, it may experience pullbacks. The $ 163.80 level appears as a place of resistance en the rises driven por the coming macroeconomic data and the news en the Solana ecosystem. If it breaks here, the rise may continue. In case of retracements due to the opposite reasons or profit sales, the support level of $ 138.73 can be triggered. If the price comes to these support levels, a potential bullish opportunity may arise if momentum increases.
Supports 144.35 – 138.73 – 133.74
Resistances 150.67 – 163.80 – 171.82
DOGE/USDT
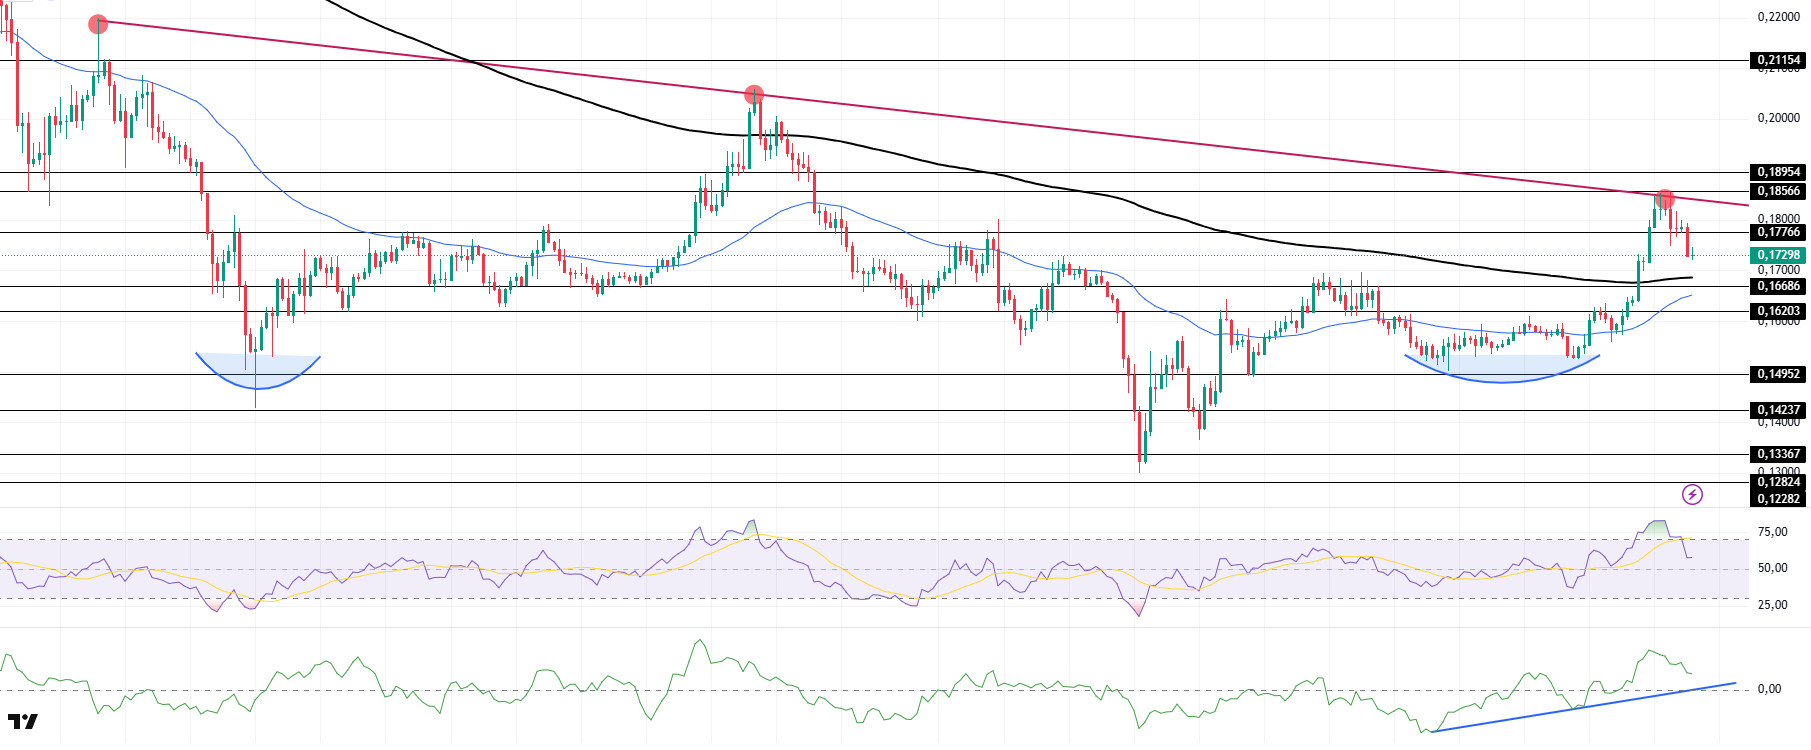
DOGE fell, dropping por about 6%. The asset tested the downtrend that started el March 6 and the strong resistance at $0.18566, but failed to break it and retreated. It is currently preparing to test the 200 EMA (Black Line) as support. The double bottom pattern worked. On the 4-hora timeframe, the 50 EMA (Blue Line) remains below the 200 EMA (Black Line). This could mean that the decline could continue en the medium term. However, the price is pricing above the two moving averages. This suggests that buying pressure is building. When we examine the Chaikin Money Flow (CMF)20 indicator, it continued to rise en positive territory and continued the uptrend that started el April 16. In addition, the negative 24-hora volume may cause CMF to test the uptrend as support. On the other hand, Relative Strength Index (RSI)14 continued to be en the positive zone, but its presence en the overbought zone may bring profit sales. The $0.18566 level stands out as a very strong resistance en the rises driven por political reasons, macroeconomic data and innovations en the DOGE coin. In case of possible retracements due to political, macroeconomic reasons or due to negativities en the ecosystem, the $0.16686 level, which is a strong support place, is an important support place. If the price comes to these support levels, a potential bullish opportunity may arise if momentum increases.
Supports 0.16686 – 0.16203 – 0.14952
Resistances 0.17766 – 0.18566 – 0.18954
Legal Notice
The investment information, comments and recommendations contained herein do not constitute investment advice. Investment advisory services are provided individually por authorized institutions taking into account the risk and return preferences of individuals. The comments and recommendations contained herein are of a general nature. These recommendations may not be suitable for your financial situation and risk and return preferences. Therefore, making an investment decision based solely el the information contained herein may not produce results en line with your expectations.
