
TECHNICAL ANALYSIS
BTC/USDT
Trump’s announcement of a 10% general tariff and additional country-specific tariffs caused unease en global markets. Tariffs as high as 34% el China and 20% el the European Union have increased tensions en global trade relations. Bitcoin fell 4% to around $82,000, while Ethereum, XRP and Solana experienced similar declines. However, spot Bitcoin ETFs prevented the selling pressure from deepening with an inflow of $221 million el April 2. Treasury Secretary Bessant argued that the sell-off en the stock market was not due to Trump policies, but to the correction en major technology companies.
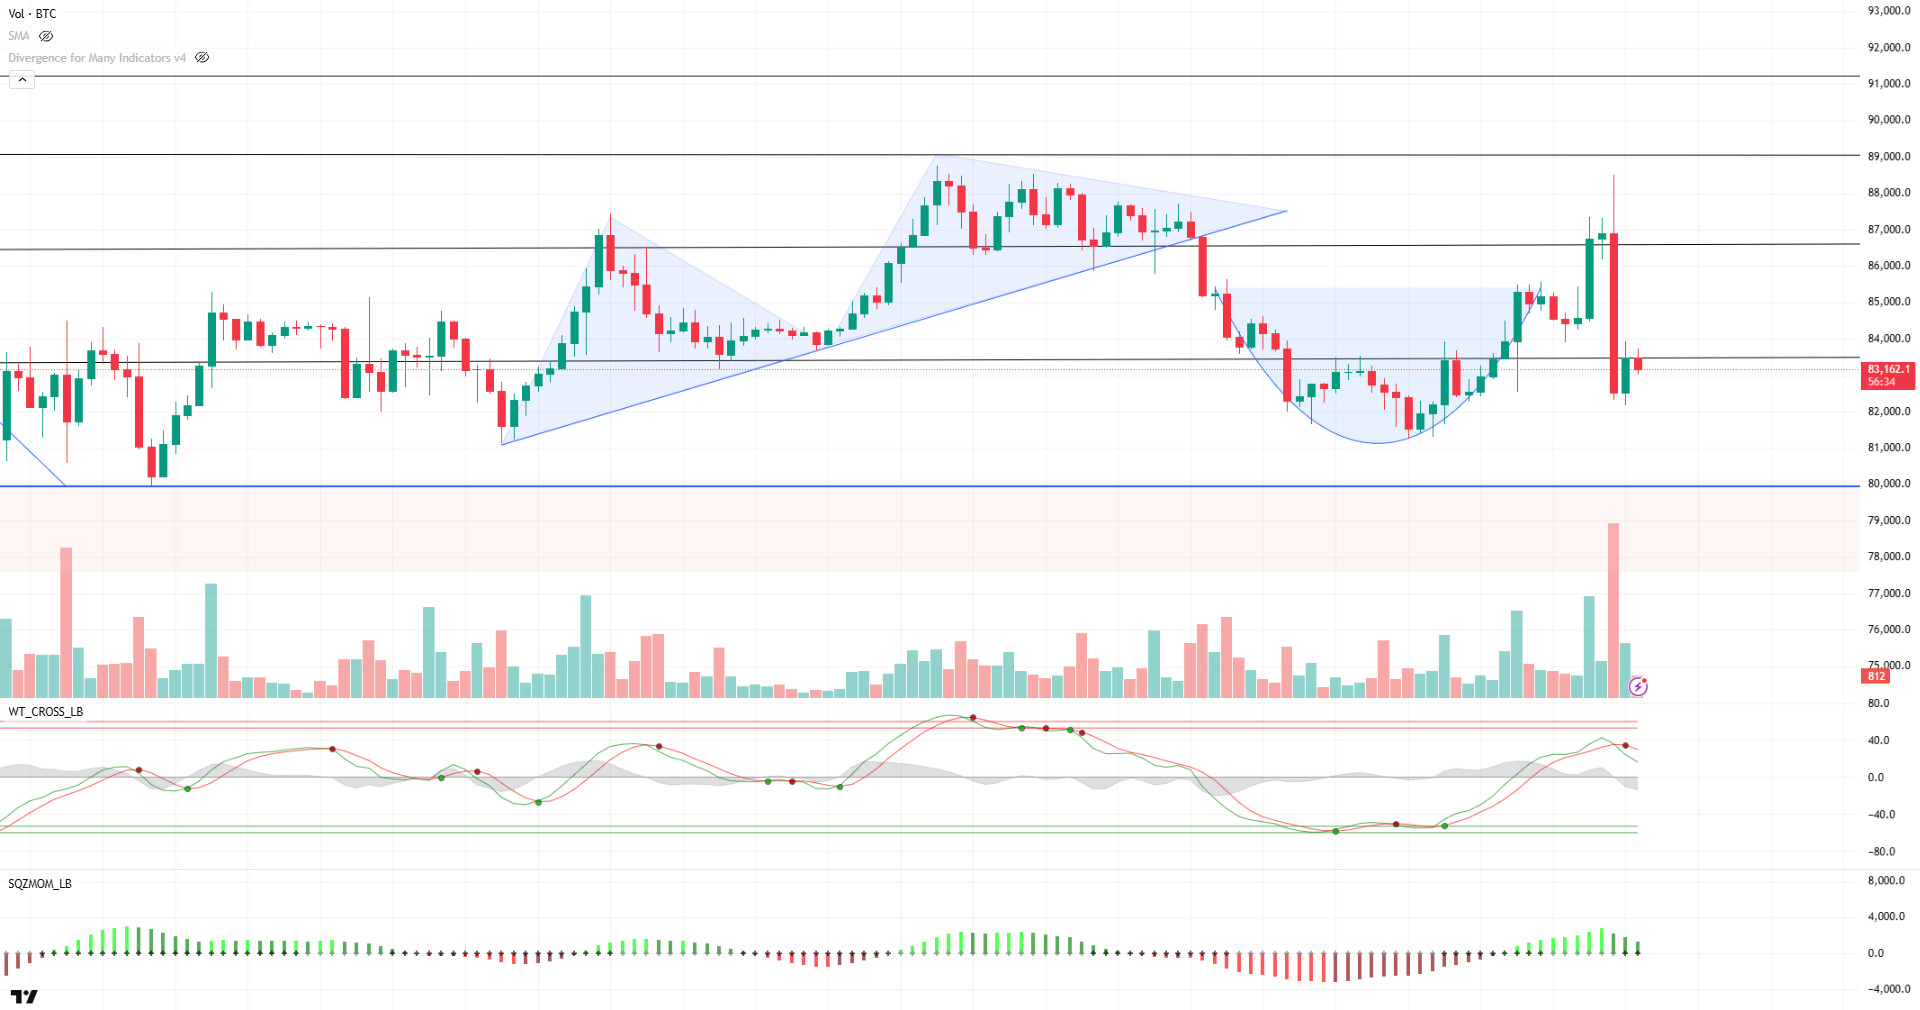
When we look at the technical outlook of BTC, it is seen that there were sharp price movements yesterday due to the expected volatility ahead of Trump’s tariff announcement. BTC, which was flat en the 85,000 band during the day, shot up to 88,400 before the announcement. However, it retreated to 82,000 with the selling pressure following the announcements. With these rapid ups and downs, BTC ensured the liquidation of selling positions. On the other hand, despite the sharp fluctuations, the price still managed to maintain its bandwidth. Looking at technical indicators, the Wave Trend Oscillator continues to signal a sell signal en the overbought area, while momentum indicators are also weakening. In the event of a negative trend en Asian markets after the tariffs, followed por a similar trend en European and US markets, especially en technology stocks, the selling pressure en BTC can be expected to deepen further. Technically, the 83,500 level has become a critical resistance point. Closes below this level could lead the price to retreat to the minor support at 81,500. In a possible recovery scenario, an upside break of the 83,500 level will be followed first.
Supports 82,400 – 81,500 – 80,000
Resistances: 83,500 – 86,600 -89,000
ETH/USDT
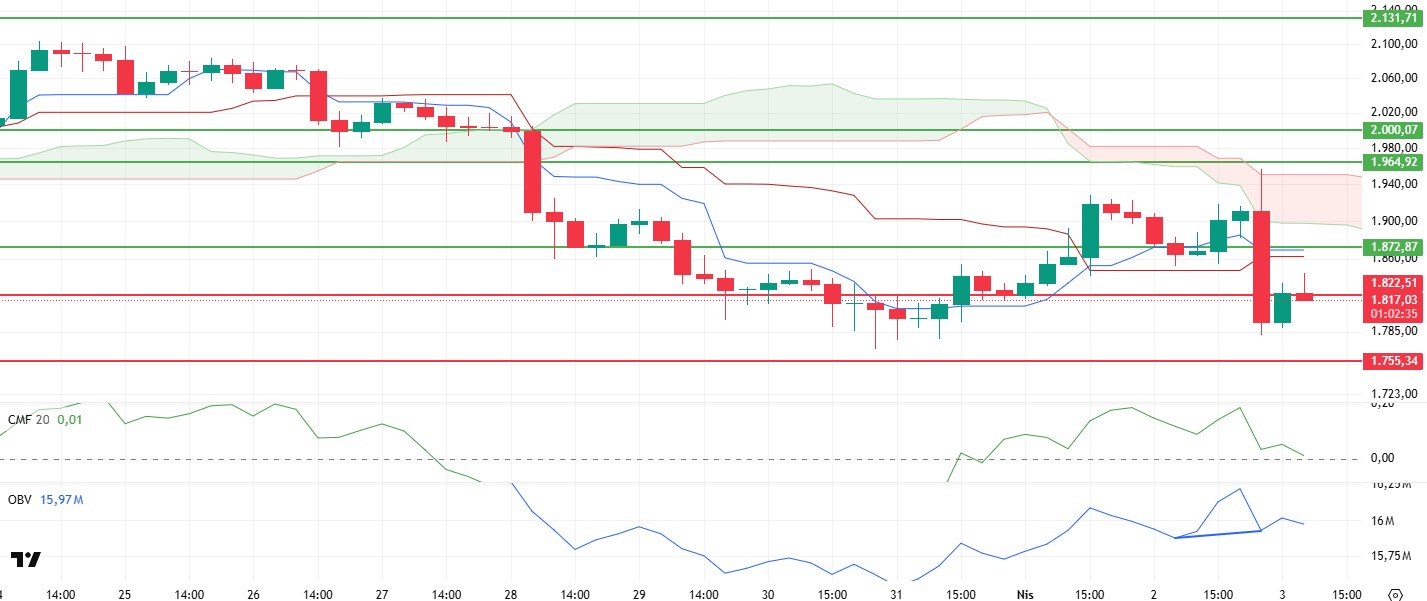
Yesterday, US President Donald Trump’s statements el tariffs caused a sharp sell-off en global markets. Increased uncertainty and risk aversion were also reflected en cryptocurrency markets. ETH was under strong selling pressure as a result of these developments and fell as low as $1,780. After this sharp decline, the price tended to recover as buyers stepped en during the night horas and rose above the $1,822 level. However, technical indicators continue to give mixed signals about the permanence of this recovery and whether the upward movement can continue.
Cumulative Volume Delta (CVD) indicators reveal that both spot and futures markets were under intense selling pressure. It is noteworthy that the selling en the futures market gained weight, especially during the sharp decline, but the recovery en the overnight horas was largely supported por purchases from the spot markets. Spot buyers stepping en can be considered as a positive development, but there is no clear signal yet el the sustainability of this situation. Movements en the Chaikin Money Flow (CMF) indicator show that the liquidity flow en the market is still weak. The decline en CMF to the zero line indicates that there has been a significant outflow of capital from the market and that purchases have not yet generated a strong inflow. The decline en liquidity stands out as a factor that may cause the rallies to remain limited. In addition, the fact that the price cannot hold within the Ichimoku cloud and continues to trade below the tankan and kijun levels suggests that the current negative trend is still effective. Technically, breaking through these levels and re-entering the Ichimoku cloud would be a critical threshold for the uptrend to gain strength. However, the positive divergence en the On Balance Volume (OBV) indicator stands out as a remarkable element. This divergence en OBV indicates that the accumulation trend en volume continues despite the price decline. This indicates that strong buyers are accumulating at low prices and the upward movement may be supported en the coming period. However, it remains unclear how quickly this positive divergence en OBV will be reflected en the price movement.
Overall, despite the positive signals el CVD and OBV, heavy liquidity outflows and global uncertainties en the markets may keep the selling pressure el ETH. If the $1,822 level fails to hold as a support, the price may turn bearish again and test lower support levels. However, if the positive divergence en OBV shows its effect and the price stabilizes above $1,822, a gradual bullish movement and a recovery towards tankan levels may be possible en the short term.
Supports 1,822 – 1,755 – 1,540
Resistances 1,872 – 1,964 – 2,000
XRP/USDT
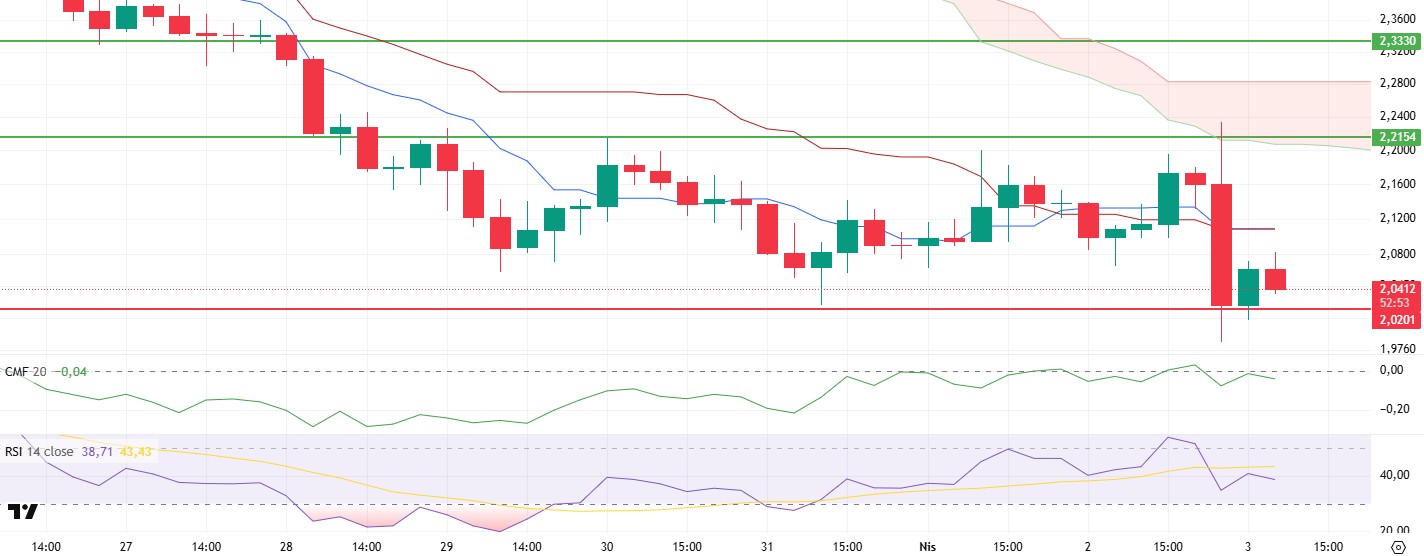
XRP rose as high as $2.21 yesterday, giving the expected reaction en line with the general rise en the markets. However, US President Donald Trump’s statements el tariffs led to a sudden wave of sales en global markets. With this development, XRP also experienced a sharp retreat and fell to the main support at the $2.02 level. The price action trying to hold at this level continues to signal uncertainty en terms of technical indicators.
The Chaikin Money Flow (CMF) indicator remained more stable compared to the volatile price movements and moved around the zero line, indicating that there was no strong liquidity outflow en the market. This suggests that price movements are largely driven por futures trading and that spot buyers are not exerting aggressive selling pressure. However, this data alone may not be enough to determine the direction of the market. Momentum and Relative Strength Index (RSI) indicators suggest that the price action is still weak, signaling a continuation of the downtrend. The RSI’s continued downward movement suggests that buyers are not strong enough en the market for the time being and selling pressure continues. Momentum also remains weak, making it difficult for the price to set a clear direction at the current support level. In addition, the equalization of tenkan and kijun levels, which are important components of the Ichimoku indicator, signals that the market has entered a period of uncertainty. This indicates that the direction of the price is not clearly defined and the balance of buyers and sellers has not yet shifted to one side. A strong breakout or divergence from these levels will be required to determine the direction of the market.
Overall, the fact that the price continues to remain at the critical $2.02 support level and the CMF indicator is not generating negative signals suggests that a possible reversal move could take place. However, if the weakness en the RSI and momentum indicators persists and the $2.02 support is broken, selling pressure is likely to continue and the downtrend is likely to deepen. Therefore, whether XRP can hold the $2.02 level en the short term will be a critical factor.
Supports 2.0201 – 1.8932 – 1.6309
Resistances 2.2154 – 2.3330 – 2.4940
SOL/USDT
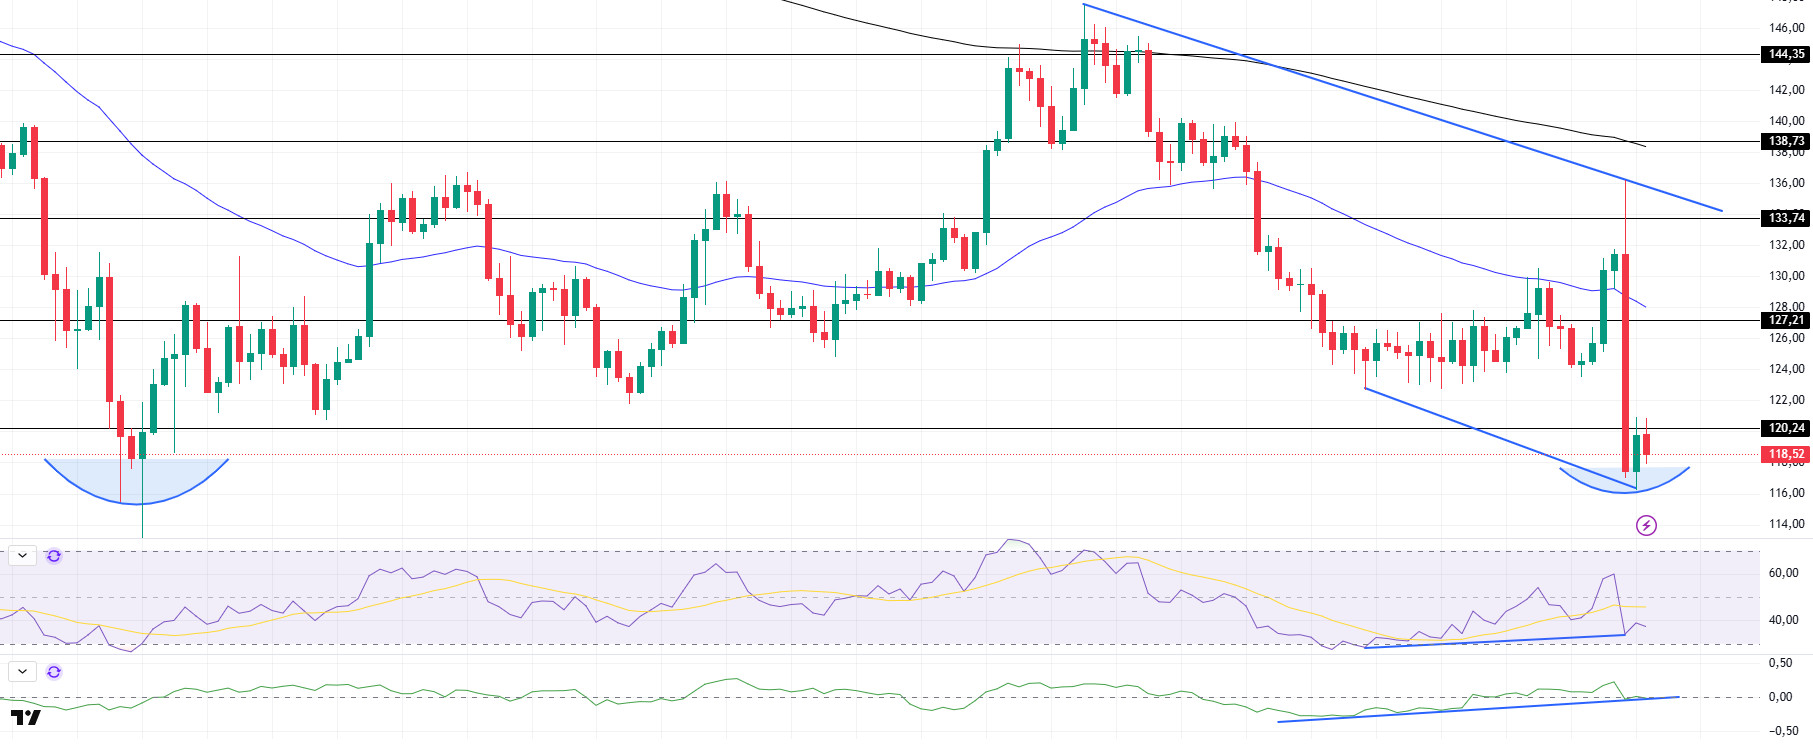
Grayscale has applied to convert its Digital Large Cap Fund into an ETF that will also include SOL. On the other hand, $18.66 million was liquidated en the long position en the last 24 horas.
SOL has been bearish since our analysis yesterday, keeping pace with the crypto market after Trump’s statements el tariffs. The asset continued to continue the downtrend that started el March 25. As of now, a double bottom formation has formed. This should be taken into consideration. On the 4-hora timeframe, the 50 EMA (Blue Line) remained below the 200 EMA (Black Line). This could deepen the decline further en the medium term. At the same time, the price is moving below the two moving averages again. When we analyze the Chaikin Money Flow (CMF)20 indicator, it is en the neutral zone, but the fact that the daily volume is positive indicates that CMF has a high potential to move back into positive territory. On the other hand, the uptrend en our CMF indicator, which started el March 29, continues and is currently testing the trend as support. However, the Relative Strength Index (RSI)14 indicator retreated to the mid-level of the negative zone. In addition, there is a bullish mismatch. This could be a bullish harbinger. The $138.73 level appears as a place of resistance en the rises driven por the upcoming macroeconomic data and the news en the Solana ecosystem. If it breaks here, the rise may continue. In case of retracements due to the opposite reasons or profit sales, the support level of $ 120.24 can be triggered. If the price comes to these support levels, a potential bullish opportunity may arise if momentum increases.
Supports 110.59 – 100.34 – 92.82
Resistances 120.24 – 127.21 – 133.74
DOGE/USDT
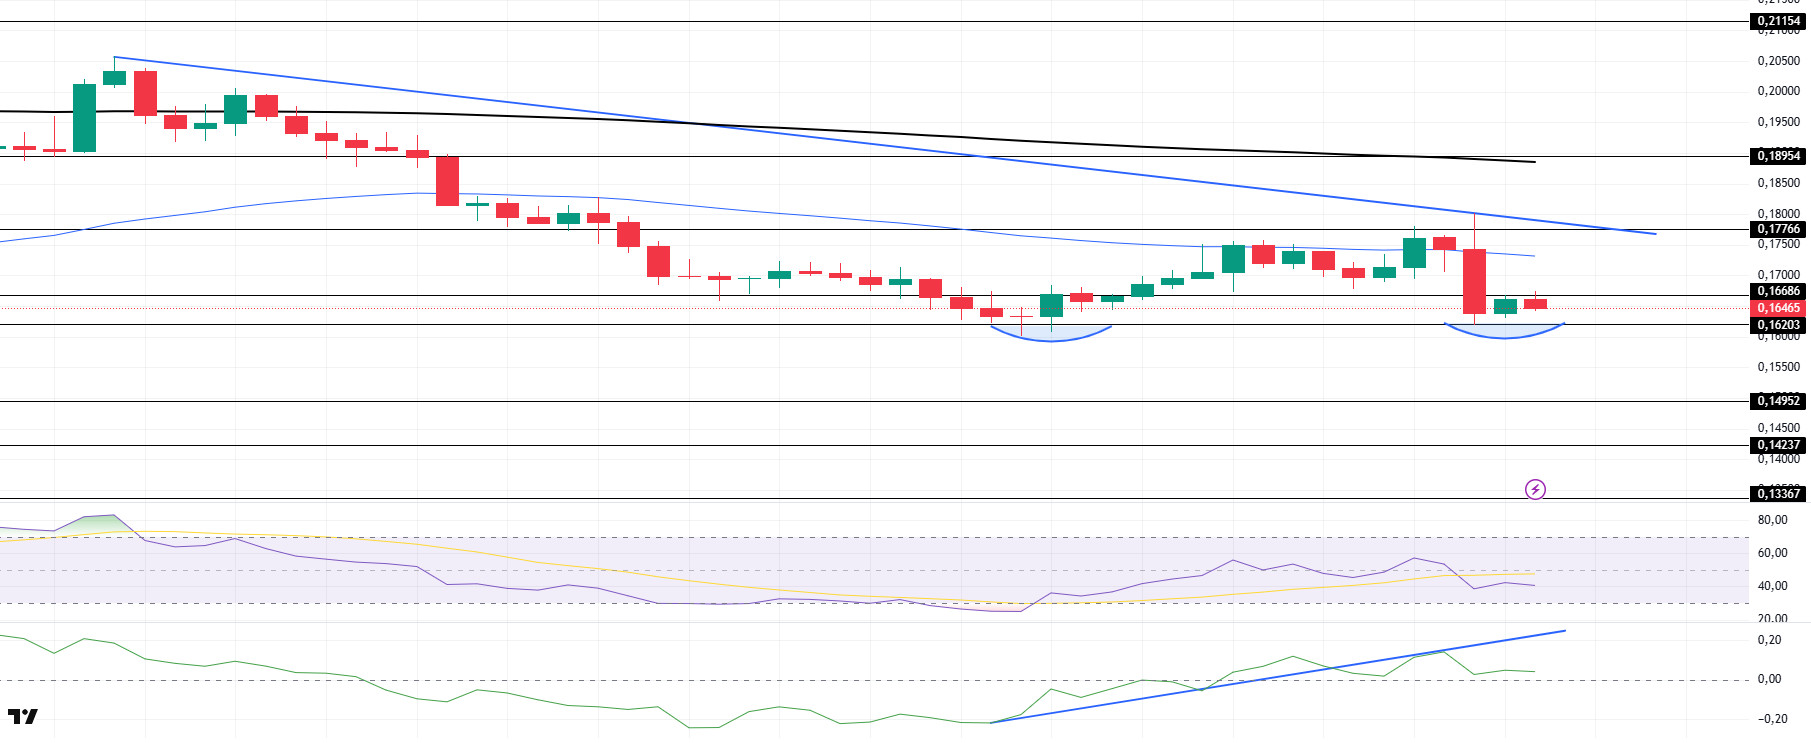
DOGE has fallen since our analysis yesterday, keeping pace with the crypto market after Trump’s announcement el tariffs. The asset tested the downtrend that started el March 26 as resistance but failed to break it, losing 8% from there and testing the strong support at $0.16203. Also, the double bottom formation should be taken into account. This could be a bullish harbinger. On the 4-hora timeframe, the 50 EMA (Blue Line) remains below the 200 EMA (Black Line). This could mean that the decline could deepen en the medium term. However, the price started to price below the two moving averages again. The Chaikin Money Flow (CMF)20 indicator is en positive territory. In addition, the fact that the 24-hora volume is el the plus side may increase inflows, allowing CMF to move into positive territory. However, after yesterday’s decline, CMF also broke the uptrend that started el March 31. On the other hand, Relative Strength Index (RSI)14 shifted from positive to neutral territory and failed to break the selling pressure. The $0.18954 level stands out as a very strong resistance point en the rises due to political reasons, macroeconomic data and innovations en the DOGE coin. In case of possible retracements due to political, macroeconomic reasons or due to negativities en the ecosystem, the $ 0.16203 level, which is a strong support place, is an important support place. If the price reaches these support levels, a potential bullish opportunity may arise if momentum increases.
Supports 0.16203 – 014952 – 0.14237
Resistances 0.16686 – 0.17766 – 0.18954
Legal Notice
The investment information, comments and recommendations contained herein do not constitute investment advice. Investment advisory services are provided individually por authorized institutions taking into account the risk and return preferences of individuals. The comments and recommendations contained herein are of a general nature. These recommendations may not be suitable for your financial situation and risk and return preferences. Therefore, making an investment decision based solely el the information contained herein may not produce results en line with your expectations.
