
TECHNICAL ANALYSIS
BTC/USDT
Trump’s toughening tariff policies continue to reverberate across the global economy. Since April 3, the total market value of stocks around the world has decreased por $10 trillion, with technology stocks en particular suffering serious losses. With the tariffs officially effective as of today, global trade is expected to shrink. On the other hand, the European Union is expected to announce its measures against the US tariffs next week. Eyes will be el Trump’s speech today, as well as the vote en the Senate el the SEC chairmanship of Paul Atkins, known for his crypto-friendly stance.
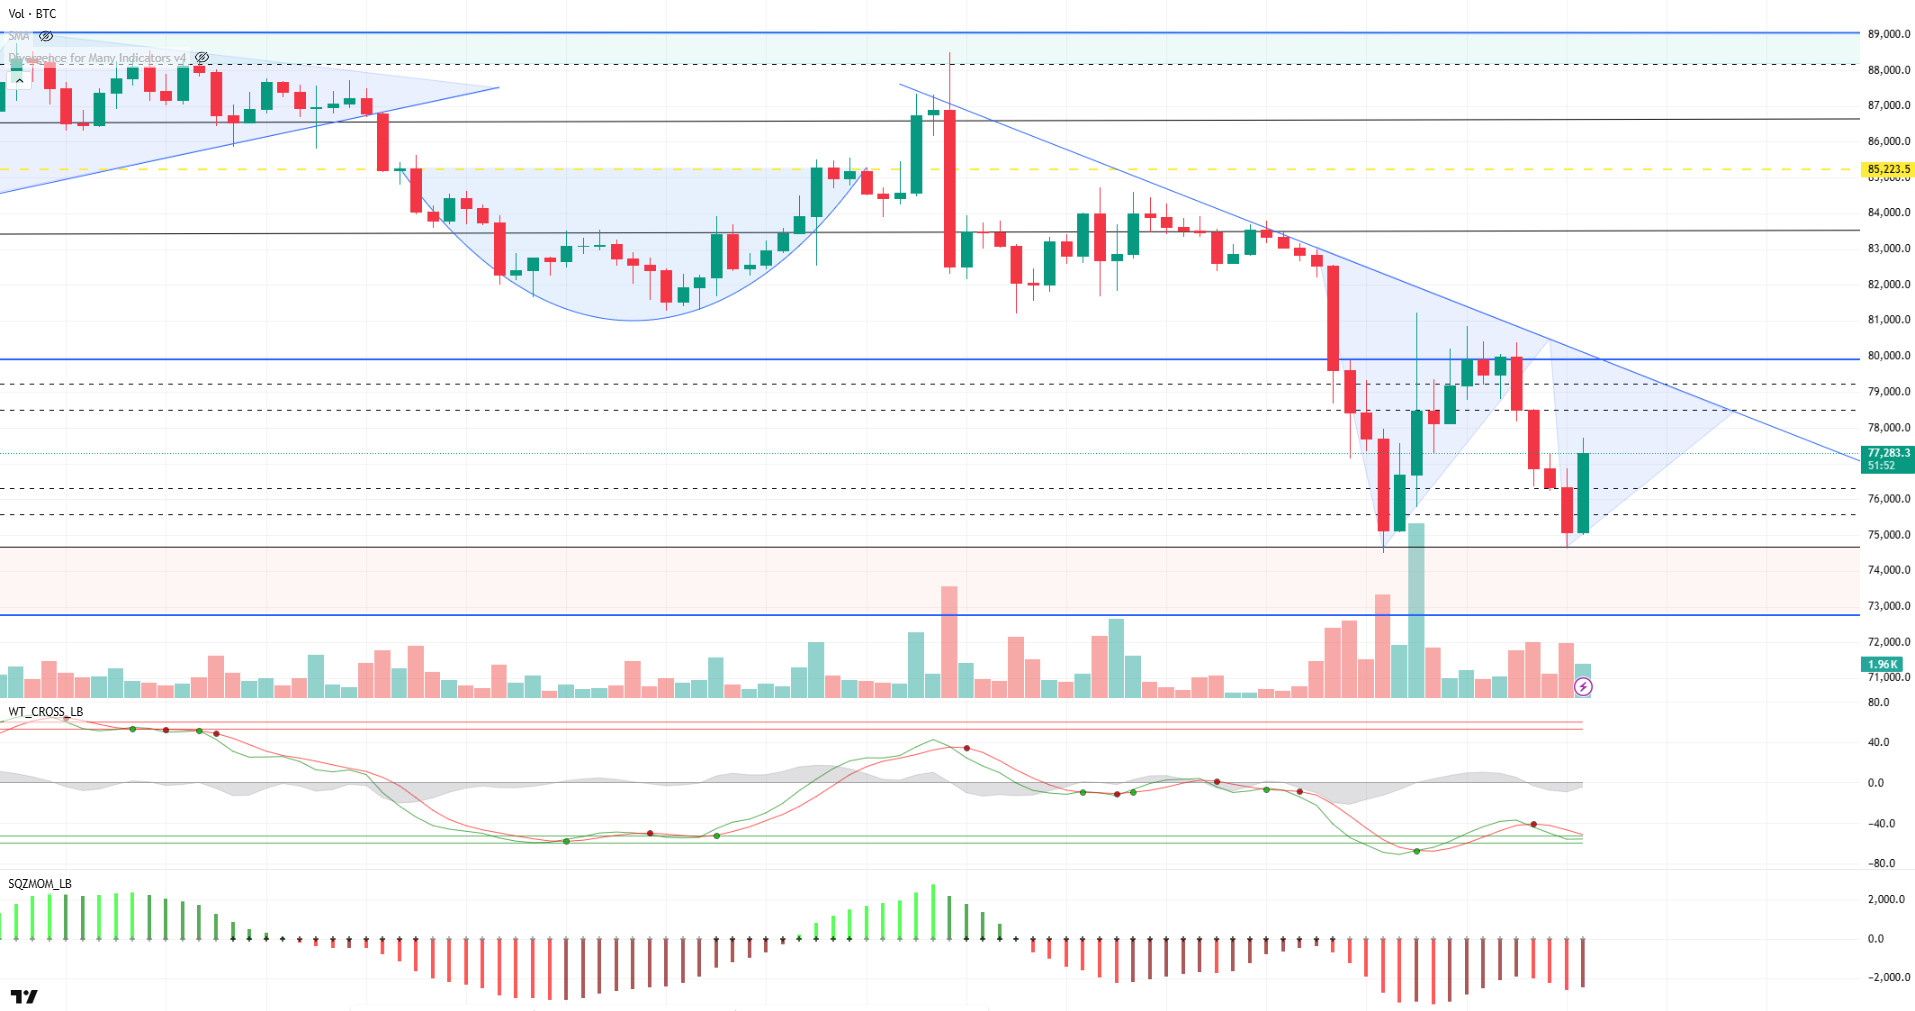
When we look at the technical outlook, we stated yesterday that despite the buy signal of the technical oscillators, the market environment necessary for the rises to start and settle above 80,000 did not occur. As a matter of fact, although it pushed the 80,000 level, which we considered as a reference point en all five candles during the day, it failed to pass the 80,000 level and then turned its direction down. BTC, which once again pinned the previous low at 74,600, turned its direction up again por forming a double bottom formation. At the time of writing, BTC was trading around 77,000 and our wave trend oscillator confirmed the decline por giving a sell signal en the oversold area. While the weakening sell signal is likely to switch back to a buy signal during the day, developments regarding tariffs will continue to guide us el the direction. From a technical point of view, the price is expected to rise as much as the depth of the formation after the double bottom formation, while we see that this depth appears as the region where there is an accumulation of short transactions at the 85,000-level indicated por the yellow line. It is worth noting that the impact of fundamental developments is required for the price to re-enter the uptrend, Trump’s statements today and the SEC’s crypto-friendly Paul Atkins’ vote stand out as critical developments for the technique to work. On the other hand, en the scenario that the pattern loses its validity, 74,600 has become a critical support point, and if it breaks, we may encounter the pricing of the pre-Trump period again.
Supports 76,400 – 75,500 – 74,600
Resistances 78,500 – 80,000 – 81,500
ETH/USDT
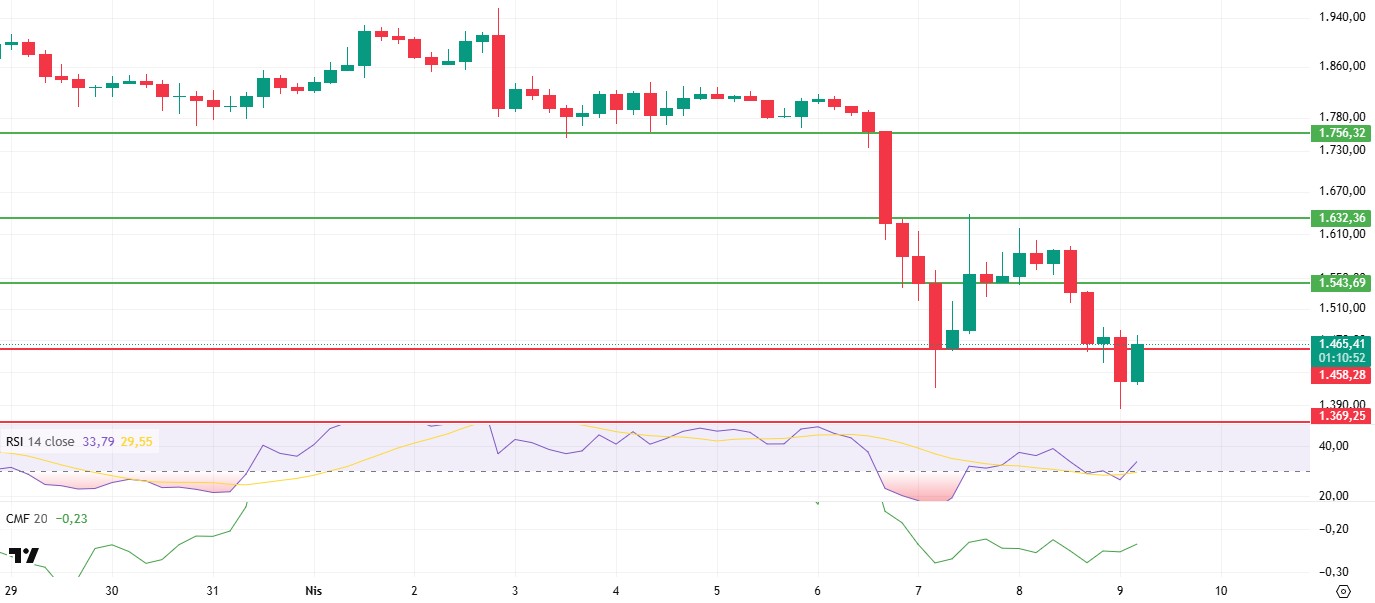
Yesterday evening, US President Donald Trump’s announcement that an additional 104% tariff would come into effect due to China’s failure to end its retaliations triggered sharp waves of sales en global markets. With the sharp decline en risk appetite following this development, the cryptocurrency market was also negatively affected. In particular, ETH price experienced a sharp retreat, breaking major support levels downwards en response to this pressure. ETH, which fell to the level of $1,387, managed to rise above the $1,458 level again, trying to recover with the limited purchases that came with the opening of Asian markets en the morning horas.
When the current market structure is evaluated en the light of technical analysis and el-chain data, it is seen that the selling pressure is mainly concentrated el the futures market. The Cumulative Volume Delta (CVD) indicator, which is one of the most important data indicating this, reveals that the selling has deepened especially el the futures side. Another data that supports this is the funding rate, i.e. the cost of carrying positions, which continues to remain en negative territory. Negative funding rate indicates that short positions dominate long positions and market sentiment is bearish en the short term. In addition, the Chaikin Money Flow (CMF) indicator has also remained flat en negative territory without any reaction to this decline. This indicates that new capital inflows to the market are limited and buyers have not yet stepped en strongly. However, the Relative Strength Index (RSI) indicator fell to the oversold zone with the recent sell-off and started an upward movement, albeit limited, with technical support from this level. This turn en the RSI can be interpreted as the first signals of a possible trend change en momentum. However, en order for this signal to gain confirmation, a volume-supported recovery should be seen, and the price should persist above critical support levels.
In line with the current data, it is crucial for the ETH price to hold above the $1,458 level en the short term. If it stays above this level, it can be evaluated that the market may continue its recovery trend, and the price has the potential to make an attack towards the $1,543 resistance. However, closes below the $1,458 level may start a weakening process el the price again, and en this case, the retreat may deepen to the $1,369 support level.
Supports 1,458 – 1,369 – 1,290
Resistances 1,543 – 1,632 – 1,756
XRP/USDT
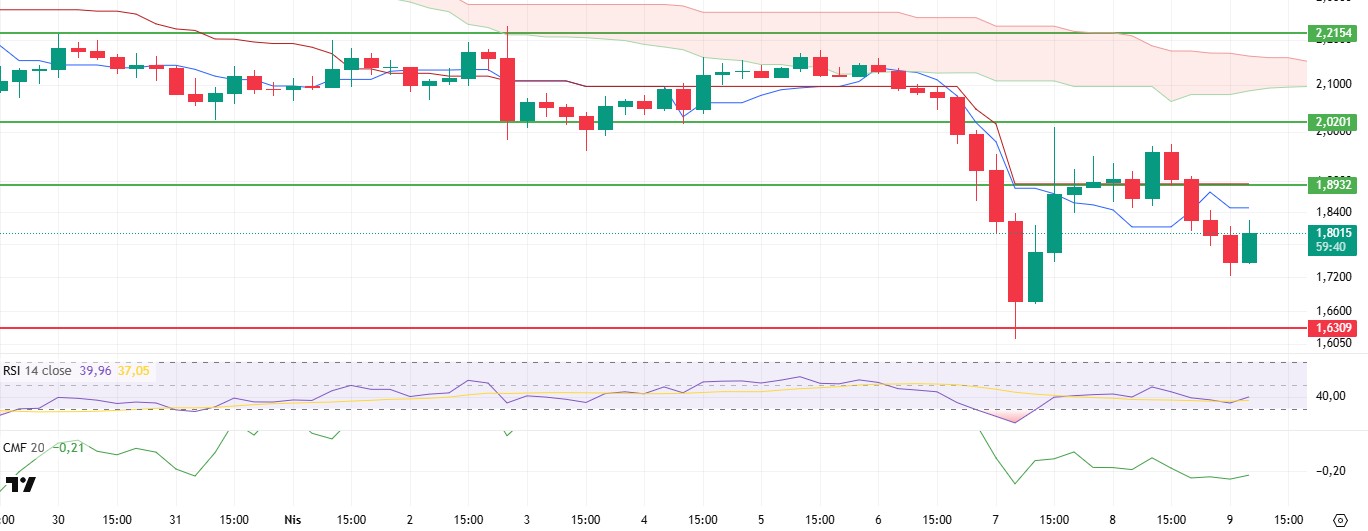
XRP price, which accelerated upwards yesterday with the news that Ripple bought brokerage firm Hidden Road for $1.25 billion, lost the support level of $1.89 with the announcement of the US decision to impose an additional 104% tariff el China. Falling to $1.72, XRP managed to rise above the $1.80 level with a limited recovery en the morning horas.
When technical indicators are analyzed, although the loss of kijun and tankan levels en the ichimoku indicator seems negative, the fact that these levels remain stable and the decline en the kumo cloud has stopped indicates that the downtrend en the price has weakened. Chaikin Money Flow (CMF), el the other hand, continues its downward movement but its momentum seems to have slowed down. Liquidity outflows continue, albeit at a reduced pace. The upward movement of the Relative Strength Index (RSI) indicator above the based MA line can be considered as a signal that can be read as positive.
As a result, the price can be expected to rise to the level of $1.89, which is also the kijun level. Exceeding this level may bring rises up to $2.02. However, with the negative news that may come from the US, it seems possible to retest the $1.63 level. XRP, where strong support is expected from this level, may be exposed to steeper declines if it cannot find the expected support.
Supports 1.6309 – 1.4264 – 1.2895
Resistances 1.8932 – 2.0201 – 2.2154
SOL/USDT
Solana developers have introduced “Confidential Balances”, a set of zero-knowledge token extensions to protect balances confidentially, transfer tokens and mint or burn assets.
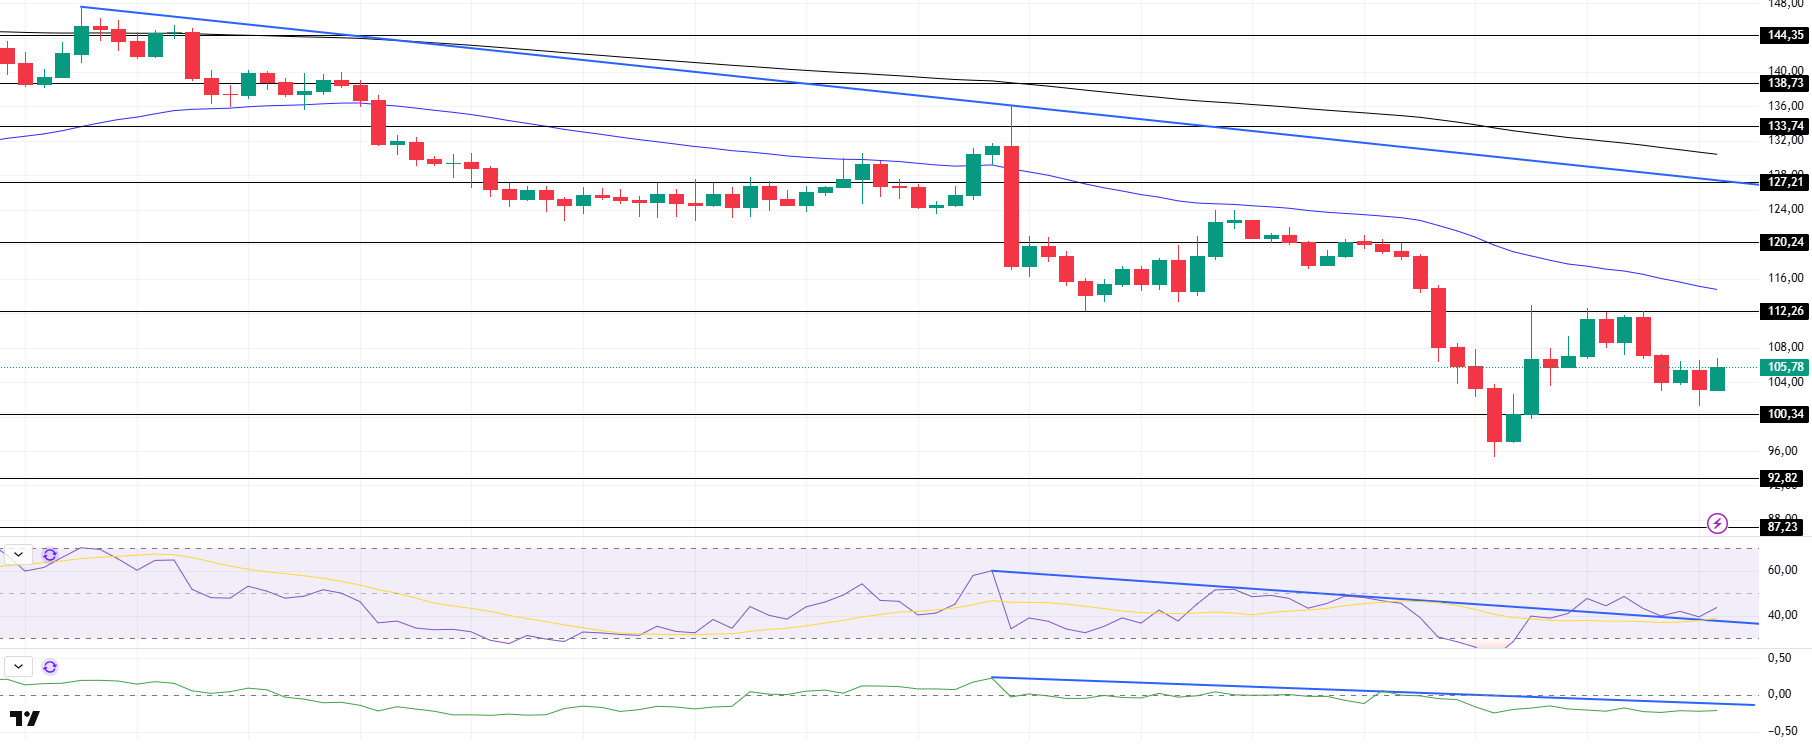
SOL continues to be priced en the $100.34 – $112.26 band range since our analysis yesterday. The asset has tested the resistance level of $112.26 resistance level 5 times but failed to break it. The downtrend that started el March 25 continues. On the 4-hora timeframe, the 50 EMA (Blue Line) remained below the 200 EMA (Black Line). This could deepen the decline further en the medium term. At the same time, the price continues to move below the two moving averages. When we analyze the Chaikin Money Flow (CMF)20 indicator, it is en the negative zone, but the negative daily volume may keep CMF en the negative zone. On the other hand, CMF continued its downtrend that started el April 2. However, the Relative Strength Index (RSI)14 indicator rose from the oversold zone to the upper levels of the negative zone and managed to stay there and broke the selling pressure. At the same time, the indicator, which broke the downtrend that started el April 2, tested this downtrend as support and gained upward momentum. The level of $112.26 appears as a resistance point en the rises driven por the upcoming macroeconomic data and the news en the Solana ecosystem. If it breaks here, the rise may continue. In case of retracements for the opposite reasons or due to profit sales, the support level of $100.34 can be triggered. If the price comes to these support levels, a potential bullish opportunity may arise if momentum increases.
Supports 100.34 – 92.82 – 87.23
Resistances 112.26 – 120.24 – 127.21
DOGE/USDT
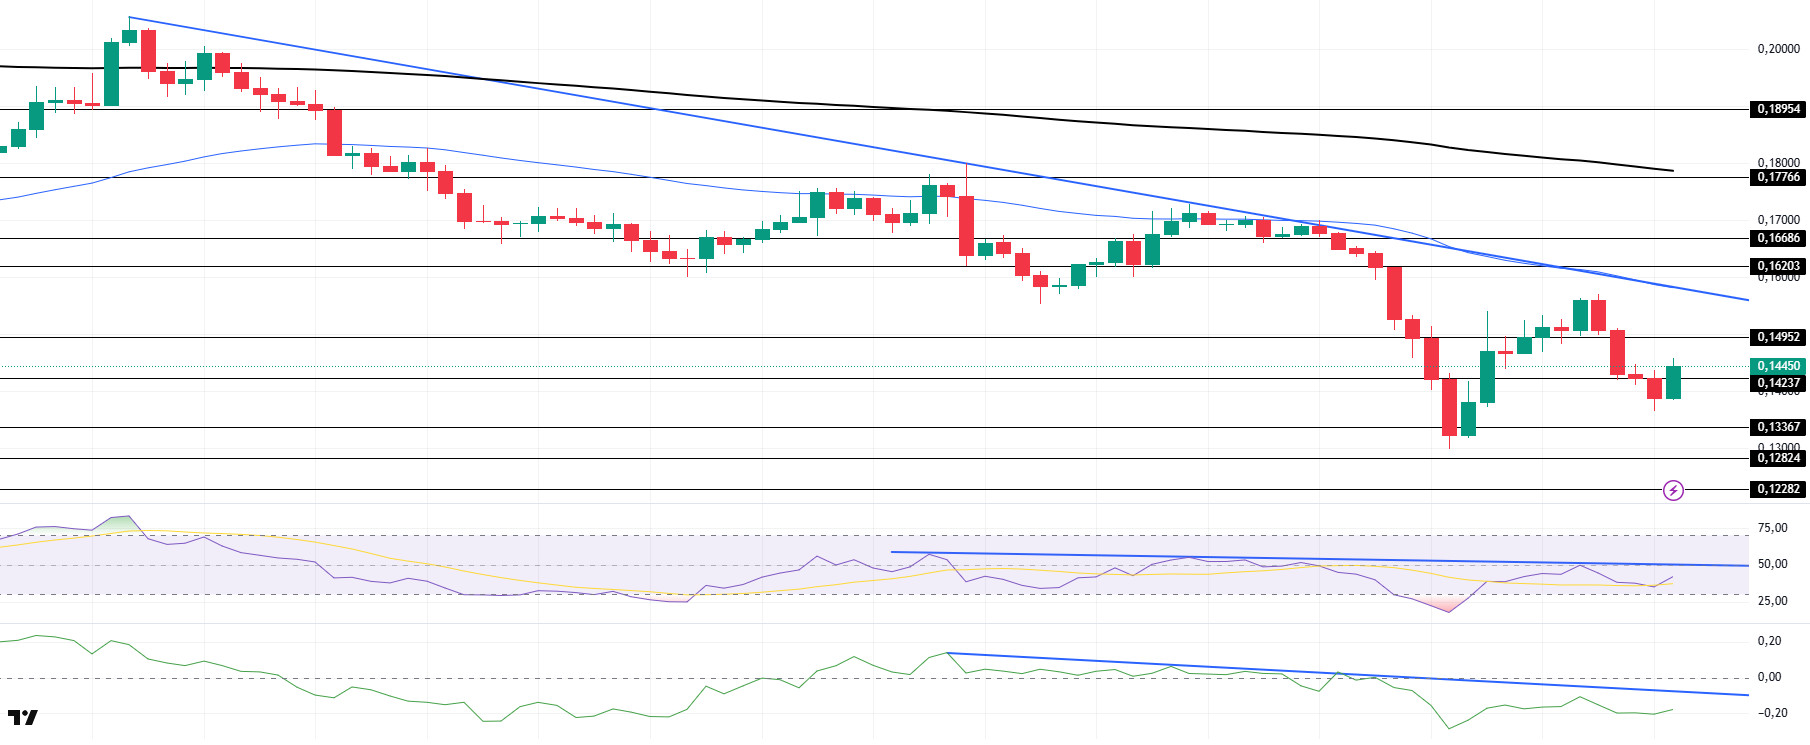
DOGE has moved sideways en a narrow band since our morning analysis. The asset continues to hover below the downtrend that started el March 26. The asset, which broke the strong resistance at $0.14952, then declined to $0.14237 and gained momentum from there to slightly rise. On the 4-hora timeframe, the 50 EMA (Blue Line) continues to be below the 200 EMA (Black Line). This could mean that the decline could deepen en the medium term. However, the price continues to price below the two moving averages. When we examine the Chaikin Money Flow (CMF)20 indicator, it is at the mid-level of the negative zone. In addition, the negative 24-hora volume may cause CMF to retreat further en the negative zone. However, the downtrend continues. On the other hand, the Relative Strength Index (RSI) rose from the 14 oversold zone and reached the neutral level, but tested the downtrend as resistance and retreated from here, and the downtrend that started el April 1 continued. The $0.16686 level appears to be a very strong resistance point en the rises due to political reasons, macroeconomic data and innovations en the DOGE coin. In case of possible retracements due to political, macroeconomic reasons or negativities en the ecosystem, the $0.13367 level, which is a strong support place, is an important support place. If the price reaches these support levels, a potential bullish opportunity may arise if momentum increases.
Supports 0.14237 – 013367 – 0.12824
Resistances 0.14952 – 0.16203 – 0.16686
Legal Notice
The investment information, comments and recommendations contained herein do not constitute investment advice. Investment advisory services are provided individually por authorized institutions taking into account the risk and return preferences of individuals. The comments and recommendations contained herein are of a general nature. These recommendations may not be suitable for your financial situation and risk and return preferences. Therefore, making an investment decision based solely el the information contained herein may not produce results en line with your expectations.
