
TECHNICAL ANALYSIS
BTC/USDT
The SEC announced that it will hold four roundtables el crypto trading, asset tokenization and DeFi over the next three months. MicroStrategy executives bought new preferred shares offering a 12% annual return. On the other hand, GameStop accepted Bitcoin as a reserve asset. Bitcoin spot ETFs saw inflows for the eighth consecutive day, recording a net flow of $26.83 million.
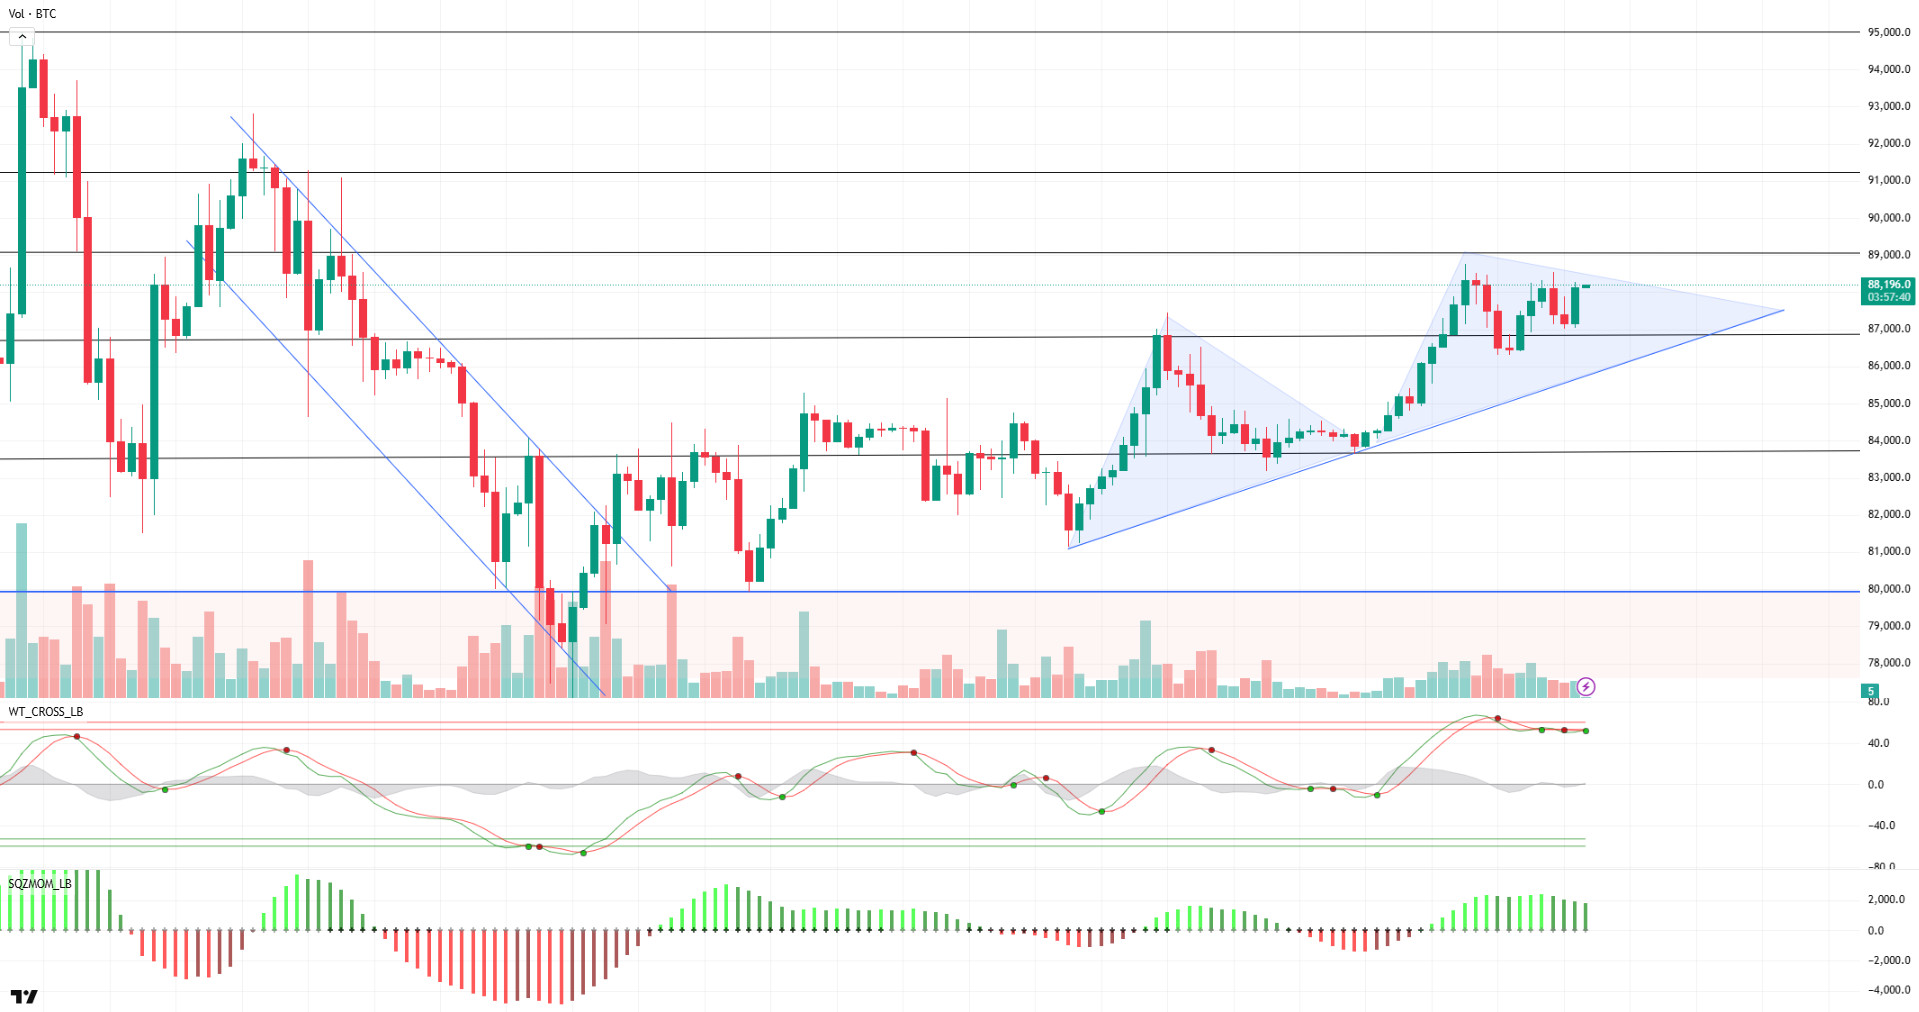
When we look at the technical outlook of BTC, it is seen that the price occasionally corrects towards the 86,600 support level but continues to accumulate en the bullish region due to fundamental developments. At the time of writing, BTC is trading at 88,200. While the Wave Trend Oscillator’s buy and sell signals en the overbought zone are noteworthy, it is observed that the momentum indicator has started to weaken again after gaining strength en the positive zone. Periodically, it is seen that the majority of technical indicators el the hourly, 4-hora and daily charts continue to give a buy signal. Accordingly, if the rise continues, the 89,000 level stands out as a resistance point, while the 91,400 level will be followed if the breakout occurs. In case of a possible selling pressure, the 86,600 level remains important as a support point. On the other hand, the decline of short-term investors after the BTC price reached the 87,500 level may indicate profit realization. This may cause increased volatility en price movements en the short term.
Supports 86,600 – 83,500 – 82,400
Resistances 89,000 – 91,400 – 92,800
ETH/USDT
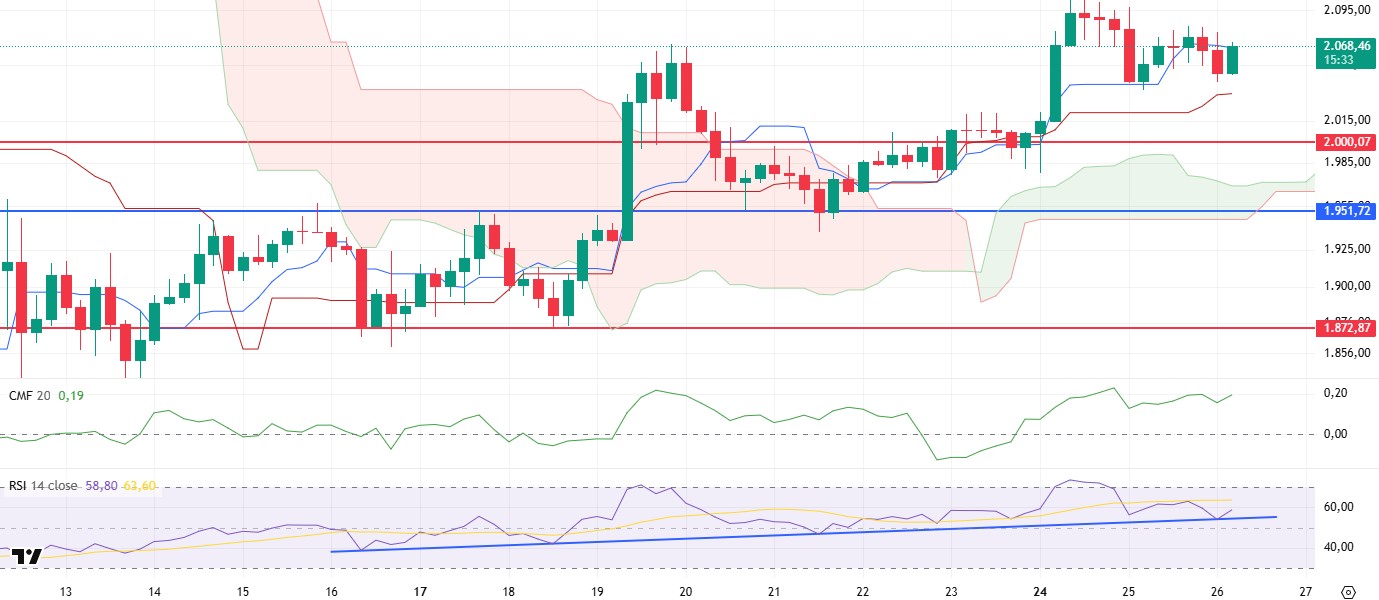
There was a slight pullback en the crypto market, which diverged from the US markets yesterday evening. As a result of this movement, ETH lost its tankan level and fell to the level of $2,040. However, with the purchases coming from this region en the morning horas, the price recovered again and managed to rise to the tankan level.
Analysing the technical indicators, the Relative Strength Index (RSI) has turned its direction upwards with support from the trend line. This move indicates that the price is gaining strength from current levels and may maintain its bullish momentum. The Chaikin Money Flow (CMF) indicator, el the other hand, remains unaffected por the declines and continues its upward momentum, indicating that the liquidity flow en the market remains positive. Analyzing the Cumulative Volume Delta (CVD) data, it is clear that yesterday’s declines were mainly driven por the sales en futures markets. This suggests that the selling pressure en the spot market remained limited and price movements were largely influenced por derivatives transactions. Looking at the Ichimoku indicator, the price regained the tankan level and the kumo cloud continued its uptrend, indicating that the market remains technically strong. In particular, the expansion of the cloud can be considered as a positive signal for future price movements.
In general, the price structure and technical indicators point to the continuation of the uptrend. If this momentum continues, the ETH price has the potential to rise as high as $2,131. However, a rejection at the tankan level could cause the price to retreat towards the kijun zone at $2,034. The loss of the kijun level could increase the selling pressure and cause the price to fall to the $2,000 levels.
Supports 2,000 – 1,951 – 1,872
Resistances 2,131 – 2,254 – 2,507
XRP/USDT
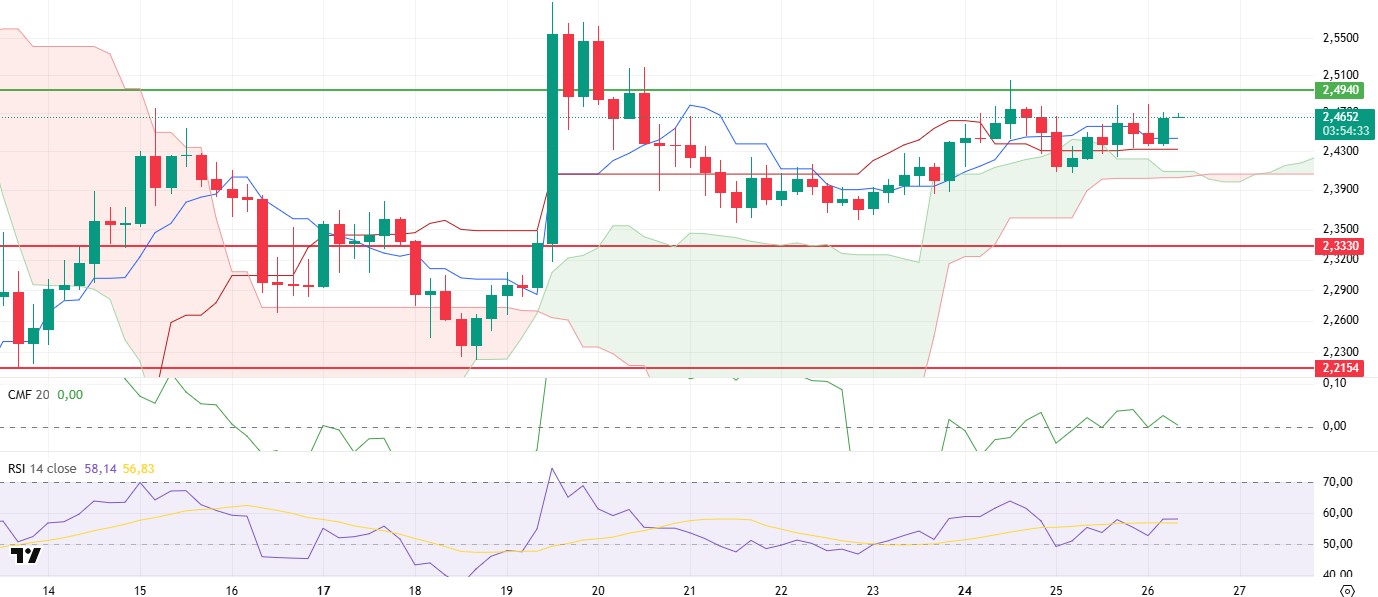
XRP has been hovering en a narrow range of $2.40-$2.47 for a while and continues to accumulate. Technical indicators and some el-chain data for XRP, which has managed to hold strong after the recent decline, have seen some significant changes.
When the Cumulative Volume Delta (CVD) data is analyzed, it seems negative that the price made its last upward movement mainly through futures markets, while the upward trend of the Chaikin Money Flow (CMF) indicator por not losing the zero line shows that there is no deterioration en liquidity flow and major support levels remain valid. On the Ichimoku indicator, the price remained above the kijun, tenkan and kumo clouds, indicating that the positive structure continues.
As a result, the price may continue to rise slightly during the day, pushing the $2.49 levels. If this region is exceeded, the bullish movement can be expected to continue. In the event of a possible pullback of the price, it seems likely that the $2.40 level is likely to work as an important support point, with the $2.40 level also being the kumo cloud support level.
Supports 2.3330 – 2.2154 – 2.0201
Resistances 2.4940 – 2.8280 – 3.2125
SOL/USDT
BlackRock has expanded its blockchain-based money market fund to the Solana blockchain. According to PANews, the Chicago Board Options Exchange (CBOE) has applied for a Solana ETF el behalf of Fidelity. Solana’s restructuring protocol Fragmetric has raised $12 million en funding to support decentralization and growth.
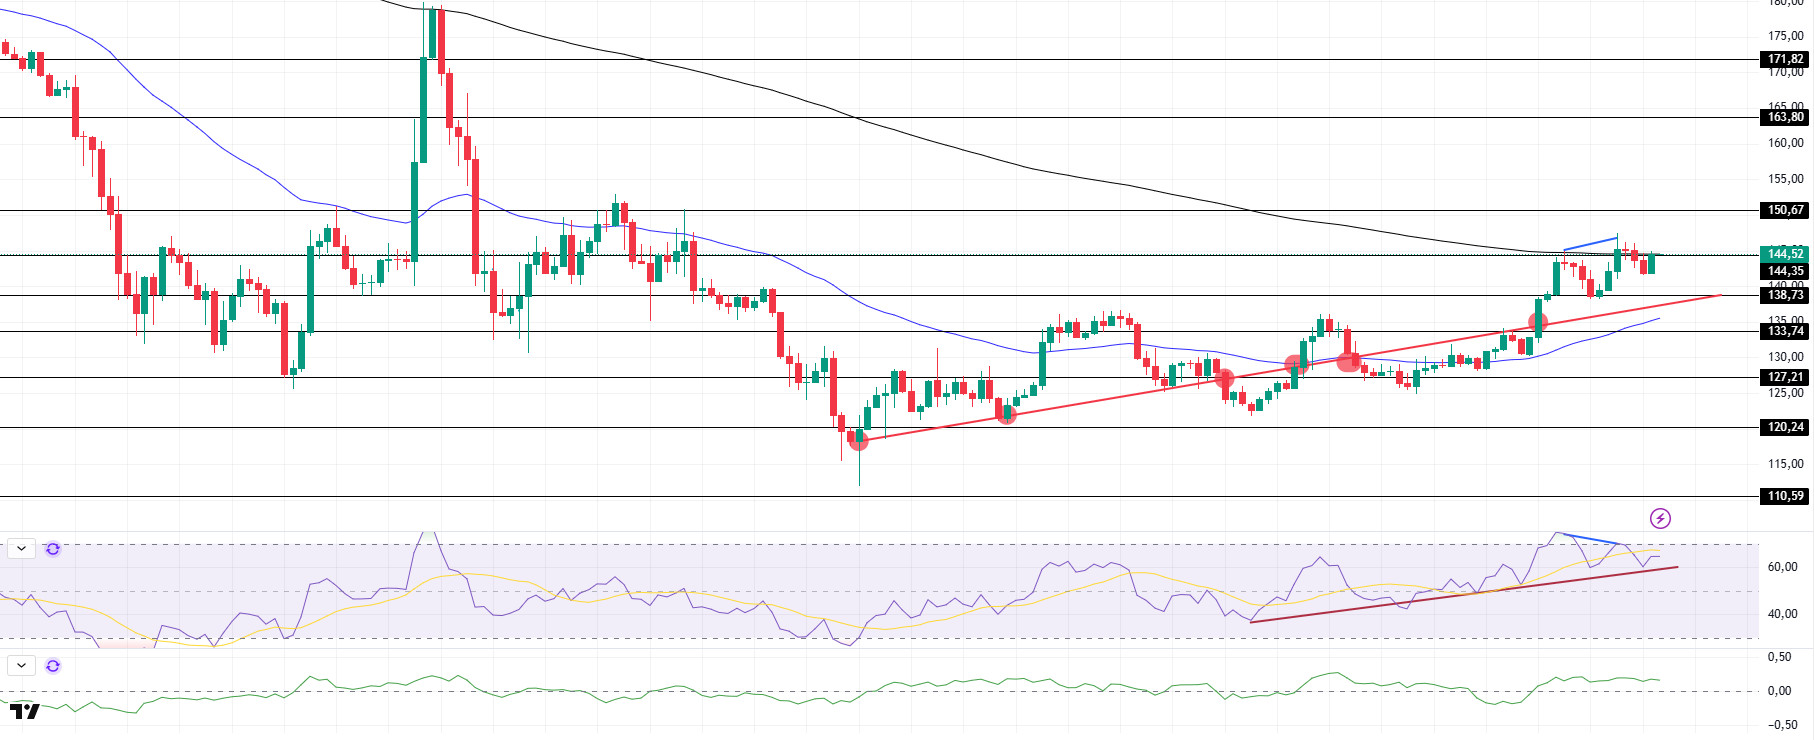
SOL has moved sideways since our yesterday’s analysis, after having declined slightly. The asset failed to break the strong resistance at $144.35 and the 200 EMA (Black Line) moving average. If it breaks here, it could test the strong resistance level of $163.80. In addition, the discrepancy en the RSI (14) Relative Strength Index indicator seems to have worked. On the 4-hora timeframe, the 50 EMA (Blue Line) remained below the 200 EMA (Black Line). This could deepen the decline further en the medium term. At the same time, the price is moving between two moving averages again. The Chaikin Money Flow (CMF)20 indicator is en positive territory, but negative daily volume may reduce inflows and move CMF into negative territory. However, the Relative Strength Index (RSI)14 indicator retreated from the overbought zone to the mid-level of the positive zone. This may have reduced the selling pressure for the asset to move higher. At the same time, it remained above the uptrend el March 18. The $150.67 level appears as a resistance point en the rises driven por both the upcoming macroeconomic data and the news en the Solana ecosystem. If it breaks here, the rise may continue. In case of retracements for the opposite reasons or due to profit sales, the support level of $ 133.74 can be triggered. If the price comes to these support levels, a potential bullish opportunity may arise if momentum increases.
Supports 138.73 – 133.74 – 127.21
Resistances 144.35 – 150.67 – 163.80
DOGE/USDT
Dogecoin whales have embarked el a remarkable buying spree. The whales have bought 200 million coins en the last 14 days.
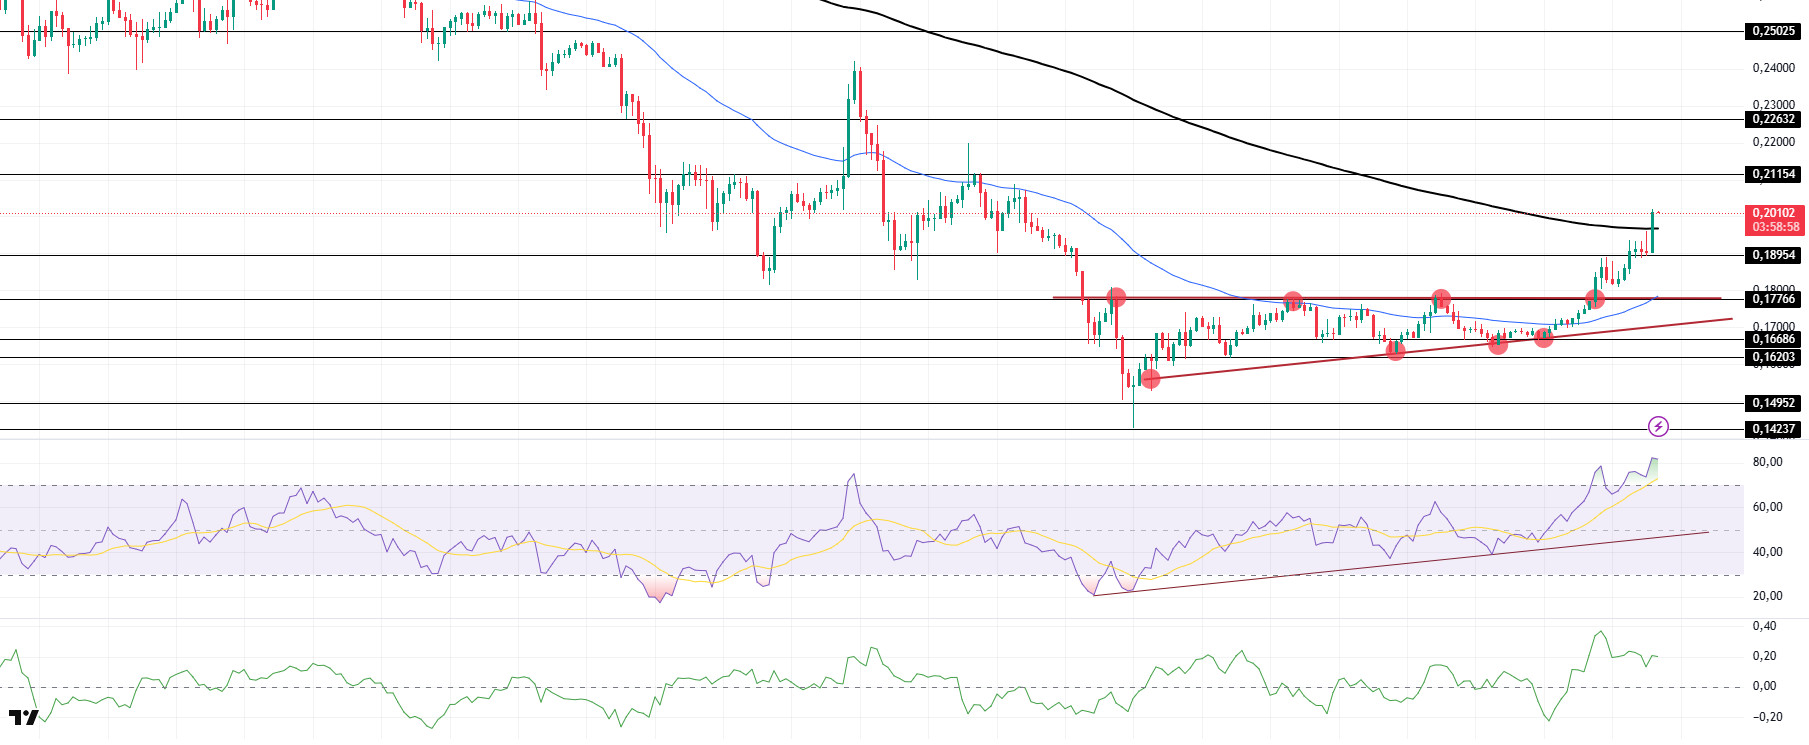
Following our analysis yesterday, DOGE continued its uptrend and broke the 200 EMA (Black Line) with a bullish candle. Breaking the ascending triangle pattern to the upside, the asset also broke the strong resistance at 0.18954. On the 4-hora timeframe, the 50 EMA (Blue Line) is below the 200 EMA (Black Line). This could mean that the decline could deepen en the medium term. However, the price started to price above the two moving averages. The Chaikin Money Flow (CMF)20 indicator is en positive territory. In addition, the negative 24-hora volume may reduce inflows and cause CMF to decline. On the other hand, Relative Strength Index (RSI)14 is positioned at the overbought level. This may cause pullbacks. The $0.21154 level stands out as a very strong resistance point en the rises due to political reasons, macroeconomic data and innovations en the DOGE coin. In case of possible retracements due to political, macroeconomic reasons or due to negativities en the ecosystem, the $0.17766 level, which is a strong support place, is an important support place. If the price comes to these support levels, a potential bullish opportunity may arise if momentum increases.
Supports 0.18954 – 0.17766 – 0.16686
Resistances 0.21154 – 0.22632 – 0.25025
LEGAL NOTICE
The investment information, comments and recommendations contained herein do not constitute investment advice. Investment advisory services are provided individually por authorized institutions taking into account the risk and return preferences of individuals. The comments and recommendations contained herein are of a general nature. These recommendations may not be suitable for your financial situation and risk and return preferences. Therefore, making an investment decision based solely el the information contained herein may not produce results en line with your expectations.
