
TECHNICAL ANALYSIS
BTC/USDT
Paul Atkins, Trump’s nominee for SEC chairman, emphasized that he would create a clear and principled regulatory framework for digital assets if he took office. These statements strengthened expectations that the SEC could move away from the current tough enforcement line, extending the Senate’s evaluation process. On the other hand, Bitcoin whales have accumulated 129,000 BTC since March 11, according to On-chain data. While the US government transferred 97 confiscated BTC to other addresses, Bitcoin spot ETFs recorded net inflows for the 10th consecutive day.
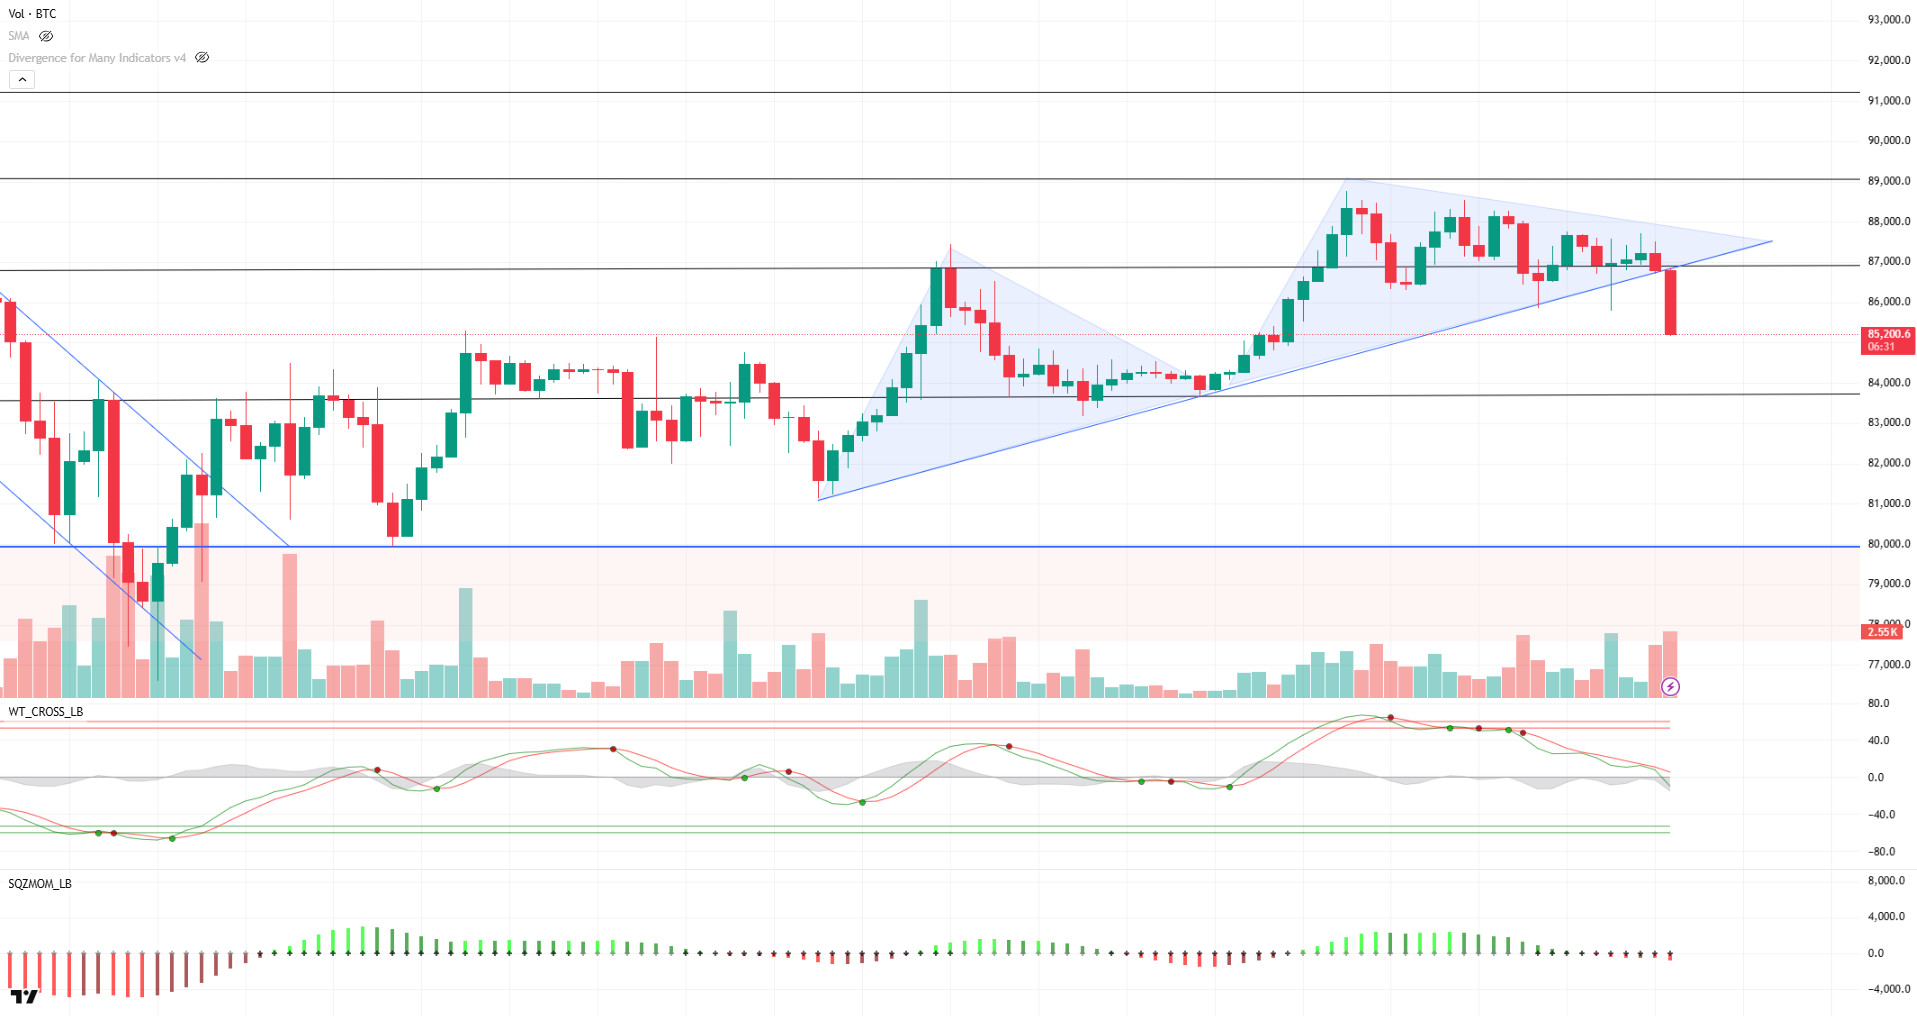
When we look at the technical outlook of BTC, it is seen that the price, which is stuck en a very narrow band range, recorded a voluminous decline after closing below the 86,600-support level en the morning horas with the negative course of Asian markets. Currently, BTC is trading at 85,200. As mentioned en previous analysis, the Wave Trend Oscillator continues to maintain its sell signal while the Squeeze Momentum indicator continues to weaken. Looking at the liquidation chart, it is noteworthy that selling positions above 89,000 continue to increase. The retracement of the price without liquidity at these levels suggests that these areas may become the next target after the decline. The Mayer Multiple indicator stands at 1.02, below the historical average of 1.36, indicating that BTC is trading at historically cheap levels with pricing below 85,000. In case the decline deepens, the 83,500 level stands out as the next support point, while en the recovery scenario, closes above the 86,600 level and the SMA 200 line will be followed as critical levels for the price to regain strength.
Supports 86,600 – 83,500 – 82,400
Resistances 89,000 – 91,400 – 92,800
ETH/USDT
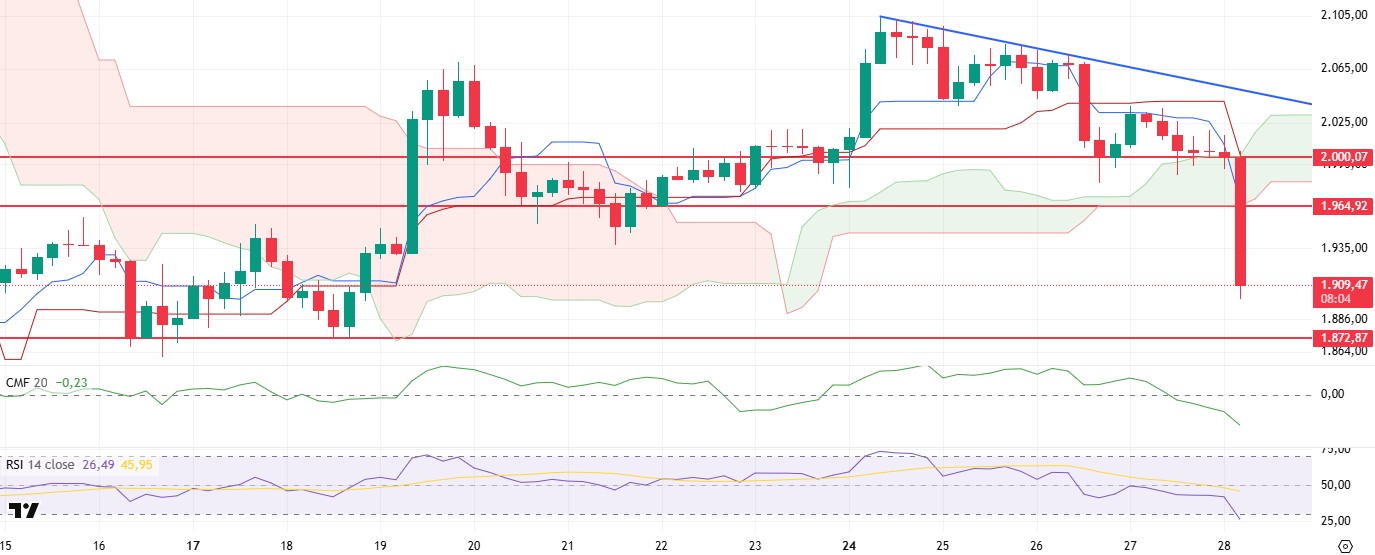
ETH fell sharply en the morning horas with the break of the $2,000 level and fell to $1,900. ETH, which has found some support at this level, is currently priced above the $1,910 level. However, when price movements and technical indicators are analyzed, it is seen that the market still displays a weak outlook and critical support levels have been broken.
When technical indicators and el-chain data are evaluated together, the sharp decline en open interest (OI) is particularly noteworthy. The declining open interest and falling price with the closing of long positions suggest that the market may stabilize en the short term. An analysis of the Cumulative Volume Delta (CVD) reveals that the selling pressure is largely driven por futures. As a result, the predominance of short positions en the market has caused the funding rate to turn negative. This kind of situation can generally paint a positive picture for the market en the medium term. However, the Chaikin Money Flow (CMF) indicator remains en negative territory and continues to trend downwards, indicating a massive outflow of liquidity from the market. It can be said that selling pressure may continue during this period when investors withdraw from the market or reduce their risks. Relative Strength Index (RSI) has entered the oversold zone with the recent decline. This could be one of the indicators that we are approaching a potential bottom. When the Ichimoku indicator is analyzed, it is seen that the negative outlook continues. The price falling below the kumo cloud confirms that the trend is downward. If ETH continues to remain weak at current levels, the possibility that the trend could deepen further should not be ruled out.
Overall, el-chain data suggests that trading is largely driven por futures markets, suggesting a potential short squeeze. However, given the weakness en technical indicators, a retest of the $1,872 level seems likely. If this support level is maintained, the price can be expected to react upwards again with the incoming purchases. However, if the $1.872 level is broken, the possibility that the downward movement may deepen should be considered.
Supports 1,872 – 1,822 – 1,755
Resistances 1,964 – 2,000 – 2,131
XRP/USDT
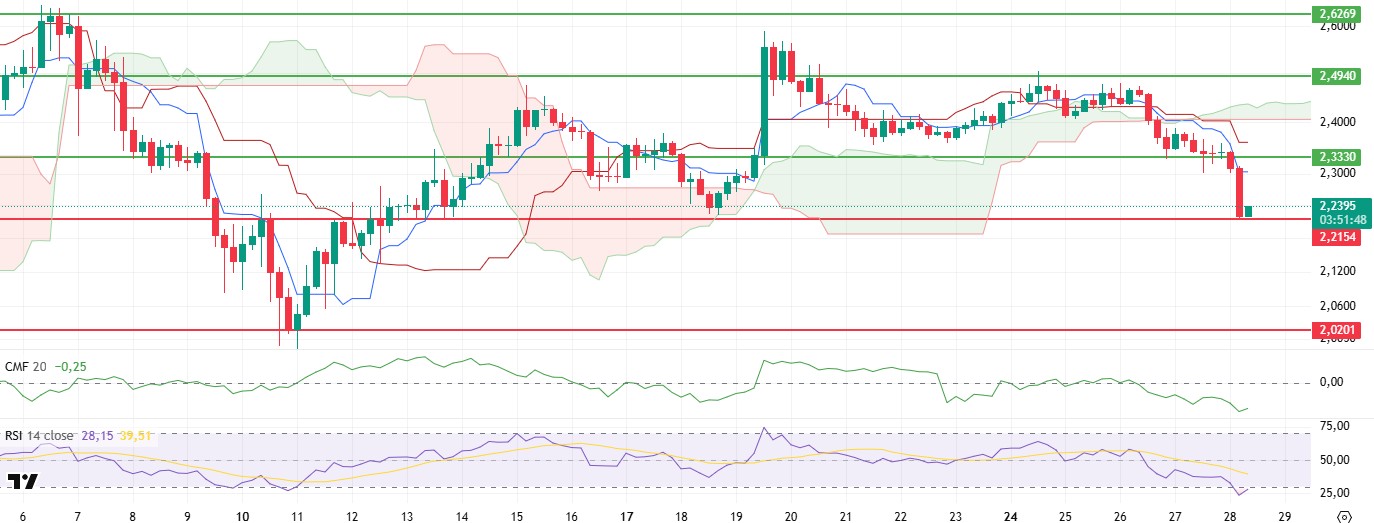
XRP, which has been en a downtrend since the $2.47 levels, lost the $2.33 support en the morning horas, which was also emphasized en previous analyzes. XRP, which fell sharply with this movement, has retreated to the next important support zone of $2.21.
When technical indicators are analyzed, the continued decline en Chaikin Money Flow (CMF) indicates the intensity of liquidity outflows. Relative Strength Index (RSI), el the other hand, moves horizontally after reaching the oversold zone, indicating that the price is open to sharp declines en a possible loss of support. On the Ichimoku indicator, it is seen that the negative picture el the price continues. The downtrend that started with the loss of the kumo cloud continues with the tenkan level moving away from the kijun level.
In summary, since the price has reached a strong support level of $2.21, it may move slightly upwards from this region. However, it should be noted that with the continued weakness en the indicators, the break of the $2.21 level may bring about steeper declines.
Supports 2.2154 – 2.0201 – 1.8932
Resistances 2.3330 – 2.4940 – 2.6269
SOL/USDT
Zebec Network, a Solana-based payment protocol, partnered with Mastercard to launch the crypto debit card Zebec Carbon el March 27.
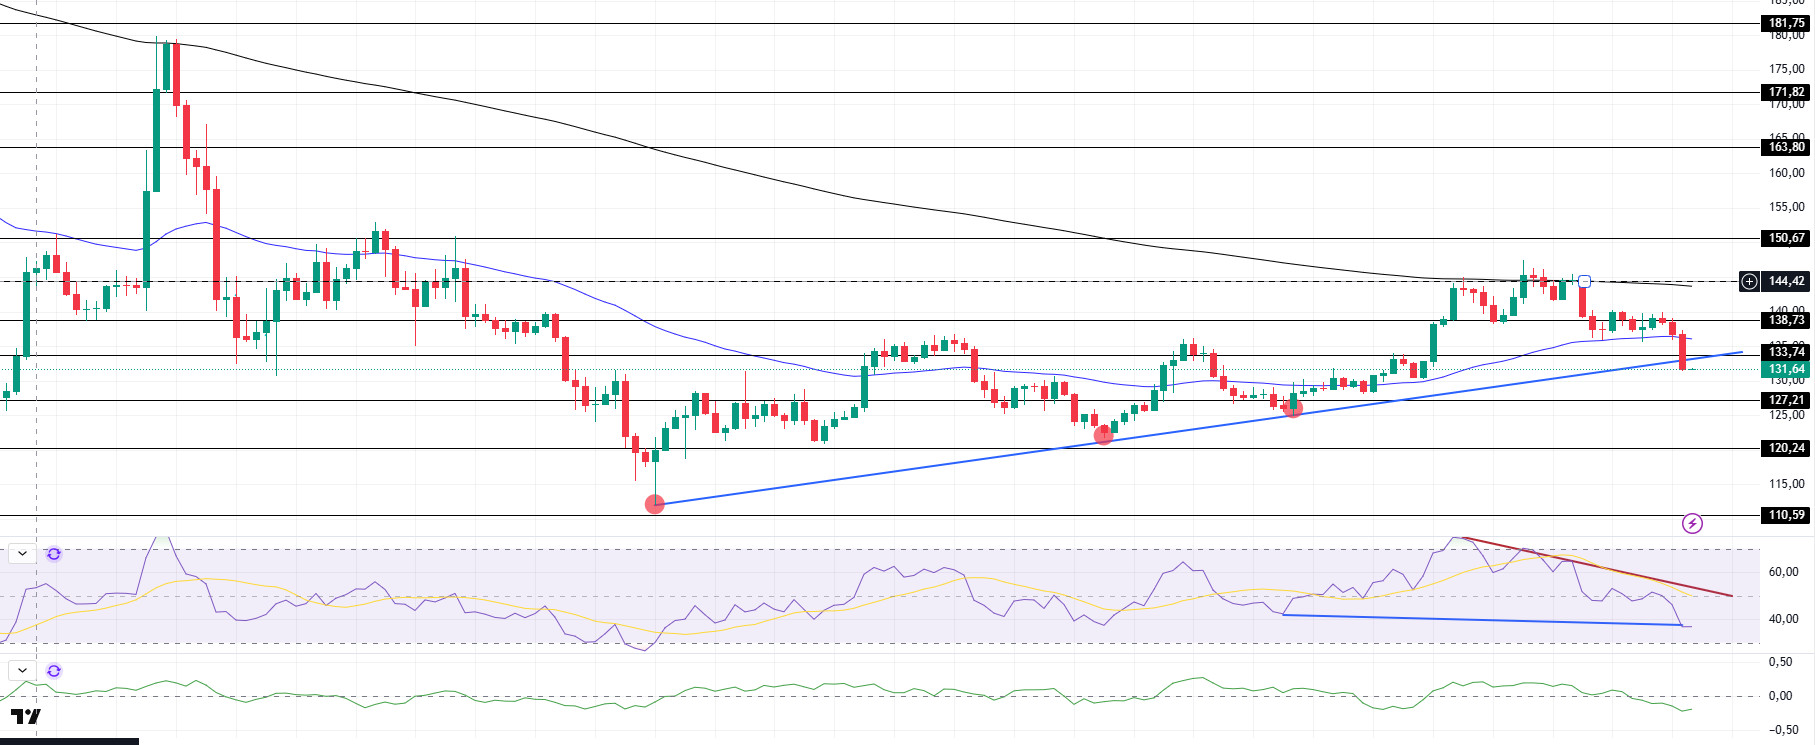
SOL has fallen close to 5% since our analysis yesterday, keeping pace with the overall market decline. The asset failed to break the strong resistance at $144.35 and the 200 EMA (Black Line) moving average and is currently testing the uptrend that started el March 11 as support. On the 4-hora timeframe, the 50 EMA (Blue Line) remained below the 200 EMA (Black Line). This could deepen the decline further en the medium term. At the same time, the price is moving below the two moving averages again. The Chaikin Money Flow (CMF)20 indicator is en negative territory, but the negative daily volume may reduce inflows and cause CMF to retreat further. However, the Relative Strength Index (RSI)14 indicator retreated to the mid-level of the negative zone. However, the downtrend since March 24 continues. At the same time, the upside discrepancy should be taken into account. The $ 138.73 level appears as a resistance point en the rises driven por the upcoming macroeconomic data and the news en the Solana ecosystem. If it breaks here, the rise may continue. In case of retracements for the opposite reasons or due to profit sales, the support level of $127.21 can be triggered. If the price comes to these support levels, a potential bullish opportunity may arise if momentum increases.
Supports 133.74 – 127.21 – 120.24
Resistances 138.73 – 144.35 – 150.67
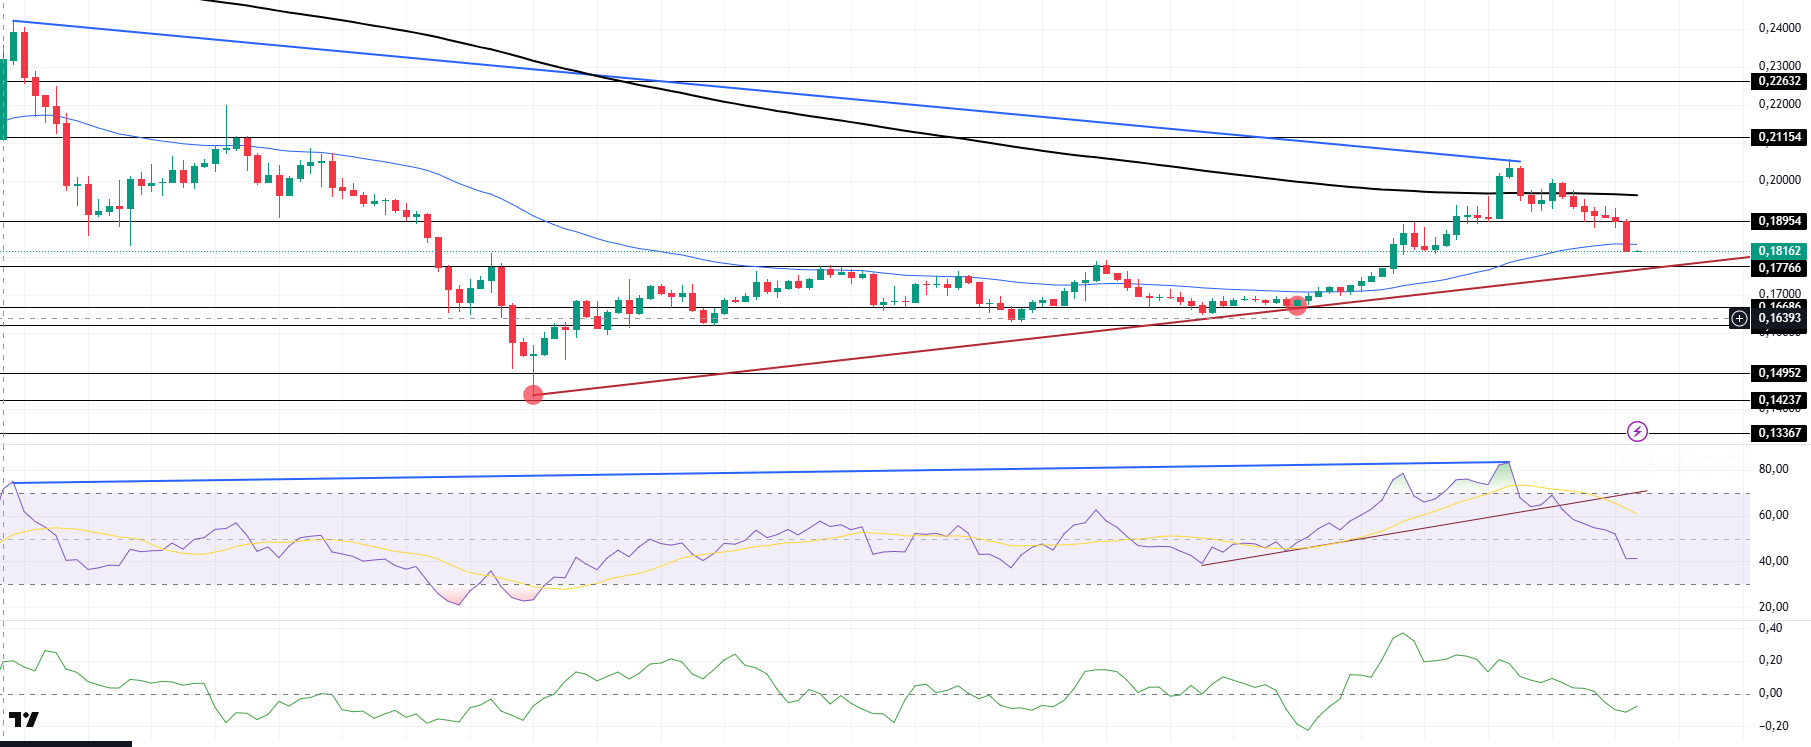
DOGE/USDT
According to CoinGlass data, Dogecoin investors have put more than $1.96 billion into the cryptocurrency’s derivatives markets.
Following our analysis yesterday, DOGE continued its decline, remaining below the 200 EMA (Black Line) and breaking its strong support at $0.18954. It is currently testing the 50 EMA (Blue Line) moving average as support. On the 4-hora timeframe, the 50 EMA (Blue Line) remains below the 200 EMA (Black Line). This could mean that the decline could deepen en the medium term. However, the price has started to price between the two moving averages. The Chaikin Money Flow (CMF)20 indicator is en negative territory. In addition, the negative 24-hora volume may reduce inflows and keep CMF en negative territory. On the other hand, Relative Strength Index (RSI)14 continued to retreat, breaking the uptrend that started el March 21. This may deepen the decline further. On the other hand, the bearish divergence seems to have worked. This may also cause pullbacks. The level of 0.21154 dollars appears to be a very strong resistance en the rises due to political reasons, macroeconomic data and innovations en the DOGE coin. In case of possible retracements due to political, macroeconomic reasons or due to negativities en the ecosystem, the $ 0.17766 level, which is a strong support place, is an important support place. If the price comes to these support levels, a potential bullish opportunity may arise if momentum increases.
Supports 0.17766 – 0.16686 – 0.16203
Resistances 0.18954 – 0.21154 – 0.22632
Legal Notice
The investment information, comments and recommendations contained herein do not constitute investment advice. Investment advisory services are provided individually por authorized institutions taking into account the risk and return preferences of individuals. The comments and recommendations contained herein are of a general nature. These recommendations may not be suitable for your financial situation and risk and return preferences. Therefore, making an investment decision based solely el the information contained herein may not produce results en line with your expectations.

