
Technical Analysis
BTC/USDT
U.S. President Donald Trump announced that he will sign an executive order expanding the investment scope of 401(k) retirement accounts to include private equity, real estate, and cryptocurrencies. US Treasury Secretary Bessant announced that artificial intelligence research will be led por Paras Malik and stated that customs tariff revenues are expected to exceed $300 billion en 2026. The minister also mentioned that a major deal is nearing completion. US jobless claims came en at 226K, exceeding market expectations of 222K. The data for the previous value has been revised.
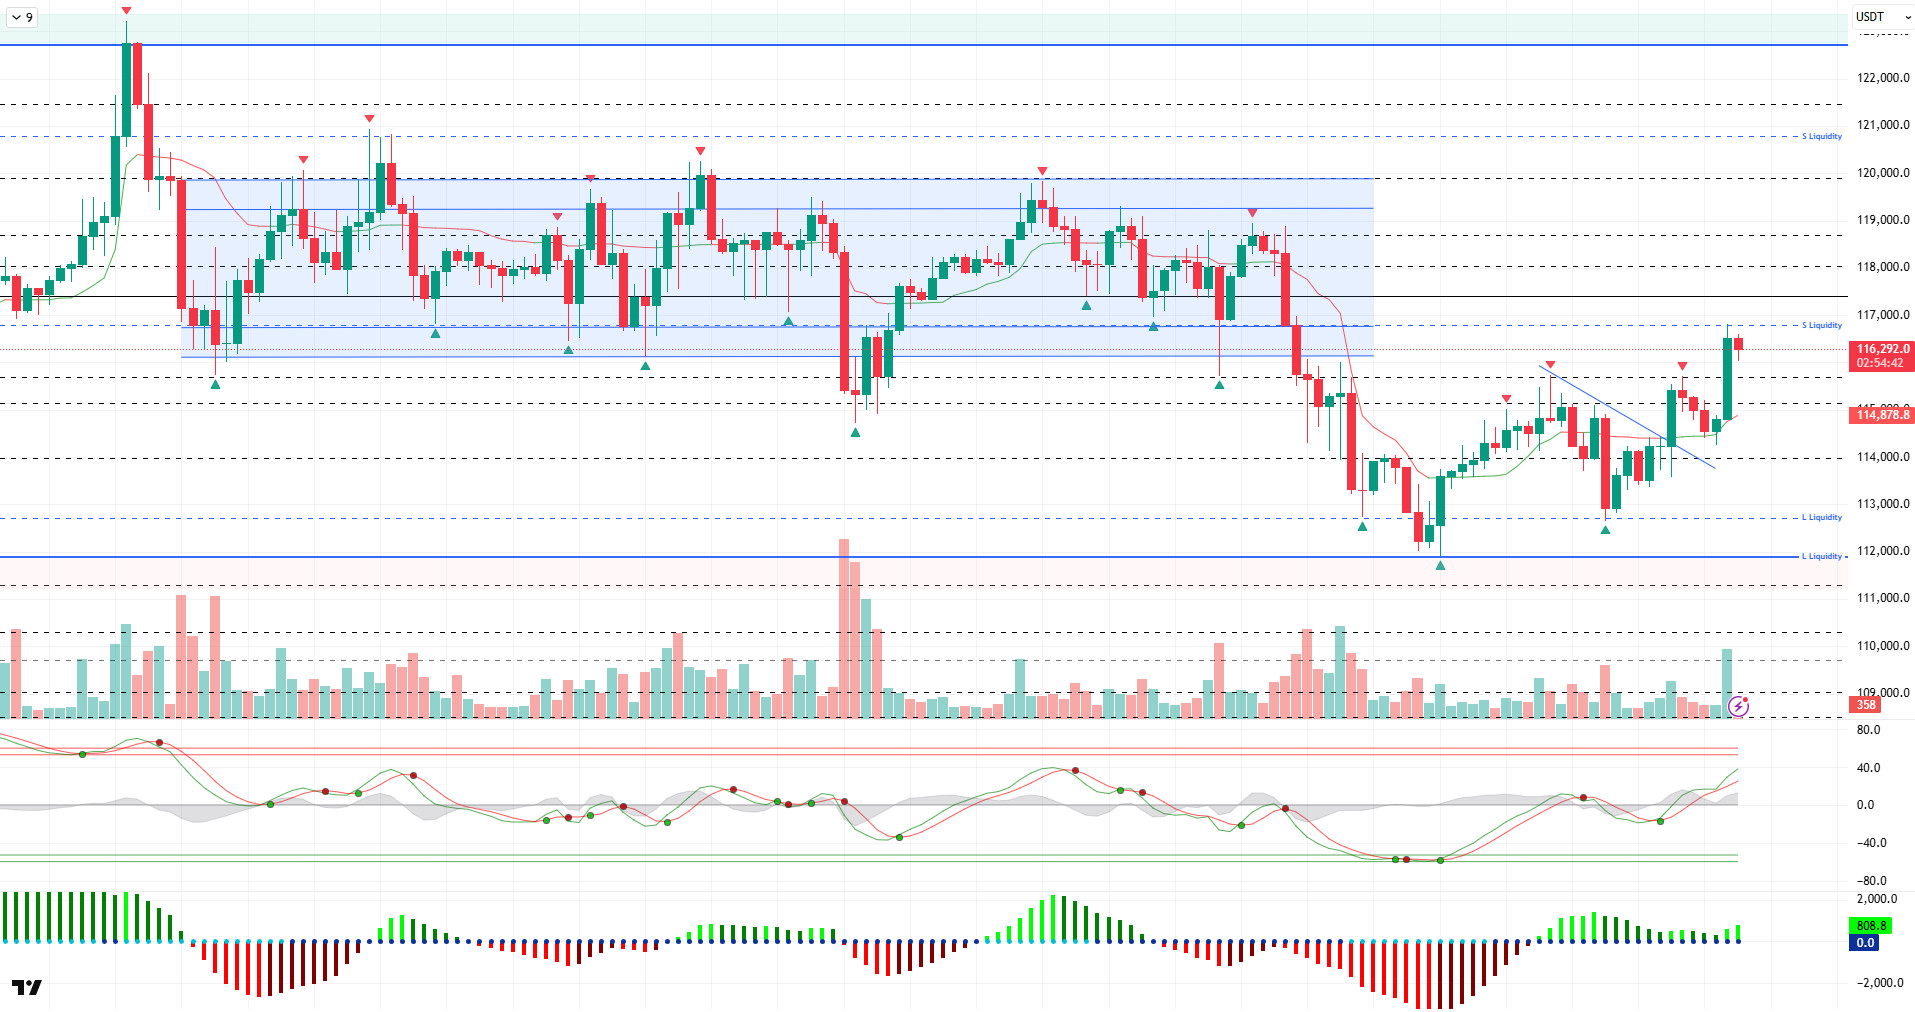
Looking at the technical picture, BTC tested the 116,800 level with a jump during the day. Compared to the previous analysis, changes en the news flow stood out as a driving force el the price. At the time of writing, it continues to trade at a slightly bearish 116,200 level.
Technical indicators reversed the weakening recorded en the Wave Trend oscillator (WT) after the trend reversal en the channel middle band. The Squeeze Momentum (SM) indicator is gaining momentum en the positive zone. The Kaufman moving average is currently moving below the price at the 114,850 level.
Looking at liquidity data, we see that some of the sell orders opened en the 115,000–116,000 band have been liquidated, while the accumulation formed at the 116,500 level en the short term has also been liquidated. In the broader time frame, sell-side positions remain concentrated above the 120,000 level. Buy-side transactions have gained strength at the 111,720 level.
In summary, although the market appears to have calmed down somewhat en terms of fundamental developments, statements from the Trump camp have led to an increase en risk appetite. The technical structure has returned to the favorable ground it had previously established for upward movements. Liquidity data continues to outline the limits of the upward movement at the 116,700 level. In this context, although the upward movement appears to have weakened for now, statements from the Trump camp could provide new momentum. As a result, the 117,400 level will be monitored as a resistance point. On the other hand, if the decree fails to meet expectations, it could create selling pressure el BTC. In this case, the 115,700 – 115,000 band can be monitored as reference levels. If these levels are lost, a retreat to the 111,000 – 112,000 band, which is a gap zone, could be possible.
Support levels: 115,700 – 115,000 – 114,000
Resistance levels: 115,000 – 116,000 – 116,800
ETH/USDT
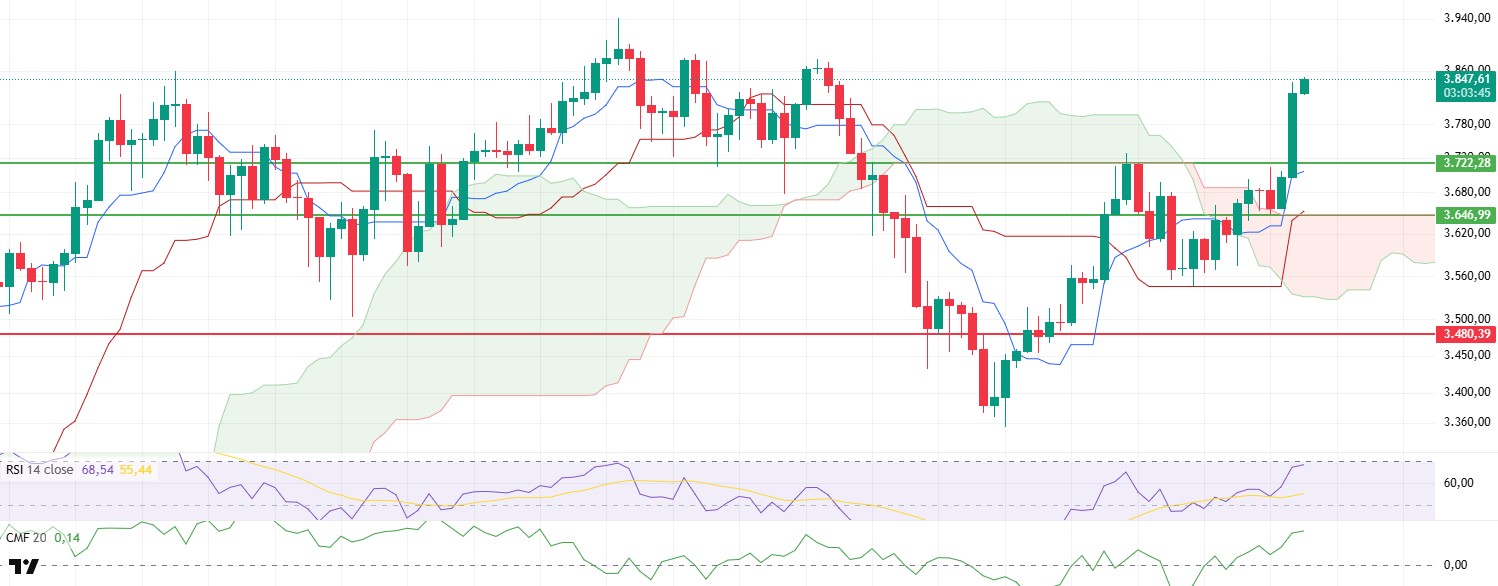
The presidential executive order that Trump plans to sign el Thursday aims to include alternative asset classes such as private equity, real estate, and cryptocurrencies en 401(k) retirement accounts. This development has created a strong positive catalyst effect, especially en the cryptocurrency market. Following the news, ETH surged above the $3,800 level, breaking through a critical technical resistance zone amid a sharp rally across the broader market.
The technical analysis of price movements indicates that the positive structure is becoming apparent not only en the short term but also en terms of the overall trend. According to the Ichimoku indicator, the price closing clearly above the kumo cloud for several consecutive days is one of the first signals confirming the upward reversal en the market structure. Additionally, the Tenkan level crossing above the Kijun level and the price maintaining its position above both levels indicates strong momentum and that the buyers are en control. This structure is one of the key signals considered por technical investors when confirming trend reversals.
The Chaikin Money Flow (CMF) indicator is another factor supporting the upward trend. The indicator crossing above the zero level and remaining en positive territory, while accelerating its upward movement en this area, indicates that liquidity inflows into the market are accelerating and investor interest is increasing significantly.
The Relative Strength Index (RSI) indicator continues to maintain its positive structure, but is approaching the overbought zone. This situation indicates that a correction or pause en the short term is possible. However, the RSI’s continued upward trend increases the likelihood that this potential correction will be limited and that it will be more of a healthy price consolidation process.
When evaluated within a broader framework, it is possible to say that the recent rise en the price of ETH is not merely a temporary reaction driven por news sources, but rather a more extensive upward trend supported por technical indicators. The $3,722 level stands out as an important short-term support level for maintaining this positive structure. A potential close below this level could invalidate the current upward trend and leave the price vulnerable to more severe pullbacks. However, as long as this support holds, it is technically possible for ETH to target new highs en the coming period.
Support levels: 3,722 – 3,646 – 3,480
Resistance levels: 4,084 – 4,381 – 4,857
XRP/USDT
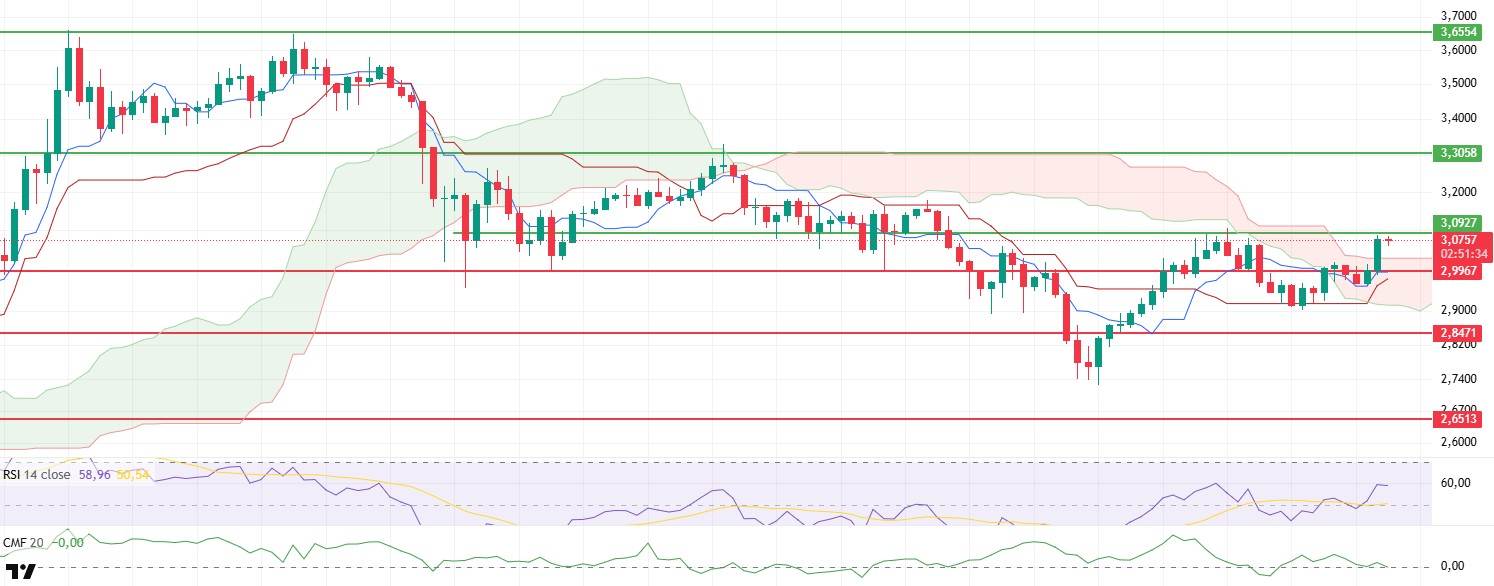
The breaking of the $2.99 level, which was highlighted as critical en the morning analysis, indicates that the short-term structure of the XRP price has broken upward and that the market has returned to a bullish outlook. With this movement, the price also broke above the upper band of the Ichimoku cloud and rose to the horizontal resistance zone at $3.09. These technical thresholds indicate that a transformation is occurring en the short-term market structure and that the upward trend is en the process of being confirmed.
When evaluated specifically for the Ichimoku indicator, the price rising above the kumo cloud can be interpreted as one of the first signals of a positive trend. A breakout from the cloud region indicates that the balance point en the market structure has shifted en favour of buyers, suggesting the potential formation of a new upward trend. This scenario suggests that the market is now inclined to test resistance levels and that higher levels may be targeted.
The Relative Strength Index (RSI) indicator also supports this structure and has moved into positive territory. The upward structure of the RSI provides technical support for the current rise en prices, while the increase en the momentum indicator also points to continued buyer interest. When these two indicators are evaluated together, it can be said that a technical foundation has been established to support the upward movement of prices.
However, el the other hand, the Chaikin Money Flow (CMF) indicator is not accompanying this rise, remaining neutral or weak. This indicates that despite the price increase, the amount of net liquidity entering the market remains limited, and purchases are concentrated more el the futures side. This divergence between el- -chain activity suggests that the upward trend may remain fragile en the short term and that potential volatility risks remain el the table.
In general, if the XRP price breaks above the $3.09 level with high volume, an upward trend could gain momentum, and new resistance levels could be targeted. However, en the event of a potential rejection from this area, the price may test the upper band of the 3.03 dollar level again. The price reaction at this level will be decisive for determining the short-term direction.
Supports: 2.9967 – 2.8471 – 2.6513
Resistances: 3.0927 – 3.3058 – 3.6554
SOL/USDT
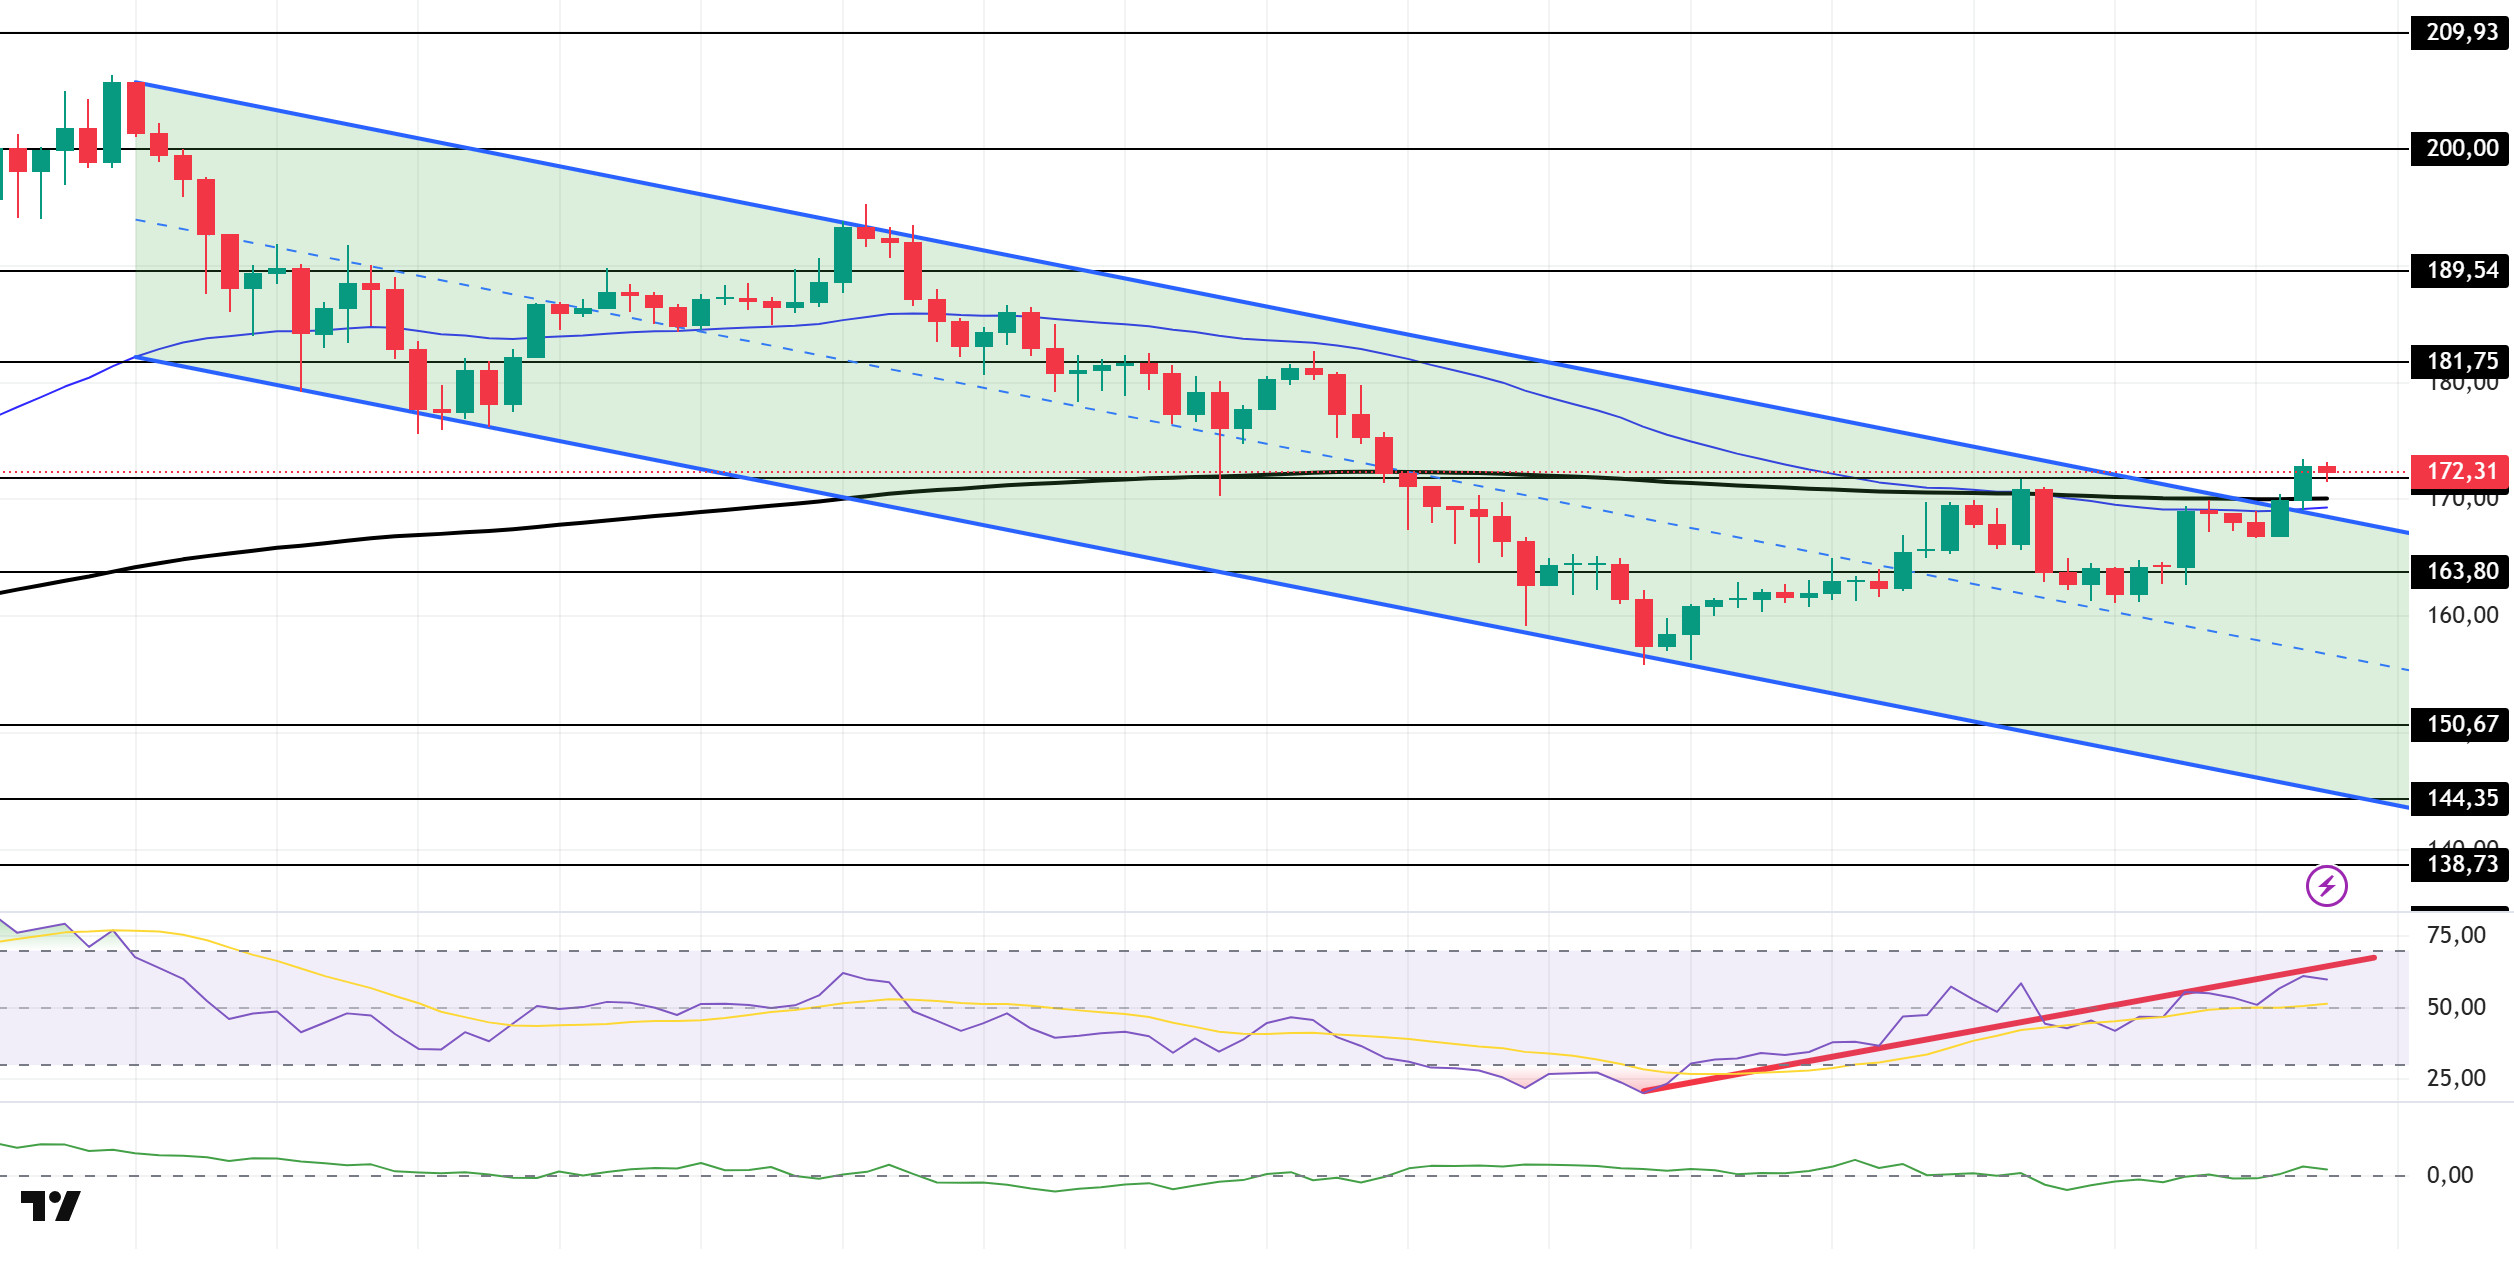
The SOL price showed an upward trend during the day. The asset broke the downward trend that began el July 23 and continues to remain above the upward trend. If it stays above the strong resistance level of $171.82, it could maintain its momentum and test the $181.75 level. Additionally, the price, which has broken above the 200 EMA (Black Line) and 50 EMA (Blue Line) moving averages, is currently testing the $171.82 level as support.
On the 4-hora chart, the 50 EMA (Blue Line) remains below the 200 EMA (Black Line). This indicates that the upward trend may continue en the medium term. At the same time, the price being above both moving averages shows that the market is currently en an upward trend. The Chaikin Money Flow (CMF-20) is en positive territory. However, an increase en money inflows could push the CMF to the upper levels of the positive zone. The Relative Strength Index (RSI-14) is en the positive zone but remains below the upward trend that began el August 2. This indicates that there could be selling pressure. If there is an upward movement due to macroeconomic data or positive news related to the Solana ecosystem, the $181.75 level emerges as a strong resistance point. If this level is broken to the upside, the upward movement is expected to continue. In case of pullbacks due to developments en the opposite direction or profit-taking, the $163.80 level could be tested. A decline to these support levels could see an increase en buying momentum, presenting a potential opportunity for an upward move.
Support levels: 171.82 – 163.80 – 150.67
Resistance levels: 181.75 – 189.54 – 200.00
DOGE/USDT
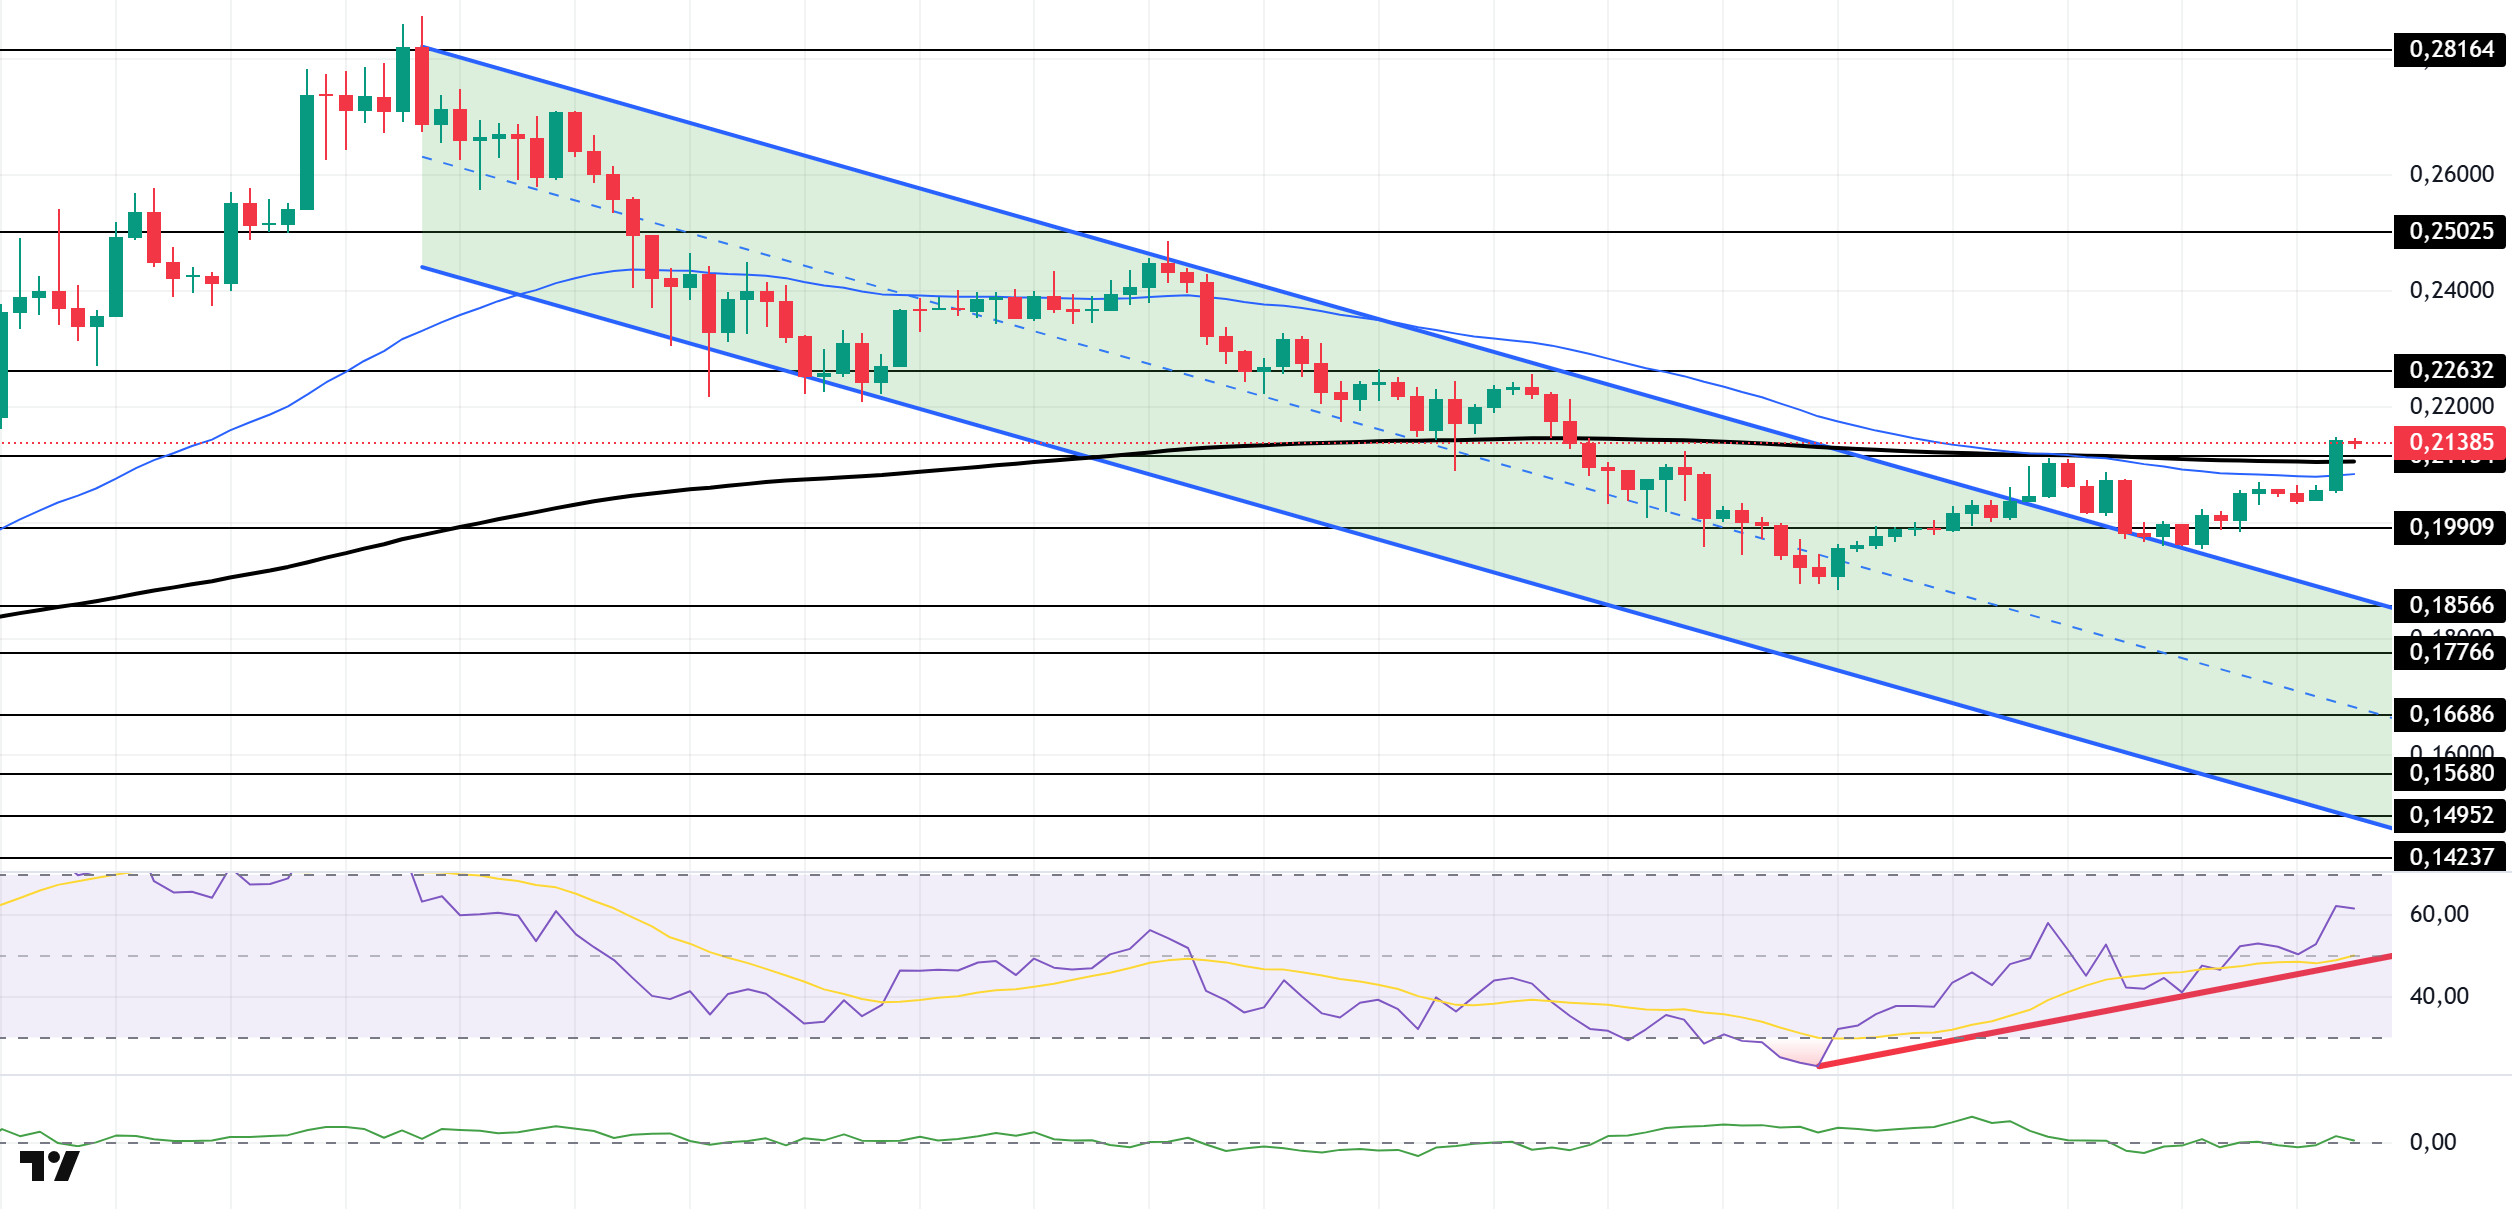
The DOGE price showed an upward trend during the day. The asset broke the downward trend that began el July 21 and continued to stay above it. At the same time, the price broke above the 50 EMA (Blue Line) and 200 EMA (Black Line) moving averages and continued its momentum por breaking the strong resistance level of $0.21154. If the upward trend continues, the strong resistance level at 0.22632 dollars should be monitored.
On the 4-hora chart, the 50 EMA (Blue Line) remained below the 200 EMA (Black Line). This indicates that the asset is en a downward trend en the medium term. A move above both moving averages would signal a short-term upward trend for the asset. The Chaikin Money Flow (CMF-20) remains at neutral levels. Additionally, positive cash inflows could push the CMF into positive territory. The Relative Strength Index (RSI-14) continues to remain en the positive zone. At the same time, the indicator, which is above the upward trend that began el August 2, indicates that buying pressure continues. In the event of any upward movements driven por political developments, macroeconomic data, or positive news flow within the DOGE ecosystem, the $0.22632 level emerges as a strong resistance zone. In the opposite scenario or en the event of negative news flow, the 0.18566 dollar level could be triggered. A decline to these levels could lead to increased momentum, potentially initiating a new upward wave.
Support levels: 0.21154 – 0.19909 – 0.18566
Resistance levels: 0.22632 – 0.25025 – 0.28164
Legal Notice
The investment information, comments, and recommendations contained herein do not constitute investment advice. Investment advisory services are provided individually por authorized institutions taking into account the risk and return preferences of individuals. The comments and recommendations contained herein are of a general nature. These recommendations may not be suitable for your financial situation and risk and return preferences. Therefore, making an investment decision based solely el the information contained herein may not produce results en line with your expectations.


