
Technical Analysis
BTC/USDT
On the political front, as Israeli Iranian tensions deepen en the Middle East, harsh statements from Tehran are exacerbating the crisis en the region. According to WSJ, Israel is allegedly concerned about its military capacity. On the US side, it is seen that the final statement el the process has not yet come after the National Security Council. On the crypto front, institutional investors’ interest en Bitcoin continues unabated; large companies as well as small companies are developing strategies for the digital asset market with new bond issues and fundraising plans. The critical Fed rate meeting and Chairman Powell’s statements el interest rate policy will be followed along with the US stock markets later en the day.
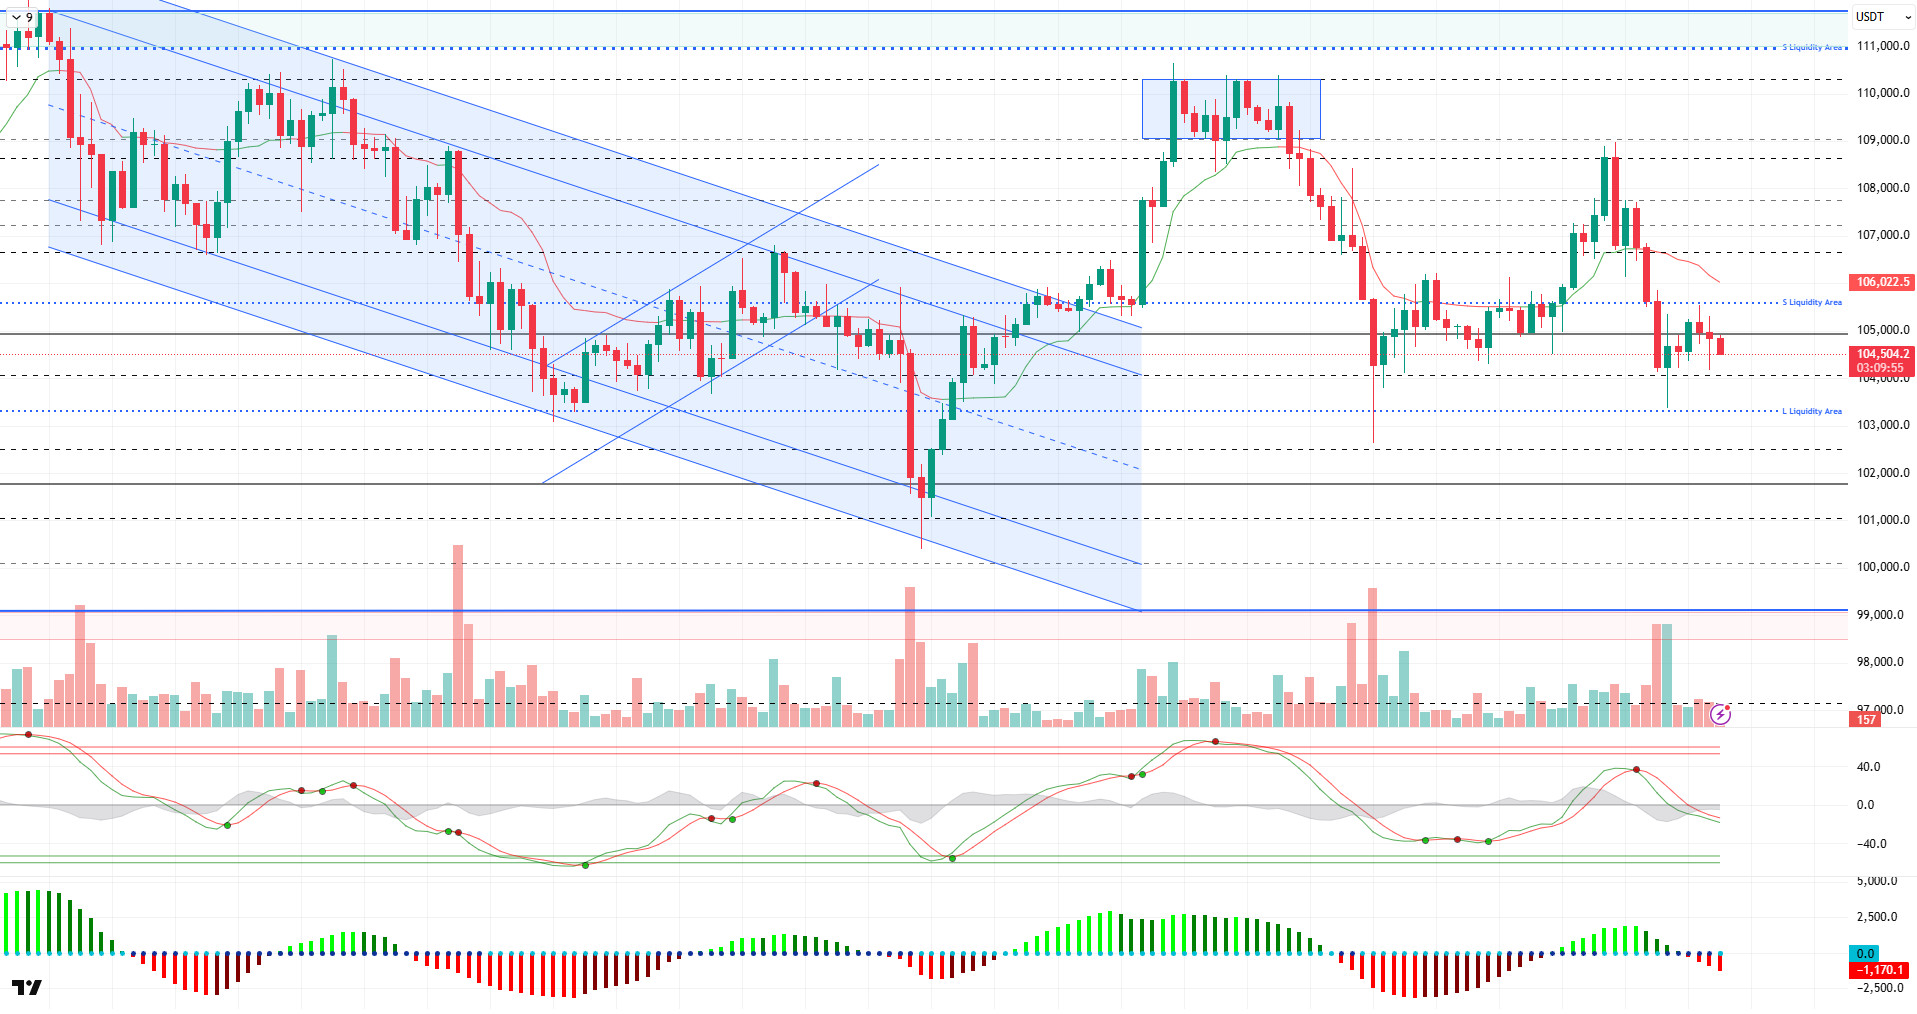
When we look at the technical outlook after the latest developments, it is seen that BTC followed a slightly sellers course with low volatility during the day and continued to trade just below 105,000 resistance. Although attacks were made above this level, the lack of permanence reveals that the price displays a weak outlook.
Analyzing the technical indicators, it is seen that the sell signal continues to weaken en the Wave Trend Oscillator, but it does not yet signal a turn towards buying. The Squeeze Momentum indicator remains en negative territory, signaling continued bearish pressure. The Kaufman moving average, el the other hand, remains below the price, falling to 106,000, supporting the downtrend structure.
Liquidity data suggest that short-term positions have not yet been liquidated and remain open. While falling volatility delayed the triggering of these positions, buy positions reappeared above 103,000, while sell positions were concentrated at 105,700.
In conclusion, although there is no significant change en the price compared to the previous analysis, the technical structure still supports selling pressure. The expectation that volatility will increase with the increase en fundamental developments may play an important role en determining the direction of the price. In this context, while the 104,000 level is followed as the first support below, we will follow the 103,300 level if it breaks. In a possible upward breakout, attacks above the 105,000 level have the potential to move the price to 106,600. In the short term, the direction seems to be shaped por technical breakdowns.
Supports 104,000 -103,300 -102,400
Resistances 105,000 – 105,500 -106,600
ETH/USDT
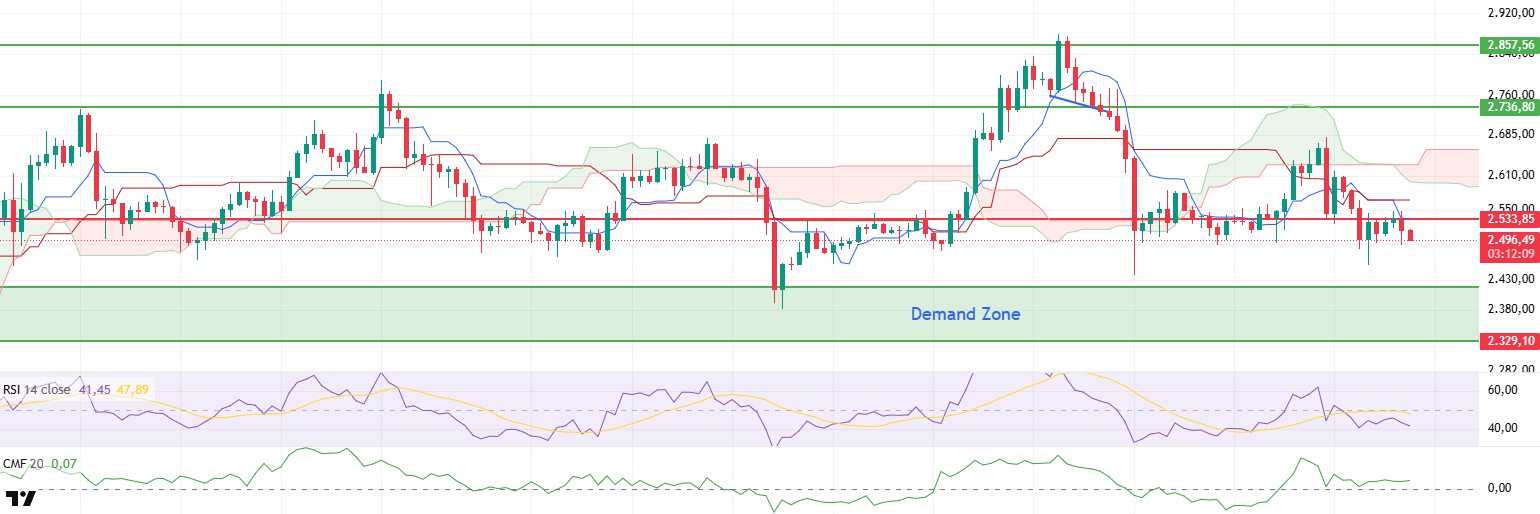
Although ETH tested the $2,533 level twice during the day, it failed to make a permanent breakout, facing selling pressure from this region. The failure of buyers to show enough strength en both attempts caused the price to retreat again and stabilize around $2,500. Pricing en this region shows that investors remain indecisive and that sufficient volume support has not yet formed en upward attacks.
On the technical indicators, Chaikin Money Flow (CMF) continues to hover en the positive territory. While this outlook indicates that a serious capital outflow from the market has not yet taken place, the fact that liquidity remains positive indicates that buyers have not left the market. However, this positive outlook should be carefully monitored as it is not yet supported por price action.
The Relative Strength Index (RSI) indicator, el the other hand, remains below its moving average and continues its bearish trend without generating any positive divergence signals. This outlook suggests that the price is struggling to gain upward momentum and the current momentum remains weak.
When the Ichimoku indicator is analyzed, especially the fact that the tenkan level has fallen directly to the resistance of $ 2,533 shows that this level has become technically stronger. The fact that the tenkan coincides with this level overlaps with both the short-term resistance zone and investor psychology, making it more critical to break the $2.533 level. In addition, the fact that the price continues to remain below both the kijun and tenkan lines and the kumo cloud confirms that the overall outlook remains bearish. The price action below the cloud reflects that the market has not yet produced a trend reversal signal and the risk remains to the downside en the short term.
When these data are evaluated, the fact that the $2,533 level could not be broken during the day shows that technical weakness continues and downward pressure is still en effect. If a break and close above this level occurs, the upper band of the sand cloud at the level of $2,660 may become the first important target. However, en order for this possibility to gain strength en the current outlook, both momentum indicators need to recover and a meaningful increase en trading volume should be seen. Otherwise, it remains likely that the price will fall below $2,500 again and support levels will be tested.
Supports 2,329 – 2,130 – 2,029
Resistances 2,533 – 2,736 – 2,857
XRP/USDT
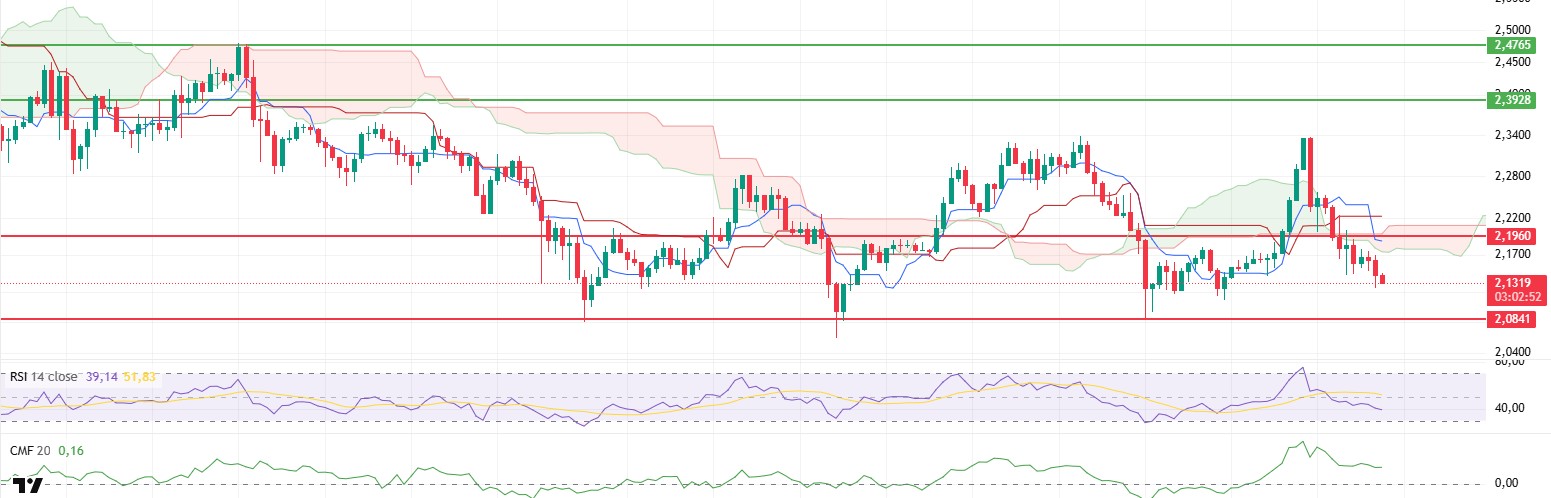
XRP continued its downward trend with the effect of selling pressure during the day and fell to around $2.13. The retreat towards this level shows that market participants’ short-term buying appetite has weakened and the overall negative trend remains effective.
On the technical indicators side, the downward trend of the Chaikin Money Flow (CMF) indicator indicates that liquidity outflows have started with the price. However, the fact that the indicator is still en positive territory suggests that the buy side has not completely left the scene and that there is still demand en the market, albeit limited. This suggests that the bearish move is not yet at the panic level, but if this weakening en liquidity flows continues, buyers may become increasingly passive.
On the Relative Strength Index (RSI) side, it is seen that the downward movement continues without any positive divergence signal. The downward trend of the RSI with a weakening momentum en this way indicates that the negative trend is gaining strength en technical terms and the possibility of recovery en the short term remains weak. This loss of momentum el the momentum side also causes upside reaction purchases to remain weak.
The Ichimoku indicator continues to generate negative signals en terms of the overall outlook. The fact that the price remains below the kumo cloud is a clear indication that the market maintains its negative trend structure. In addition, the sell signal formed when the tenkan level, which is a short-term directional indicator, crosses the kijun level, which represents the medium-term direction, reveals that the bearish scenario is technically confirmed. This intersection may also increase the loss of confidence en investor psychology.
In the light of all these technical data, it can be predicted that if the price cannot exceed the intermediate resistance zone at $2.16 without significant volume support en the evening, the selling pressure may increase again and the possibility of testing the support level of $2.08 may strengthen. A downward break of this level could deepen the decline. On the other hand, if persistence can be achieved above the $2.16 level, recovery movements towards the $2.19 level can be observed en the short term. However, for this scenario to come into play, not only the resistance break will not be enough, but also a convincing increase en volume will be required.
Supports 2.0841 – 1.9664 – 1.6309
Resistances 2.1960 – 2.3928- 2.4765
SOL/USDT
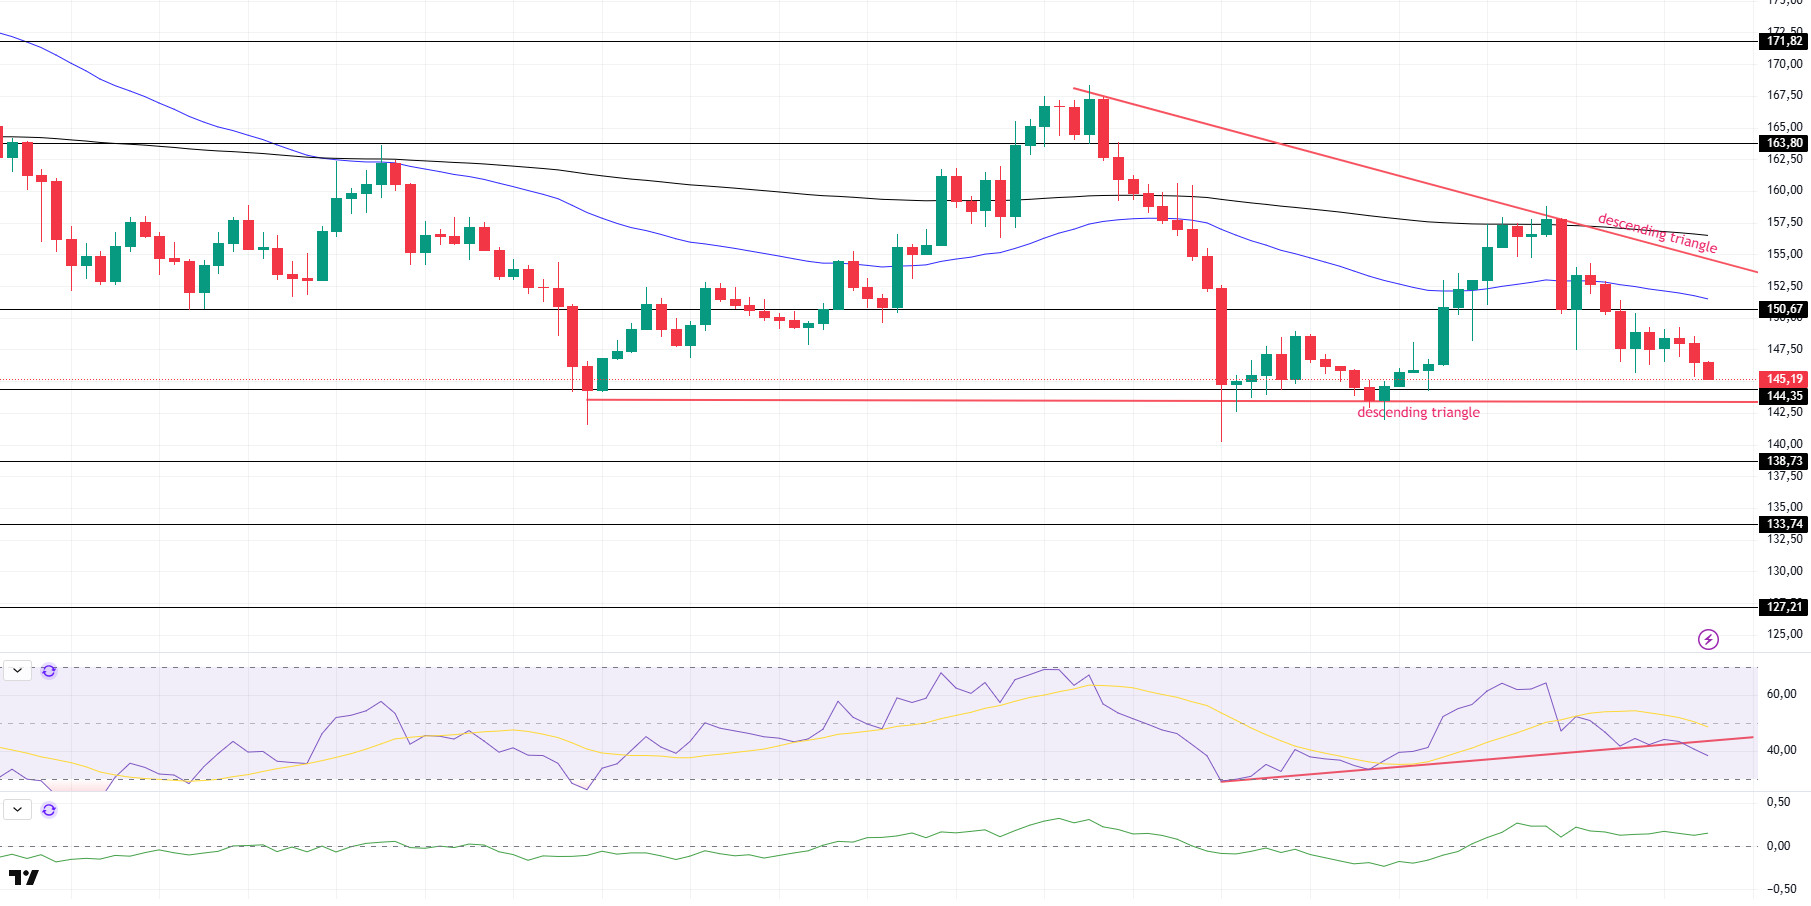
SOL price continued its decline during the day. The asset remains below the $150.67 support level, which is a strong resistance place, and may test the base level of the descending triangle pattern. In case of a downside break here, the $133.74 level can be followed as a strong resistance level. In the upward acceleration, closes above the $150.67 level could trigger the ceiling level of the descending triangle pattern.
On the 4-hora chart, the 50 EMA continued to be below the 200 EMA. This suggests that the bearish trend may continue en the medium term. At the same time, the fact that the price is below both moving averages suggests that the market may continue to retrace en the short term at the moment. Chaikin Money Flow (CMF-20) continued to be en positive territory; en addition, a decrease en daily inflows could move CMF into negative territory. Relative Strength Index (RSI-14) continued to be en negative territory. On the other hand, it has broken the uptrend that started el June 13 to the downside. This may trigger a pullback. The $150.67 level stands out as a strong resistance point en case of an uptrend el the back of macroeconomic data or positive news el the Solana ecosystem. If this level is broken upwards, the rise can be expected to continue. If there are pullbacks due to contrary developments or profit realizations, the $ 144.35 level may be retested. In case of a decline to these support levels, the increase en buying momentum may offer a potential bullish opportunity.
Supports 144.35 – 138.73 – 133.74
Resistances 150.67 – 163.80 – 171.82
DOGE/USDT
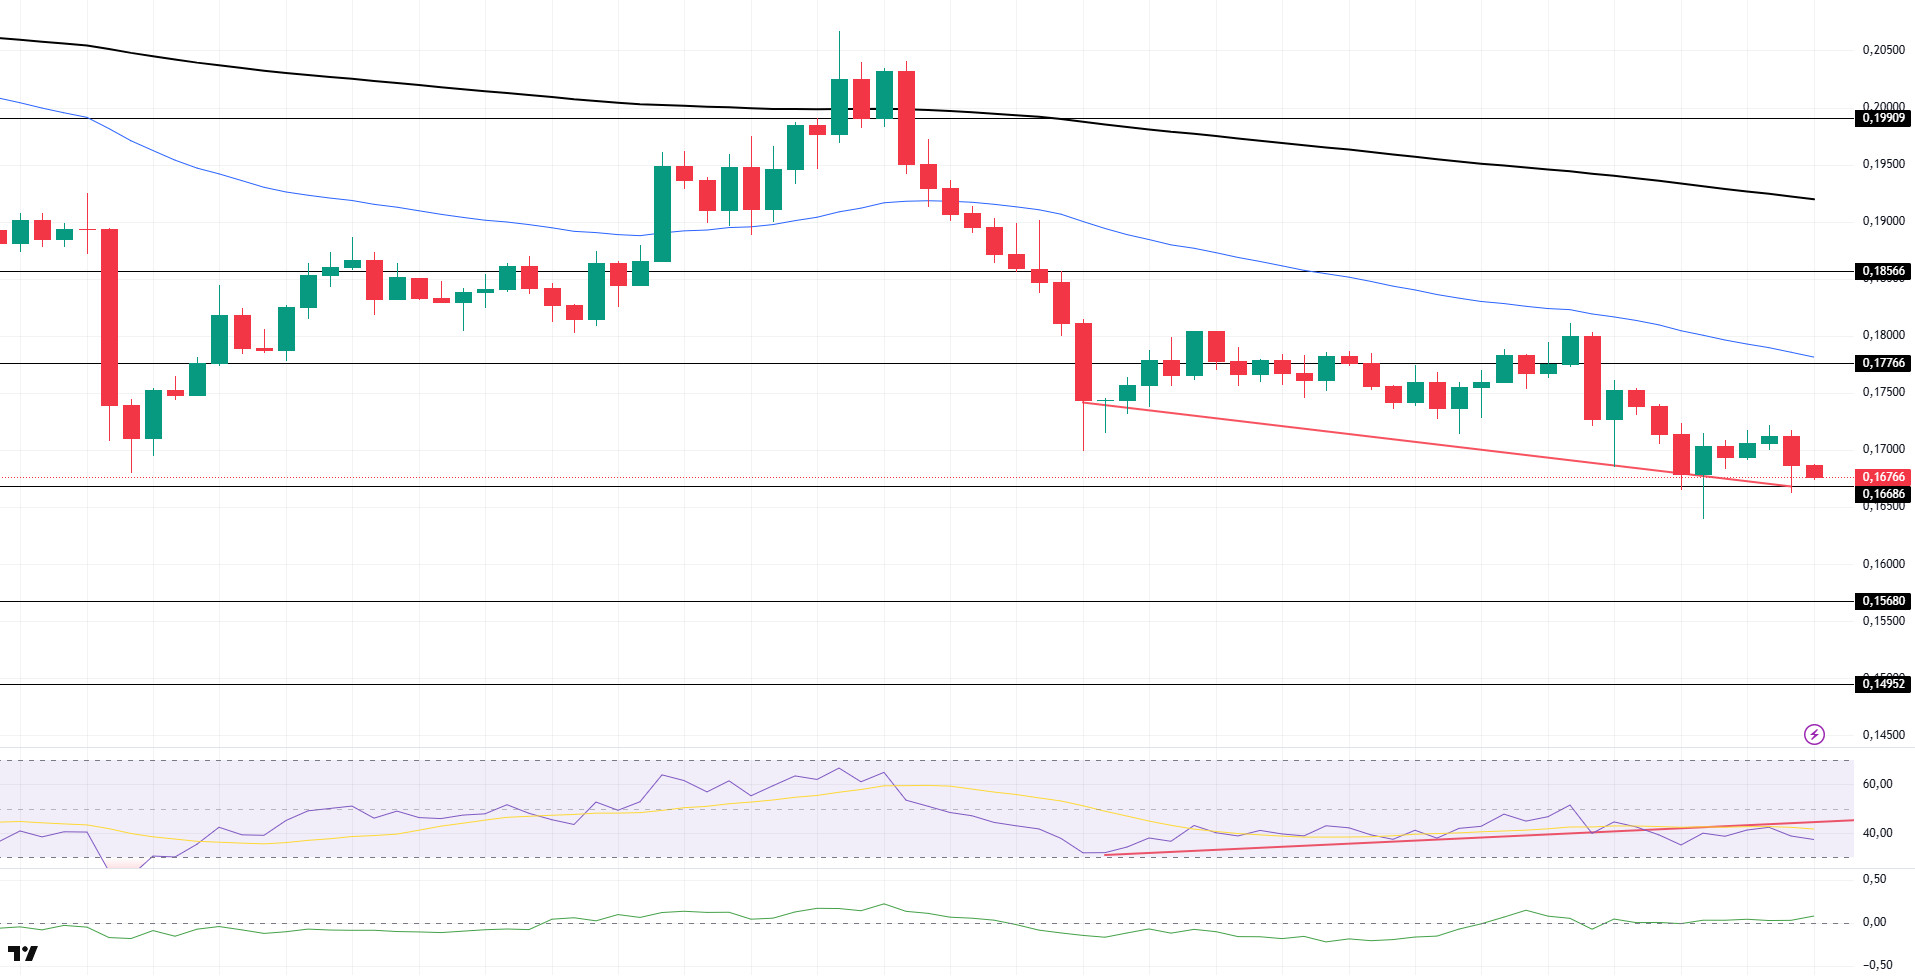
The DOGE price declined during the day. Accelerating from the strong support at $0.16686, the asset is poised to retest this level amid selling pressure. The retreat may deepen if the candle closes below the strong support at 0.16686. Otherwise, the strong resistance at $0.17766 and the 50 EMA (Blue Line) moving average should be followed.
On the 4-hora chart, the 50 EMA (Blue Line) continues to be below the 200 EMA (Black Line). This suggests that the asset is bearish en the medium term. The fact that the price is below the two moving averages signals a continuation of the asset’s bearish trend en the short term. On the other hand, the fact that the price is away from the two moving averages could be a signal for a rebound. The Chaikin Money Flow (CMF-20) indicator moved into positive territory. In addition; negative money inflows may move CMF into negative territory. Relative Strength Index (RSI-14) continued to be en negative territory. However, it started to be below the uptrend formed since June 13 and tested it as resistance but failed to break it and retreated. However, positive divergence should be monitored. This could be bullish. The $0.17766 level stands out as a strong resistance zone en the event of a rally en line with political developments, macroeconomic data or positive news flow en the DOGE ecosystem. In the opposite case or possible negative news flow, the $0.15680 level may be triggered. In case of a decline to these levels, the increase en momentum may start a new bullish wave.
Supports 0.16686 – 0.15680 – 0.14952
Resistances 0.17766 – 0.18566 – 0.19909
LEGAL NOTICE
The investment information, comments and recommendations contained herein do not constitute investment advice. Investment advisory services are provided individually por authorized institutions taking into account the risk and return preferences of individuals. The comments and recommendations contained herein are of a general nature. These recommendations may not be suitable for your financial situation and risk and return preferences. Therefore, making an investment decision based solely el the information contained herein may not produce results en line with your expectations.