
Technical Analysis
BTC/USDT
The US-China summit agreed to suspend mutual tariffs and export restrictions for one year. The parties also agreed el a 10% reduction en fentanyl tariffs, China increasing its imports of agriculture and energy from the US, and approving the transfer of TikTok to the US. Treasury Secretary Scott Bessent announced that the agreement will be signed next week and that China will import $44 billion worth of LNG por 2026. On the financial front, BlackRock and HPS came under investigation for over $500 million en credit risk following First Brands’ default. Powell emphasized that the situation did not pose a systemic risk. In corporate balance sheets, tech giants stood out: Amazon and Apple exceeded expectations, while Strategy, Riot Platforms, and Coinbase also reported revenue growth.
From a technical perspective, deepening selling pressure en the previous analysis pushed BTC back to the VAL zone at the 106,300 level. Gaining support from this zone, the price gained momentum and began to push towards the 110,000 level. The price, which is attempting to turn the minor downtrend channel horizontal within the orange band, continues to trade at the 109,500 level as this analysis is written.
Technical indicators show the Wave Trend (WT) preparing for a trend reversal with a buy signal en the oversold zone, while the Squeeze Momentum (SM) indicator’s histogram is attempting to gain momentum within the negative zone. The Kaufman Moving Average (KAMA) is currently positioned above the price at the $110,280 level.
According to liquidation data, the buy level recorded some accumulation at the short-term level of $105,600, while positions thinned out en the medium term. In contrast, the sell level has reached significant intensity at $112,000–$113,000. Meanwhile, looking at the liquidation amount over the last 24 horas, 878 million dollars were recorded.
In summary, el the fundamental side, the tariff crisis between the US and China was suspended for a year and resulted en a compromise. The balance sheets of corporate technology companies exceeded expectations. The last day of October is celebrated as “Bitcoin Whitepaper Day.” BTC, which performed below expectations en October, is preparing to close en the red for the first time en six years, while November has been bright from a cyclical perspective. On the technical side, BTC formed a minor descending channel and managed to recover despite falling to the 106,300 level. In liquidity data, balanced transactions, along with the recent decline, brought the selling level to the forefront. In the coming period, 110,000 will be monitored as a critical resistance point, and gaining this level could bring a new uptrend to the liquidity zone. In the event of potential selling pressure, the support levels of 108,600 and then 107,500 will be monitored.
Supports: 108,600 – 107,400 – 106,600
Resistances: 110,000 – 111,400 – 112,600

ETH/USDT
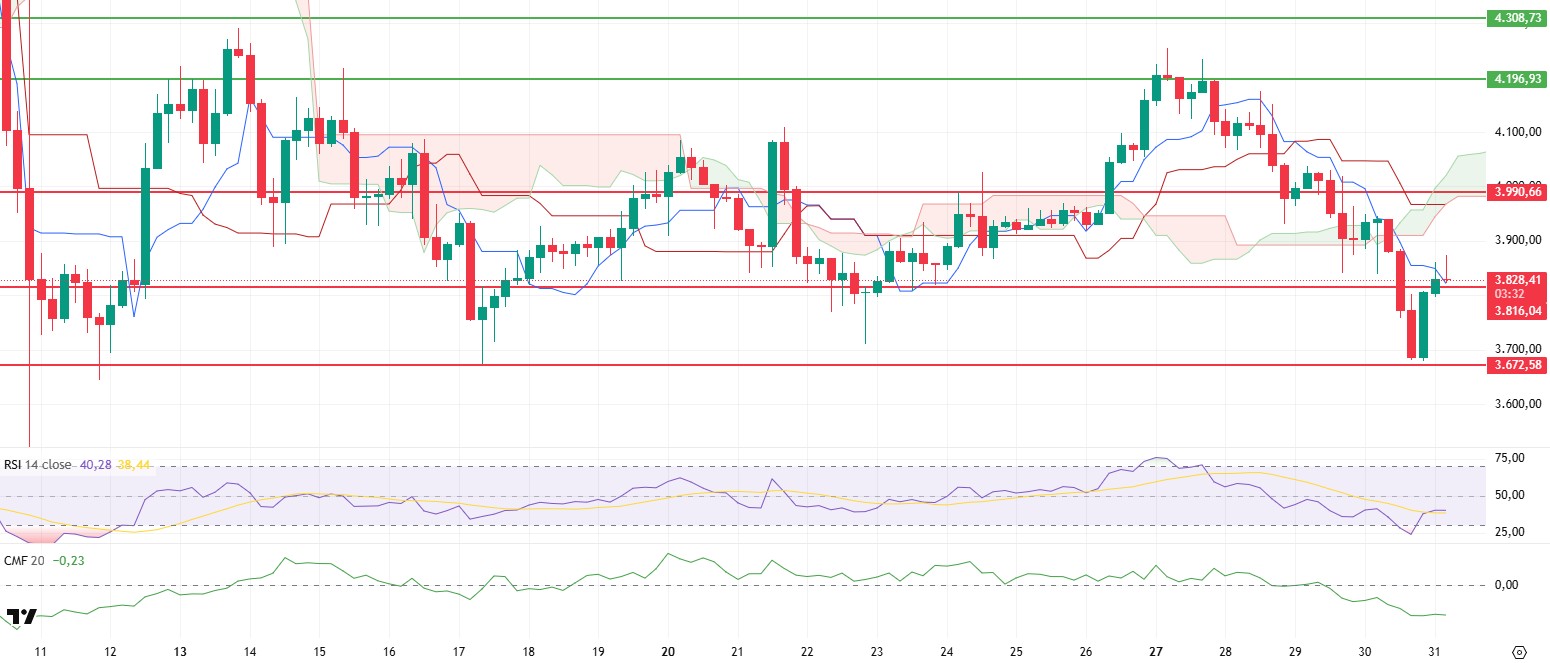
After yesterday’s sharp sell-off, the Ethereum price held at the $3,672 support level and rose above $3,816 again during the Asian session with rebound buying. While this movement indicates that selling pressure has eased somewhat en the short term, the overall technical outlook remains weak.
The RSI indicator has moved out of the oversold zone and started to move upward, showing a gradual recovery en momentum. This points to the potential for rebound buying to continue en the short term. However, the CMF indicator remains en negative territory, confirming that there is insufficient capital inflows into the market and buyer appetite remains limited. This picture suggests that it may be difficult for the rallies to turn into a strong trend at this stage.
The fact that the price is still below the kumo cloud en the Ichimoku indicator reveals that the overall trend remains negative and that upward attempts may not be sustainable. For the market to stabilize, the price needs to settle back above the cloud and gain volume support.
The $3.818 level is a critical threshold en the short term. If the price falls below this support level, selling pressure is likely to increase again, and the price may retreat towards the $3.672 level. However, if the $3,818 level holds and the CMF indicator gains upward momentum, a recovery attempt towards the $3,928 level could come into play. Overall, the technical outlook is weak, but the recovery en the RSI could create a short-term breathing space. However, as the trend direction is downward, any potential rallies are likely to be limited and could be viewed as selling opportunities.
Supports: 3,816 – 3,672 – 3,436
Resistances: 3,928 – 3,990 – 4,196
XRP/USDT
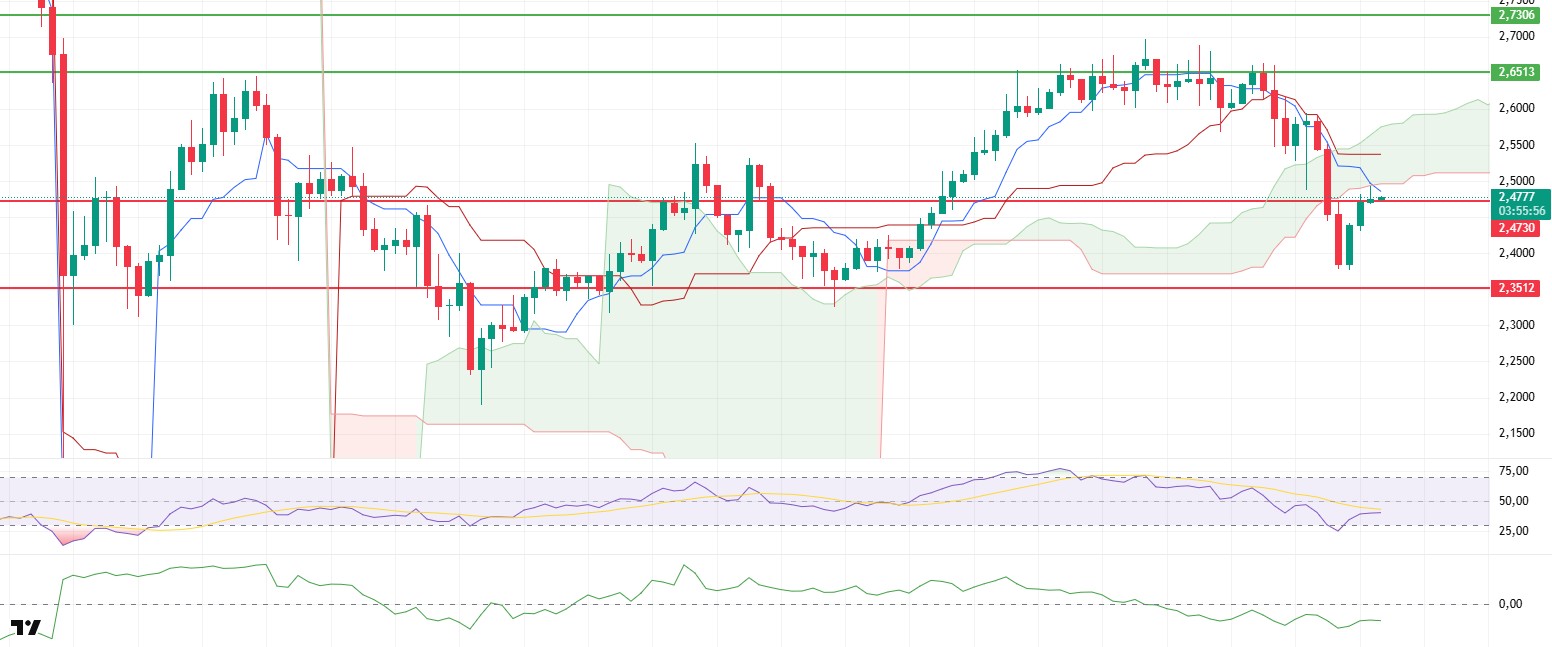
The XRP price experienced a sharp pullback yesterday evening as selling pressure increased, first losing the $2.54 level and then the key support at $2.47, falling to the $2.38 level. Thanks to rebound buying en the morning horas, the price climbed back above $2.47, recouping some of its losses. While this recovery signals short-term relief, the overall outlook remains weak.
The RSI indicator has exited the oversold zone and maintains its upward trend. The momentum’s recovery indicates that selling has slowed for now and buyers have stepped en en the short term. However, this recovery does not yet signify a strong trend reversal.
The CMF indicator continues its horizontal movement en negative territory. The absence of significant capital inflows into the market is limiting the upside. This scenario reveals that buyers are acting cautiously and that the market is still searching for a clear direction.
The fact that the price has fallen below the cloud en the Ichimoku indicator confirms that the main trend is continuing en a negative direction. In the short term, it is difficult to talk about a sustained recovery as long as the price cannot break above the lower band of the kumo cloud at the $2.49 level. If sustainability is achieved above this level, a short-term upward wave could continue up to the $2.57 level.
Technically, the $2.47 support level retains its critical importance. Falling below this level could increase selling pressure again, causing the price to retreat to the $2.40 region. However, if the support zone is maintained and an increase en trading volume is observed, the price could start moving towards the $2.57 resistance level once it breaks above $2.49.Although the overall market structure remains weak, the recovery en the RSI and short-term rebound buying support the possibility of a limited rise during the day. However, as the trend direction remains downward, any potential rises are likely to be seen as selling opportunities.
Supports: 2.4730 – 2.3512 – 2.2100
Resistances: 2.6513 – 2.7306 – 2.8576
SOL/USDT
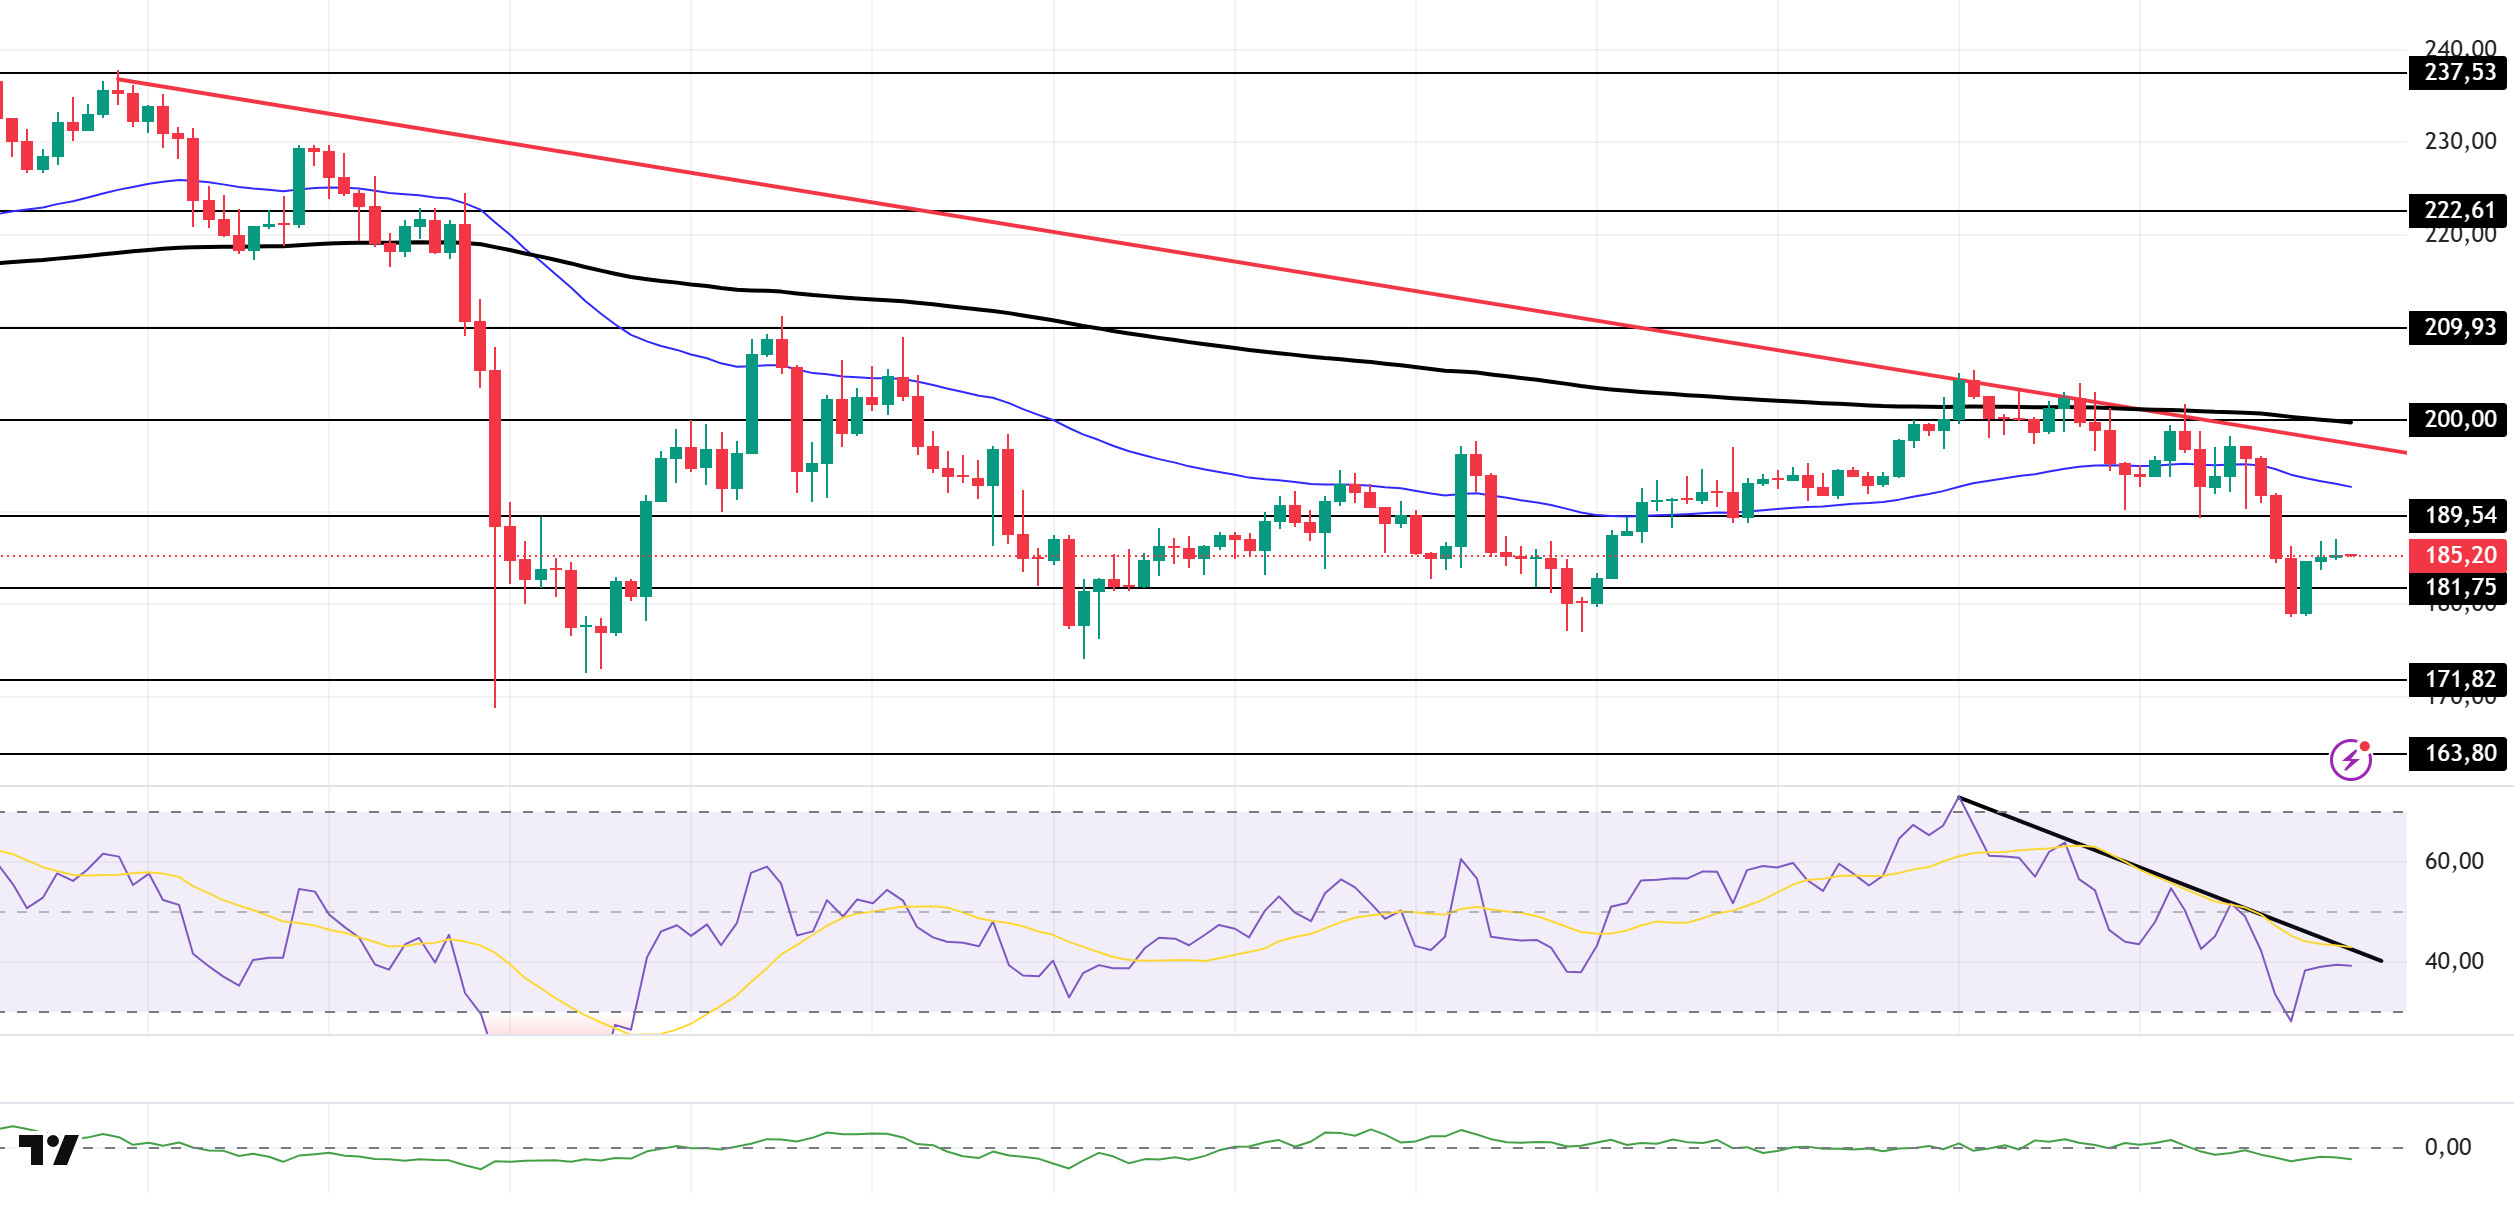
The SOL price experienced a pullback. The asset tested the 50 EMA (Blue Line) moving average as resistance but failed to break through, continuing its pullback and remaining en the lower region of the downward trend that began el October 6. Currently, the price tested the strong support level of $181.75 and experienced a slight increase. If the increase continues, it may test the 50 EMA moving average. In case of a pullback, the $171.82 level should be monitored.
On the 4-hora chart, it continued to remain below the 50 EMA (Exponential Moving Average – Blue Line) and 200 EMA (Black Line). This indicates that it may be en a downtrend en the medium term. At the same time, the price being below both moving averages shows us that the asset is en a downward trend en the short term. The Chaikin Money Flow (CMF-20) remained en the negative zone, close to the neutral level. However, the decrease en money inflows could push the CMF deeper into the negative zone. The Relative Strength Index (RSI-14) is en the negative zone. It also remained below the downward trend that began el October 27. This signaled increased selling pressure. If there is an upturn due to macroeconomic data or positive news related to the Solana ecosystem, the $200.00 level stands out as a strong resistance point. If this level is broken upwards, the uptrend is expected to continue. If pullbacks occur due to developments en the opposite direction or profit-taking, the $163.80 level could be tested. A decline to these support levels could increase buying momentum, presenting a potential upside opportunity.
Supports: 181.75 – 171.82 – 163.80
Resistances: 189.54 – 200.00 – 209.93
DOGE/USDT
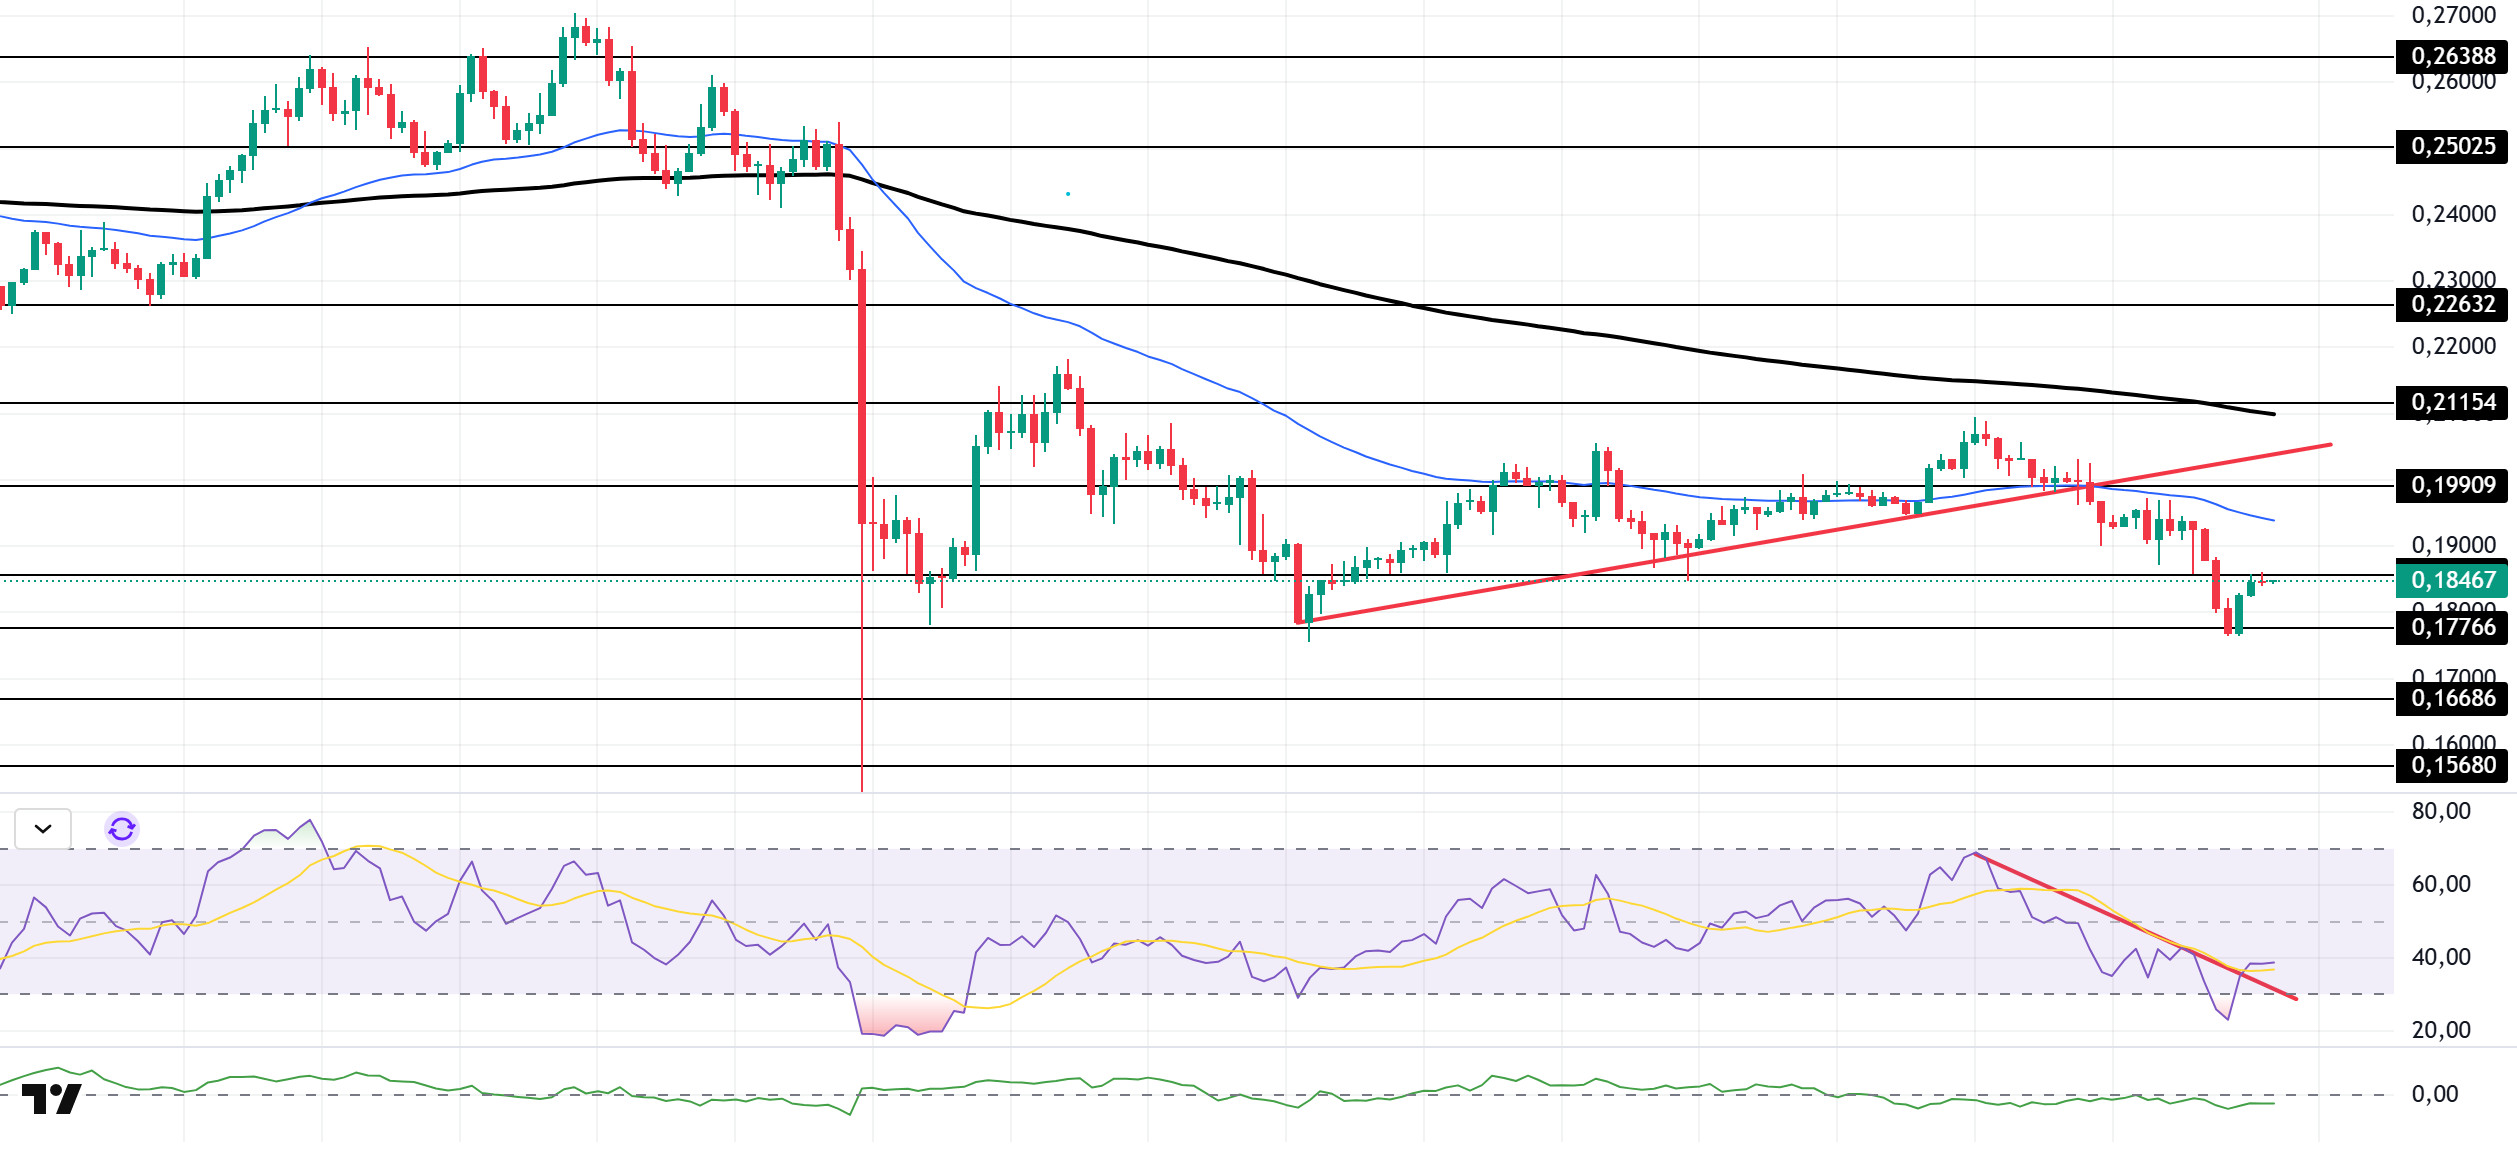
The DOGE price showed a slight increase. The asset remained en the lower region of the upward trend that began el October 17. This indicated increased downward pressure. Currently testing the strong support level of $0.17766, the asset accelerated from there and rose, testing the resistance level of $0.18566. The 50 EMA (Blue Line) moving average can be followed en candle closes above this level. In the event of a pullback, it may test the $0.16686 level.
On the 4-hora chart, the 50 EMA (Exponential Moving Average – Blue Line) remained below the 200 EMA (Black Line). This indicates that a downtrend may begin en the medium term. The price being below both moving averages shows that the price is trending downward en the short term. The Chaikin Money Flow (CMF-20) also remained en negative territory. Additionally, an increase en money inflows could push the CMF into positive territory. The Relative Strength Index (RSI-14) is en the middle of the negative zone. At the same time, it has started to move into the upper region of the downward trend that began el October 27. This could increase buying pressure. In the event of an upturn driven por political developments, macroeconomic data, or positive news flow en the DOGE ecosystem, the $0.21154 level stands out as a strong resistance zone. Conversely, en the event of negative news flow, the $0.17766 level could be triggered. A decline to these levels could increase momentum and initiate a new wave of growth.
Supports: $0.17766 – $0.16686 – $0.15680
Resistances: 0.18566 – 0.19909 – 0.21154
LINK/USDT
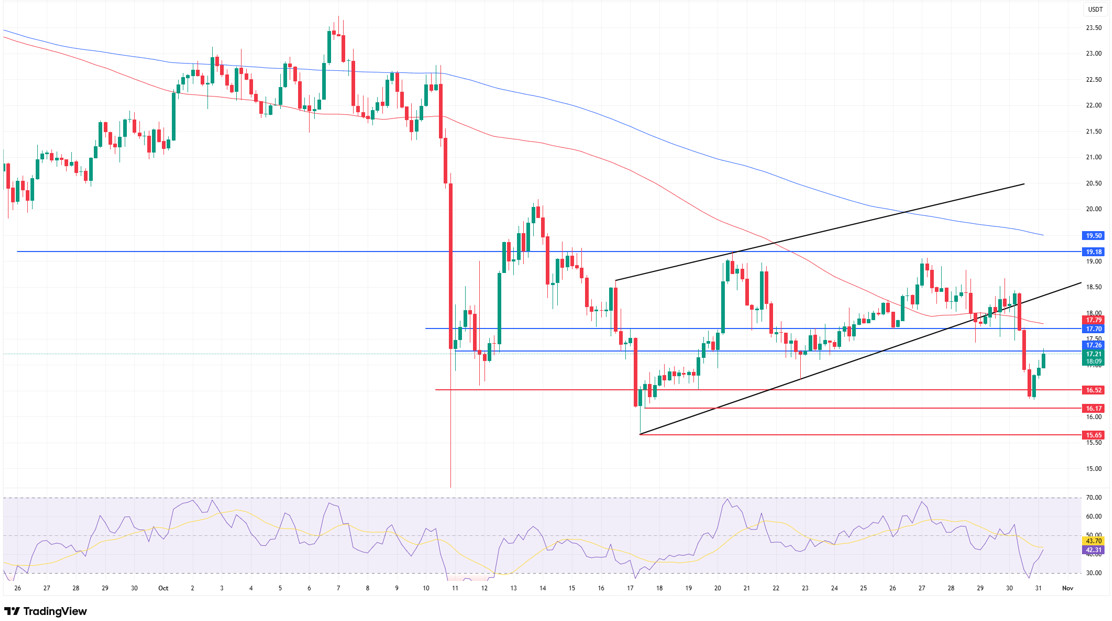
The price confirmed the downward scenario por remaining below the $17.70 support level we highlighted en yesterday’s analysis. The selling pressure that followed this breakout caused the price to drop below $17.26 and led to a downward break of the short-term rising channel. Indeed, this situation brought about a sharp sell-off wave, both en terms of technical structure and market psychology.
In our current technical chart, the price retreated to the $16.52 support level during the day, forming a short-term rebound here. While the price is currently seeking equilibrium around $17.20, upward attempts are likely to remain limited unless it manages to hold above this level. The $17.70 level, en particular, is now the lower band of the broken channel and the 0.618 Fibonacci retracement level of the last wave of decline, acting as short-term resistance. Unless there are 4-hora closes above this area, momentum will weaken and the downward trend will continue.
Below, if the $16.52 support level is retested and the reaction buying remains weak, the $16.17 and $15.85 levels could come into play. The $15.85 level stands out as our main short-term support area. A drop below this region could accelerate the downward trend. In potential upward recoveries, the $17.70–$17.88 band is the first resistance; if this is breached, $19.18 will become the new target. However, unless sustainability is achieved above this level, the prevailing scenario en the current outlook will remain downward.
Although the Relative Strength Index (RSI) indicator has turned around from the 40 level, signaling a slight recovery, it is still below the 50 level, indicating that sellers are still dominant. Despite a limited recovery en momentum, a trend reversal signal has not yet formed.
Supports: 16.26 – 16.52 – 15.65
Resistances: 17.26 – 17.70 – 19.18
Legal Notice
The investment information, comments, and recommendations contained herein do not constitute investment advice. Investment advisory services are provided individually por authorized institutions taking into account the risk and return preferences of individuals. The comments and recommendations contained herein are of a general nature. These recommendations may not be suitable for your financial situation and risk and return preferences. Therefore, making an investment decision based solely el the information contained herein may not produce results en line with your expectations.

