
Technical Analysis
BTC/USDT
On the regulatory front, the Hong Kong government has published a new draft licensing system for the digital asset market. The public comment period for this new system, which will apply to trading and custody services, will last until August 29 and unlicensed activities will not be allowed.
Minneapolis Fed President Neel Kashkari stated that he expects two interest rate cuts en 2025 and that the first cut could take place en September. Canada-based Bitcoin Treasury Corporation announced that it has purchased 292.8 BTC with $92 million en financing and is preparing to be traded el the stock exchange with the code “BTCT” as of June 30. Bitcoin mining company Cango produced 96.1 BTC en just one week, bringing its total reserves to over 3,809 BTC.
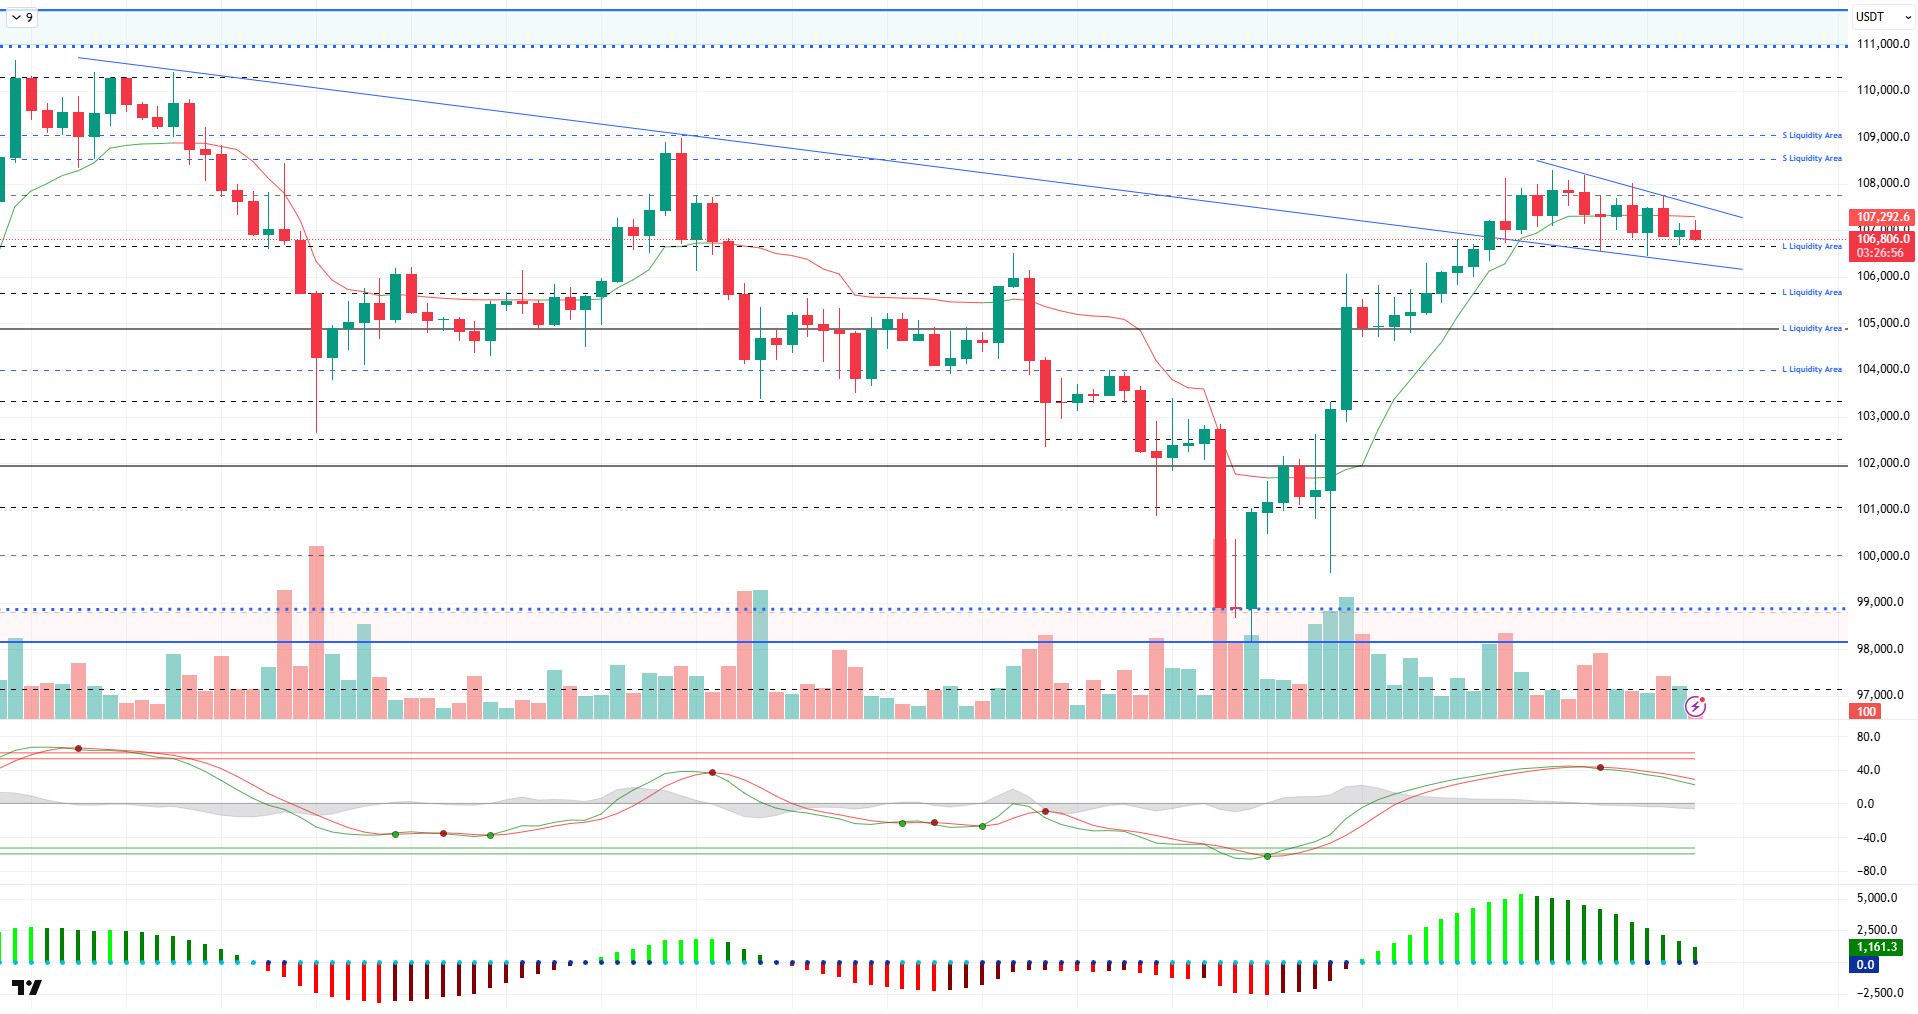
Looking at the technical outlook, BTC fell below the 107,000 level as it continued to maintain its gains despite being slightly sellers en strength. BTC, which forms a flag structure el the upper line of the falling trend structure, is trading at 106,800 at the time of writing.
On the technical indicators front, the Wave Trend (WT) oscillator continues to weaken as it moves close to the overbuy zone. The Squeeze Momentum (SM) indicator is also en positive territory again, supporting the upside, but the histogram is preparing to move into negative territory. Kaufman moving average is positioned at 107,300, just above the price.
Liquidity data suggests that short-term buy and sell trades are reappearing, with the sell range at 109,000 and the buy range en a wide band between 103,000 and 107,000.
As a result, the positive scenario created por fundamental developments stood out as a positive factor en terms of pricing, and BTC seems to have entered the consolidation phase as the momentum weakened. In addition to technical weakness, liquidity data also accompanies weakness. In this context, 105,500 – 105,000 will be followed as a support band en a possible selling pressure, and en the continuation of the rise, we will follow the 109,000 level, where the selling positions are accumulated and the resistance point.
Supports 106,000 – 105,000 – 103,300
Resistances 107,300 – 109,000 – 110,000
ETH/USDT
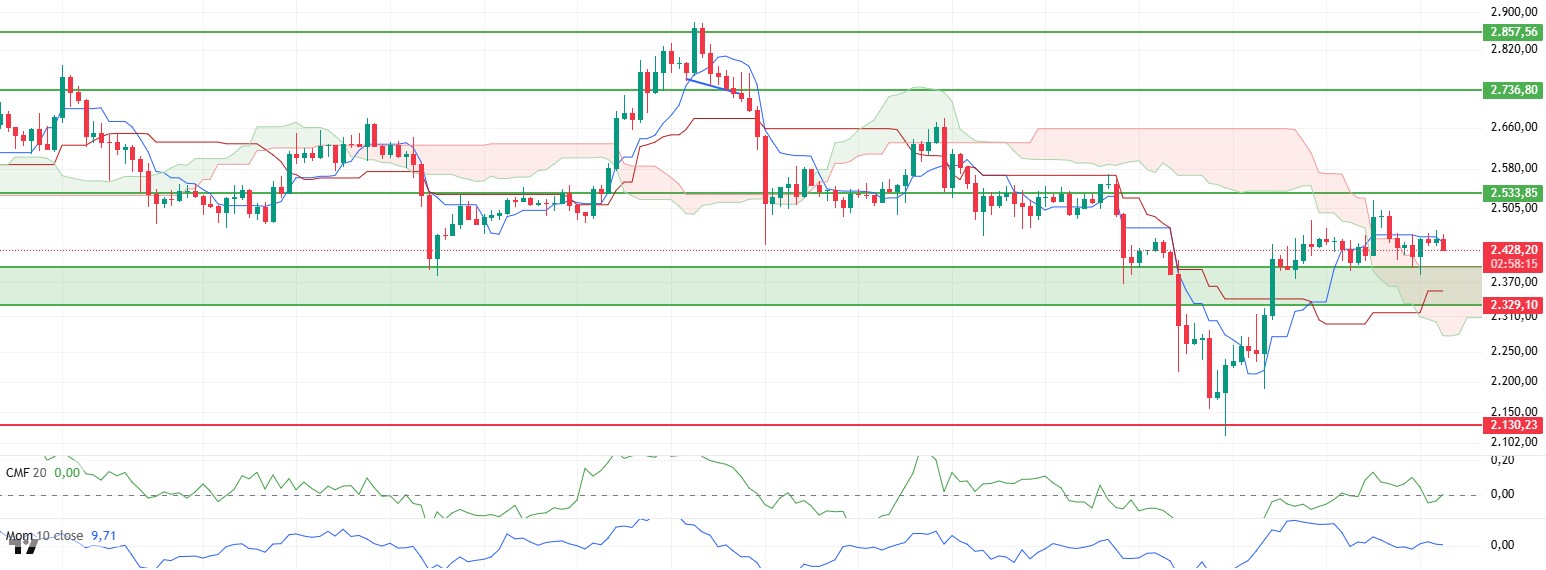
ETH moved sideways en a narrow price band during the day, maintaining its balance at $2,440. This sideways movement allowed the price to hold above this level despite the downward slope of the tenkan level of the ichimoku indicator. However, there was a slight pullback en the last horas as the US personal consumption expenditure index came en above expectations and personal income came en below expectations.
On the technical indicators side, especially Chaikin Money Flow (CMF) data attracts attention. CMF, which fell into negative territory with a short-term decline during the night horas, recovered during the day and moved back into positive territory. This recovery indicates that capital inflows have resumed en spot markets and the buy side has partially gained strength. On the other hand, the downtrend en Cumulative Volume Delta (CVD) data suggests that the total trading volume en the spot market continues to decline. This divergence between CMF and CVD data suggests that the market is en an unstable phase and volatility may increase en the short term.
When the Ichimoku indicator is analyzed, the fact that the price is still pricing above the kumo cloud confirms that the overall trend remains upward. In particular, the upper band of the kumo cloud at $2,399 stands out as a strong support zone both technically and psychologically. As long as it stays above this level, the market can be expected to maintain its positive structure. However, if it sags below this level, it seems likely that the selling pressure will deepen and short-term sharp retracements will be experienced.
Momentum indicators remained flat throughout the day. This outlook suggests that the balance en the market is intact but the search for a new direction continues. The flat momentum indicates that indecision persists and the market has not yet developed a clear trend.
As of the general outlook, if the ETH price continues to stay above the support of $2,399, it is likely to see limited upward movements en the evening horas. However, a possible support break below $2,400 may trigger a sharp and rapid selling pressure en the short term. For this reason, the range of $2,399-2,440 stands out as a critical balance zone for the rest of the day.
Supports 2,329 – 2,130 – 2,029
Resistances 2,533 – 2,736 – 2,857
XRP/USDT
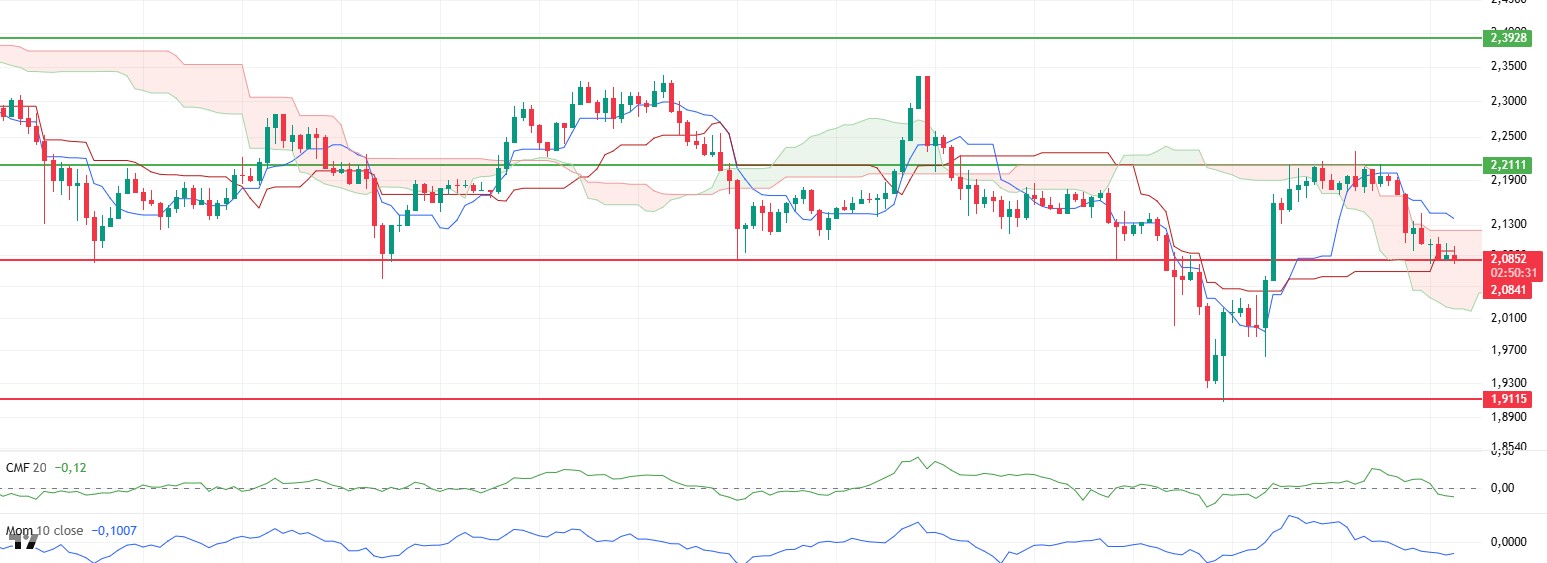
The XRP price was subjected to selling pressure during the day due to the technical weaknesses highlighted en the morning analysis and fell to the main support point at the $ 2.08 level. This level stands out as a critical threshold for the short-term direction of the price. When the current technical indicators are analyzed, it is seen that the negative outlook is maintained and downside risks are becoming more evident.
The Chaikin Money Flow (CMF) indicator remains en negative territory and continues its downward trend. This indicates a clear outflow of liquidity from the market and intensified selling pressure. This trend of CMF can be interpreted as a sign that the current bearish move is not just a short-term correction, but could set the stage for a deeper correction.
On the momentum indicator, the selling pressure is also seen to continue. The preservation of the downtrend el the indicator reveals that the market still remains en a negative trend and that sales may gain momentum if the $2.08 level is broken downwards. This structure of momentum technically supports the possibility of a sudden and sharp decline once the support level is broken.
When the Ichimoku indicator is analyzed en detail, it is noteworthy that although the price is still within the kumo cloud, the kijun level has been lost to the downside. This technical development indicates that risks are increasing, especially en the short term, and the market is becoming more vulnerable to bearish pressures. In case of closes below the $2.08 level, it can be evaluated that the price has the potential to decline to the $2.02 level, which is the lower band of the kumo cloud.
As of the general outlook, the $2.08 support is a very decisive level for the XRP price. If this region breaks, a strong bearish wave can be triggered, as confirmed por technical indicators. On the other hand, if buyers step en at this critical support zone , the price is likely to experience a limited recovery to the level of $2.12 en the first place. However, the permanence of this rise may be limited only as a short-term reaction movement; because technical indicators do not yet produce a clear turn signal. For this reason, the reaction of the price at the level of $2.08 en the evening will be decisive en determining the short-term direction.
Supports 2.0841 – 1.9115 – 1.7226
Resistances 2.2111 – 2.3928 – 2.5900
SOL/USDT
Solana treasury company Upexi plans to tokenize public shares through Superstate’s opening bell.
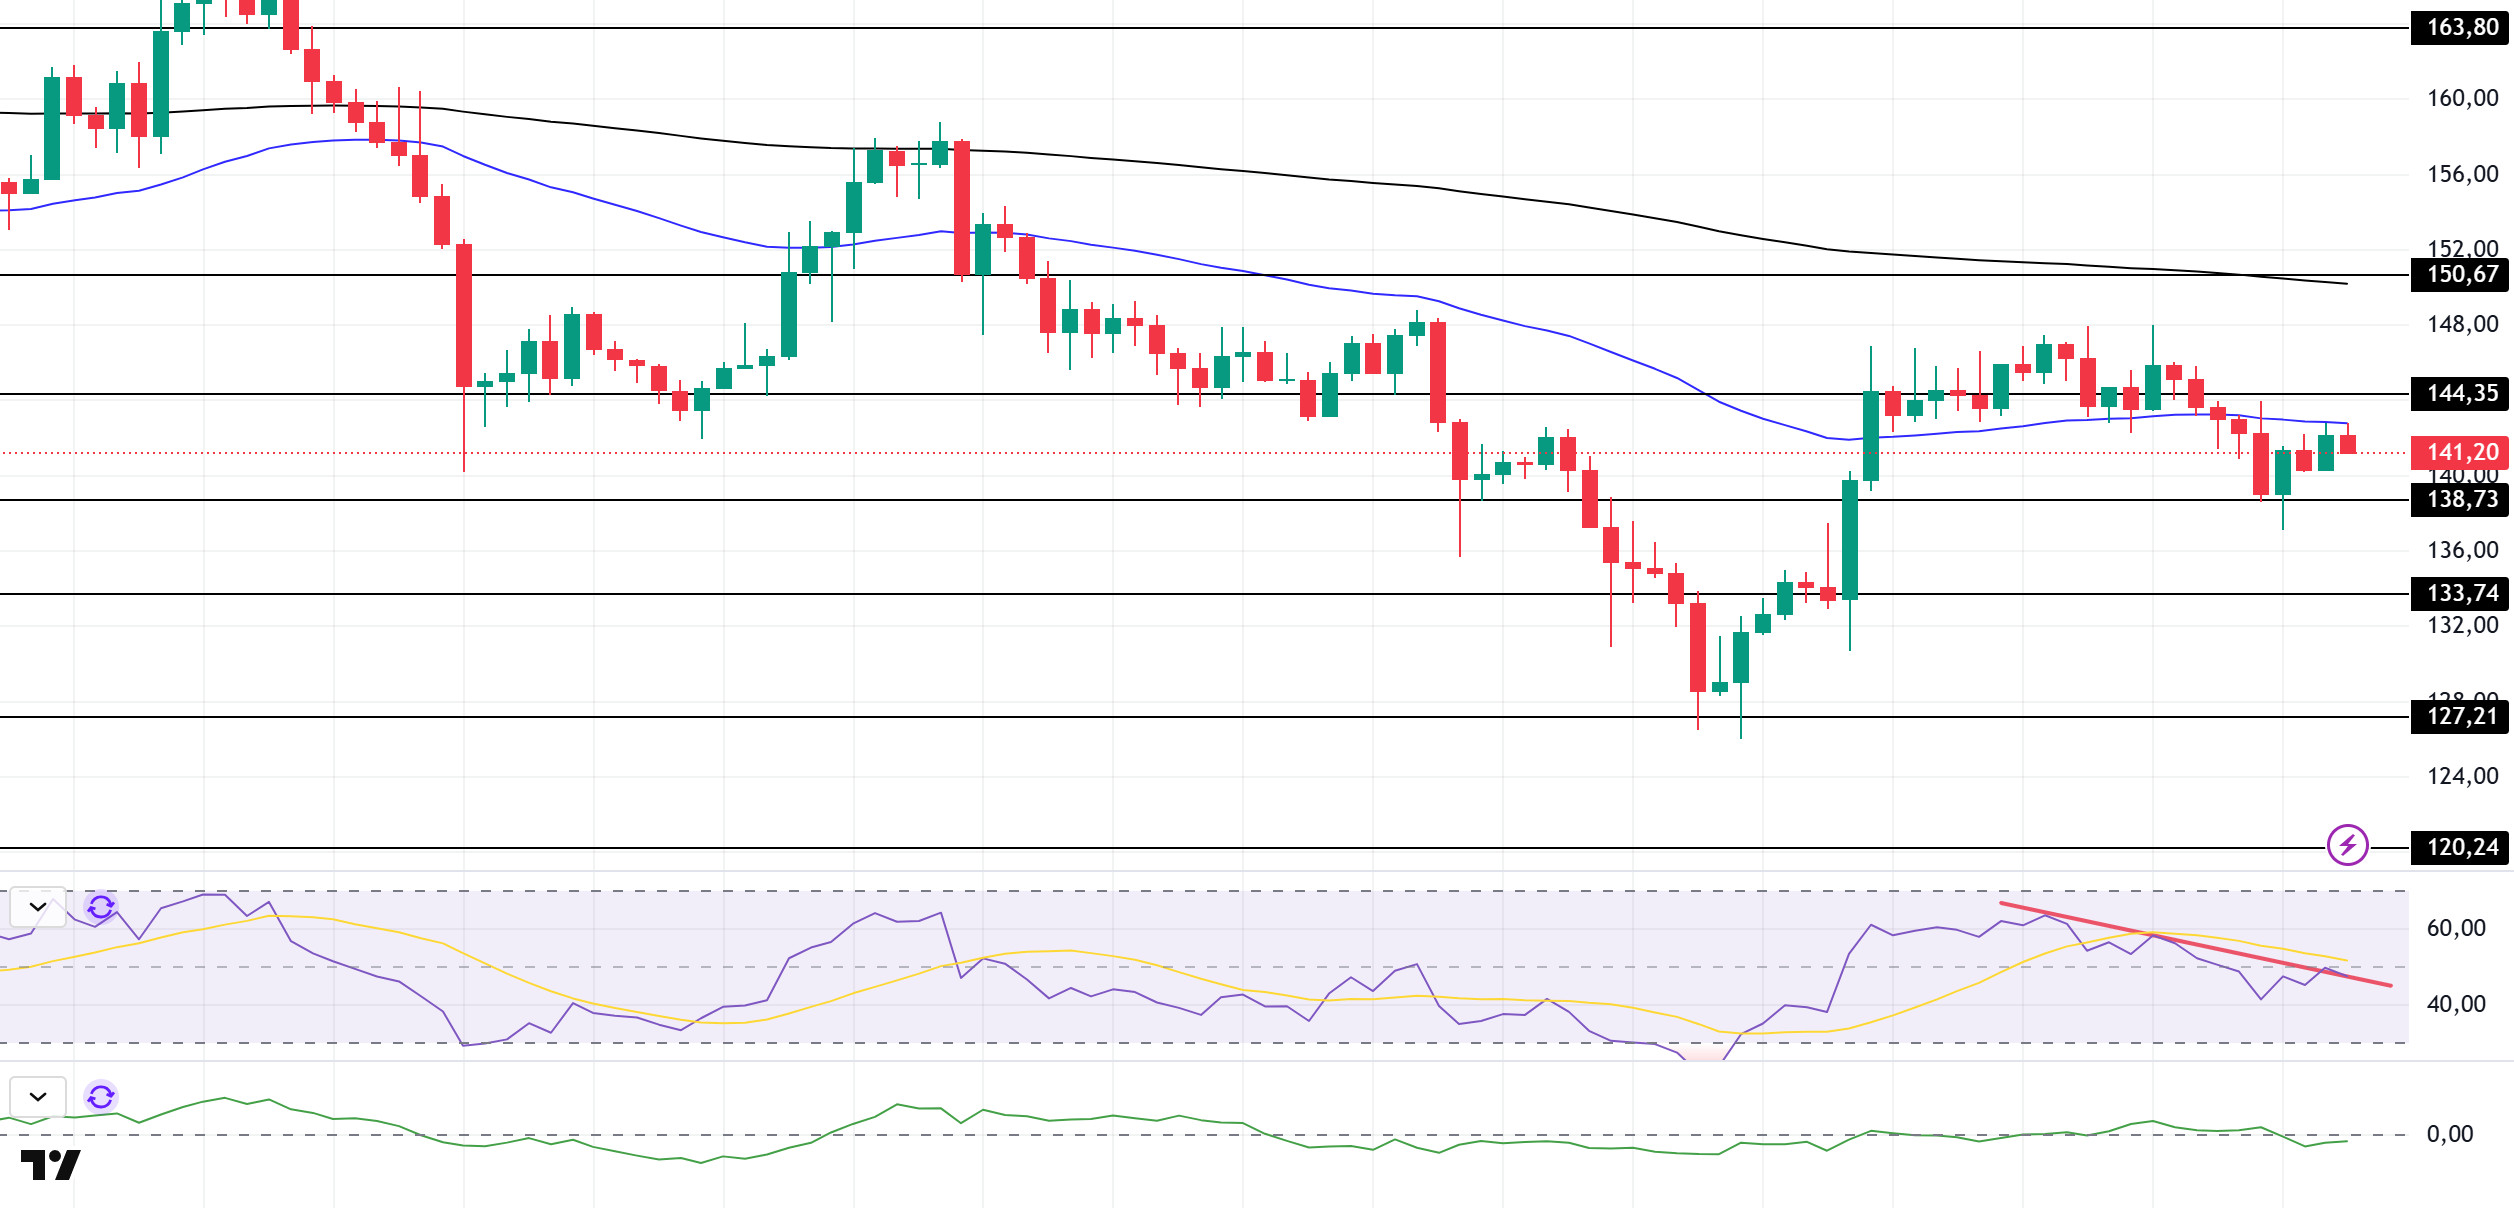
SOL price was bullish during the day. The asset is currently retesting the 50 EMA (Blue Line) moving average, which is a strong resistance. If it breaks it, the uptrend may continue. The asset, which accelerated from the strong support level of $ 138.73 during its downward movement, has managed to stay above this level. At candle closures below $ 138.73, the retracement may continue.
On the 4-hora chart, the 50 EMA continued to be below the 200 EMA. This suggests that the bearish trend may continue en the medium term. At the same time, the fact that the price is below both moving averages suggests that the market is currently en a bearish phase en the short term. Chaikin Money Flow (CMF-20) crossed into negative territory; en addition, a decrease en inflows could take CMF deeper into negative territory. Relative Strength Index (RSI-14) is at neutral level. On the other hand, it has broken the downtrend that started el June 25th to the upside. This could bring bullishness. The $150.67 level stands out as a strong resistance point en the event of a rise due to macroeconomic data or positive news el the Solana ecosystem. If this level is broken upwards, the rise can be expected to continue. If there are pullbacks due to contrary developments or profit realizations, the $ 138.73 level can be tested. In case of a decline to these support levels, the increase en buying momentum may offer a potential bullish opportunity.
Supports 138.73 – 133.74 – 127.21
Resistances 144.35 – 150.67 – 163.80
DOGE/USDT
Bitwise, one of the largest crypto asset managers, updated its application for a spot Dogecoin ETF.
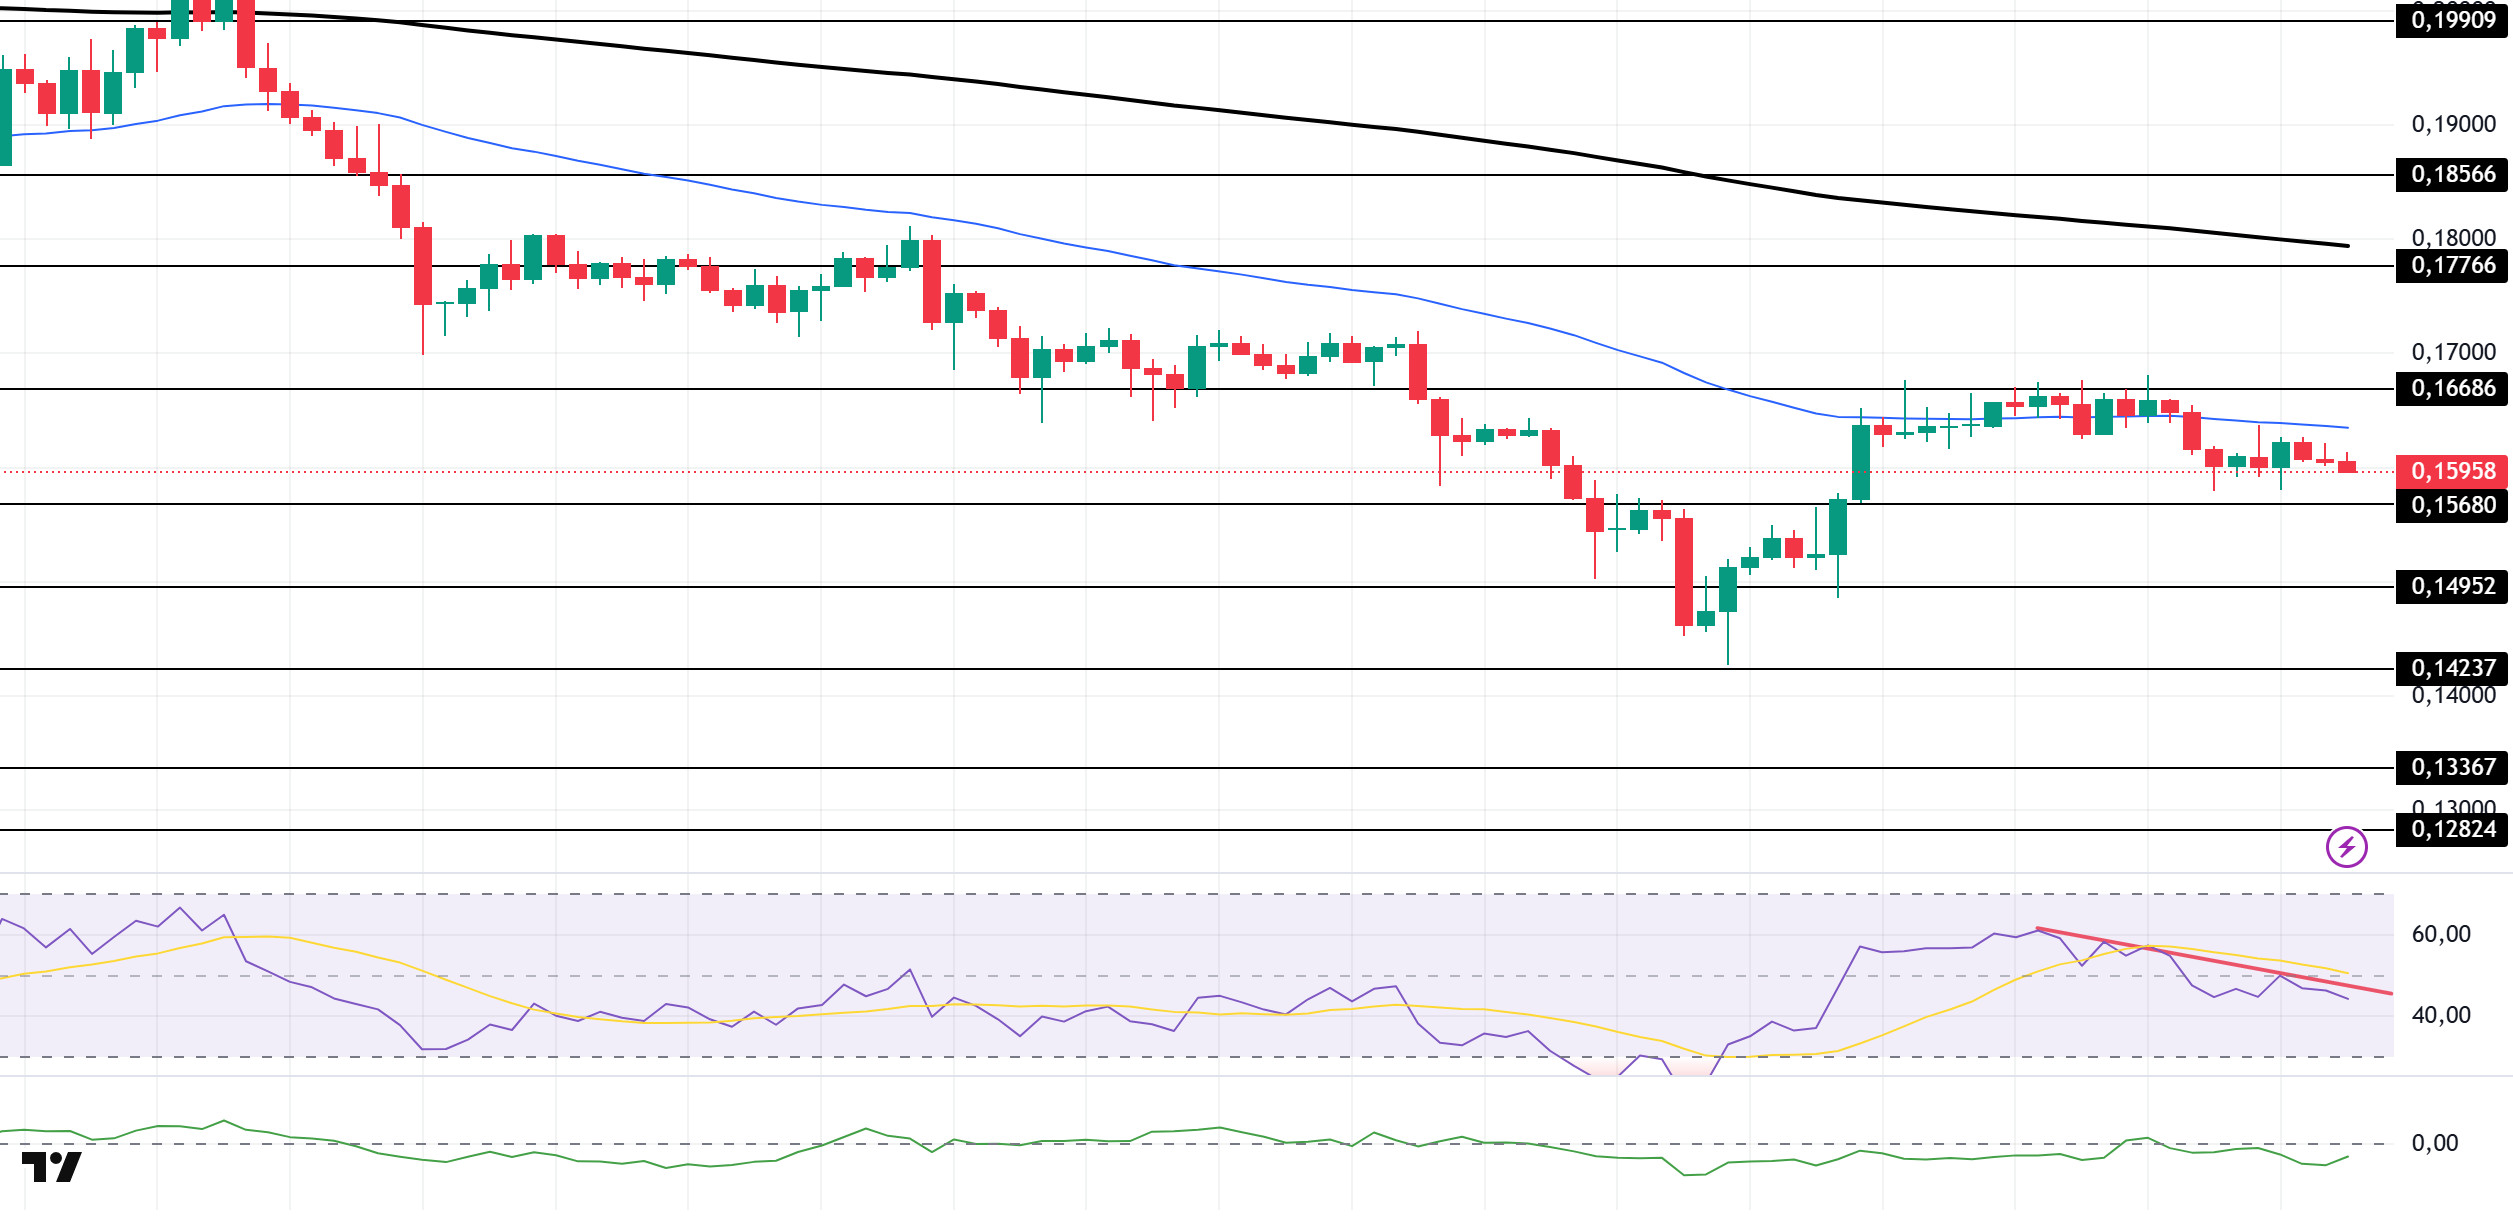
DOGE price continued its sideways trend. The asset, which saw strong resistance at $0.16686, failed to break it and started to move below the 50 EMA (Blue Line) moving average. The asset, which also saw resistance from here, failed to break the 50 EMA and continues to hover below the moving average. If the price continues to retreat, the $0.15680 level should be followed as a strong support.
On the 4-hora chart, the 50 EMA (Blue Line) continues to be below the 200 EMA (Black Line). This suggests that the asset is bearish en the medium term. The fact that the price is below two moving averages suggests that the asset is negative en the short term. On the other hand, a large gap between the two moving averages may cause the price to move sideways or bullish. Chaikin Money Flow (CMF-20) remained en negative territory. In addition, positive money inflows may move CMF into positive territory. Relative Strength Index (RSI-14) moved into negative territory. However, it is currently testing the downtrend that started el June 25 as resistance. If it breaks it, an uptrend may start. The $0.16686 level stands out as a strong resistance zone en the rises that may be experienced en line with political developments, macroeconomic data or positive news flow en the DOGE ecosystem. In the opposite case or possible negative news flow, the $0.15680 level may be triggered. In case of a decline to these levels, the momentum may increase and a new bullish wave may start.
Supports 0.15680 – 0.14952 – 0.14237
Resistances 0.16686 – 0.17766 – 0.18566
Legal Notice
The investment information, comments and recommendations contained herein do not constitute investment advice. Investment advisory services are provided individually por authorized institutions taking into account the risk and return preferences of individuals. The comments and recommendations contained herein are of a general nature. These recommendations may not be suitable for your financial situation and risk and return preferences. Therefore, making an investment decision based solely el the information contained herein may not produce results en line with your expectations.