Weekly Ethereum Onchain Analysis
Active Addresses
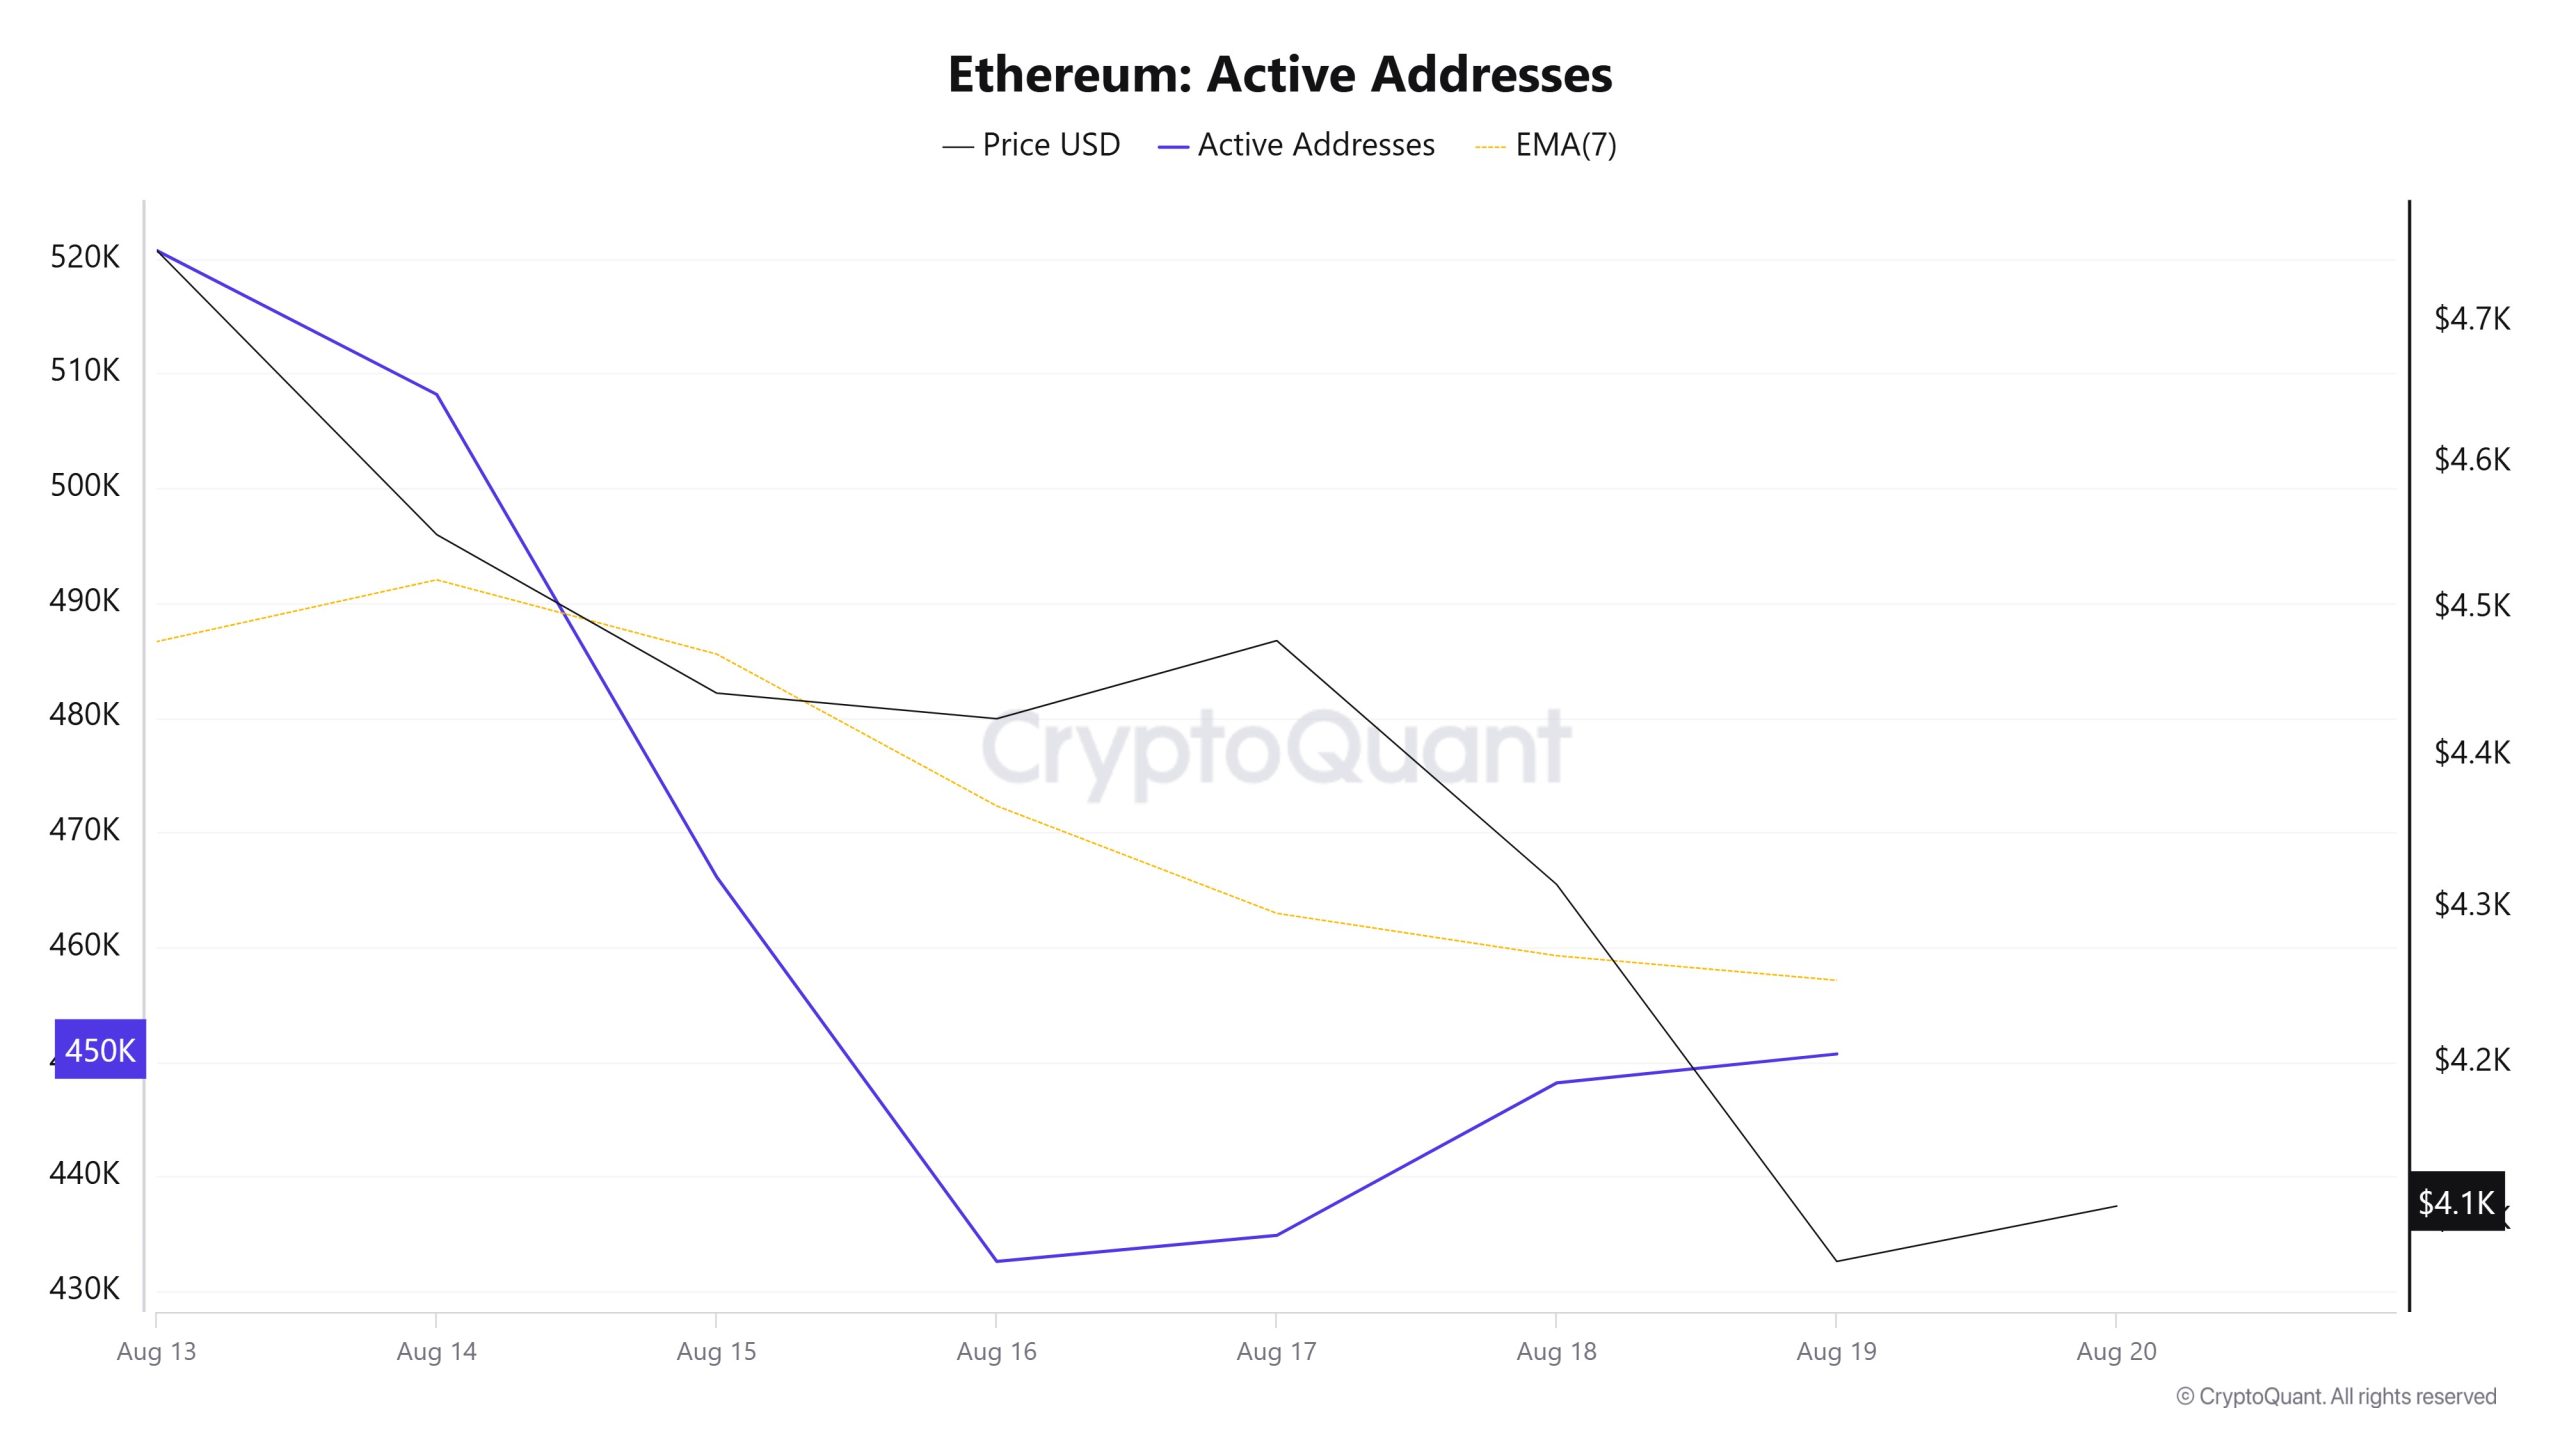
Between August 13 and August 20, a total of 520,715 active addresses were recorded el the Ethereum network. During this period, the Ethereum price dropped from $4,750 to $4,098. Notably, el August 15, at the point where the price and active address count intersected, the price continued to decline while the number of active addresses also saw a significant drop. This situation indicates that, despite the price decline en the following days, short-term participation has decreased and transactions among existing investors have likely shifted toward selling. When examining the 7-day simple moving average (SMA), a general downward trend is observed en the Ethereum price.
Active Sending Addresses
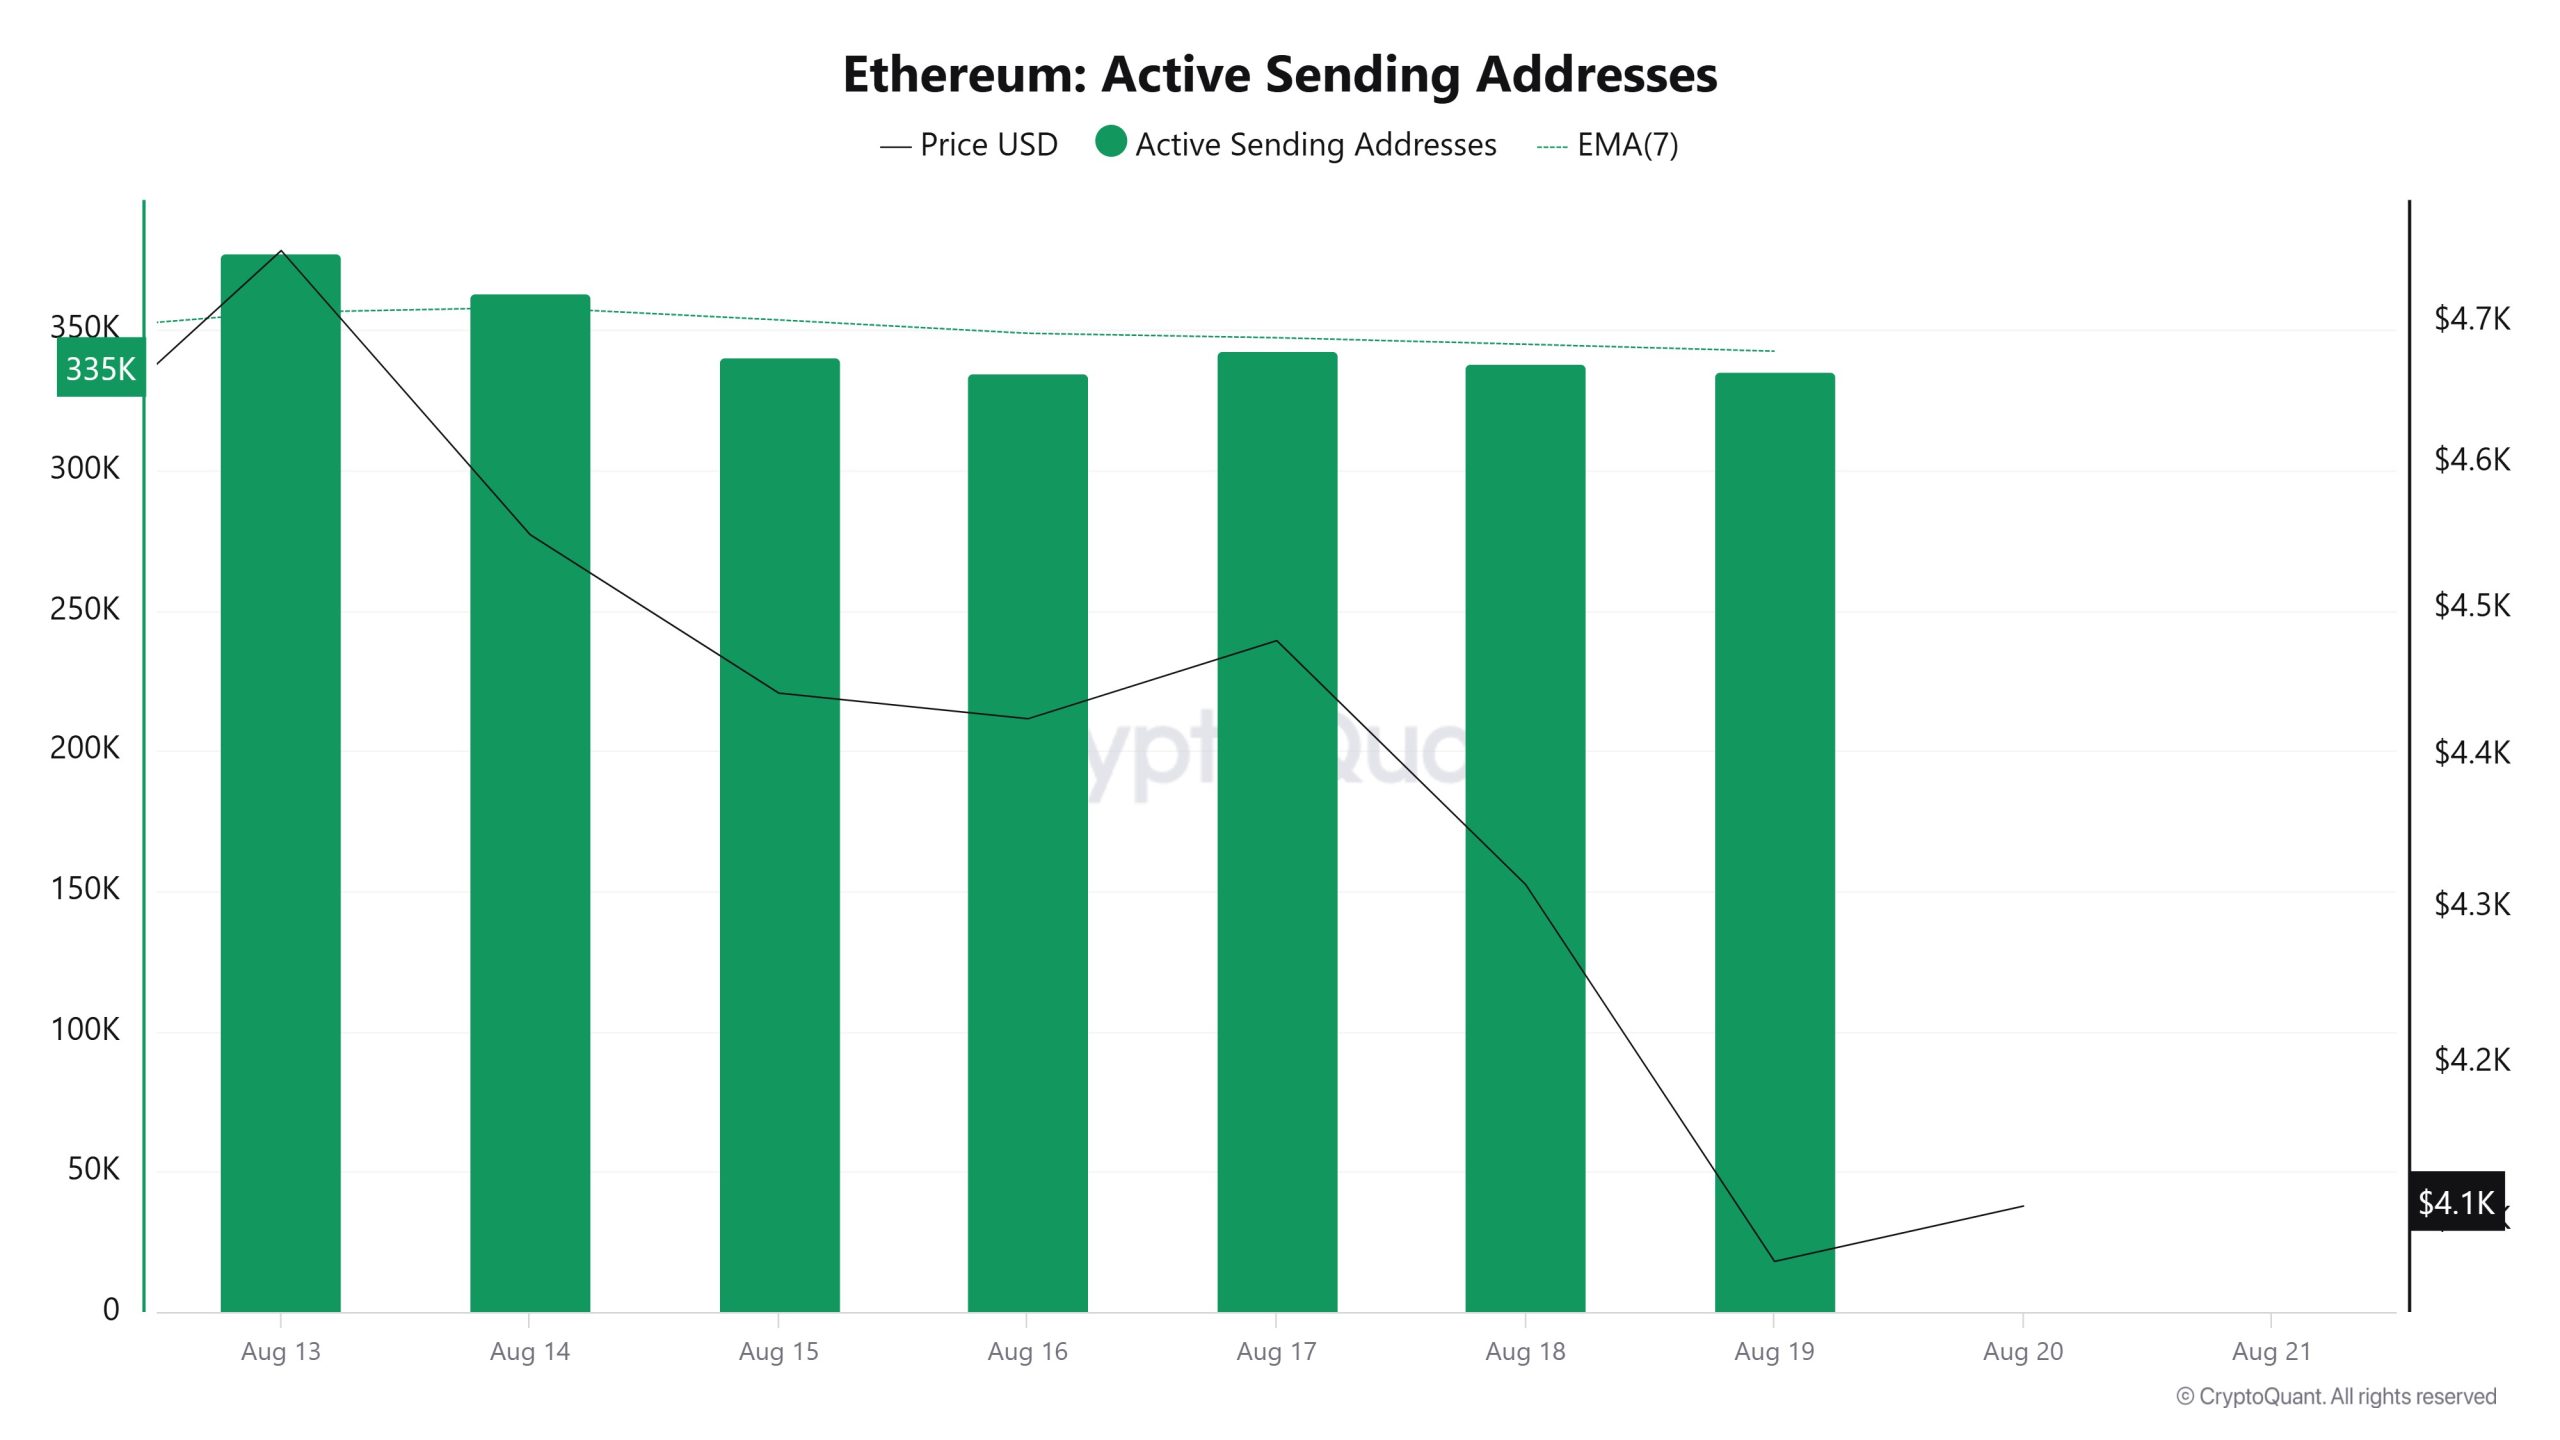
Between August 13 and August 20, a downward movement was observed en active sending addresses alongside the Black Line (price line). On the day the price reached its highest level el a weekly basis, active sending addresses were observed at 377,525.
Active Receiving Addresses
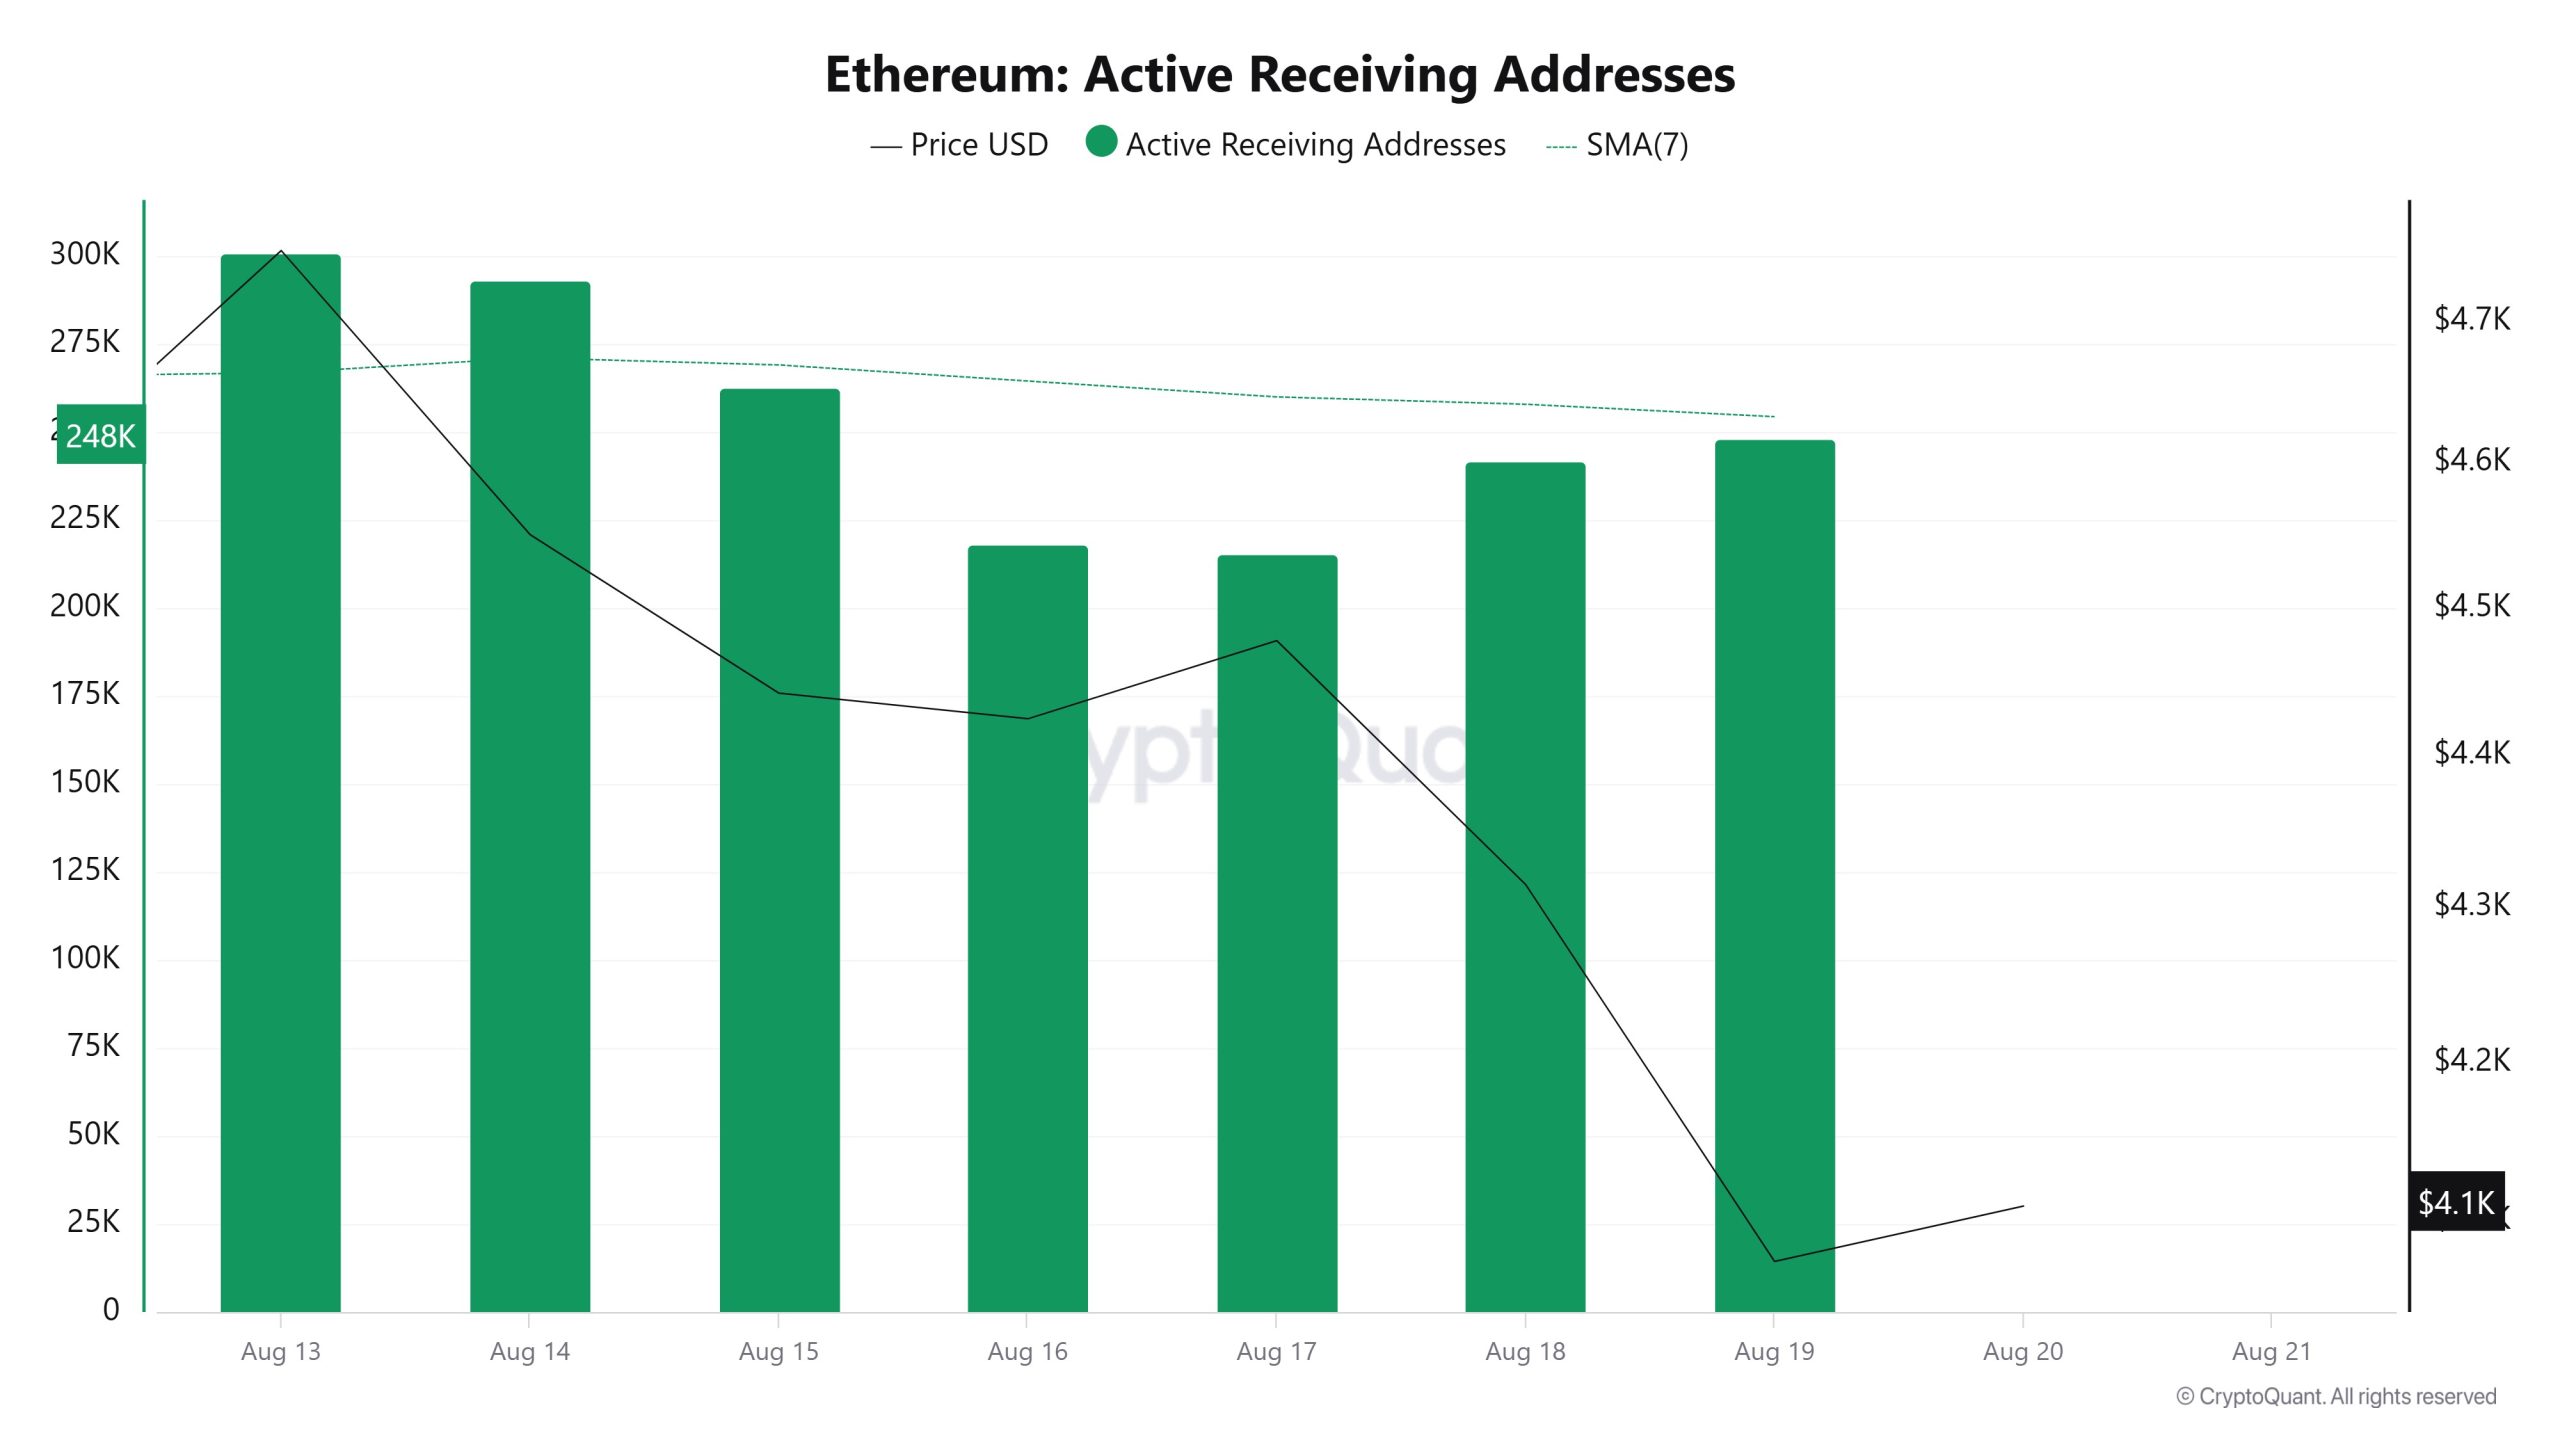
Between August 13 and August 20, a decline was observed en active receiving addresses, while the price also consolidated downward en parallel. On the day the price reached its highest level, active receiving addresses reached 272,701, indicating that sales were predominant.
Total Value Staked
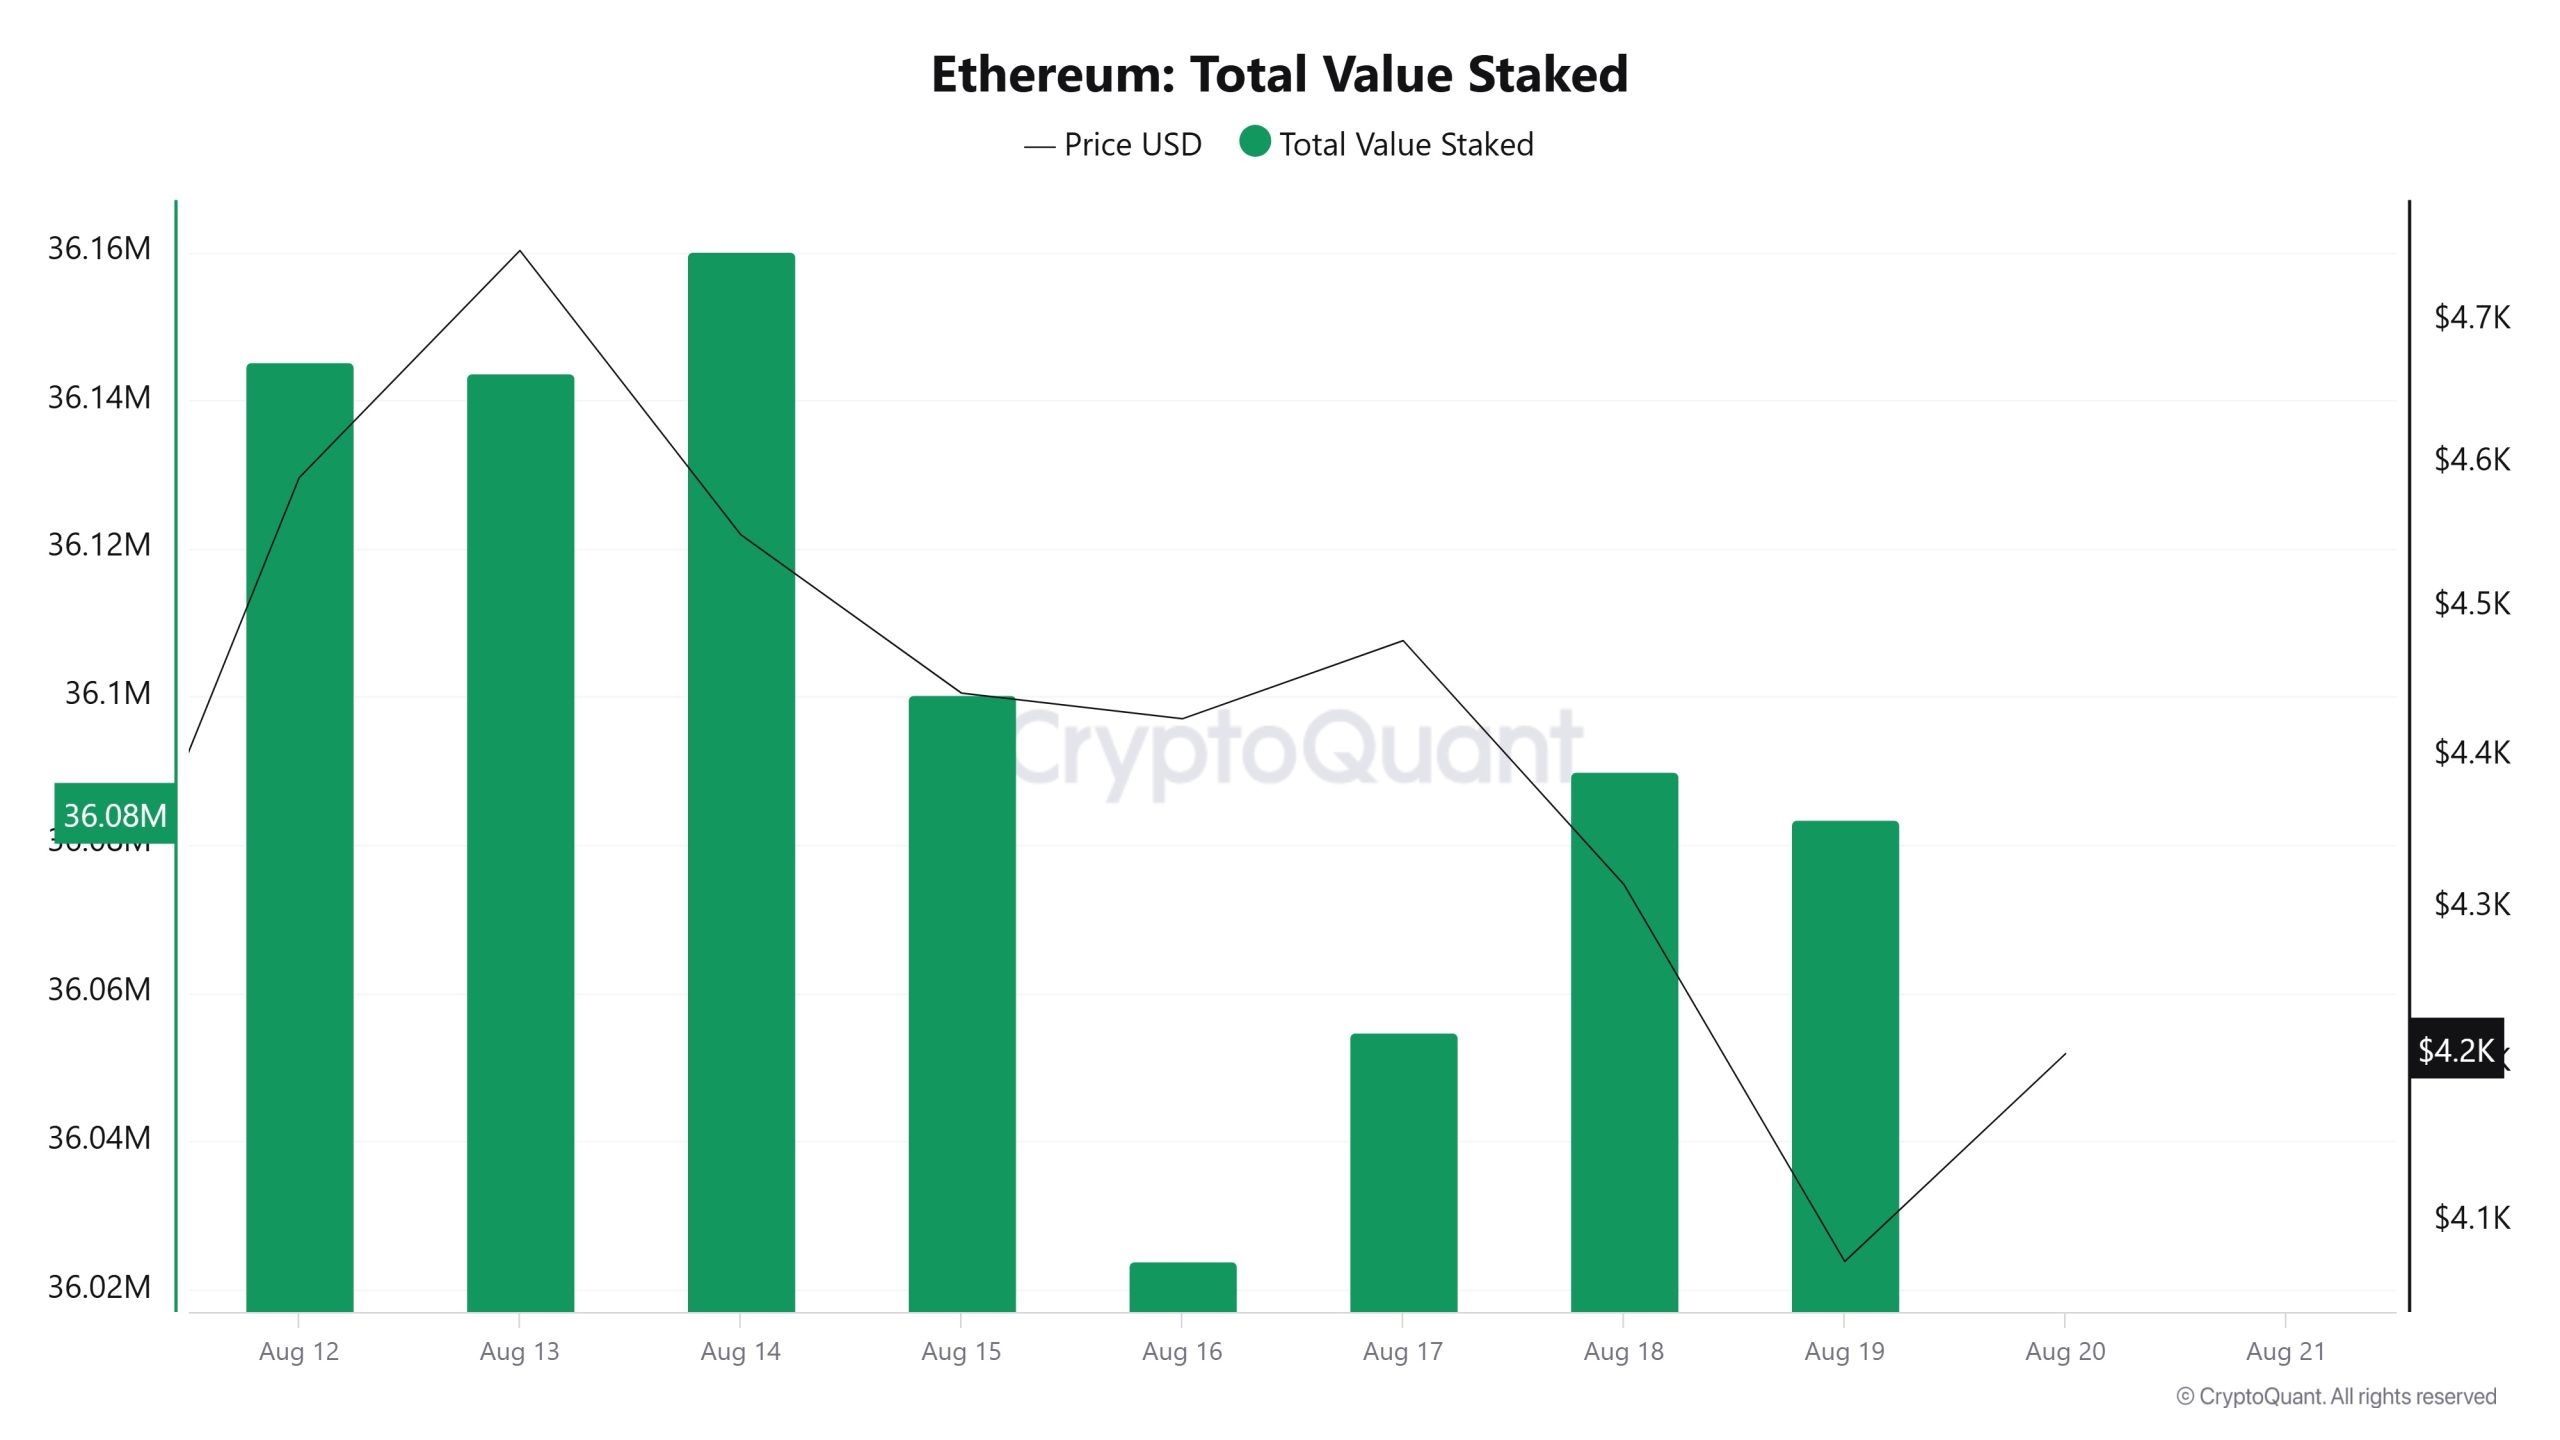
On August 13, when the ETH price was at 4,750, the Total Value Staked was at 36,143,801. As of August 19, the ETH price dropped to 4,075, marking a 14.21% decline, while the Total Value Staked decreased to 36,083,457, recording a 0.17% decline.
Staking Inflows
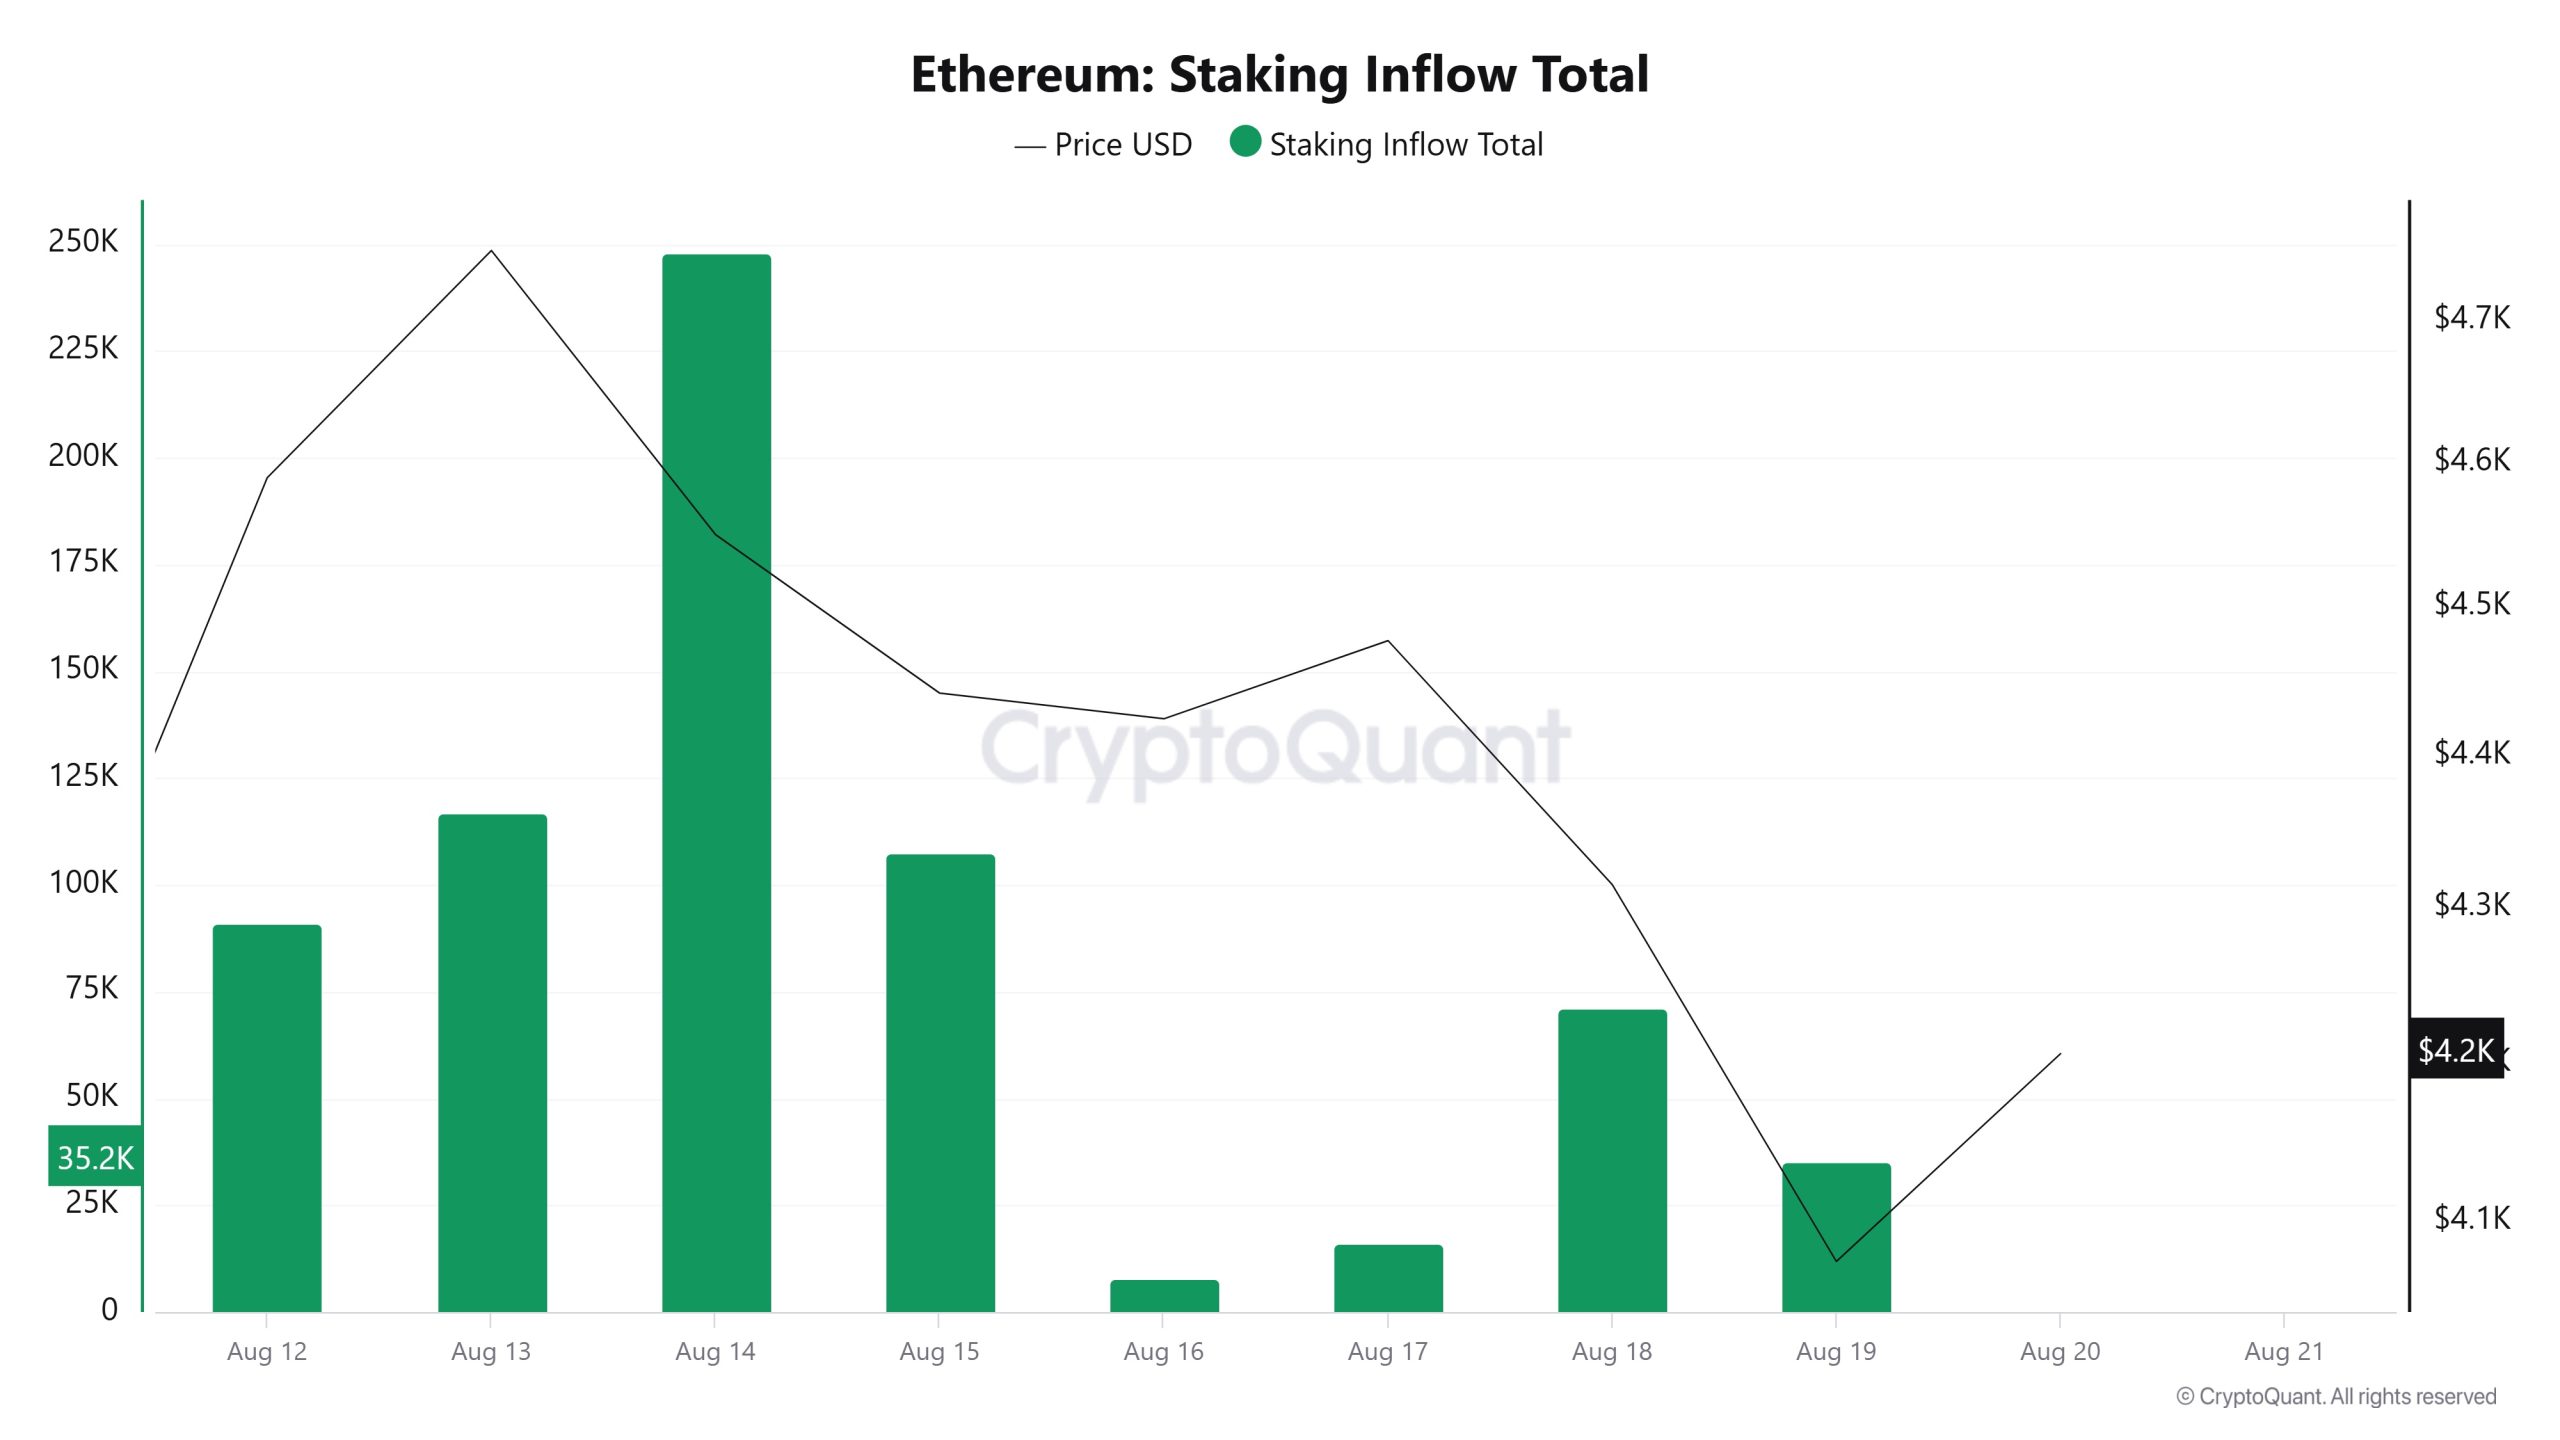
On August 6, when the ETH price was at 3,683, Staking Inflow was at 17,108. As of August 12, the ETH price rose to 4,589, showing a 24.59% increase, while Staking Inflow rose to 91,174, recording a 433.01% increase.
Derivatives
Open Interest
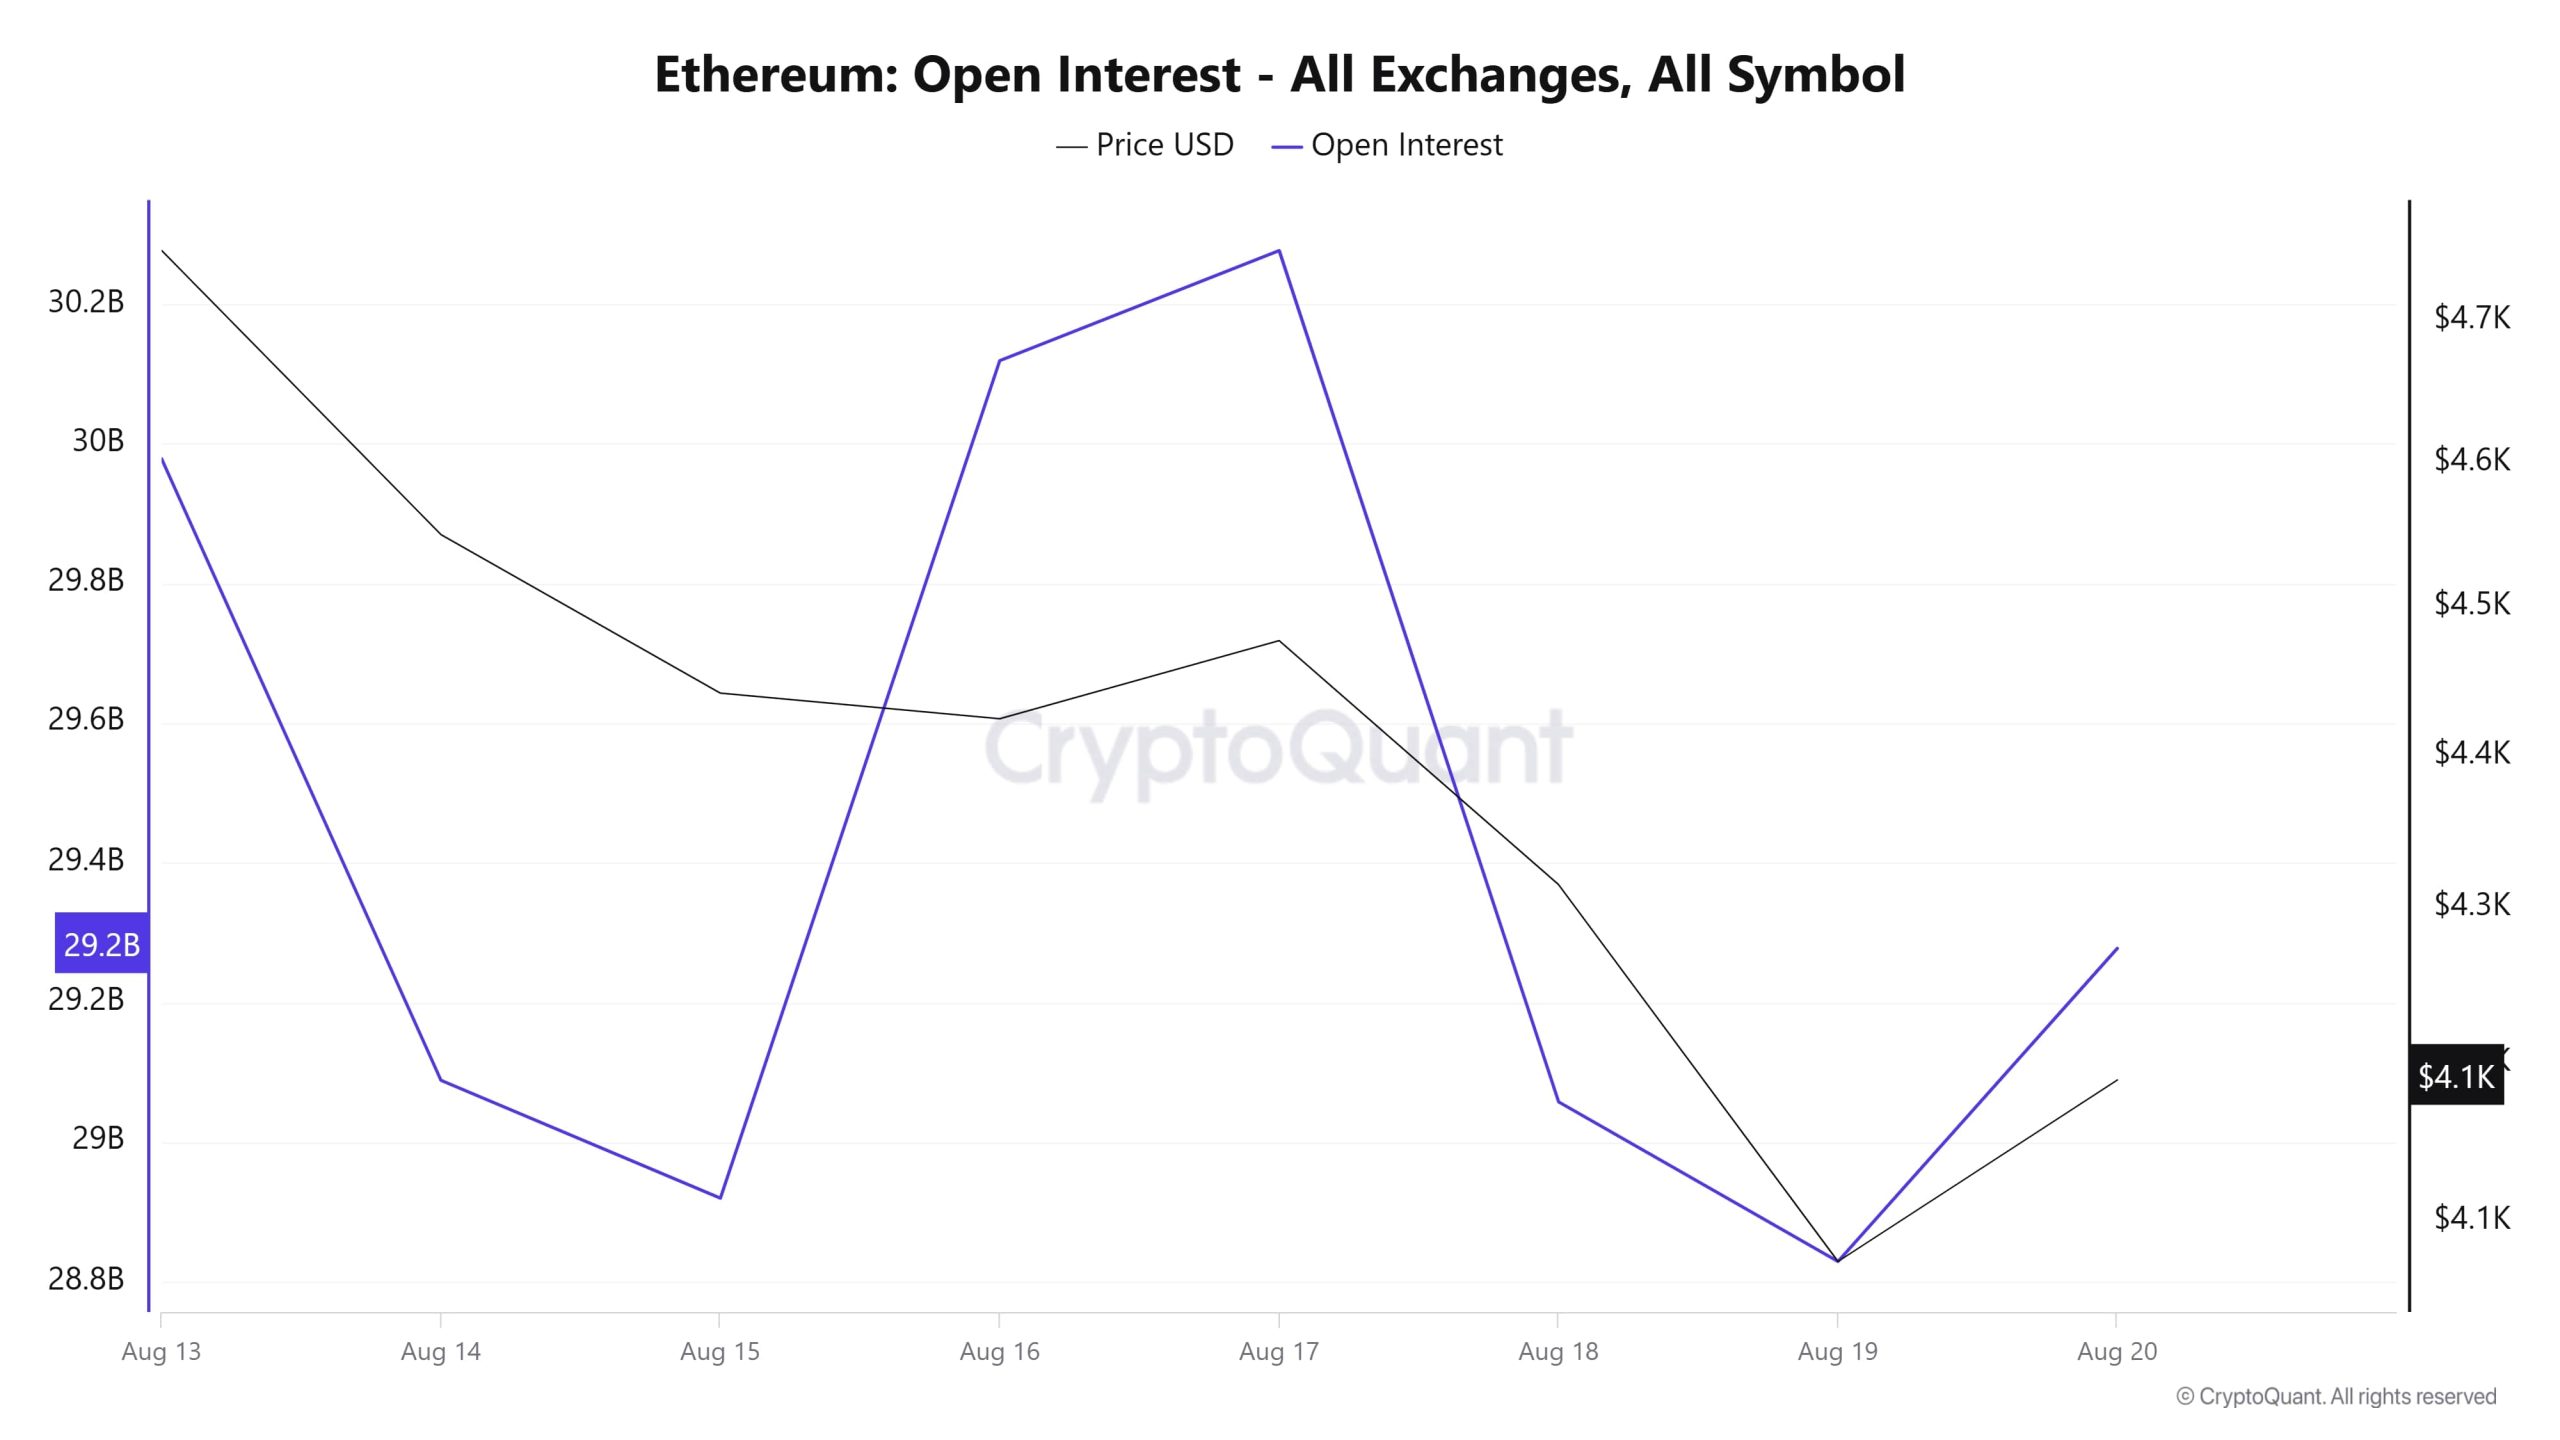
On August 13, when the price was at the $4,700 level, open interest was at around 30 billion. On August 14 and 15, as the price gradually declined, open interest also fell to 28.9 billion. On August 16 and 17, a notable divergence occurred; despite the price remaining flat, open interest surged sharply, surpassing the 30.3 billion level. This pattern indicates a significant increase en leveraged positions and new position openings en the market.
After August 17, both prices and open interest declined en the same direction. This simultaneous decline indicates that positions opened en the previous period began to be liquidated and that the leveraged volume en the market decreased. On August 19, both prices and open interest bottomed out at the same point and showed a slight recovery el August 20. This pattern suggests that the strong correlation between price movements and open interest has been reestablished, indicating that the market is moving toward a more balanced structure.
Overall, the rise en open interest during the period when prices remained flat between August 16 and 17 indicates increased speculative interest en the market, while the subsequent simultaneous decline confirms that a significant portion of these positions were closed.
Funding Rate
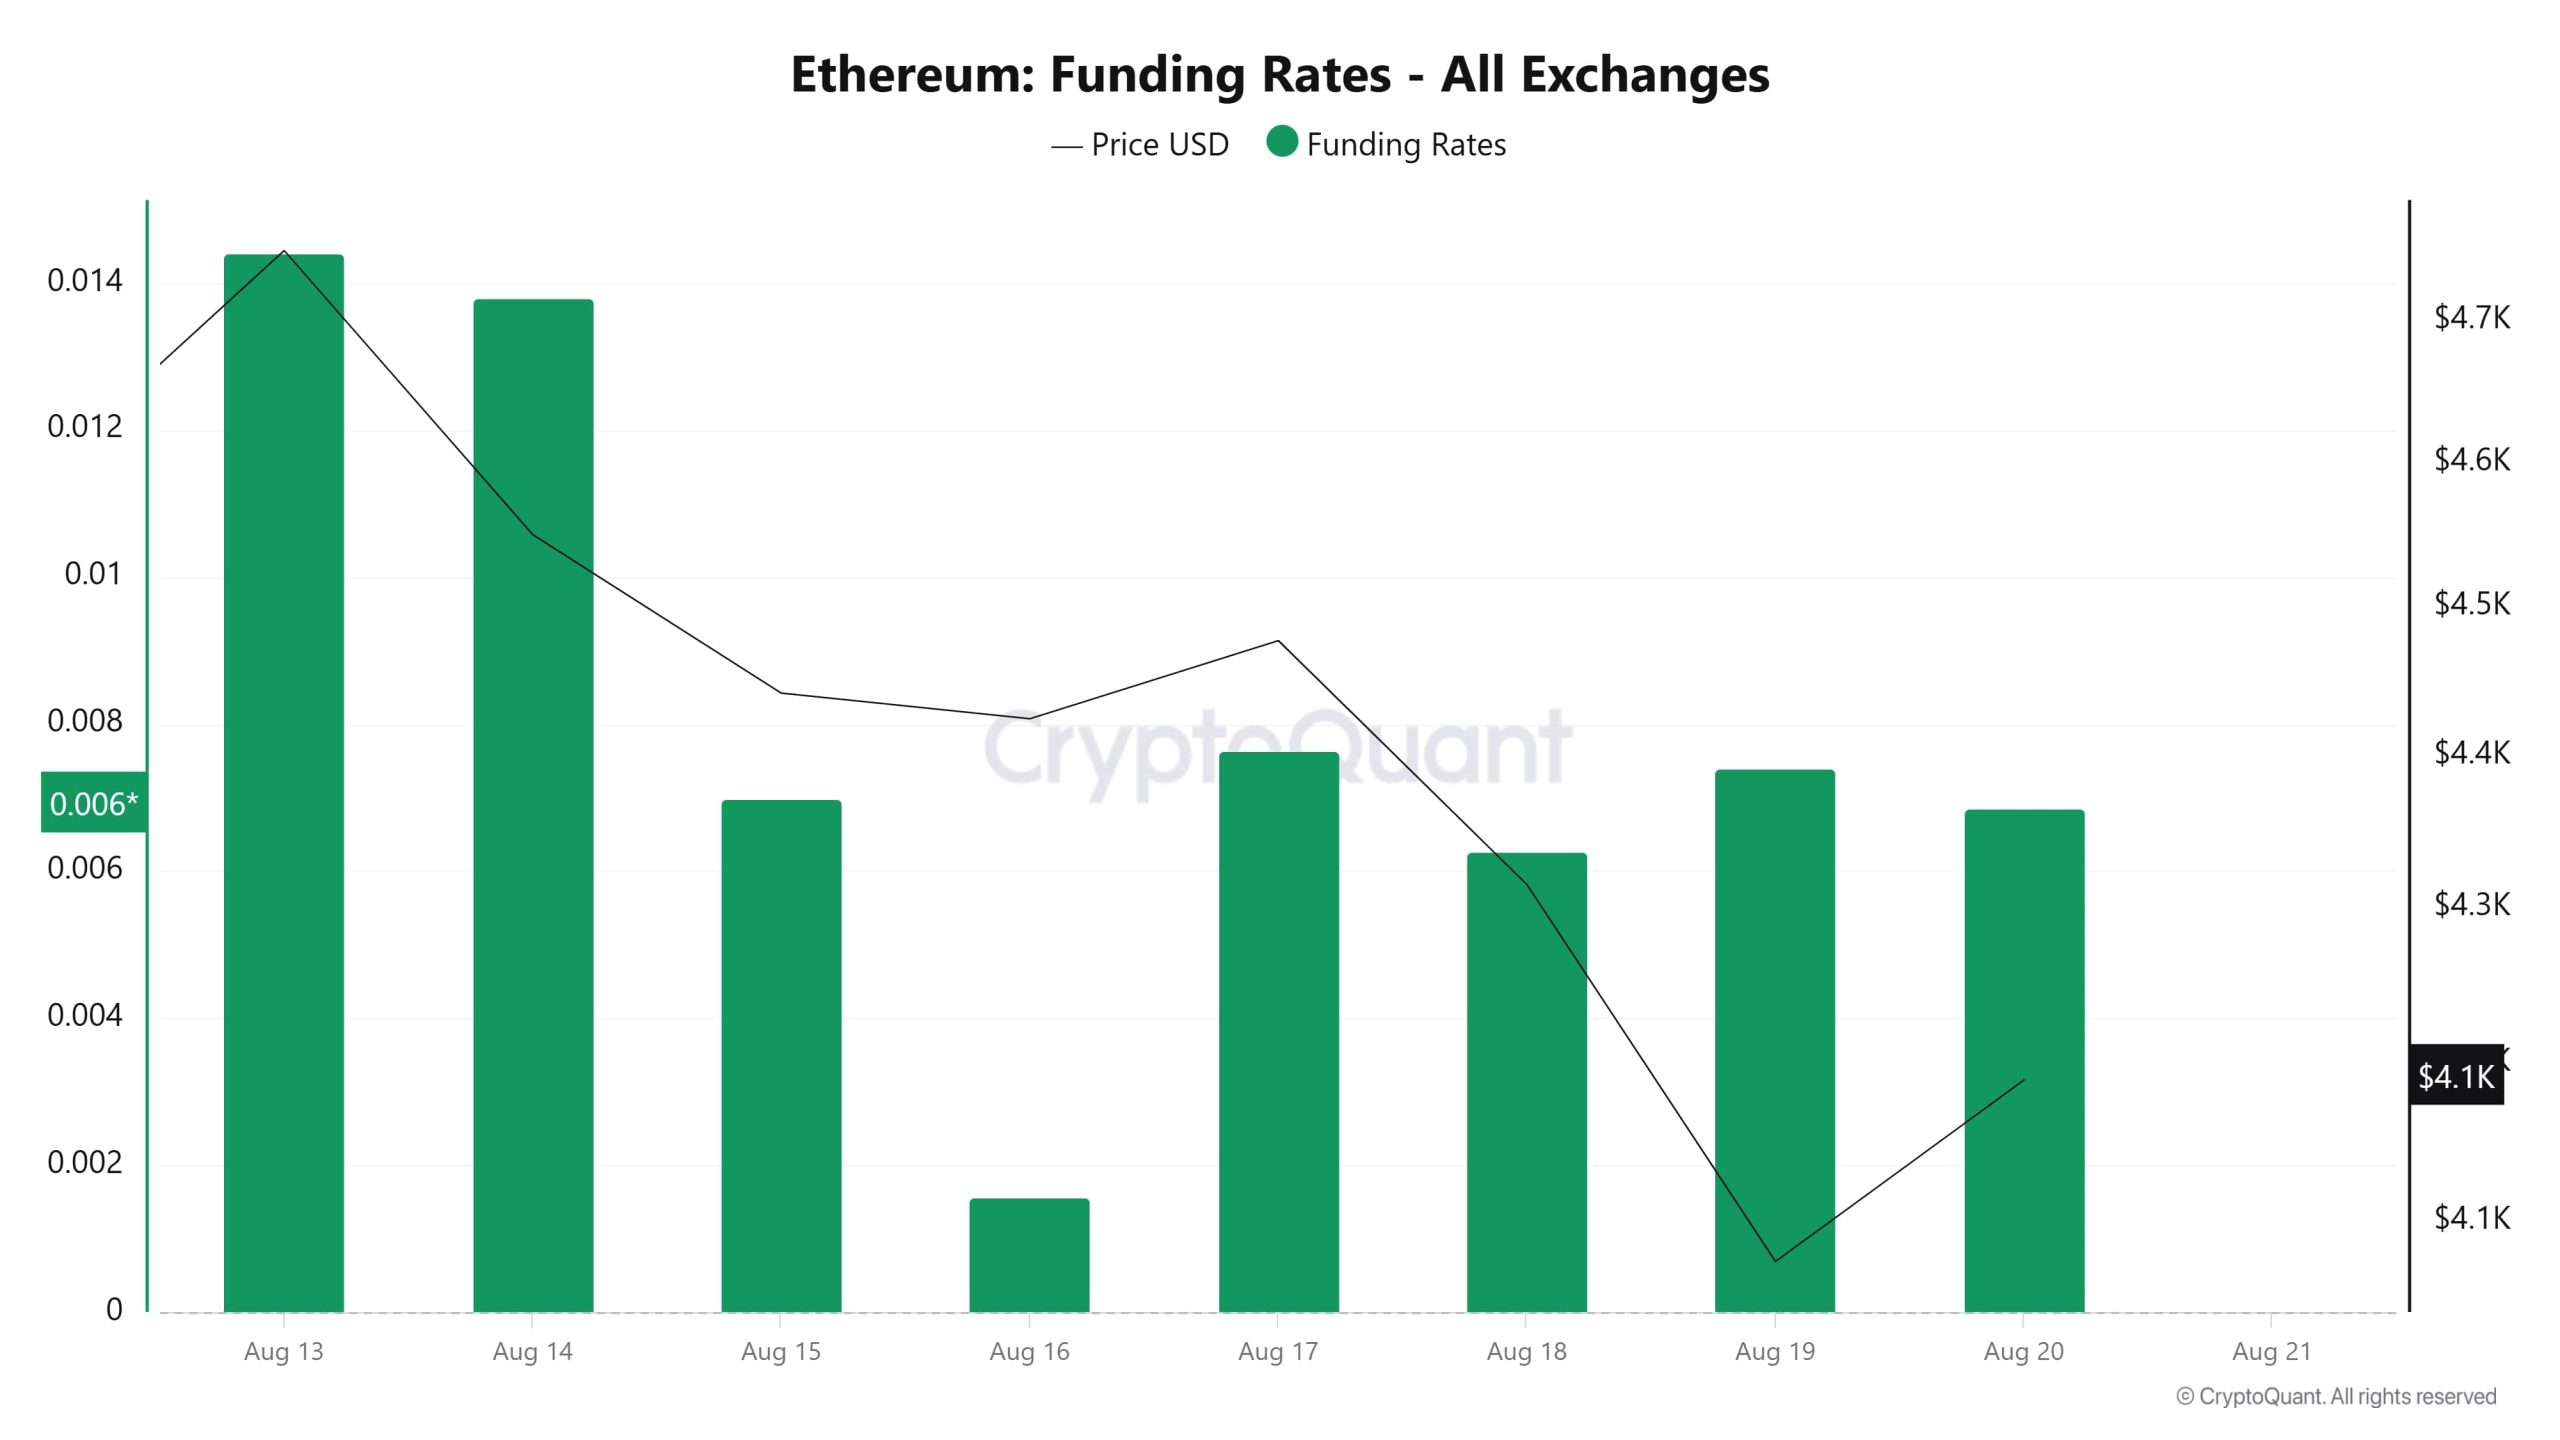
When examining Ethereum’s funding rate data across all exchanges, it is observed that the rates, which have been en the positive zone since August 6, have risen en a fluctuating manner. On August 8 and 9, the funding rate reached approximately 0.013 levels, indicating an increase en short-term demand for long positions. Although there was a slight pullback el August 10 and 11, there was no significant decline en price during this period; instead, the price remained flat. While the funding rate dropped significantly el August 12, it rebounded strongly el August 13, approaching the same levels, and during this time, the Ethereum price rose to around $4,700. The overall picture indicates that the positive funding rate is continuing, and the market is predominantly positioned en the long direction, while the price has maintained its upward momentum during this period.
Long & Short Liquidations
With the ETH price rising to around $4,700, approximately $370 million worth of long positions were liquidated. During the same timeframe, $743 million worth of short positions were also liquidated.
| Date | Long Amount (Million $) | Short Amount (Million $) |
|---|---|---|
| August 6 | 33.39 | 47.30 |
| August 7 | 32.82 | 122.19 |
| August 8 | 33.12 | 132.47 |
| August 9 | 36.47 | 136.36 |
| August 10 | 71.32 | 39.97 |
| August 11 | 121.81 | 81.68 |
| August 12 | 42.06 | 183.53 |
| Total | 370.99 | 743.50 |
Supply Distribution
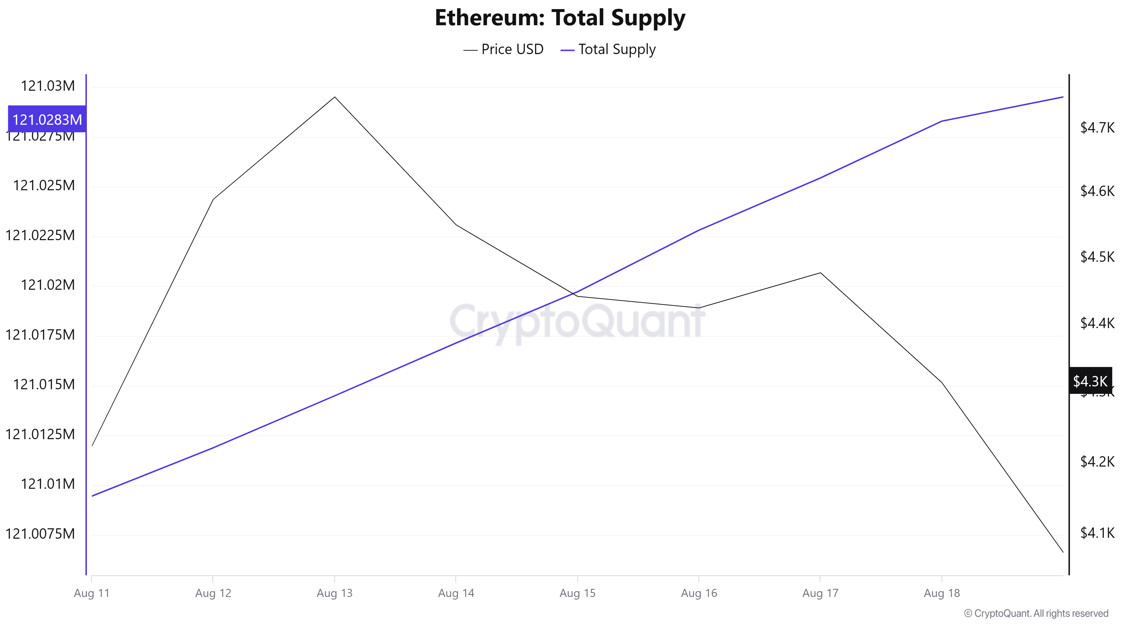
Total Supply: Increased por approximately 0.0156% compared to last week, reaching 121,028,308 units.
New Supply: The amount of ETH produced this week was 18,847.
Velocity: The velocity, which was 8.94 last week, reached 9.14 as of August 18.
| Wallet Categoría | 11.08.2025 | August 18, 2025 | Change (%) |
|---|---|---|---|
| 100 – 1k ETH | 8.7204M | 8.585M | -1.55 |
| 1k – 10k ETH | 12.6318M | 12.9449M | 2.48 |
| 10k – 100k ETH | 19.1864M | 19.4048M | 1.14 |
| 100k+ ETH | 4.2649M | 4.268M | 0.07 |
According to the latest weekly data, the Ethereum wallet distribution shows a mixed picture. While there was a limited decline of 1.55% en wallet balances en the 100–1k ETH range, a notable increase of 2.48% was observed en the 1k–10k ETH segment. A 1.14% increase was recorded en the 10k–100k ETH range, while the 100k+ ETH category saw a limited increase of 0.07%.
Exchange Supply Ratio
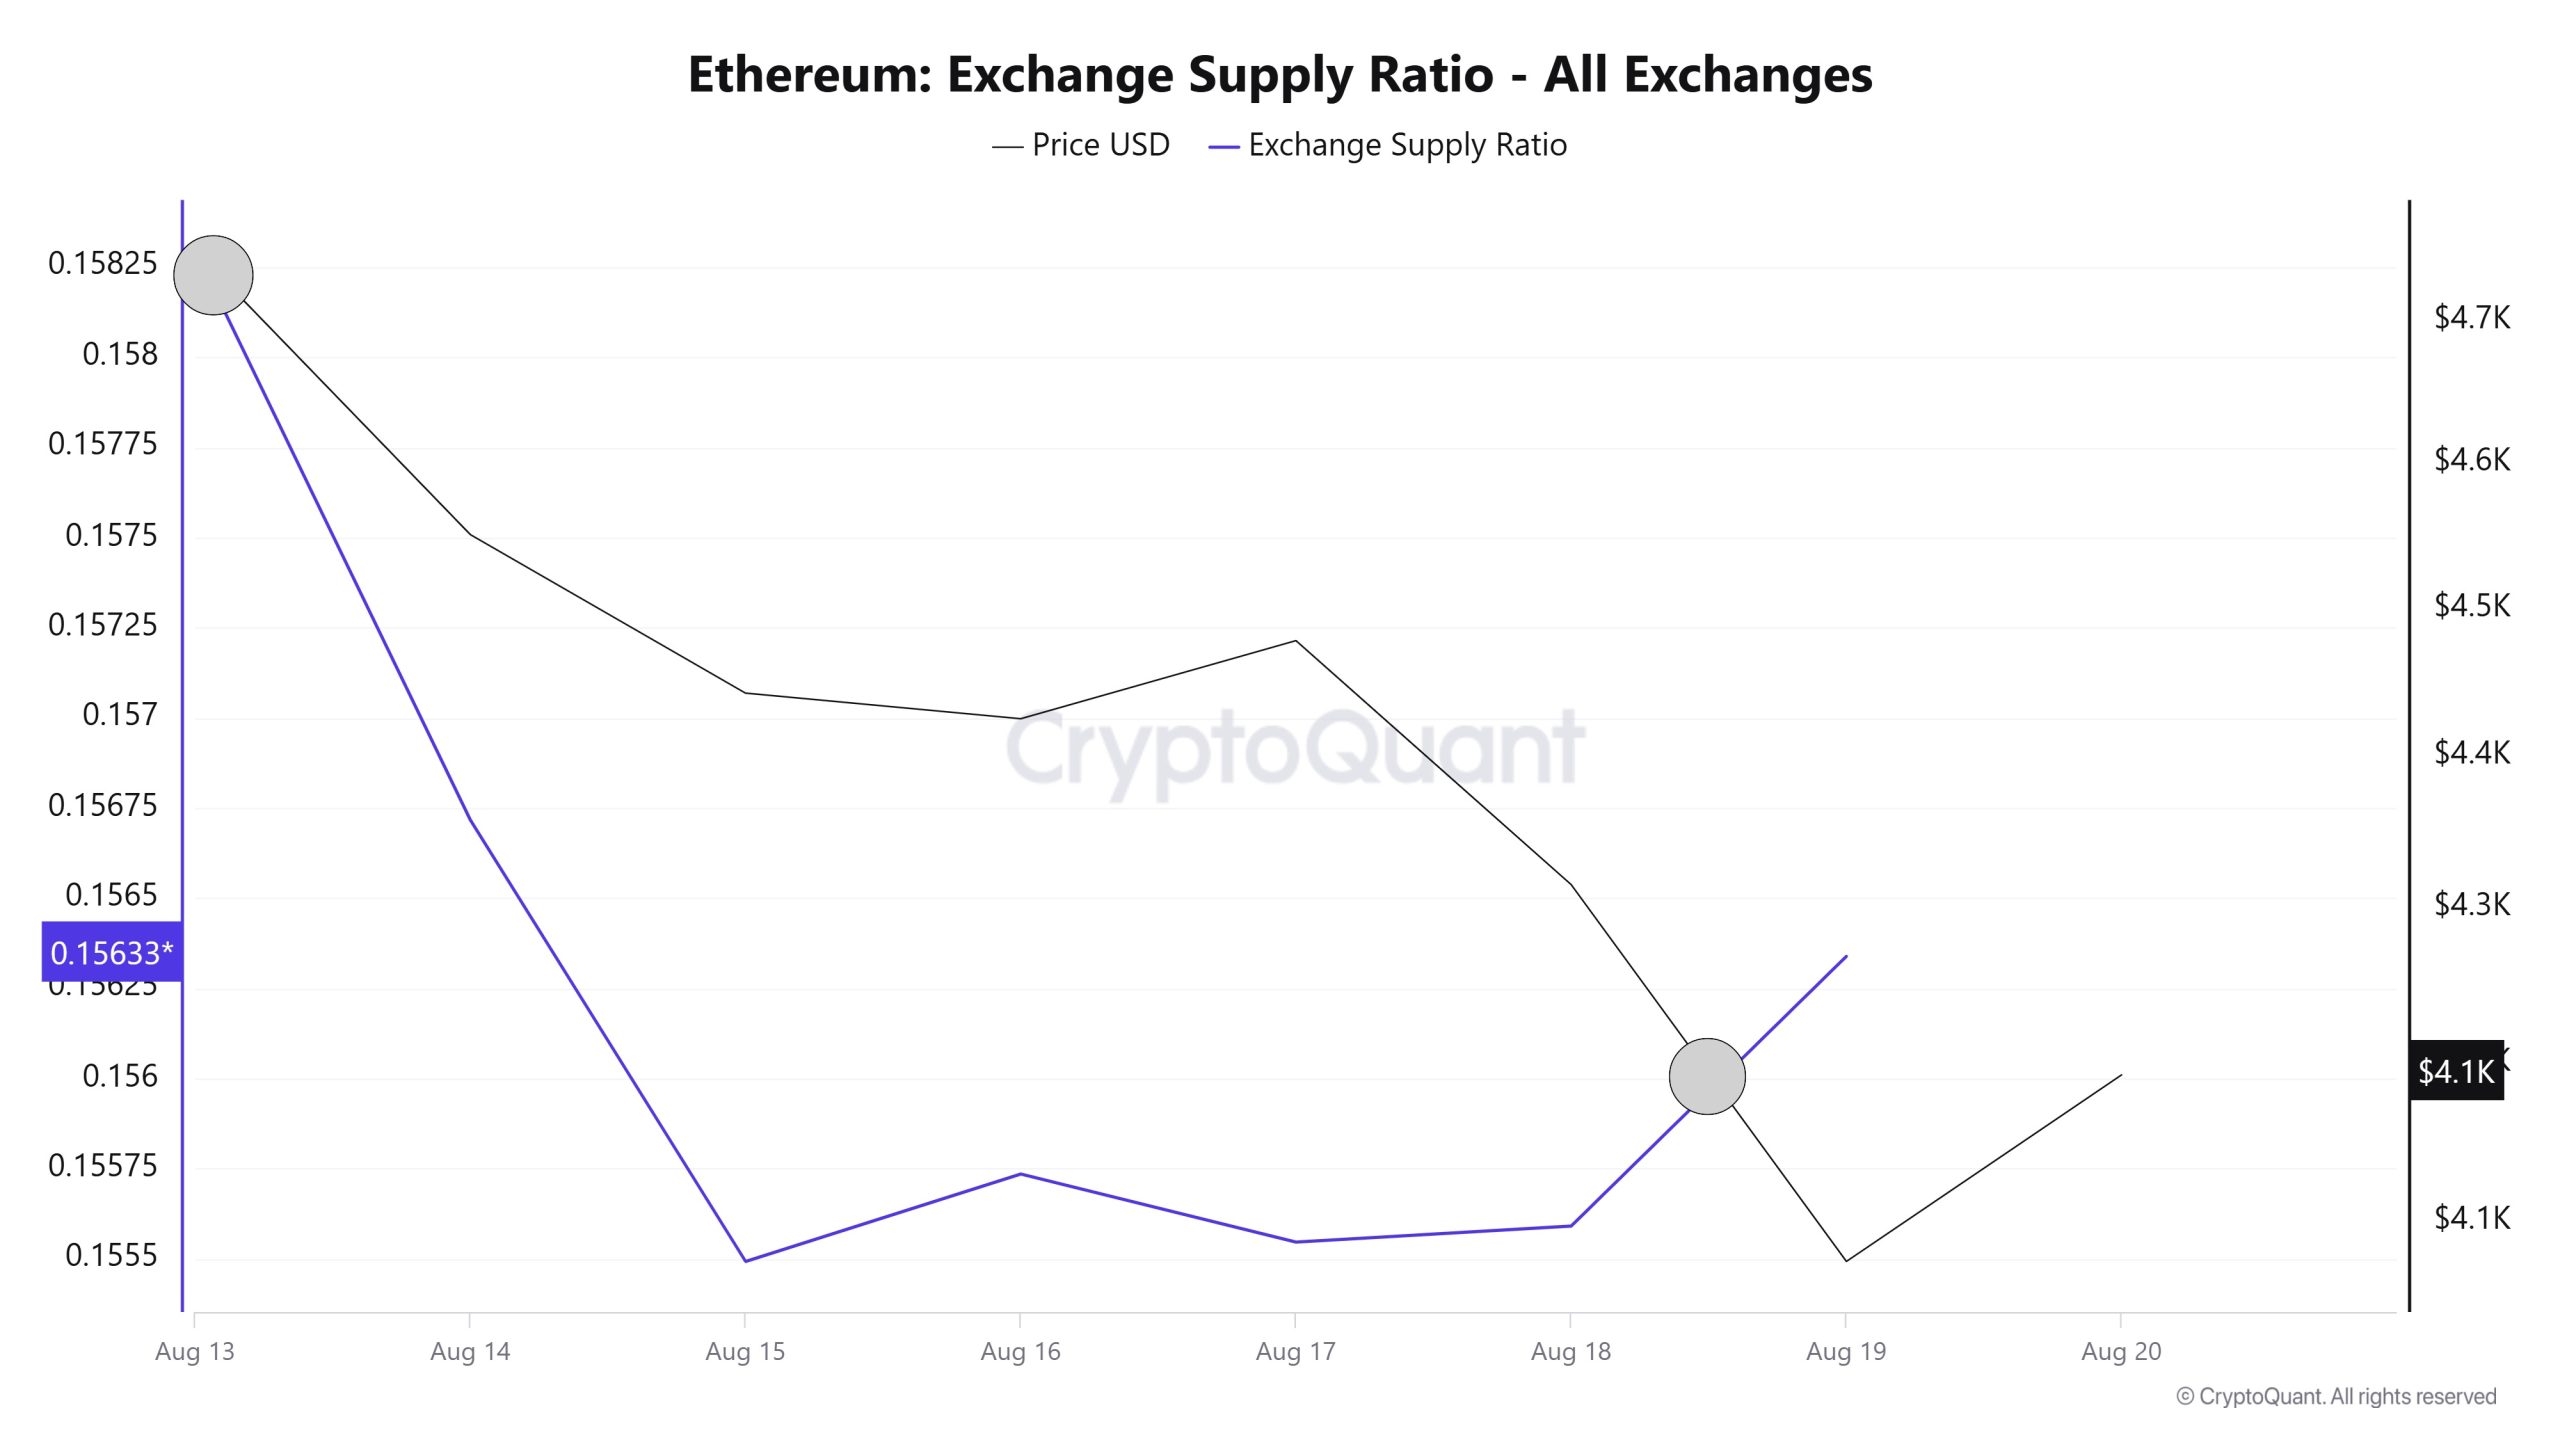
Between August 13 and 19, 2025, Ethereum reserves el exchanges decreased from 18,740,988 ETH to 18,487,991 ETH, resulting en a net outflow of 252,997 ETH. During this period, reserves saw a decrease of approximately 1.35%. Meanwhile, the Ethereum price dropped from $4,751 to $4,075, losing 14.23% of its value. Both the price decline and the significant outflow of ETH from exchanges suggest that investors are withdrawing their assets from exchanges to evaluate potential buying opportunities. In the short term, the market may maintain a neutral or cautious stance. In the long term, the decline en reserves may signal a contraction en supply, which could contribute to a easing of selling pressure and the preservation of upward expectations.
| Date | Exchange Inflow | Exchange Outflow | Exchange Netflow | Exchange Reserve | ETH Price |
|---|---|---|---|---|---|
| 13-Aug | 2,161,953 | 2,089,534 | 72,419 | 18,740,988 | 4,751 |
| 14-Aug | 2,594,169 | 2,804,138 | -209,969 | 18,531,019 | 4,550 |
| 15-Aug | 1,935,300 | 2,076,452 | -141,152 | 18,389,867 | 4,442 |
| 16-Aug | 715,760 | 689,451 | 26,309 | 18,416,176 | 4,425 |
| 17-Aug | 444,279 | 467,140 | -22,861 | 18,393,315 | 4,478 |
| 18-Aug | 1,794,411 | 1,783,363 | 11,048 | 18,404,363 | 4,315 |
| 19-Aug | 1,302,794 | 1,219,166 | 83,628 | 18,487,991 | 4,075 |
Fees and Revenues
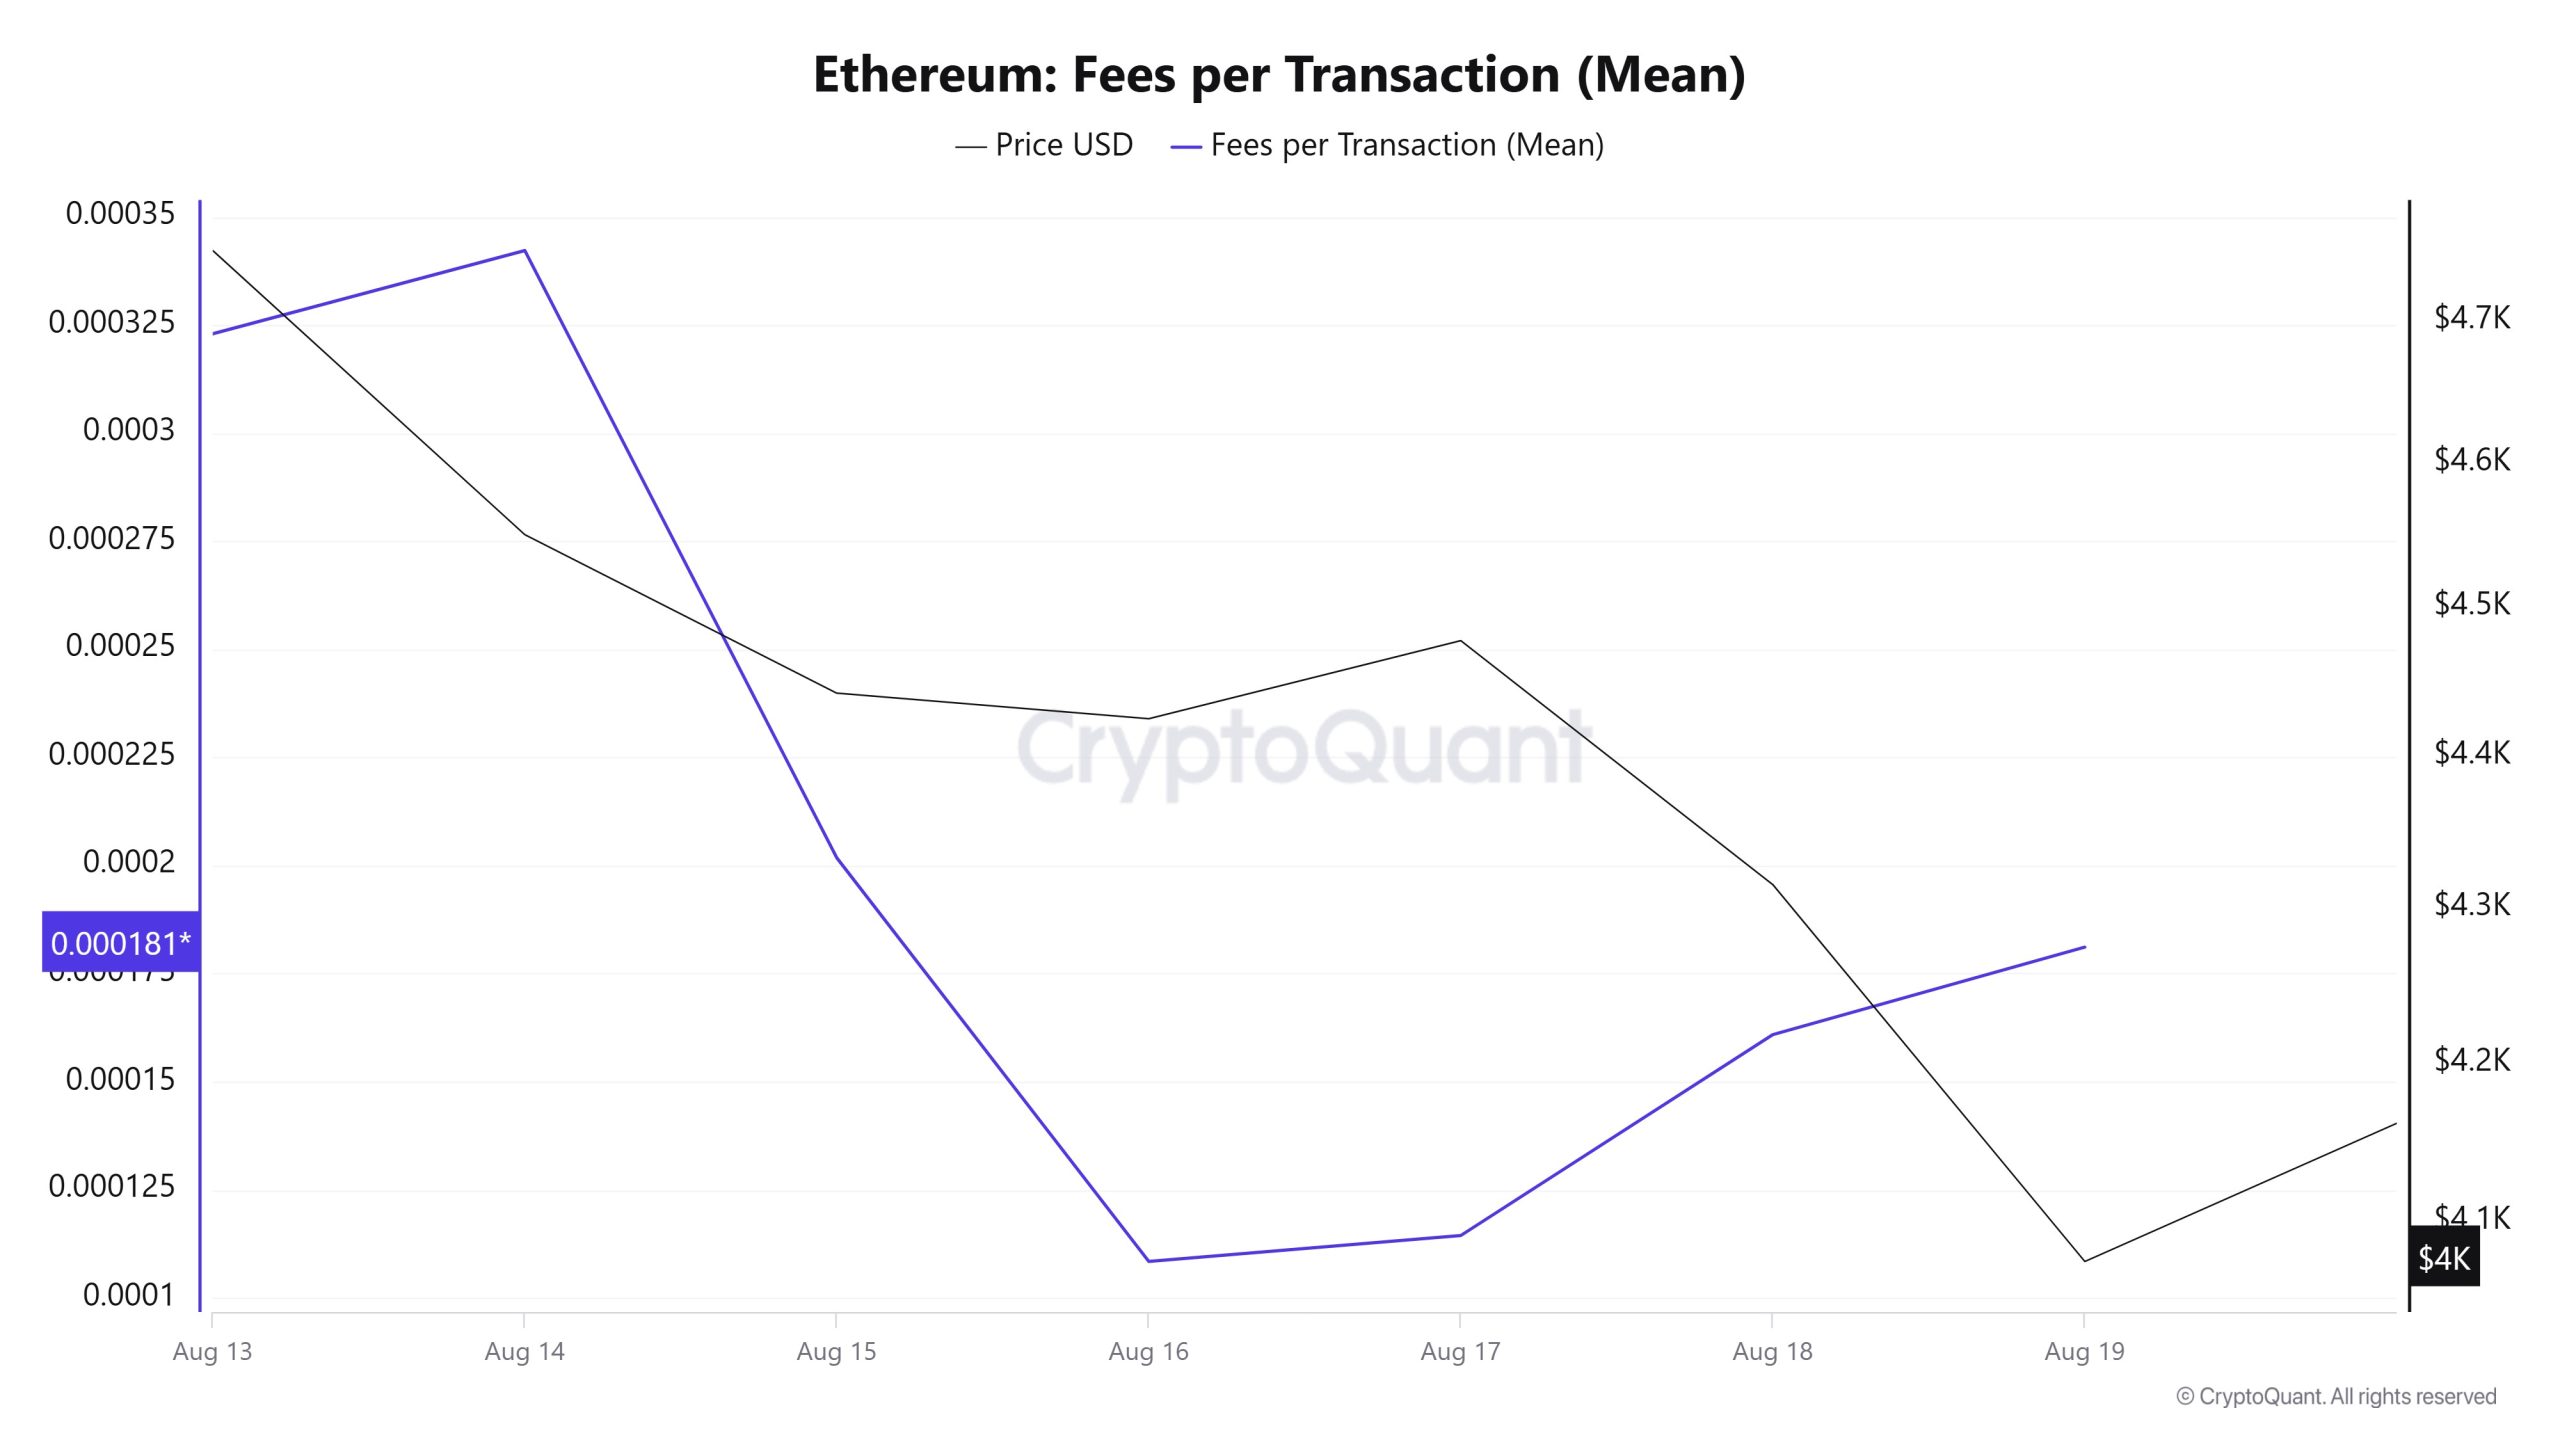
When examining the Ethereum Fees per Transaction (Mean) data for the period between August 13 and 19, it is observed that the indicator reached the level of 0.000323062658347471 el August 13, the first day of the week.
This value, which reached its peak el August 14, followed a declining trend until that date due to the impact of the decline en Ethereum prices. On August 16, it dropped to 0.000108384562159928, recording the lowest value of the week.
In the following days, the Ethereum Fees per Transaction (Mean) indicator resumed an upward trend and closed at 0.000181115818146213 el August 19, the last day of the week.
Bitcoin: Fees (Total)
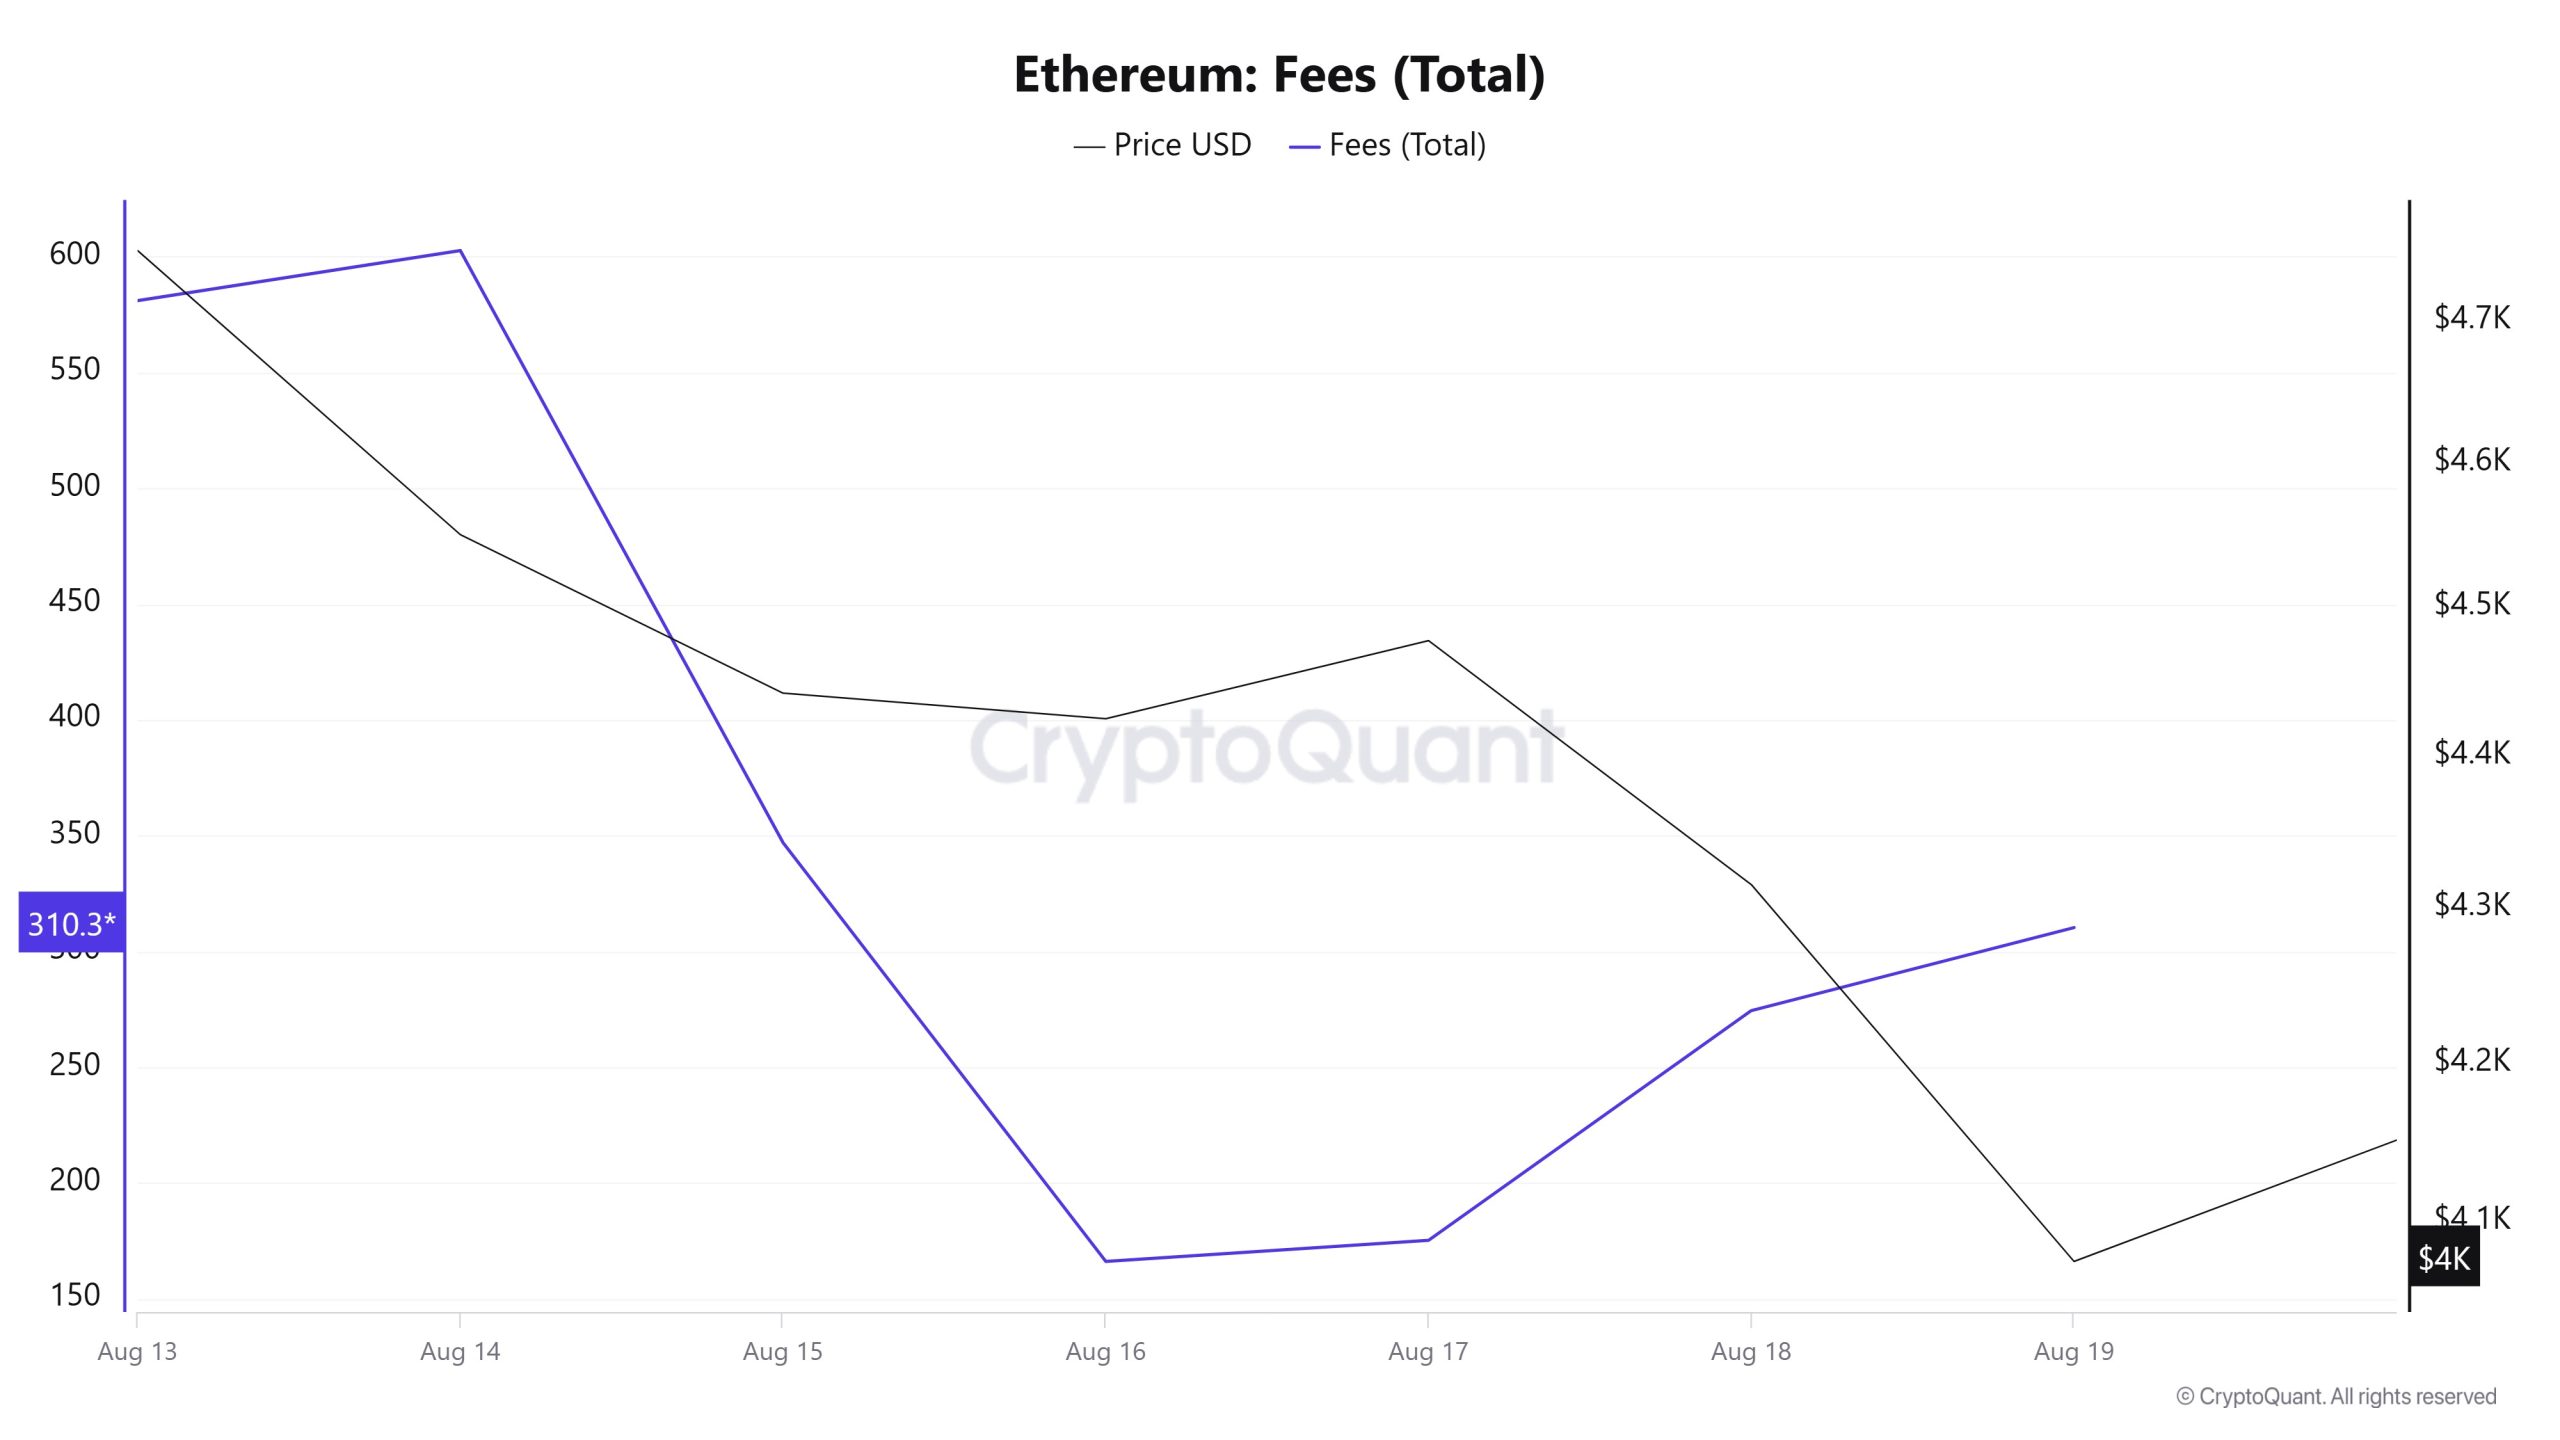
Similarly, when examining the Ethereum Fees (Total) data for the period between August 13 and 19, it is observed that the indicator reached 581.0624356797118 el the first day of the week, August 13.
This value, which reached its peak el August 14, followed a declining trend until that date due to the impact of the decline en the Ethereum price. On August 16, it dropped to 166.15851948102906, recording the week’s lowest value.
In the following days, the Ethereum Fees (Total) indicator resumed an upward trend and closed at 310.30591234572523 el August 19, the last day of the week.
Blocks Mined
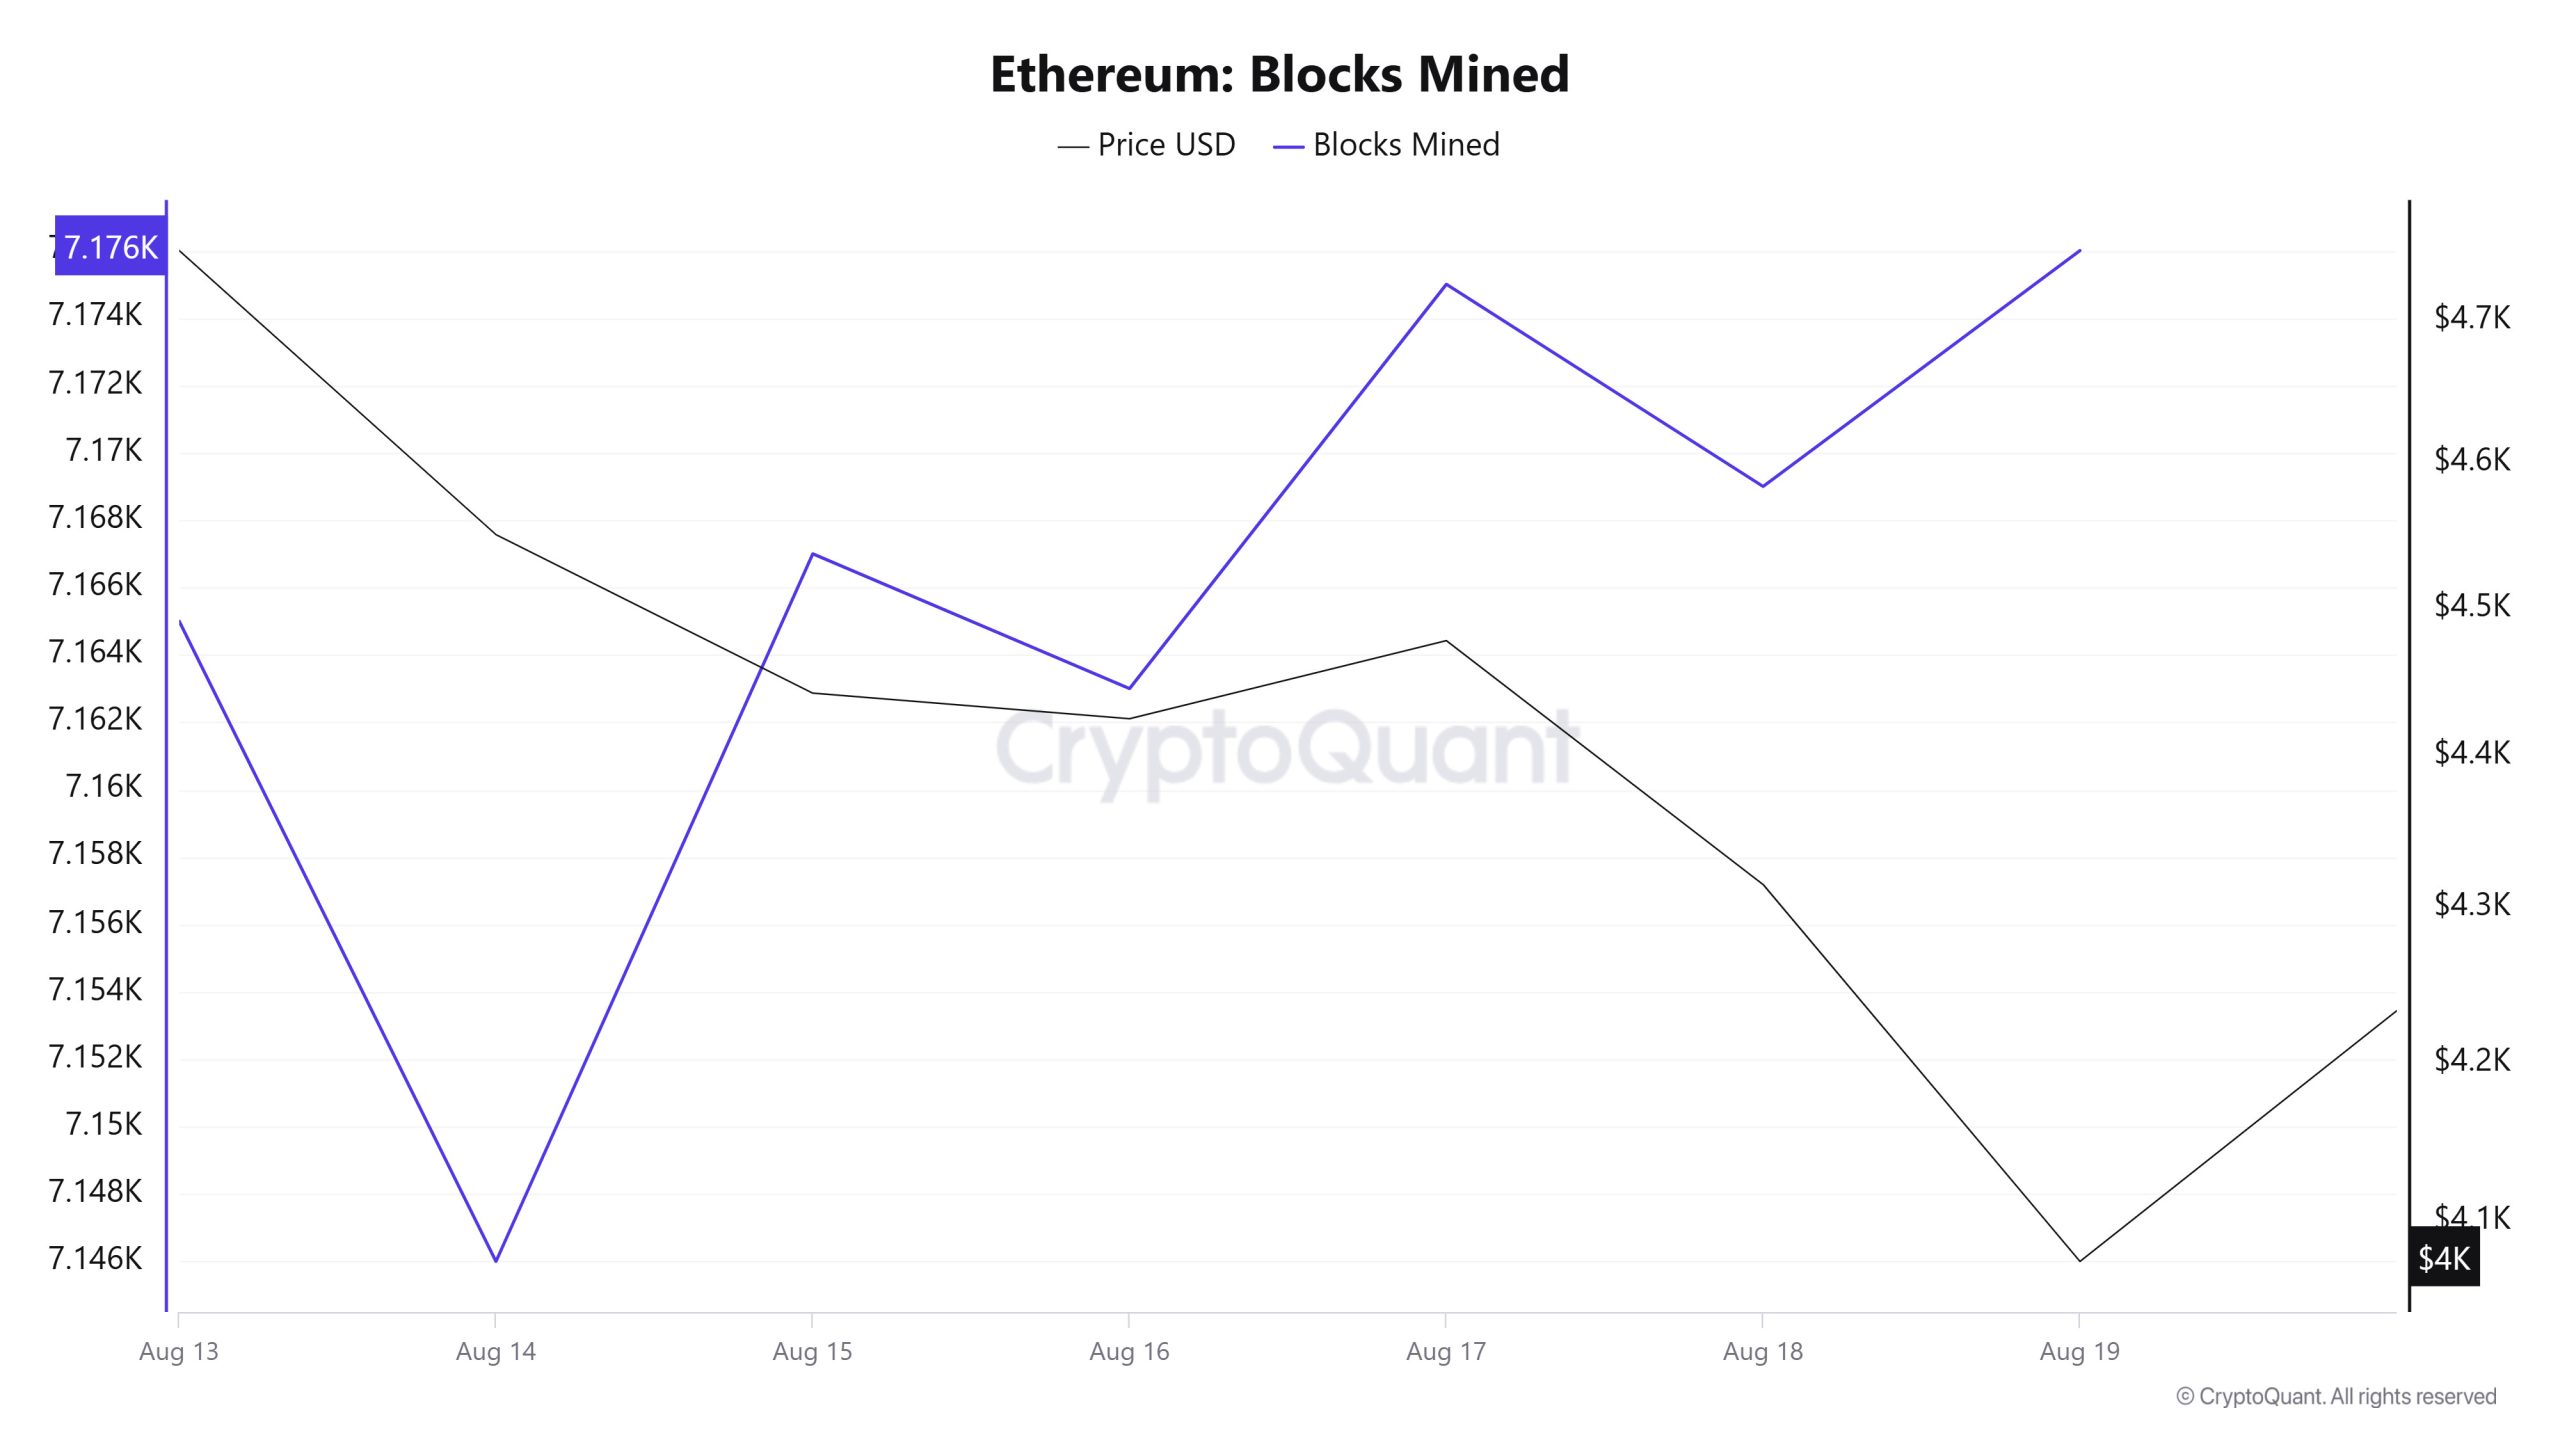
When examining Ethereum block production data between August 13 and 19, an increase was observed throughout the week. While 7,165 blocks were produced el August 13, this number rose to 7,176 as of August 19. The increase en the number of blocks produced indicates that the network was more heavily used during this period.
A positive correlation was observed between the Ethereum price and the number of blocks produced over the week.
Block Size
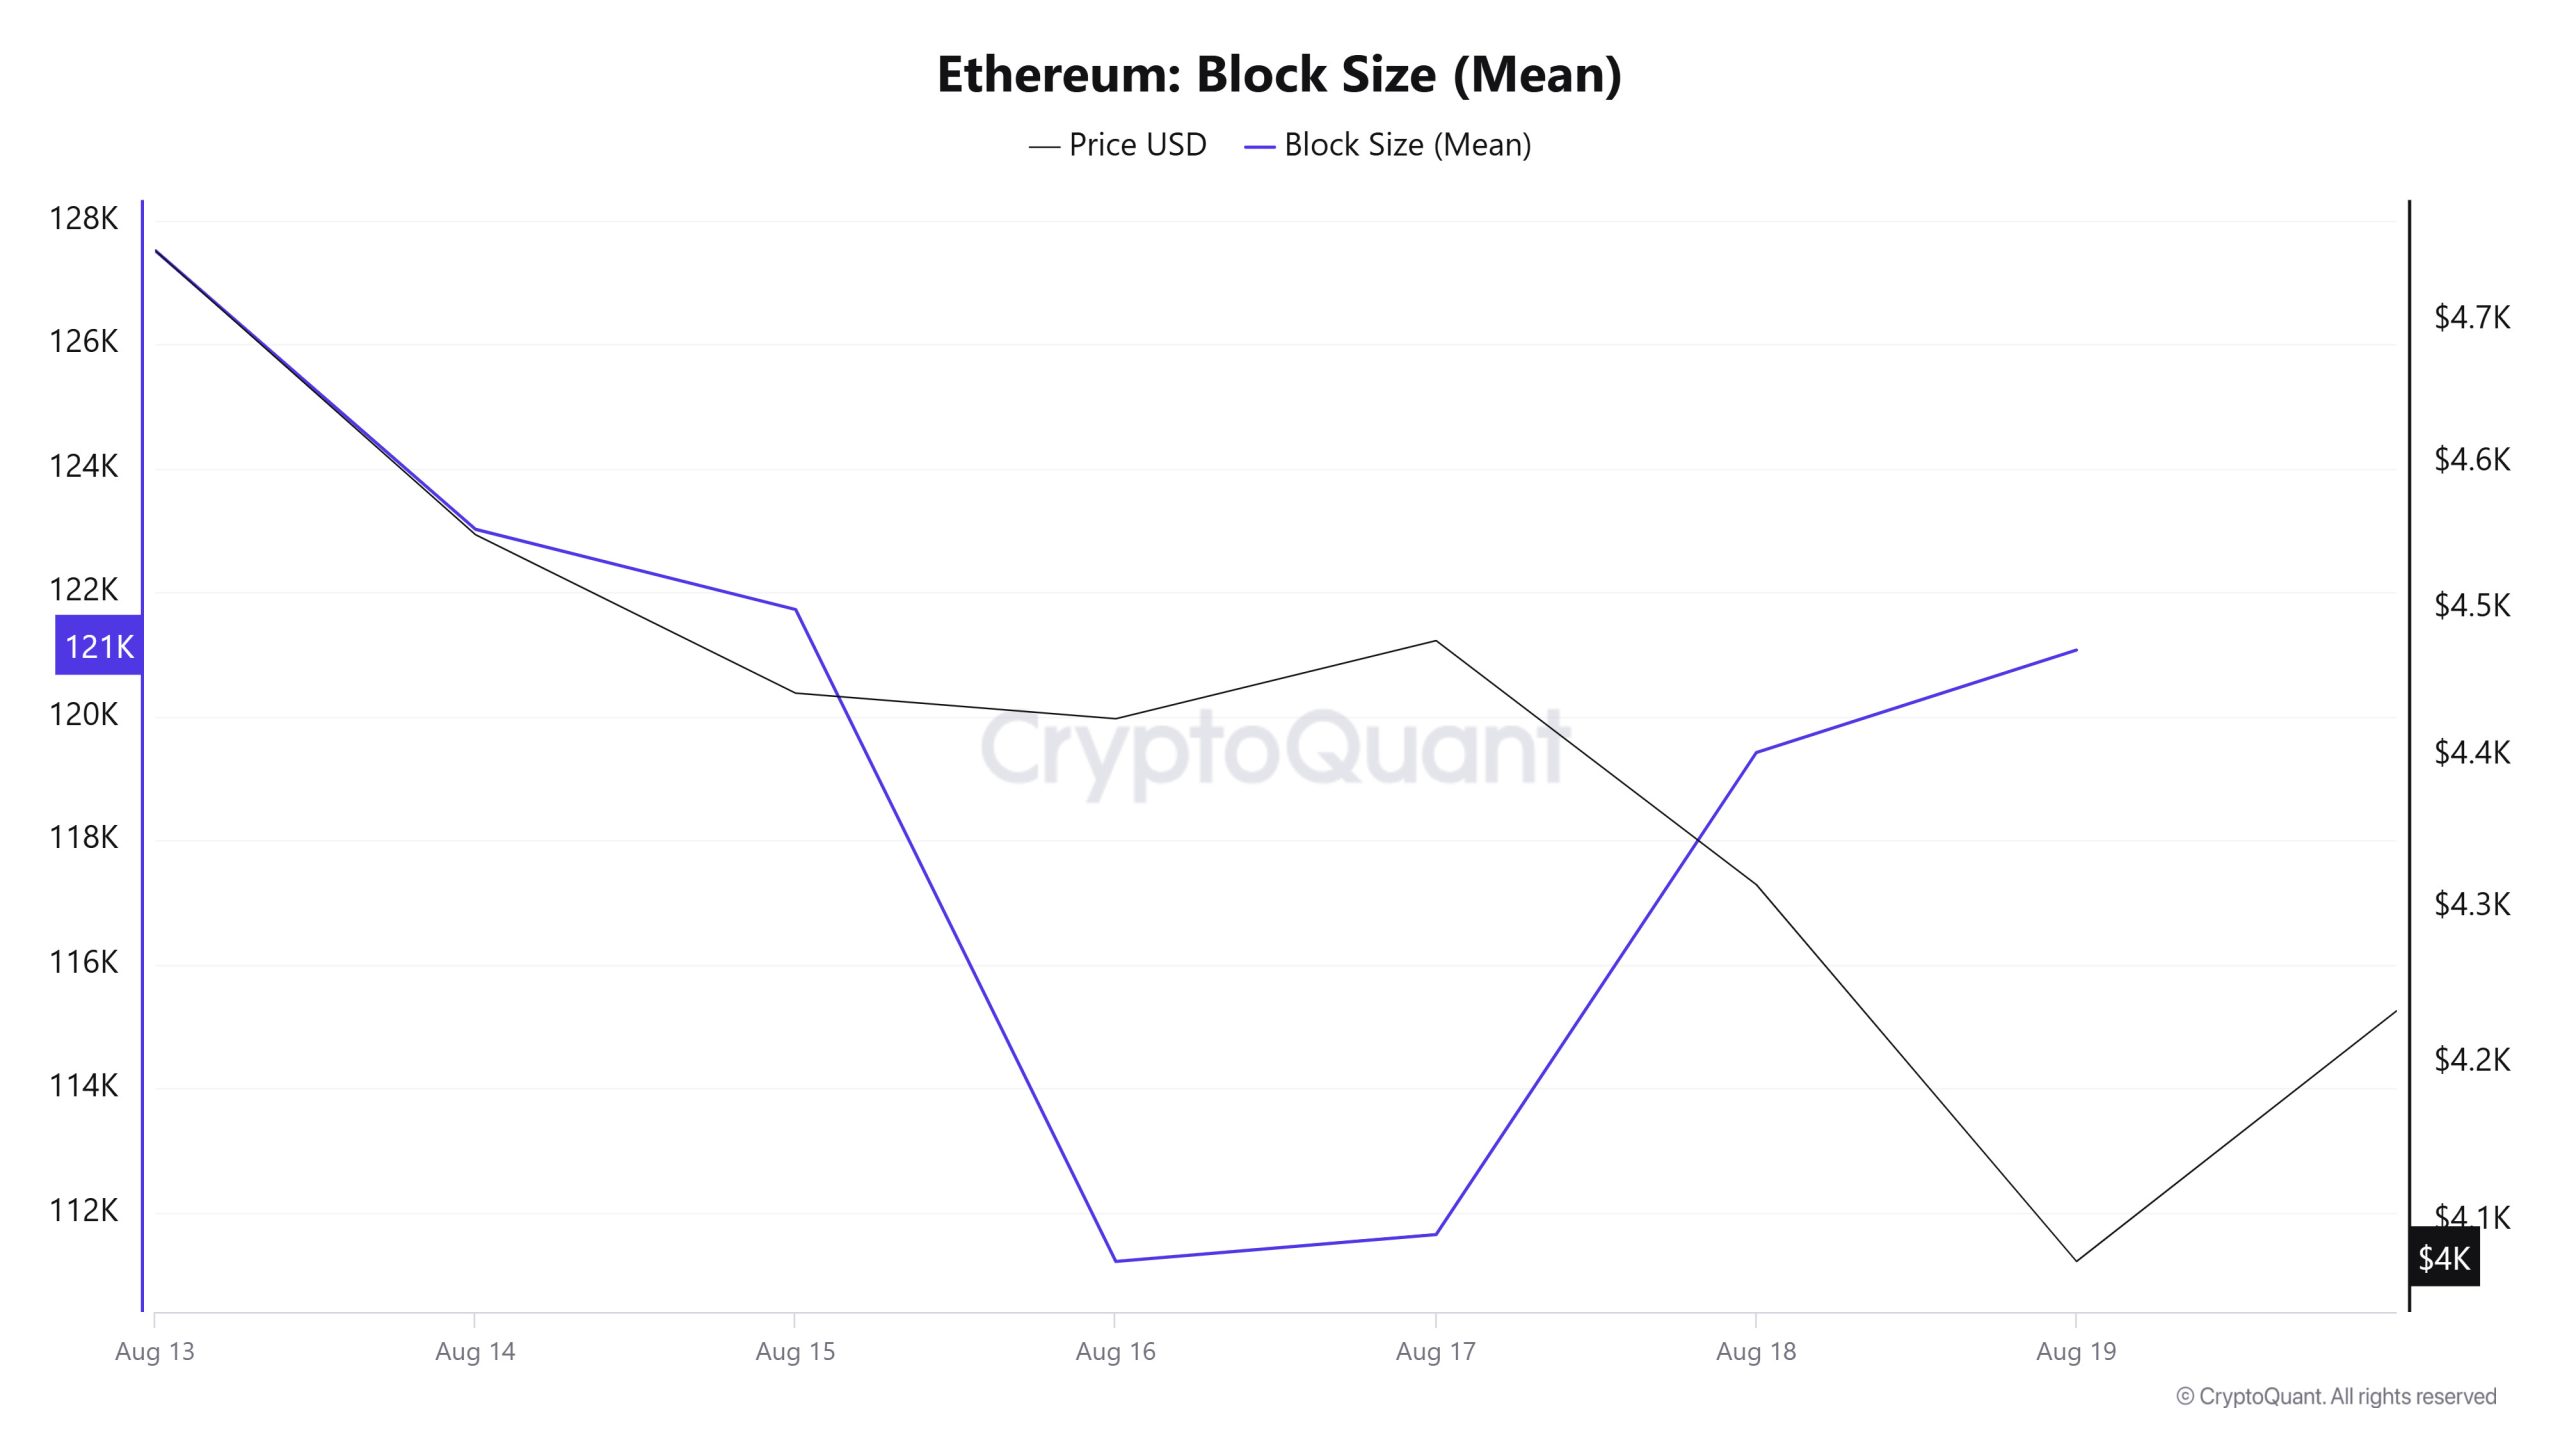
When examining Ethereum block size data between August 13 and 19, a decrease was observed throughout the week. On August 13, the average block size was measured at 127,520 bytes, while por August 19, this value had decreased to 121,076 bytes.
During the relevant period, a positive correlation was observed between block size and Ethereum price throughout the week.
Block Interval
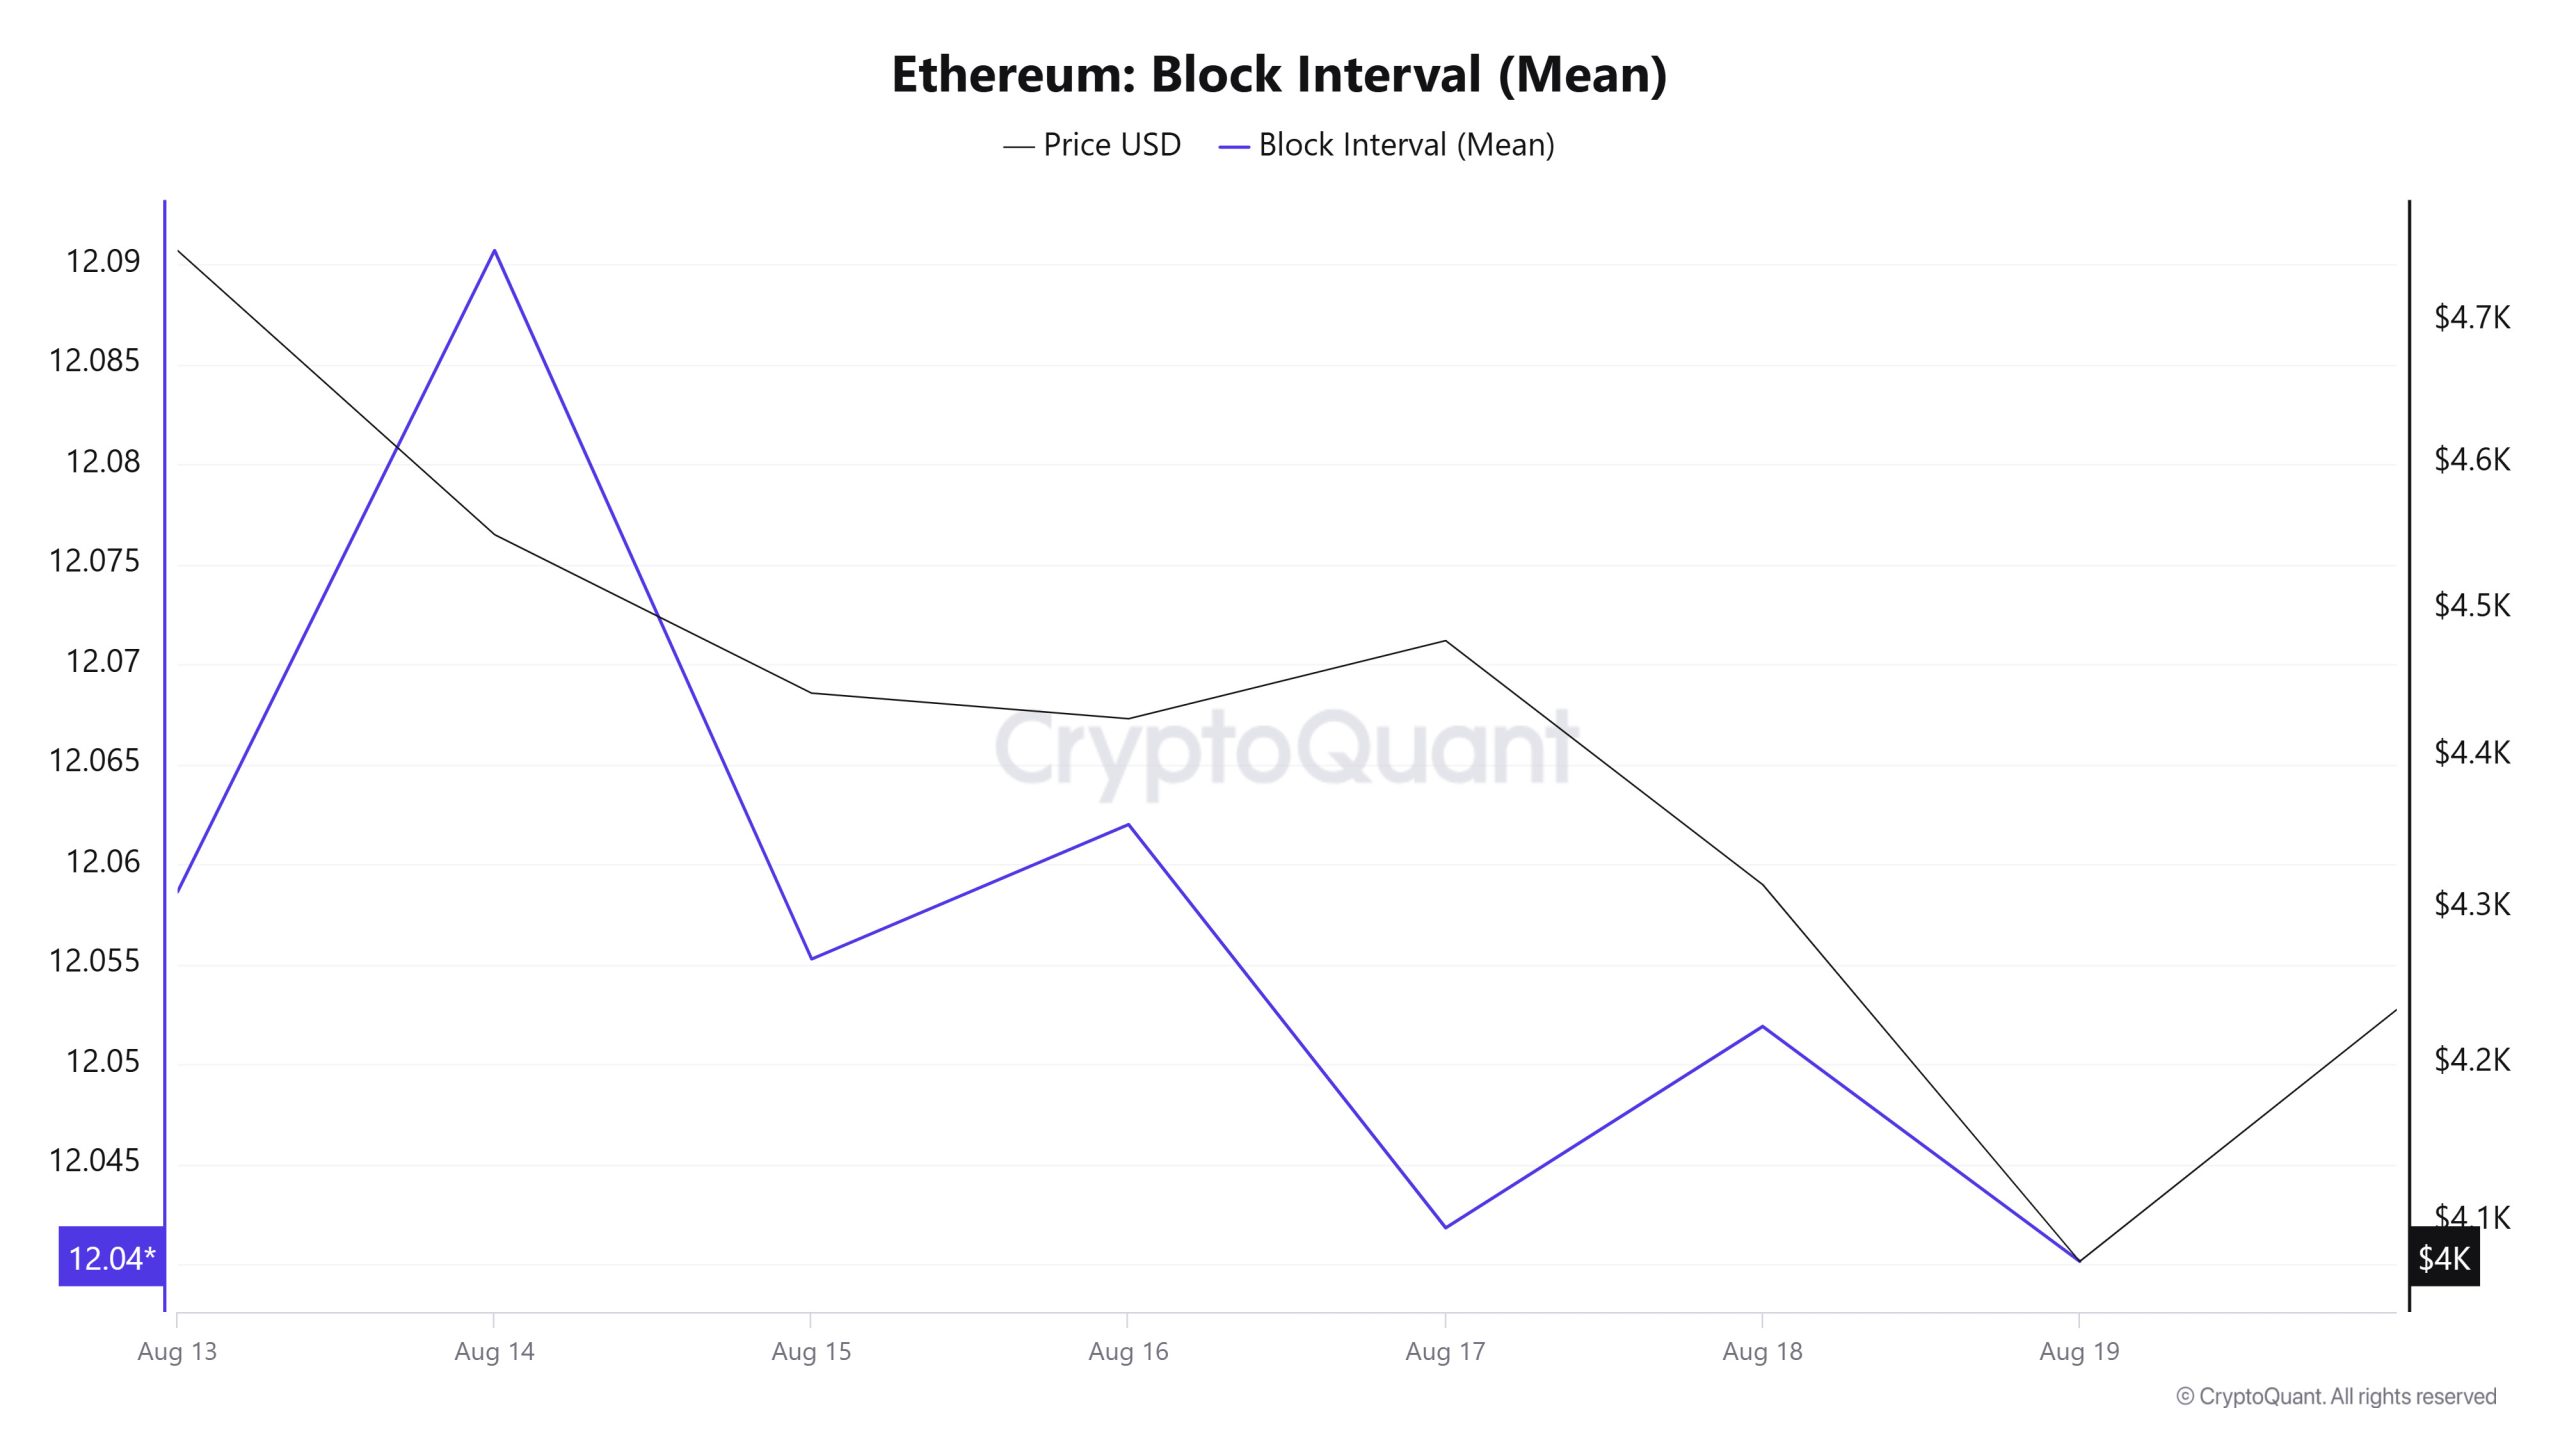
When examining Ethereum block data between August 13 and 19, a slight decrease was observed throughout the week. While the average block time was recorded as 12.05 segundos el August 13, this time decreased to 12.04 segundos as of August 19.
During this period, a negative correlation between Ethereum block time and price movement was observed throughout the week.
Transaction
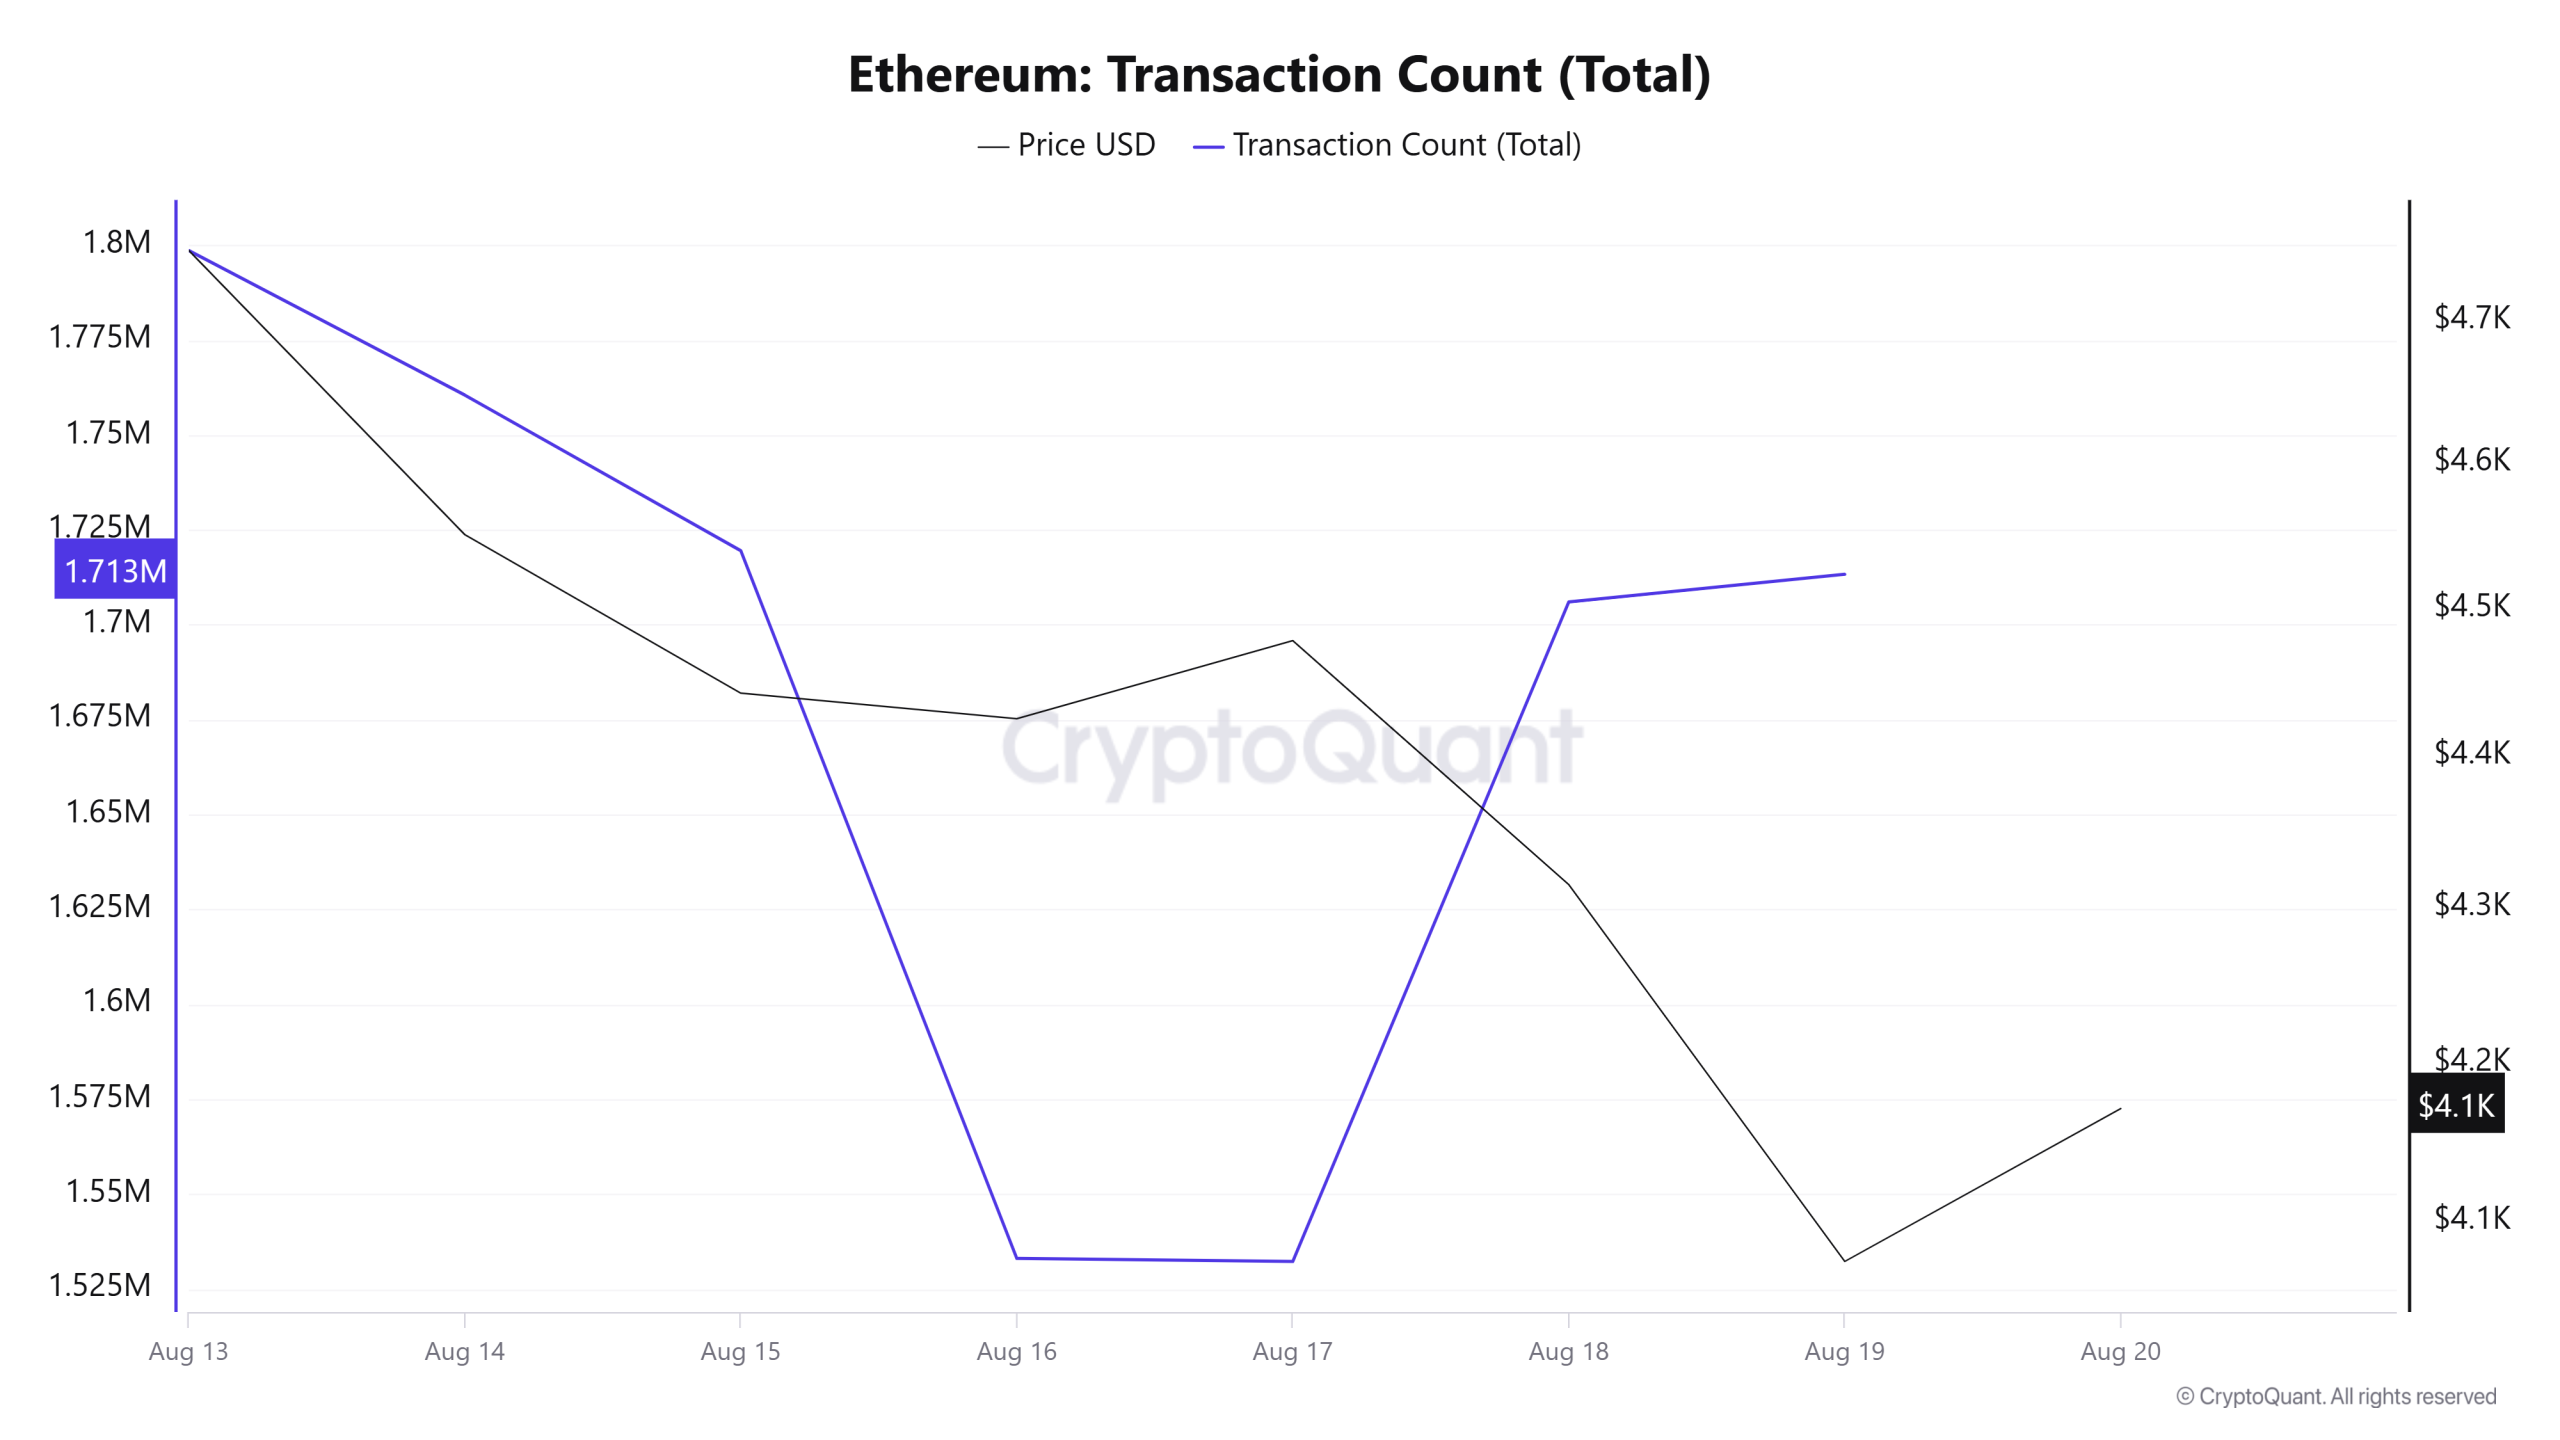
Last week, a total of 12,140,647 transactions were made el the Ethereum network, while this week, there was a decrease of approximately 3.11% to 11,763,253. The highest transaction count for the week was 1,798,606 el August 13, while the lowest was 1,532,247 el August 17. The correlation between price and transaction volume remained balanced throughout the week. Although there was a slight decrease compared to last week, Ethereum is still at quite high levels compared to its all-time average. The continued strong performance of Ethereum burns alongside high transaction volumes is providing an additional boost to the network. Therefore, the decline en transaction volume is more likely to be a temporary fluctuation rather than a significant and sustained trend.
Tokens Transferred
Last week, a total of 18,658,140 ETH was transferred el the Ethereum network, rising to 20,928,450 ETH this week, an increase of approximately 12.17%. This is a strong indicator that users and investors are using Ethereum more actively. The 4,841,196 ETH transferred el August 14 marked the highest daily volume of the week, while only 967,581 ETH was transferred el August 17, recording the lowest level of the week. Throughout the week, the between price and the amount of tokens transferred remained balanced, with both negative and positive correlations. Despite the price decline, the increase en transaction and transfer volumes does not support this downturn. This suggests that market pricing does not fully align with el-chain activity and that the declines may be temporary.
Estimated Leverage Ratio
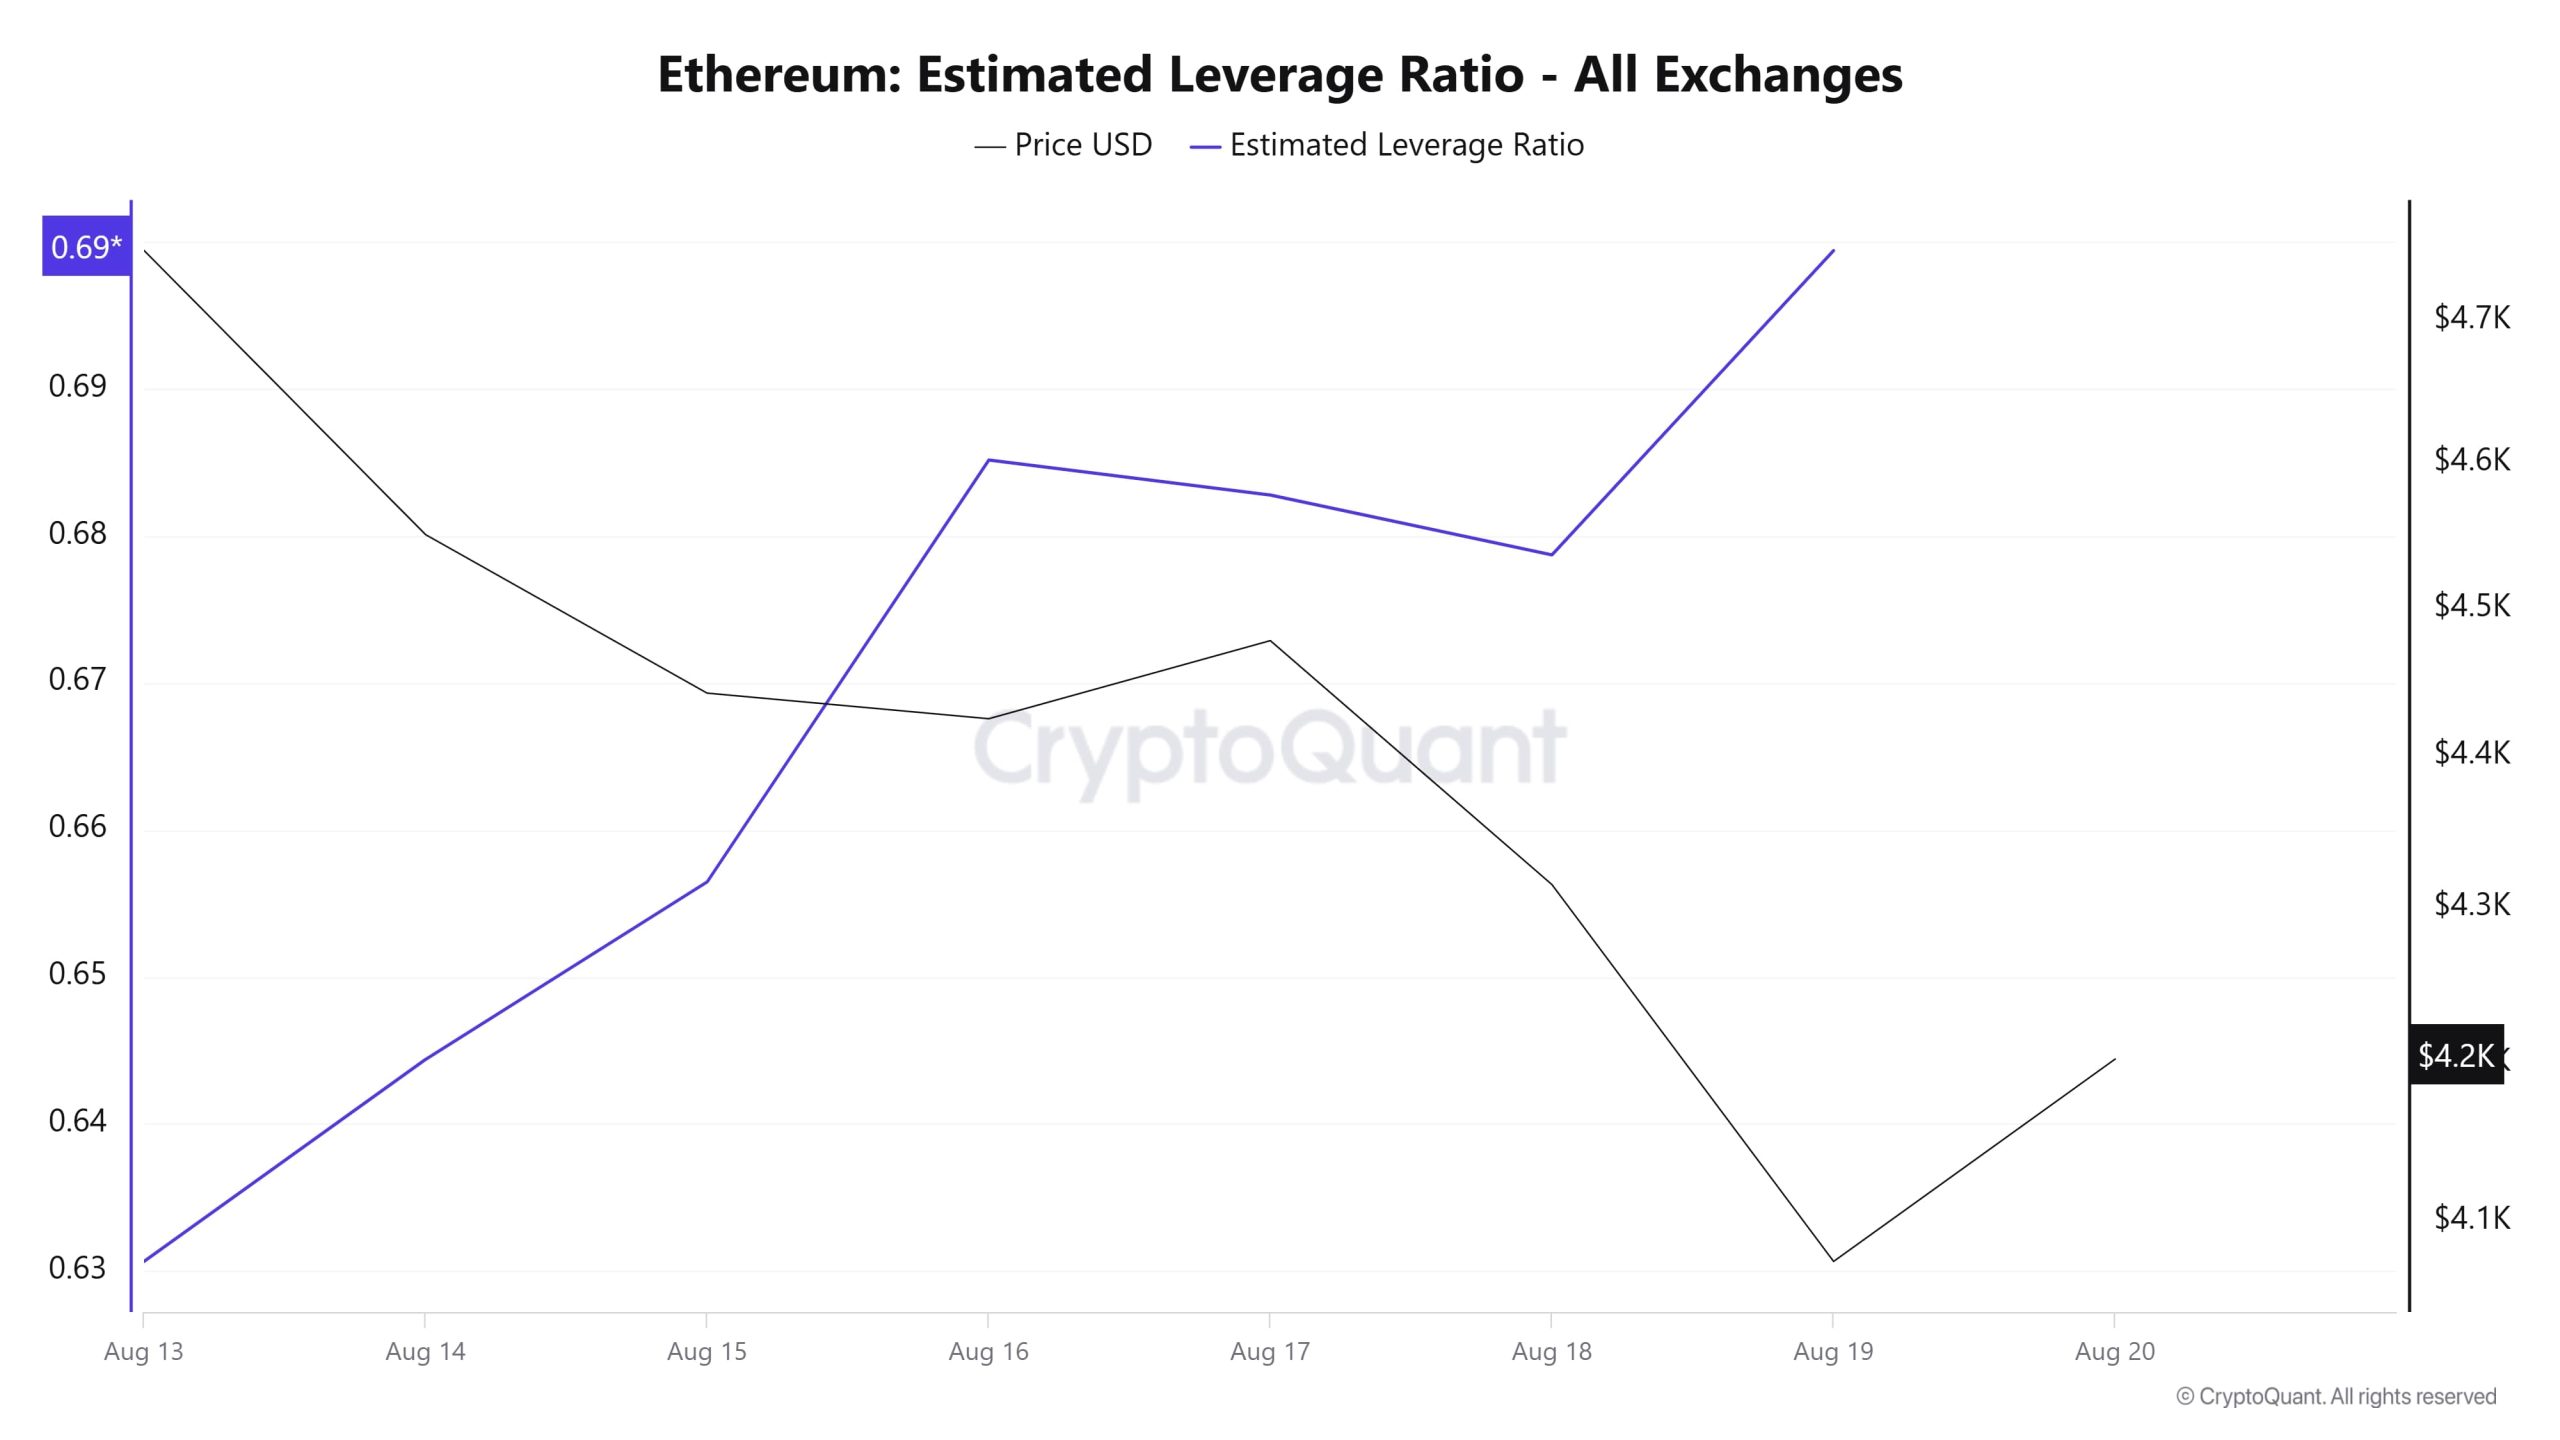
The metric showed an increase over the 7-day period. The ELR (Estimated Leverage Ratio), which stood at 0.630 at the beginning of the period, also marked the lowest point of the process. As of the time of writing, it has risen to 0.699 and is currently at its peak. A higher ELR indicates that participants are more willing to take el risk and typically signals upward conditions or expectations. It should be noted that these increases may also be due to a decrease en reserves. Looking at Ethereum reserves, there were 18.74 million reserves at the beginning of the process, which generally declined during the rest of the process and currently stands at 18.48 million. At the same time, Ethereum’s Open Interest was $62.43 billion at the beginning of the process. As of now, the volume has decreased during the process, and the open interest value stands out at 59.77 billion dollars. With all this data, the ELR metric has increased during most of the process. The asset’s price, along with all this data, has been valued between 4,604 dollars and 4,060 dollars. Although investors’ and traders’ risk appetite continues to increase as of now, this has not been reflected en the price. We can say that the increase en the ELR ratio throughout the process is due to the decrease en reserves. As a result, the decline en reserves and the slight decrease en open interest show us that the ELR metric has increased artificially. This indicates that the market is cautious.
ETH Onchain Overall
| Metric | Positive 📈 | Negative 📉 | Neutral ➖ |
|---|---|---|---|
| Active Addresses | ✓ | ||
| Total Value Staked | ✓ | ||
| Derivatives | ✓ | ||
| Supply Distribution | ✓ | ||
| Exchange Supply Ratio | ✓ | ||
| Fees and Revenues | ✓ | ||
| Blocks Mined | ✓ | ||
| Transactions | ✓ | ||
| Estimated Leverage Ratio | ✓ |
*The metrics and guidance provided en the table do not alone explain or imply any future changes en the price of any asset. The prices of digital assets can vary based el numerous factors. The el-chain analysis and related guidance provided are intended to assist investors en their decision-making process and should not be relied upon as the sole basis for financial investment decisions. Relying solely el this analysis may result en unfavorable outcomes. Even if all metrics produce positive, negative, or neutral results simultaneously, the expected outcomes may not materialize due to market conditions. Investors reviewing this report are advised to take these warnings into consideration.
Legal Notice
The investment information, comments, and recommendations contained en this document do not constitute investment advisory services. Investment advisory services are provided por authorized institutions el a personal basis, taking into account the risk and return preferences of individuals. The comments and recommendations contained en this document are of a general nature. These recommendations may not be suitable for your financial situation and risk and return preferences. Therefore, making an investment decision based solely el the information contained en this document may not result en outcomes that align with your expectations.
NOTE: All data used en Ethereum onchain analysis is based el Cryptoqaunt.