Weekly Ethereum Onchain Report
Active Addresses
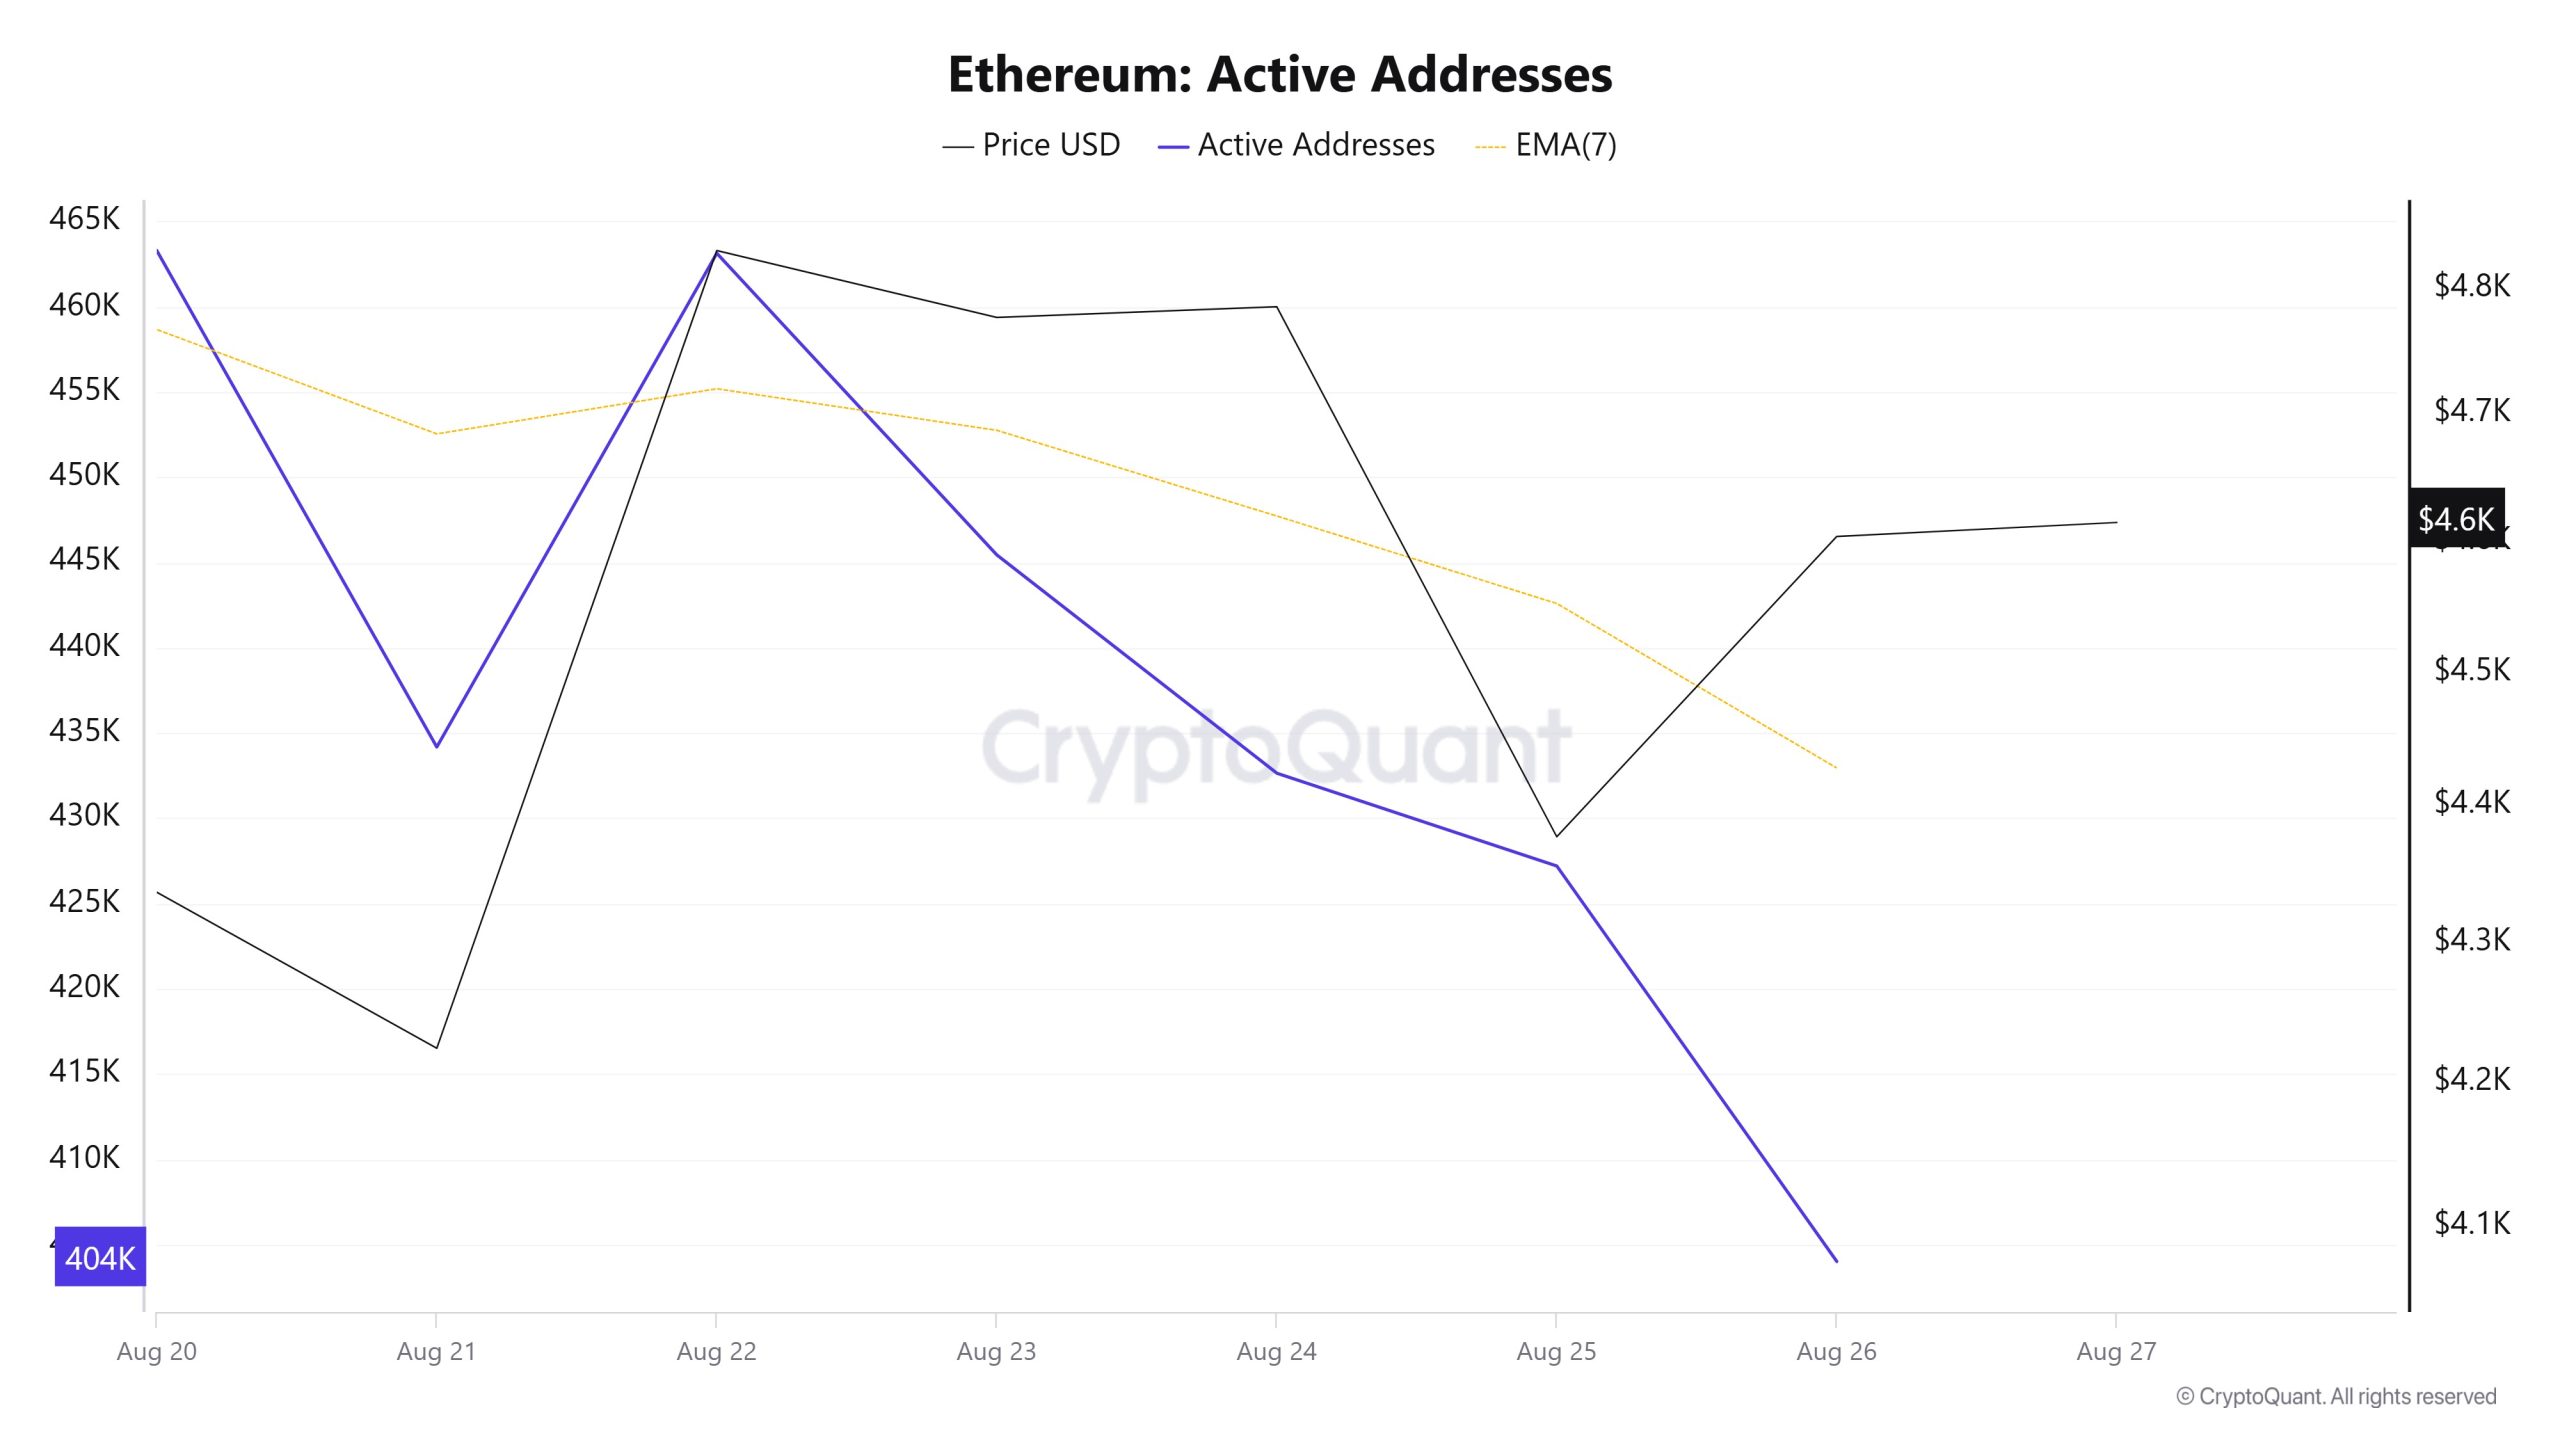
Between August 20 and August 27, a total of 463,138 active addresses entered the Ethereum network. During this period, the Ethereum price dropped from $4,830 to $4,603. Especially el August 22, at the intersection of the price and the number of active addresses, the number of active addresses continued to fall while the price point remained flat. When the 7-day simple moving average (SMA) is analyzed, it is seen that a downward trend is generally dominant en the Ethereum price.
Active Sending Addresses
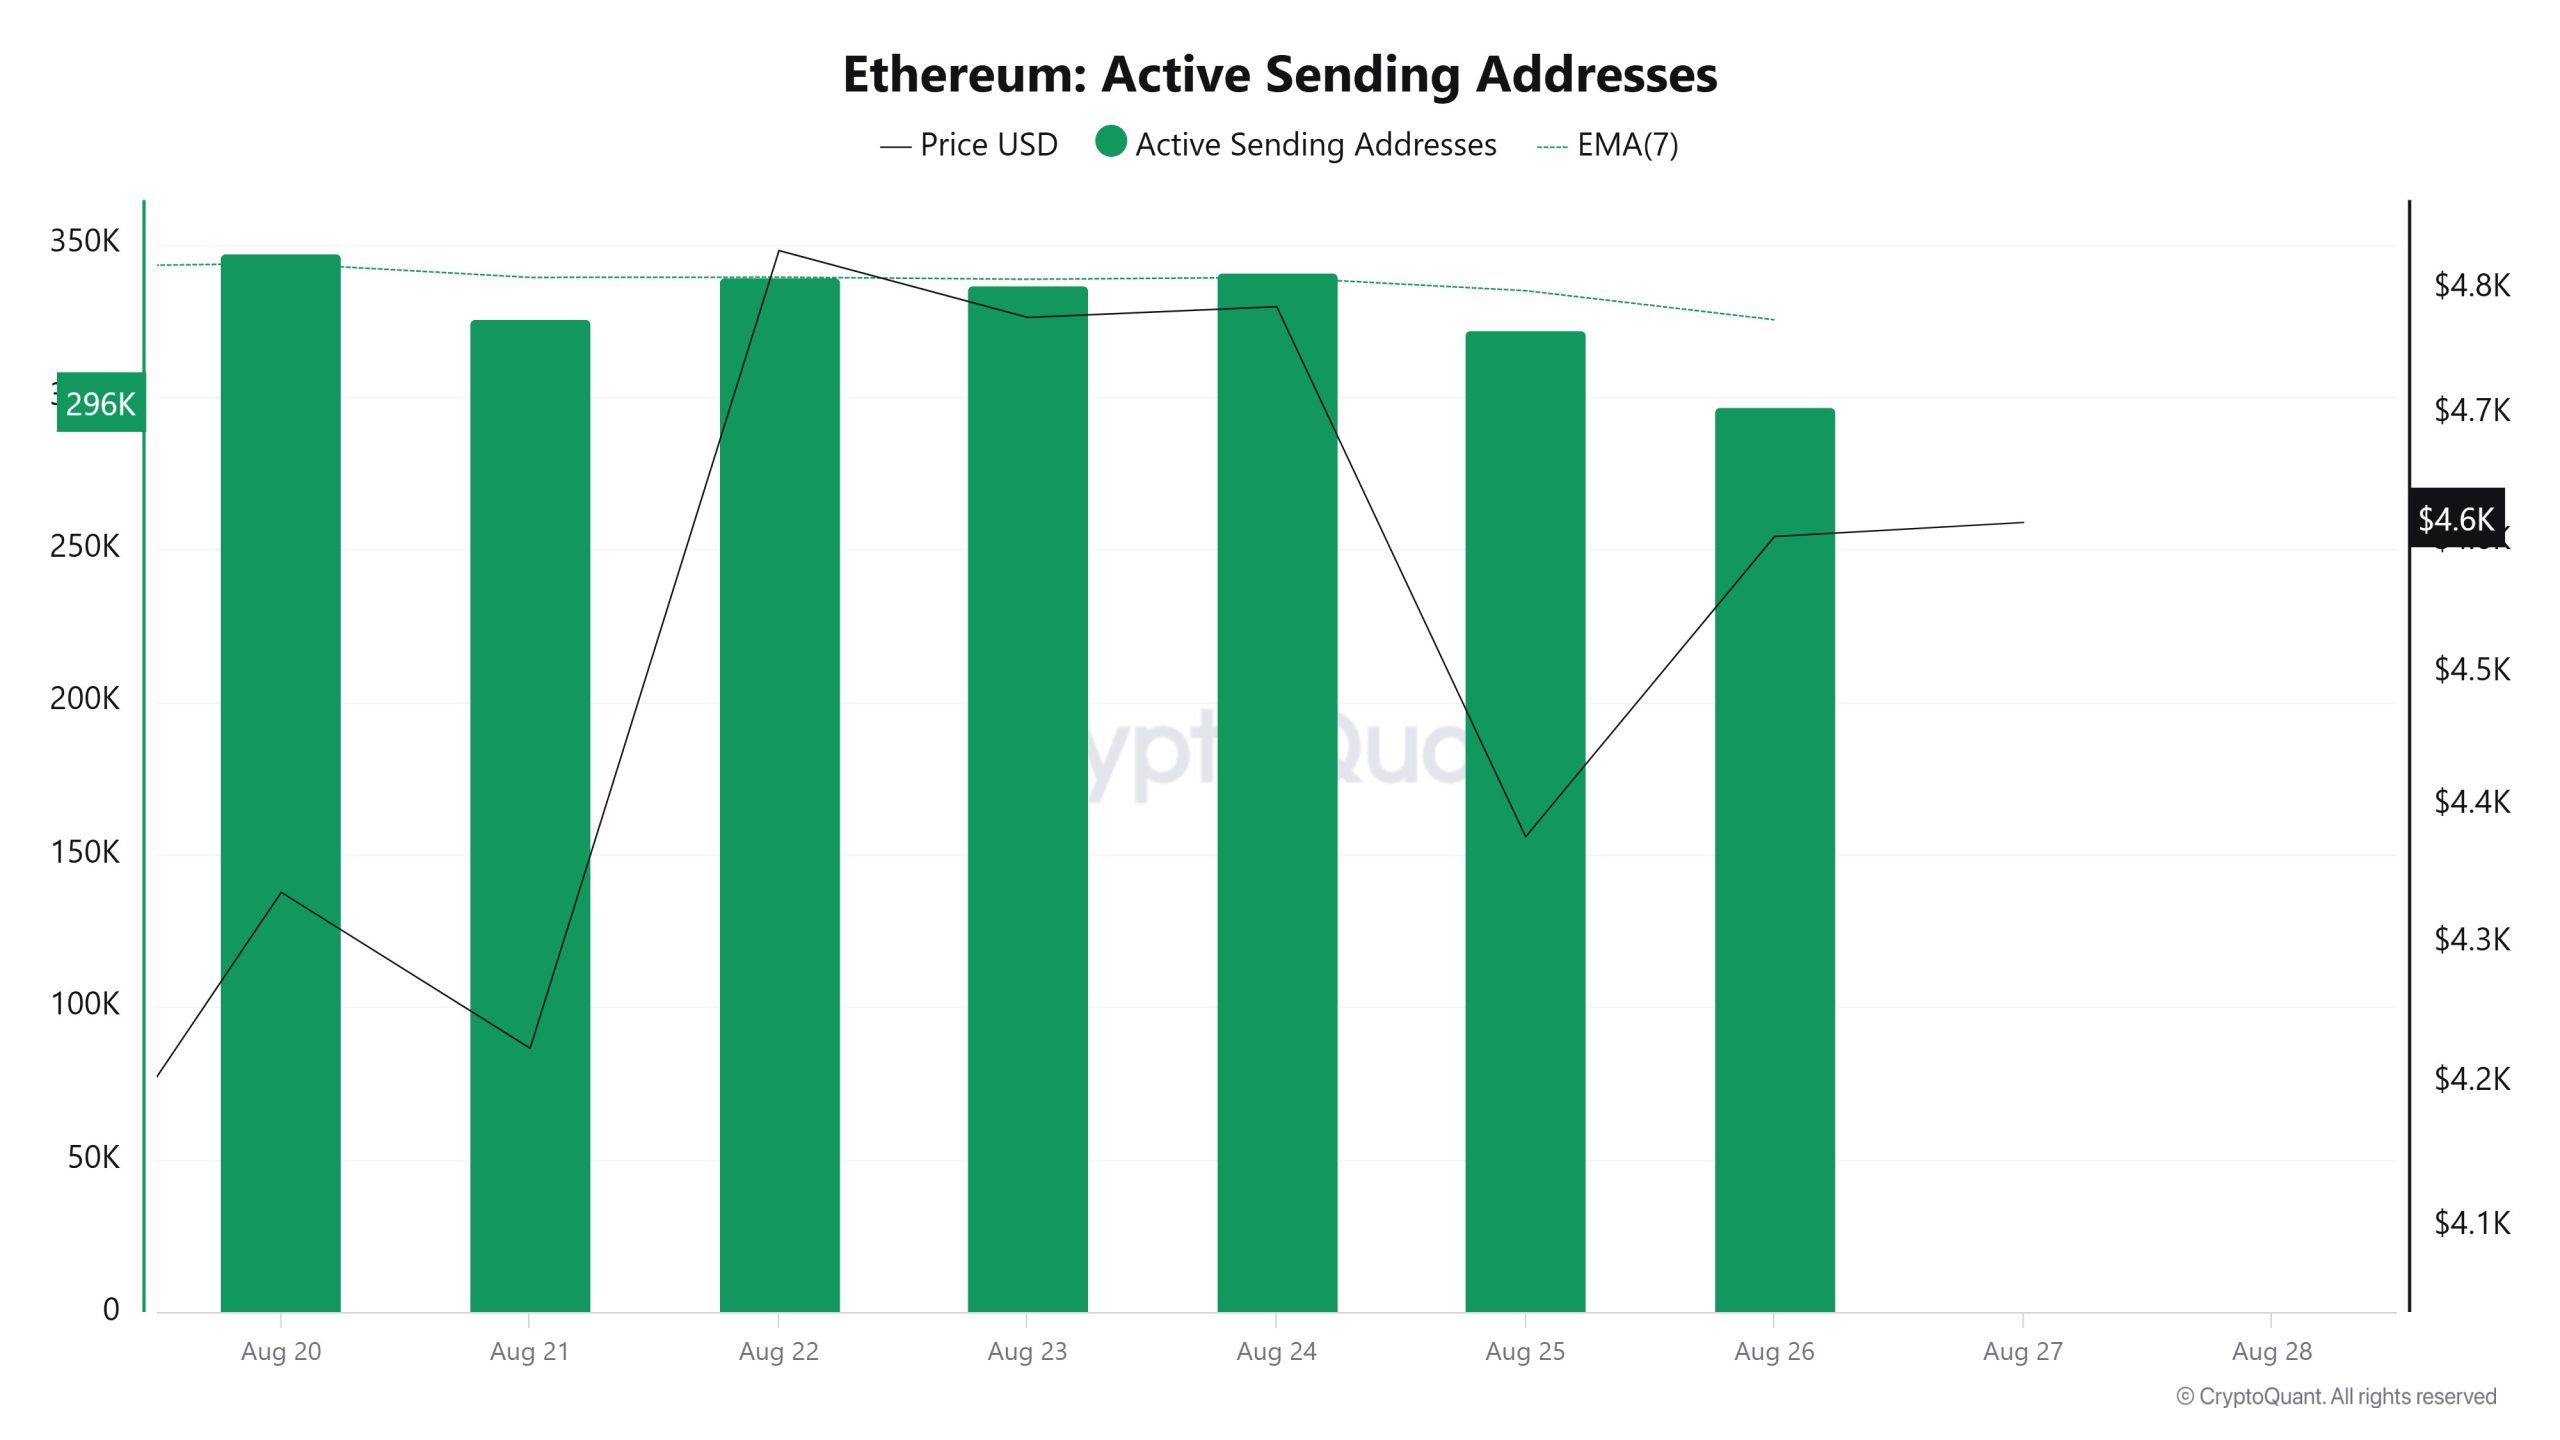
Between August 20 and August 27, a sideways movement was observed en active shipping addresses with the Black Line (price line). On the day when the price reached a weekly high, active sending addresses were observed at 340,878.
Active Receiving Addresses
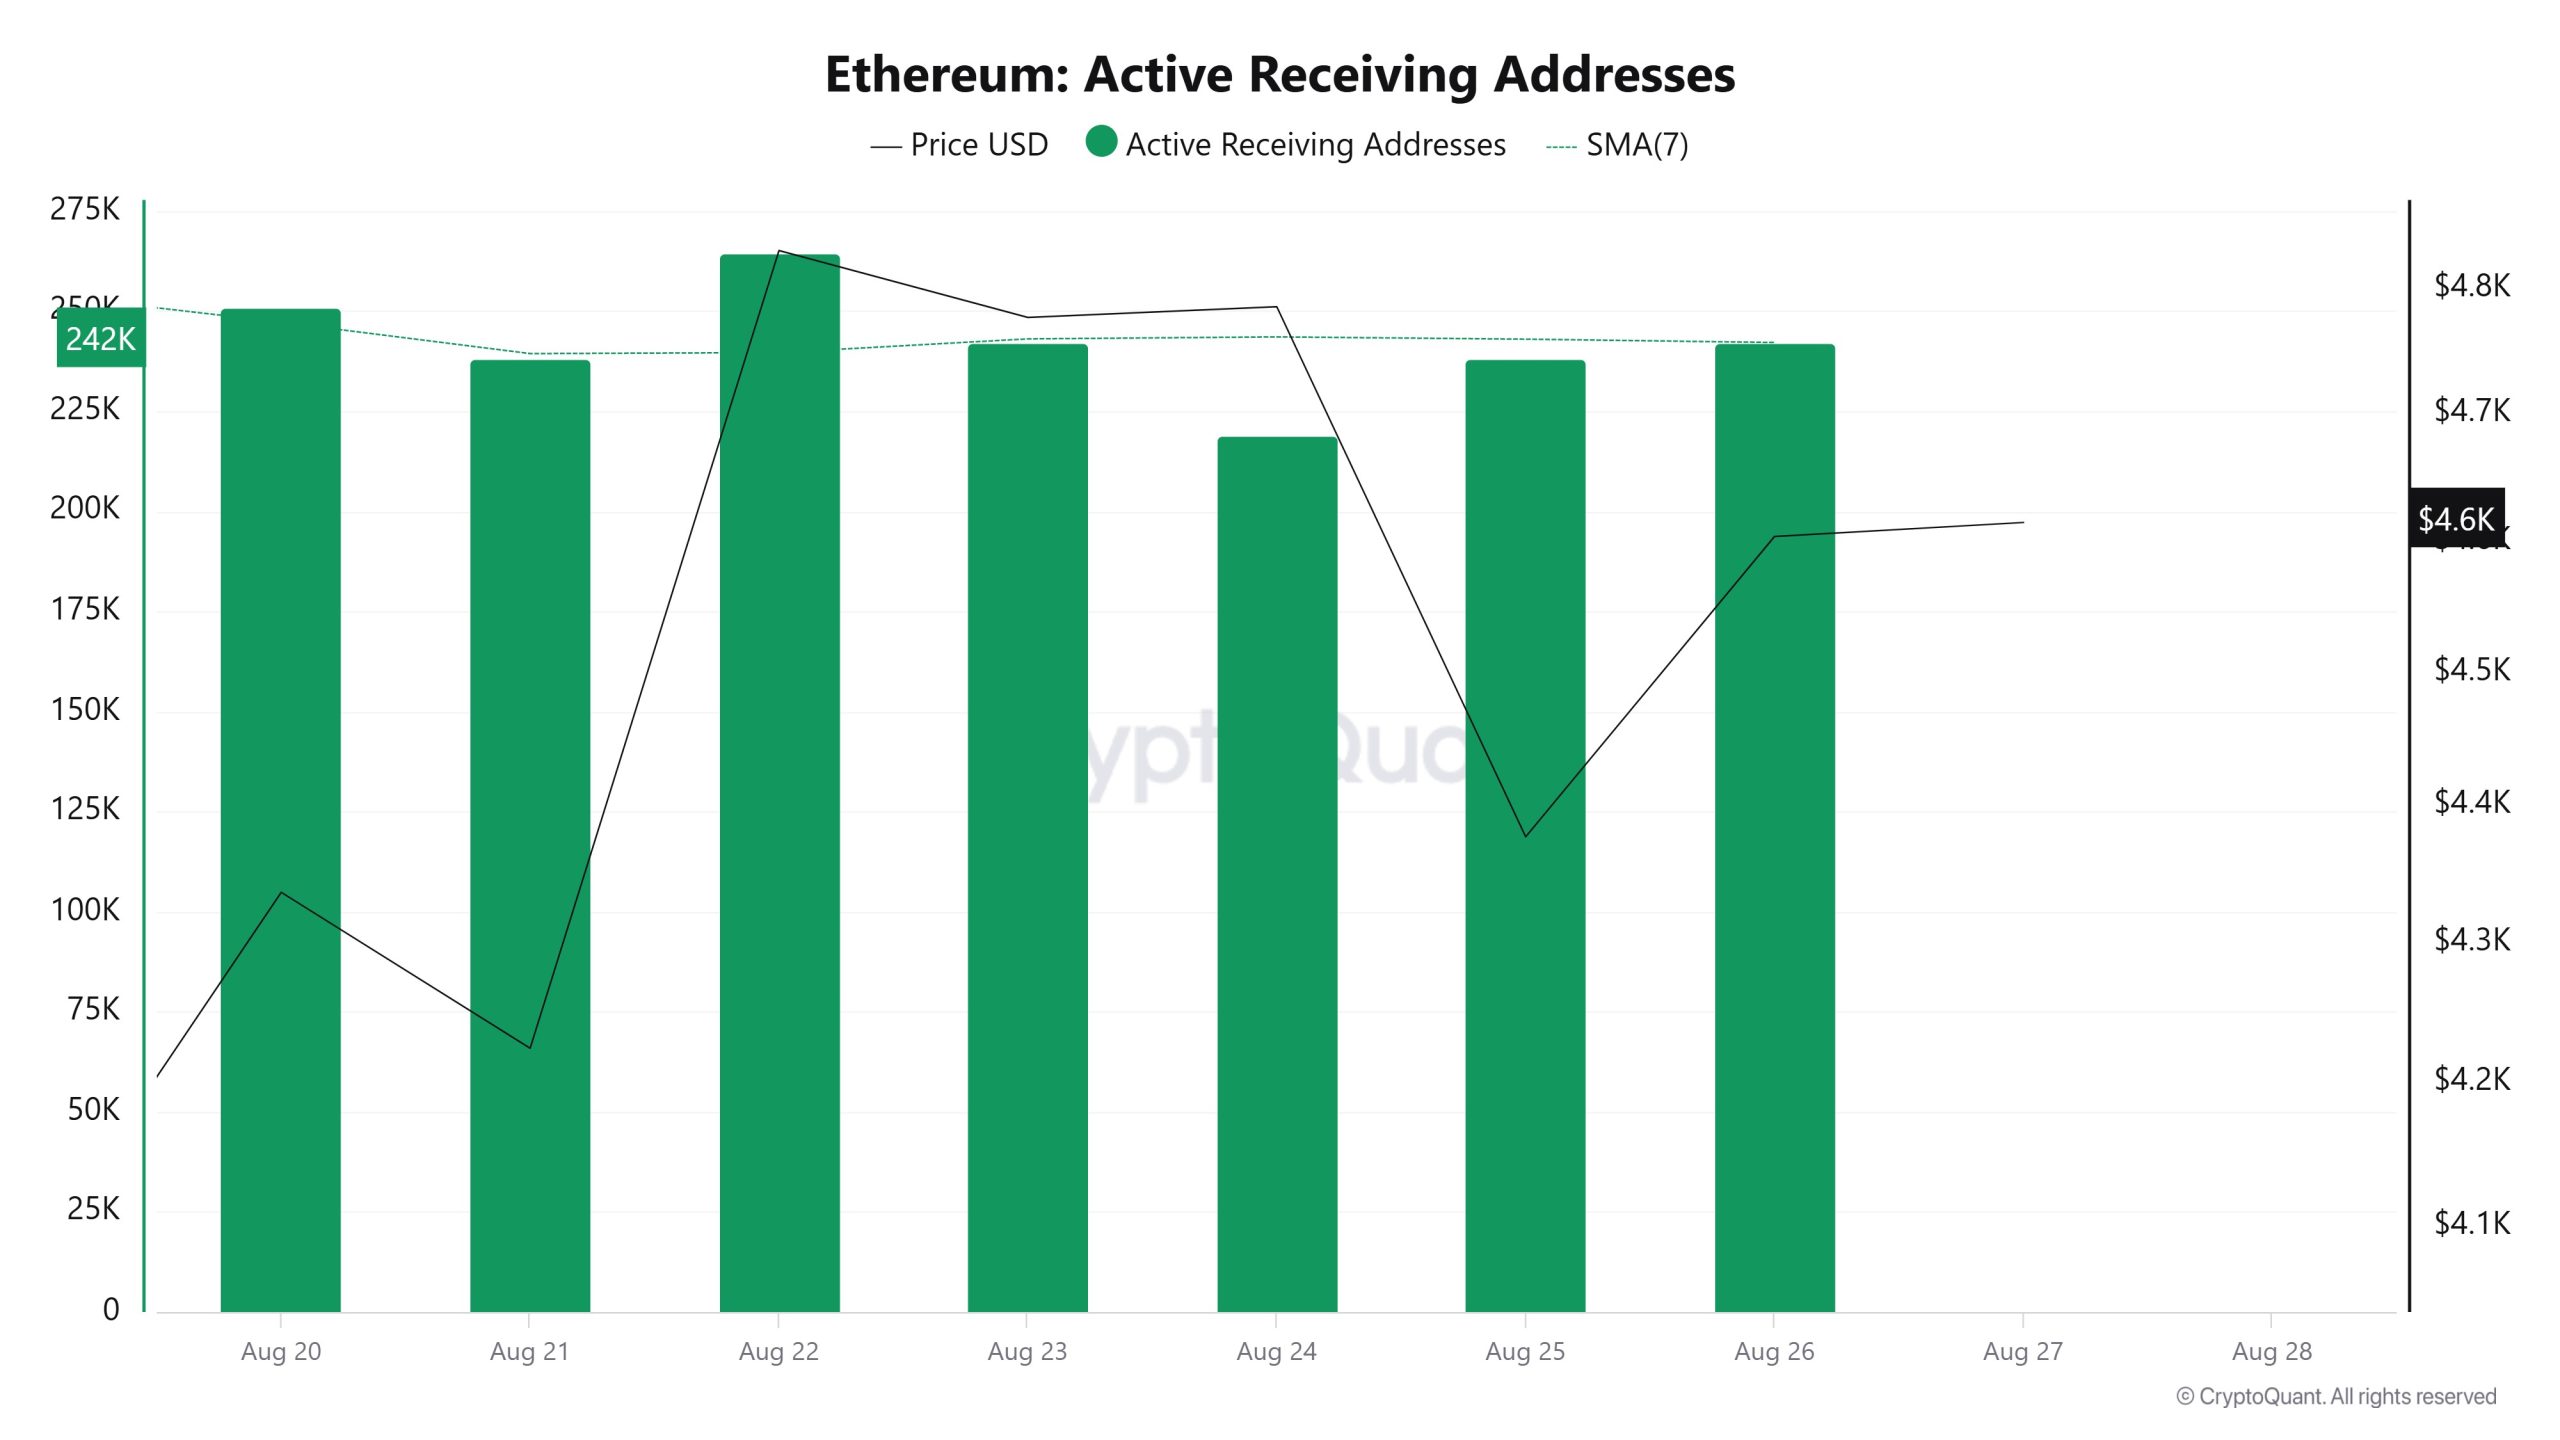
Between August 20 and August 27, there was a decline en the number of active buying addresses and a parallel downward consolidation en the price. On the day when the price reached its highest level, active receiving addresses reached as high as 264,504, indicating that sales were predominant.
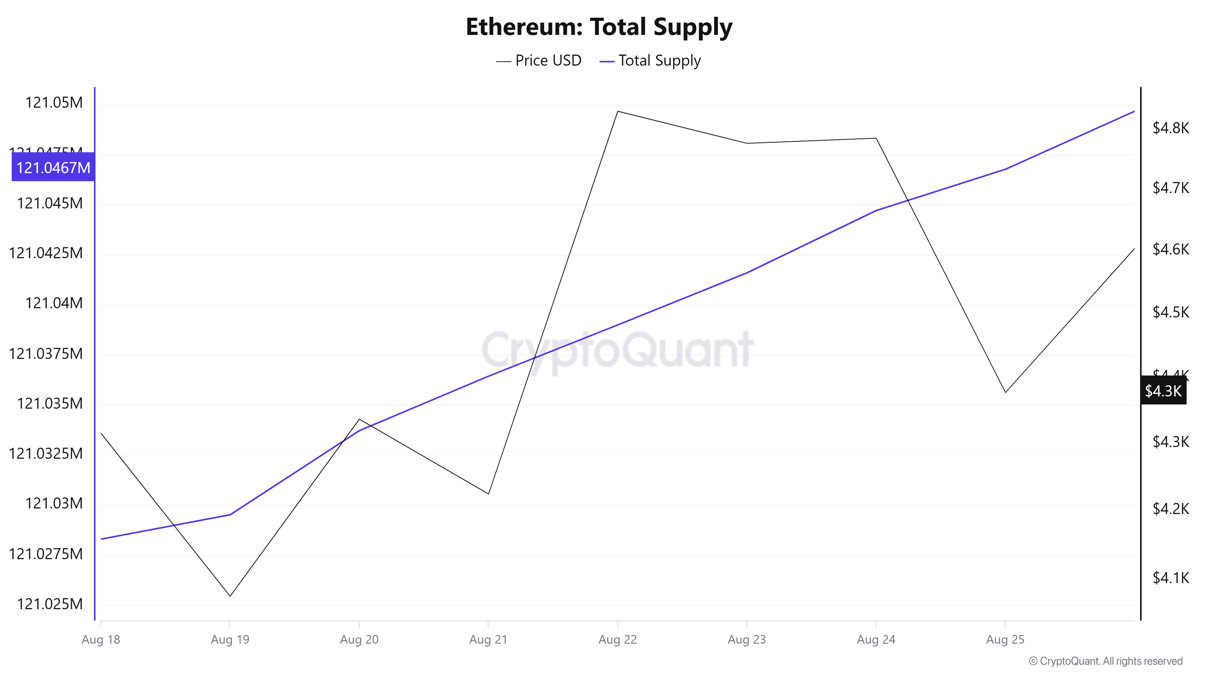
Total Value Staked
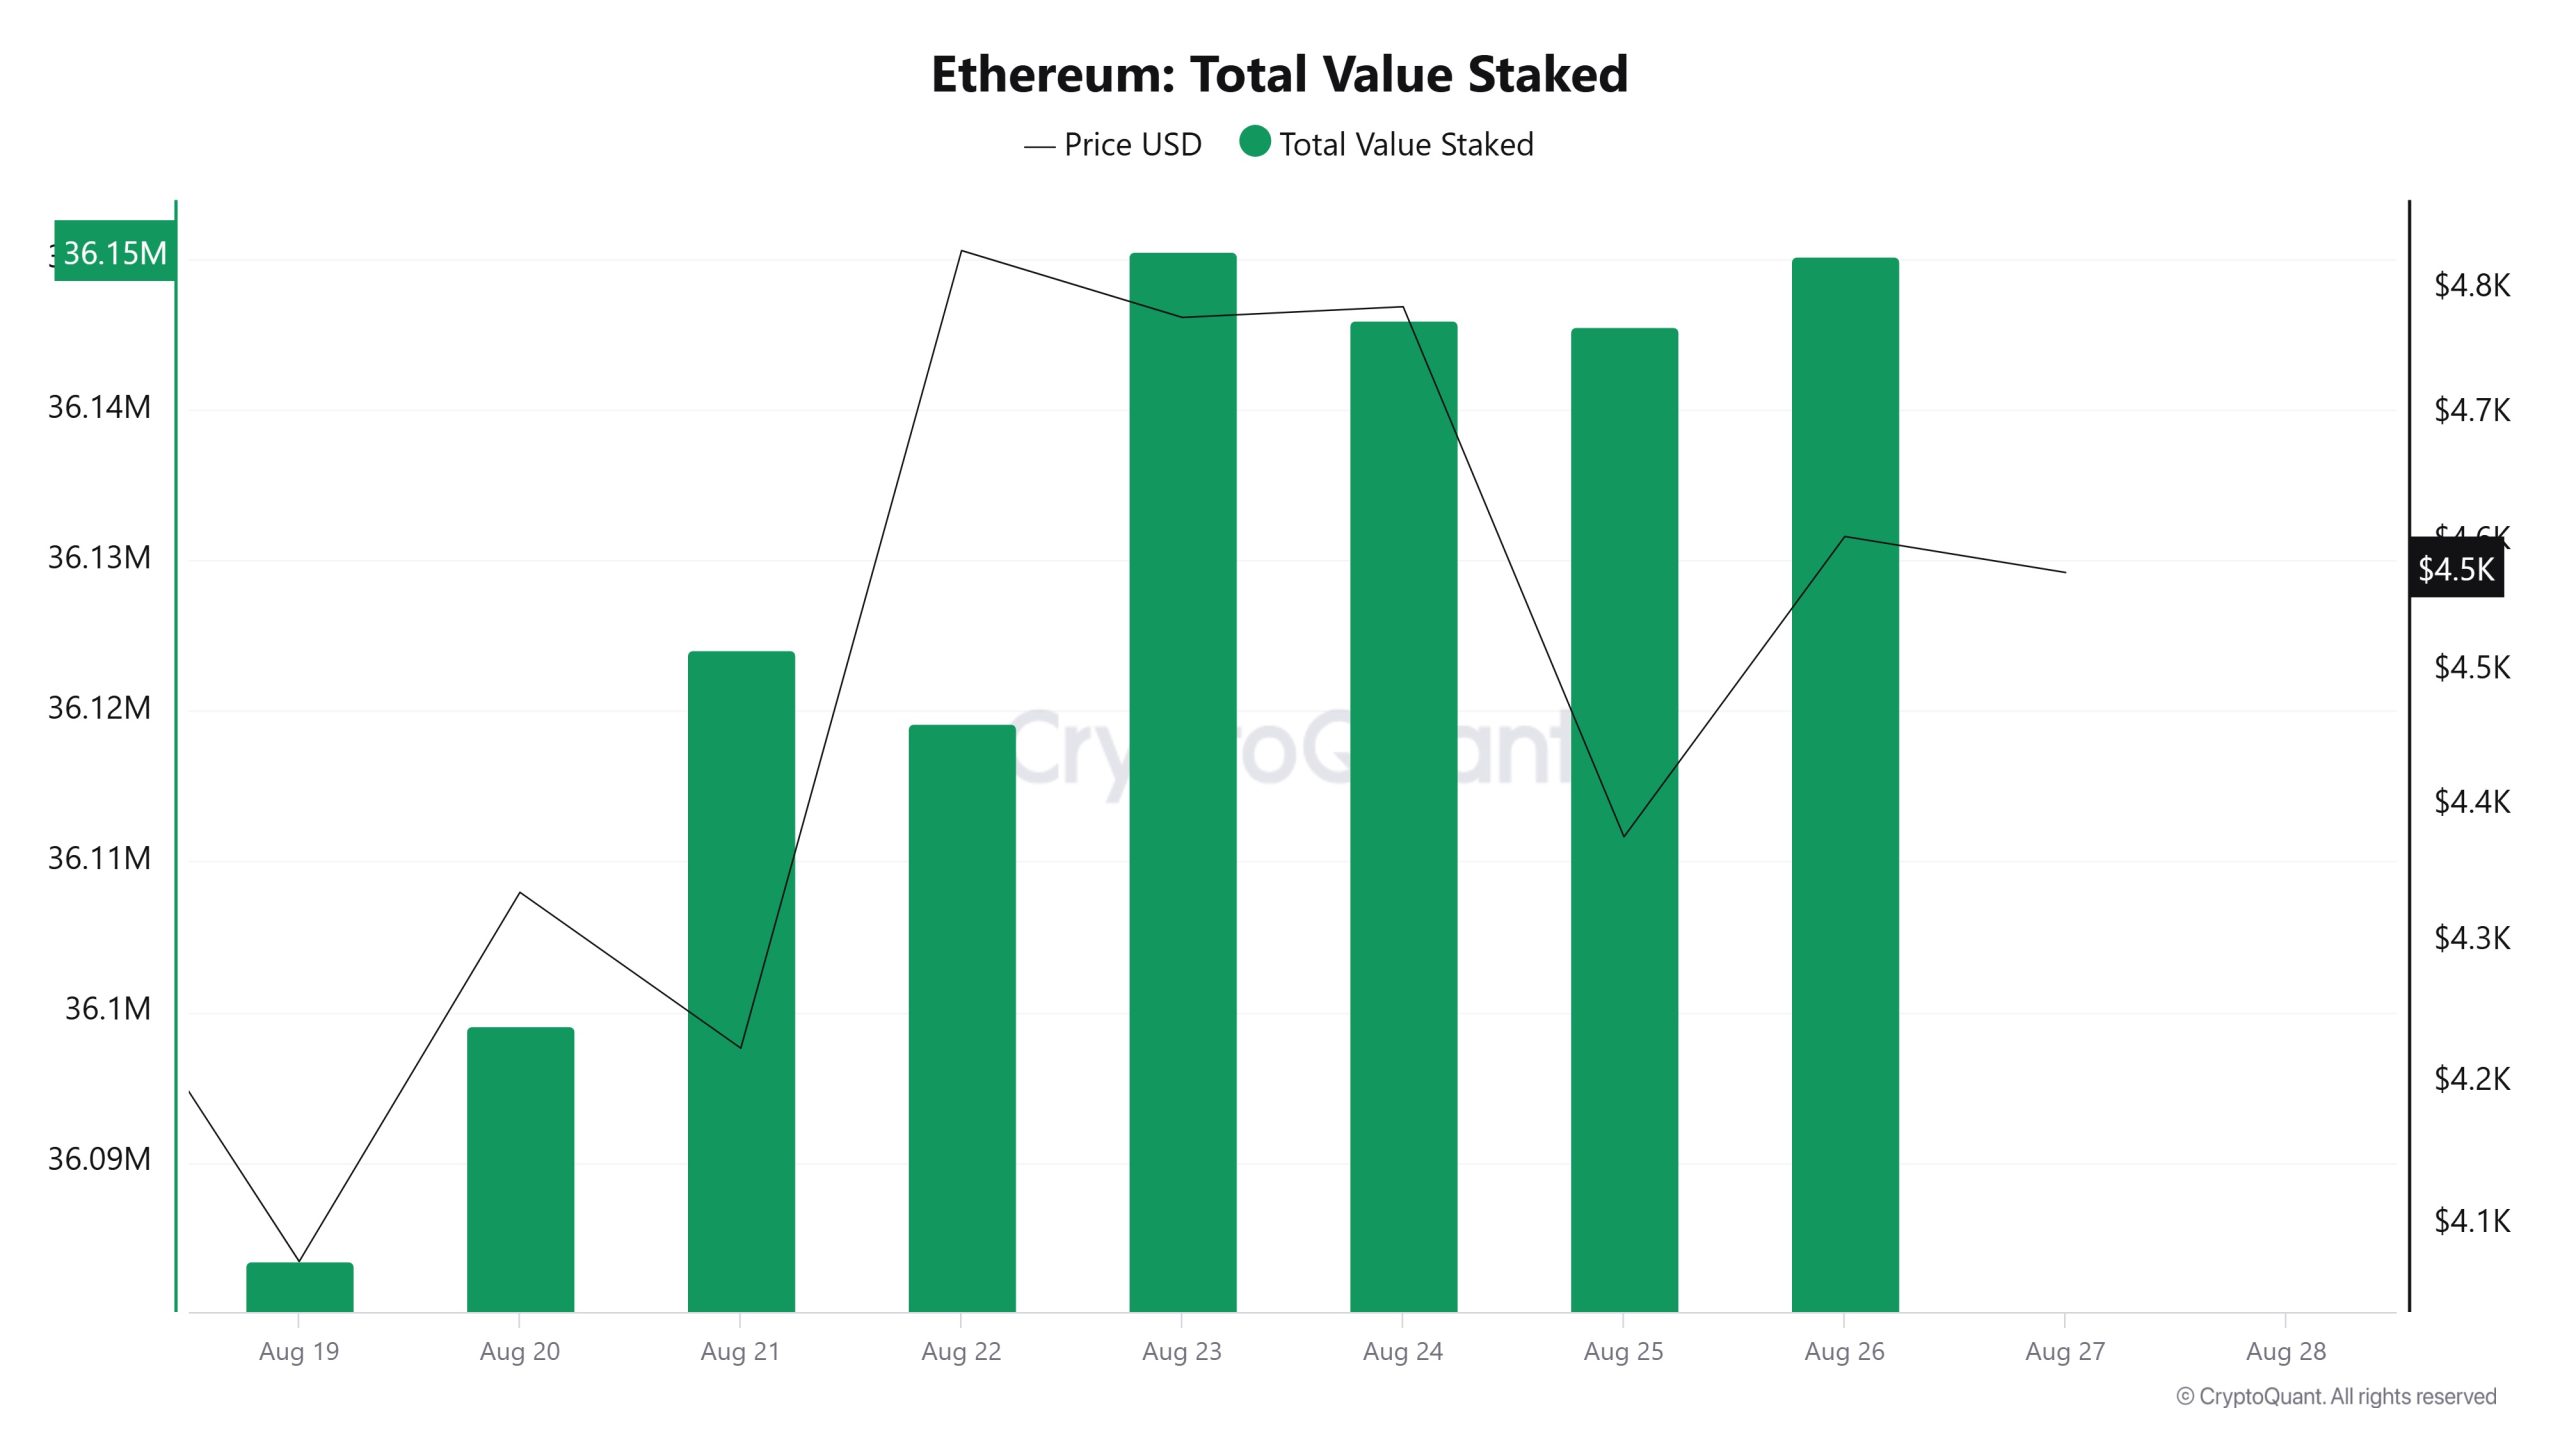
On August 20, ETH price was at $4.336 while Total Value Staked was at 36,099,152. As of August 26, the ETH price rose to $4.603, up 6.16%, while Total Value Staked rose to 36,150,222, up 0.14%.
Staking Inflows
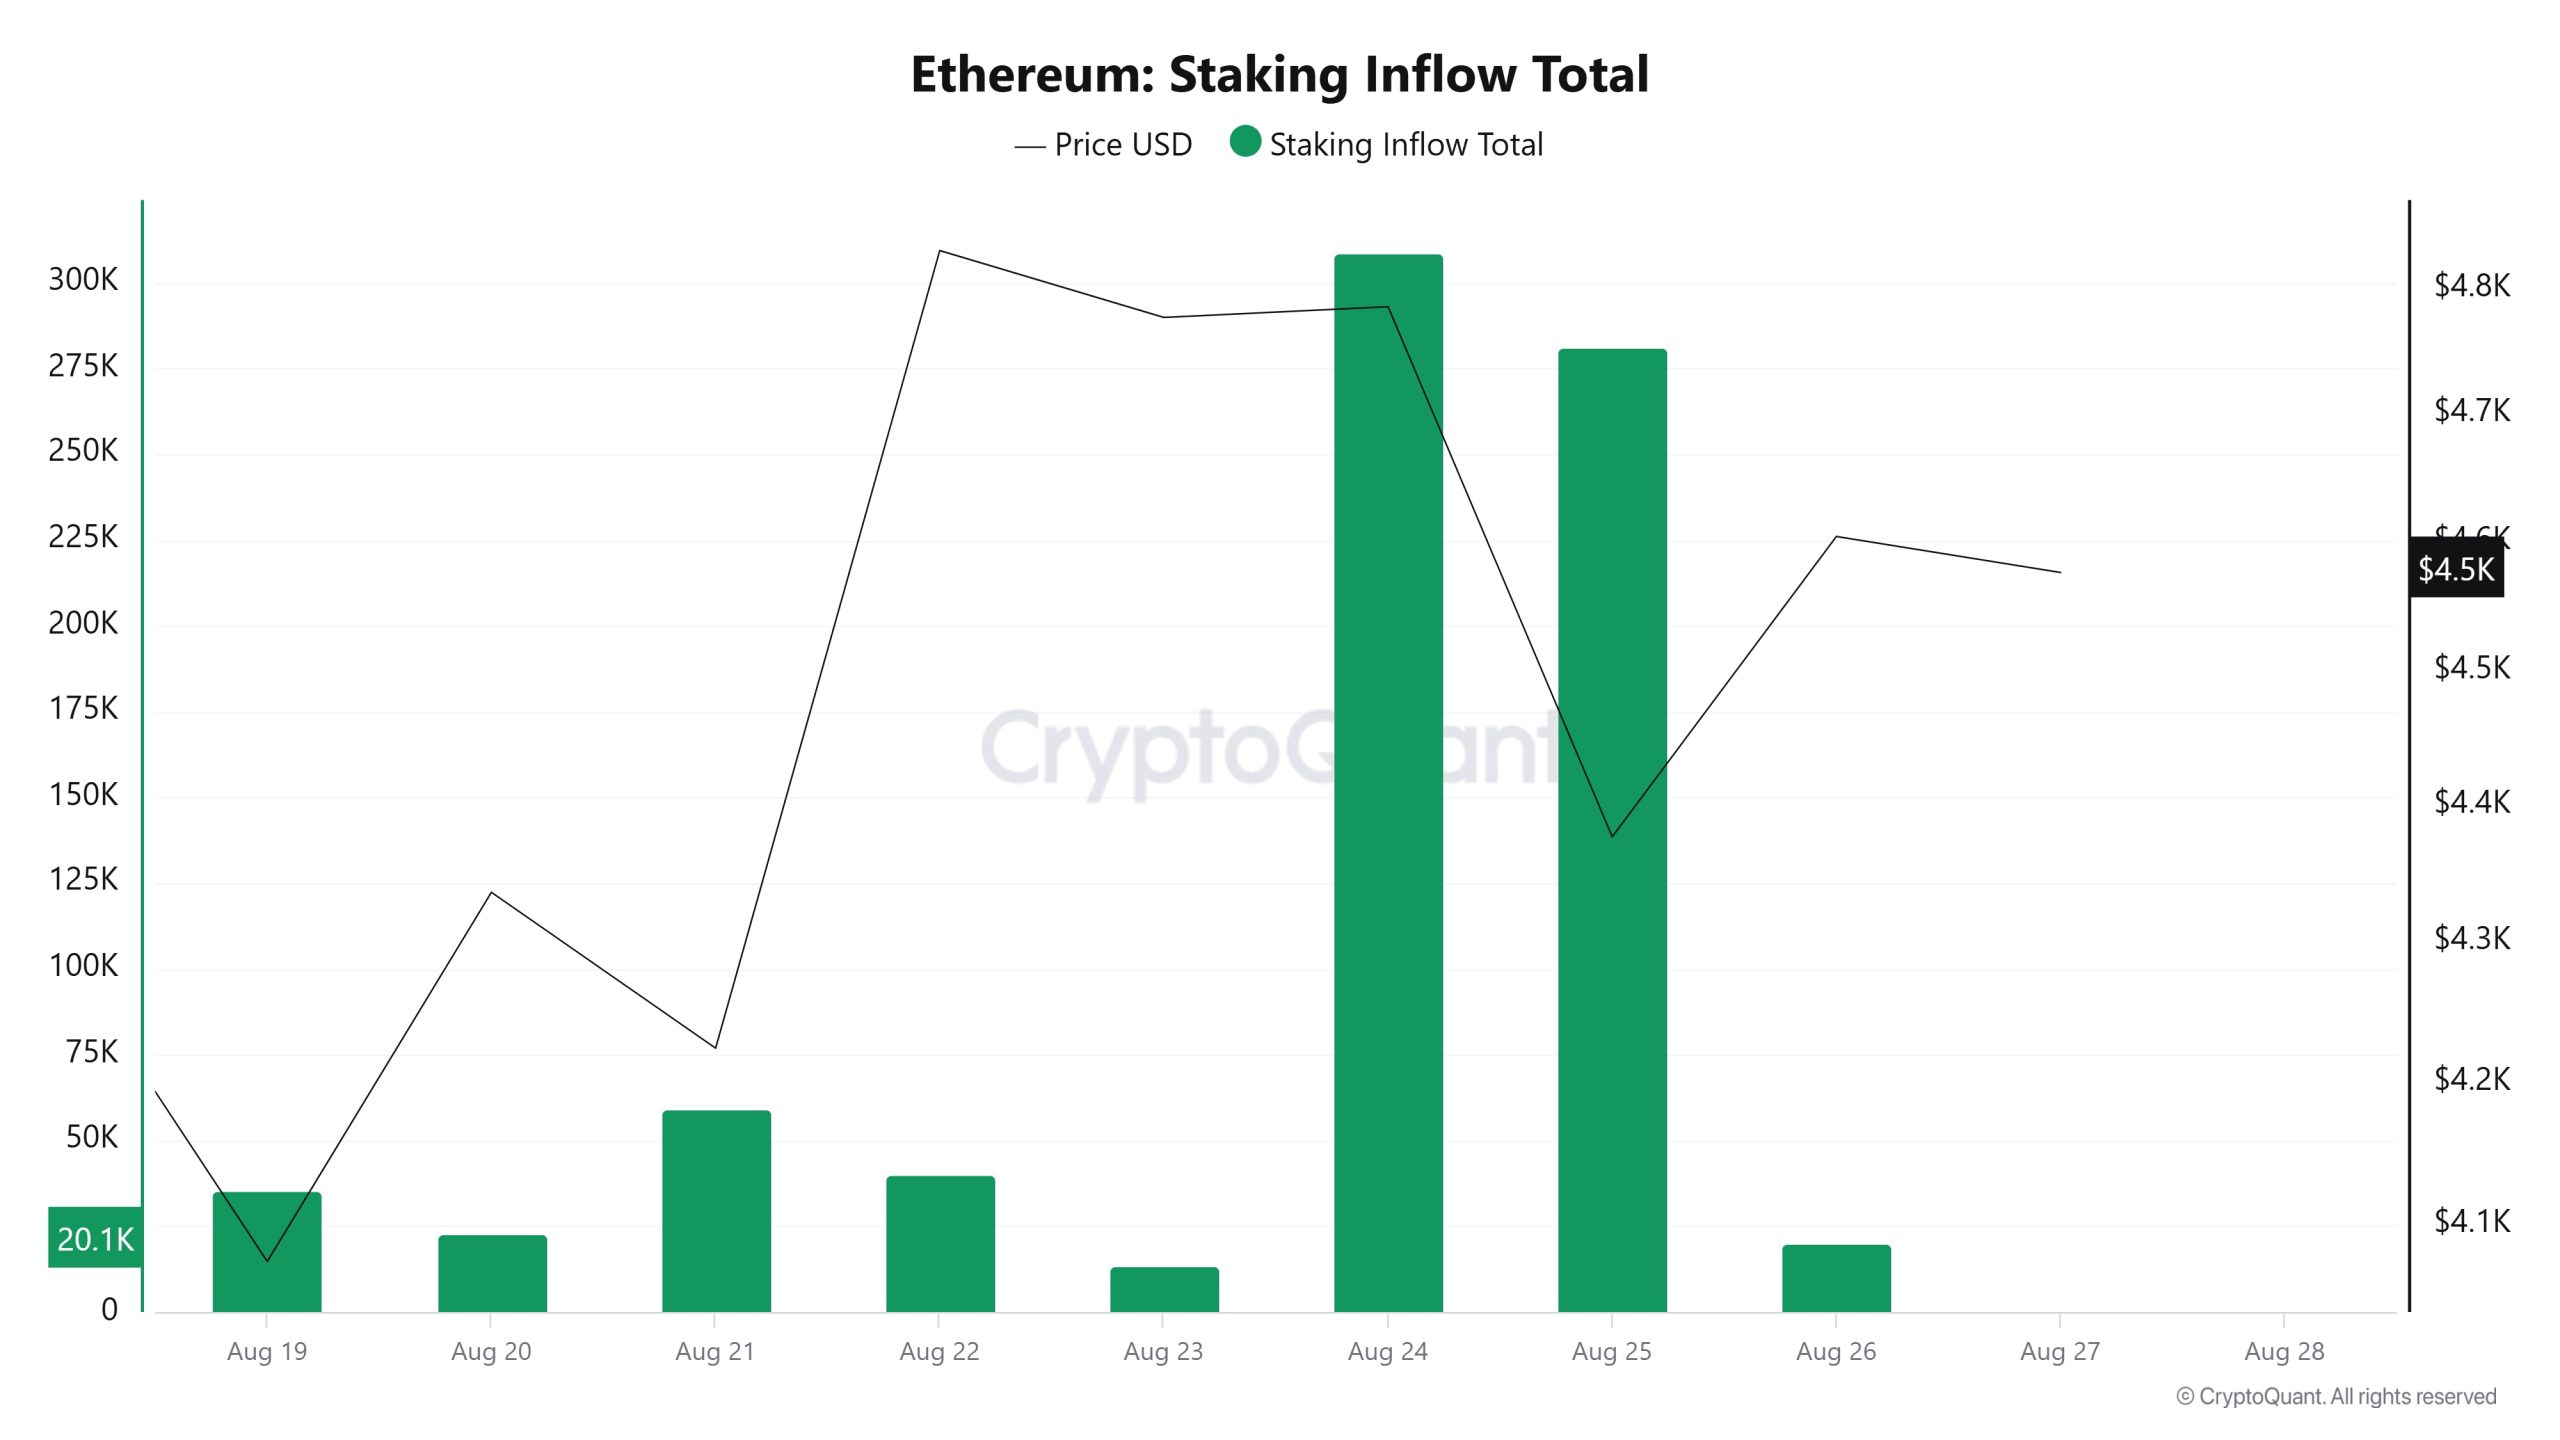
On August 20, ETH price was at $4,336 while Staking Inflow was at 22,914. As of August 26, ETH price increased por 6.16% to $4,603, while Staking Inflow decreased por 12.01% to 20,162.
Derivatives
Open Interest
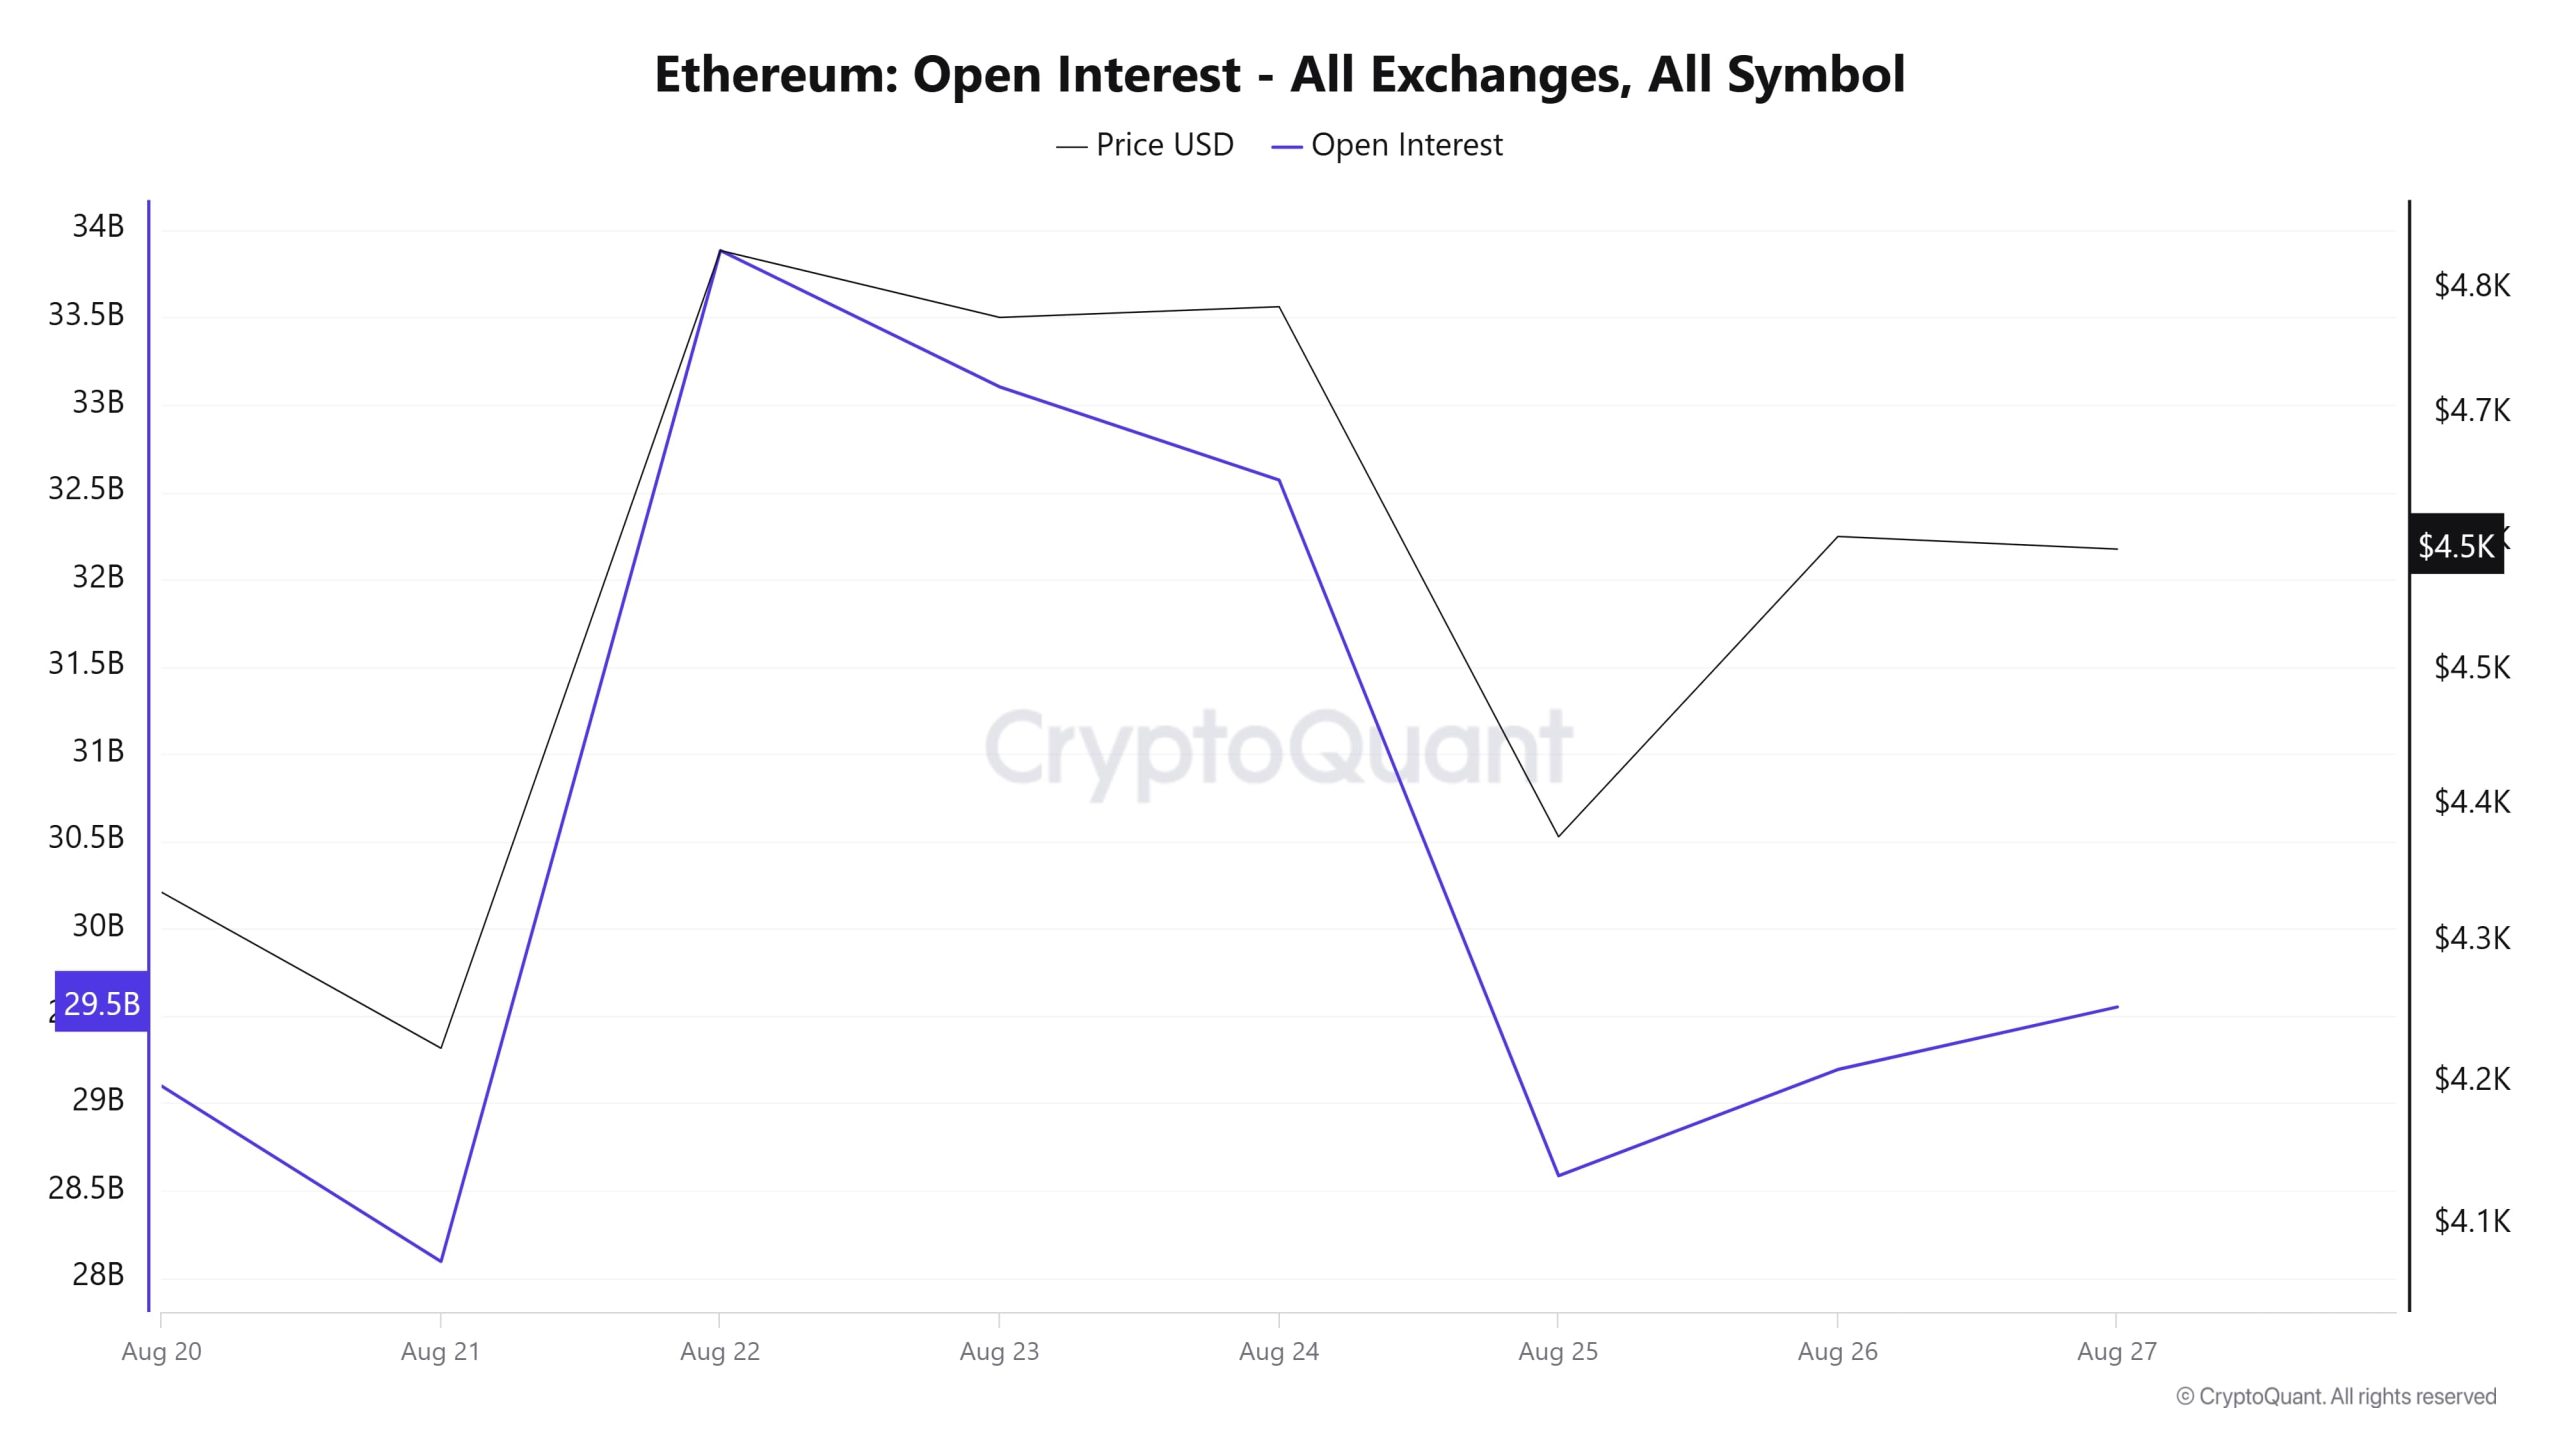
When Ethereum’s open interest data is evaluated together with price movements, a remarkable fluctuation stands out. After falling from $29.5 billion to less than $28 billion el August 20 and 21, open interest climbed sharply to $34 billion el August 22. In this process, the price also accelerated rapidly, approaching the level of $4,800. However, with the gradual decline en the price from August 24 onwards, open interest also started to decline and fell back to around $28 billion el August 25. Although the price recovered to $4,500 en the last two days, open interest increased slightly and remained around $29 billion. The overall outlook suggests that despite bullish attempts, traders remain cautious and there is not yet a strong appetite to open leveraged positions.
Funding Rate
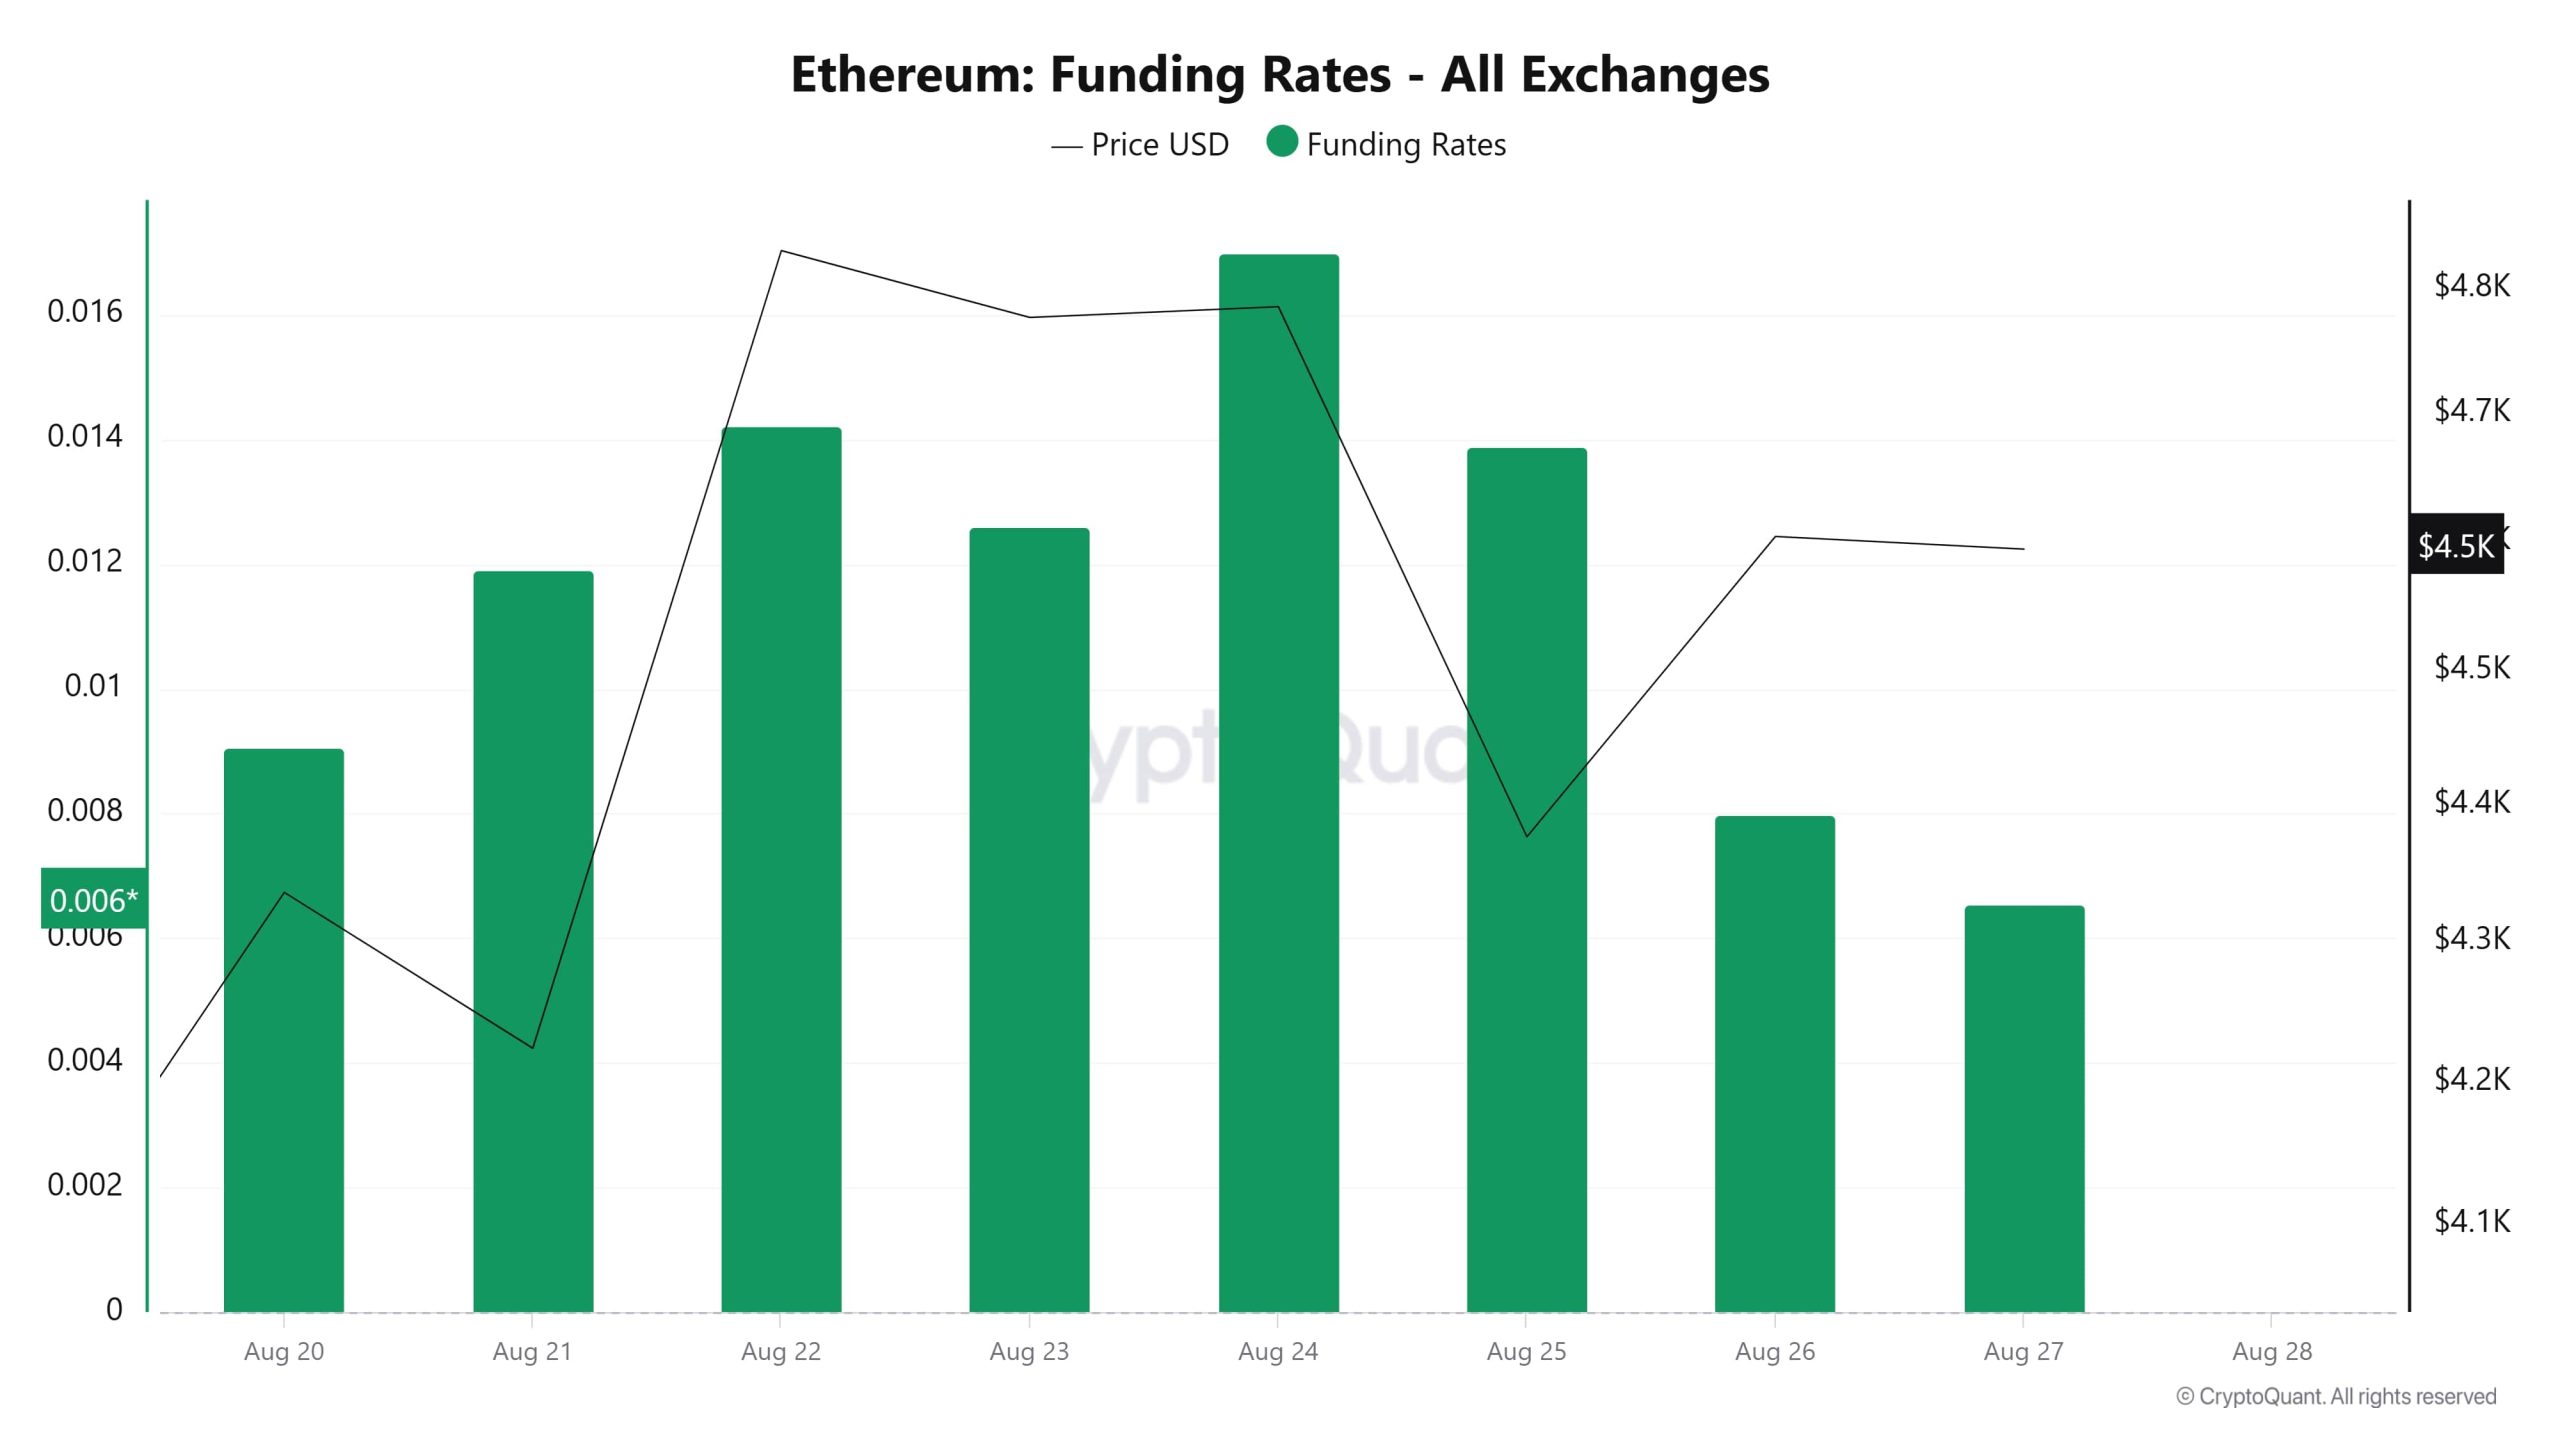
The chart shows that Ethereum’s funding rate fluctuated from August 20 to August 27. Starting from a low el August 20, the rates peaked el August 24 and rose above 0.016. During this increase, the price also supported the rise por approaching the $4,800 level. However, el August 25, the funding rate fell sharply and the price retreated at the same time. In the following days, the rates remained at lower levels and the price stabilized en the range of $4,300-4,500. While it is understood that the market turned to more long positions el the days when the funding rate was rising, it can be said that the short-term correction pressure increased with the decline.
Long & Short Liquidations
ETH price rose as high as $4,956 and then fell sharply to $4,300. However, approximately $ 1.07 billion of long positions were liquidated. Another $1.20 billion worth of short positions were liquidated en the same timeframe.
| Date | Long Amount (Million $) | Short Amount (Million $) |
|---|---|---|
| August 20 | 58.42 | 301.55 |
| August 21 | 246.98 | 36.26 |
| August 22 | 196.90 | 582.62 |
| August 23 | 53.10 | 30.99 |
| August 24 | 118.38 | 95.90 |
| August 25 | 332.96 | 45.45 |
| August 26 | 61.26 | 106.94 |
| Total | 1,067.99 | 1,199.71 |
Supply Distribution
Total Supply: It reached 121,046,767 units, up about 0.0153% from last week.
New Supply: The amount of ETH produced this week was 18,459.
Velocity: Velocity was 9.32 as of August 25, up from 9.14 last week.
| Wallet Categoría | 18.08.2025 | 25.08.2025 | Change (%) |
|---|---|---|---|
| 100 – 1k ETH | 8.585M | 8.5267M | -0.68% |
| 1k – 10k ETH | 12.9449M | 12.9533M | 0.07% |
| 10k – 100k ETH | 19.4048M | 19.3558M | -0.25% |
| 100k+ ETH | 4.268M | 4.0906M | -4.16% |
According to the latest weekly data, Ethereum wallet distribution is fluctuating. Wallet balances en the 100 – 1k ETH range experienced a limited decrease of 0.68%, while the 1k – 10k ETH segment saw a small increase of 0.07%. The 10k – 100k ETH range, which represents larger investors, declined por 0.25%, while the 100k+ ETH category, which constitutes the highest group, saw a remarkable decline of 4.16%.
Exchange Supply Ratio
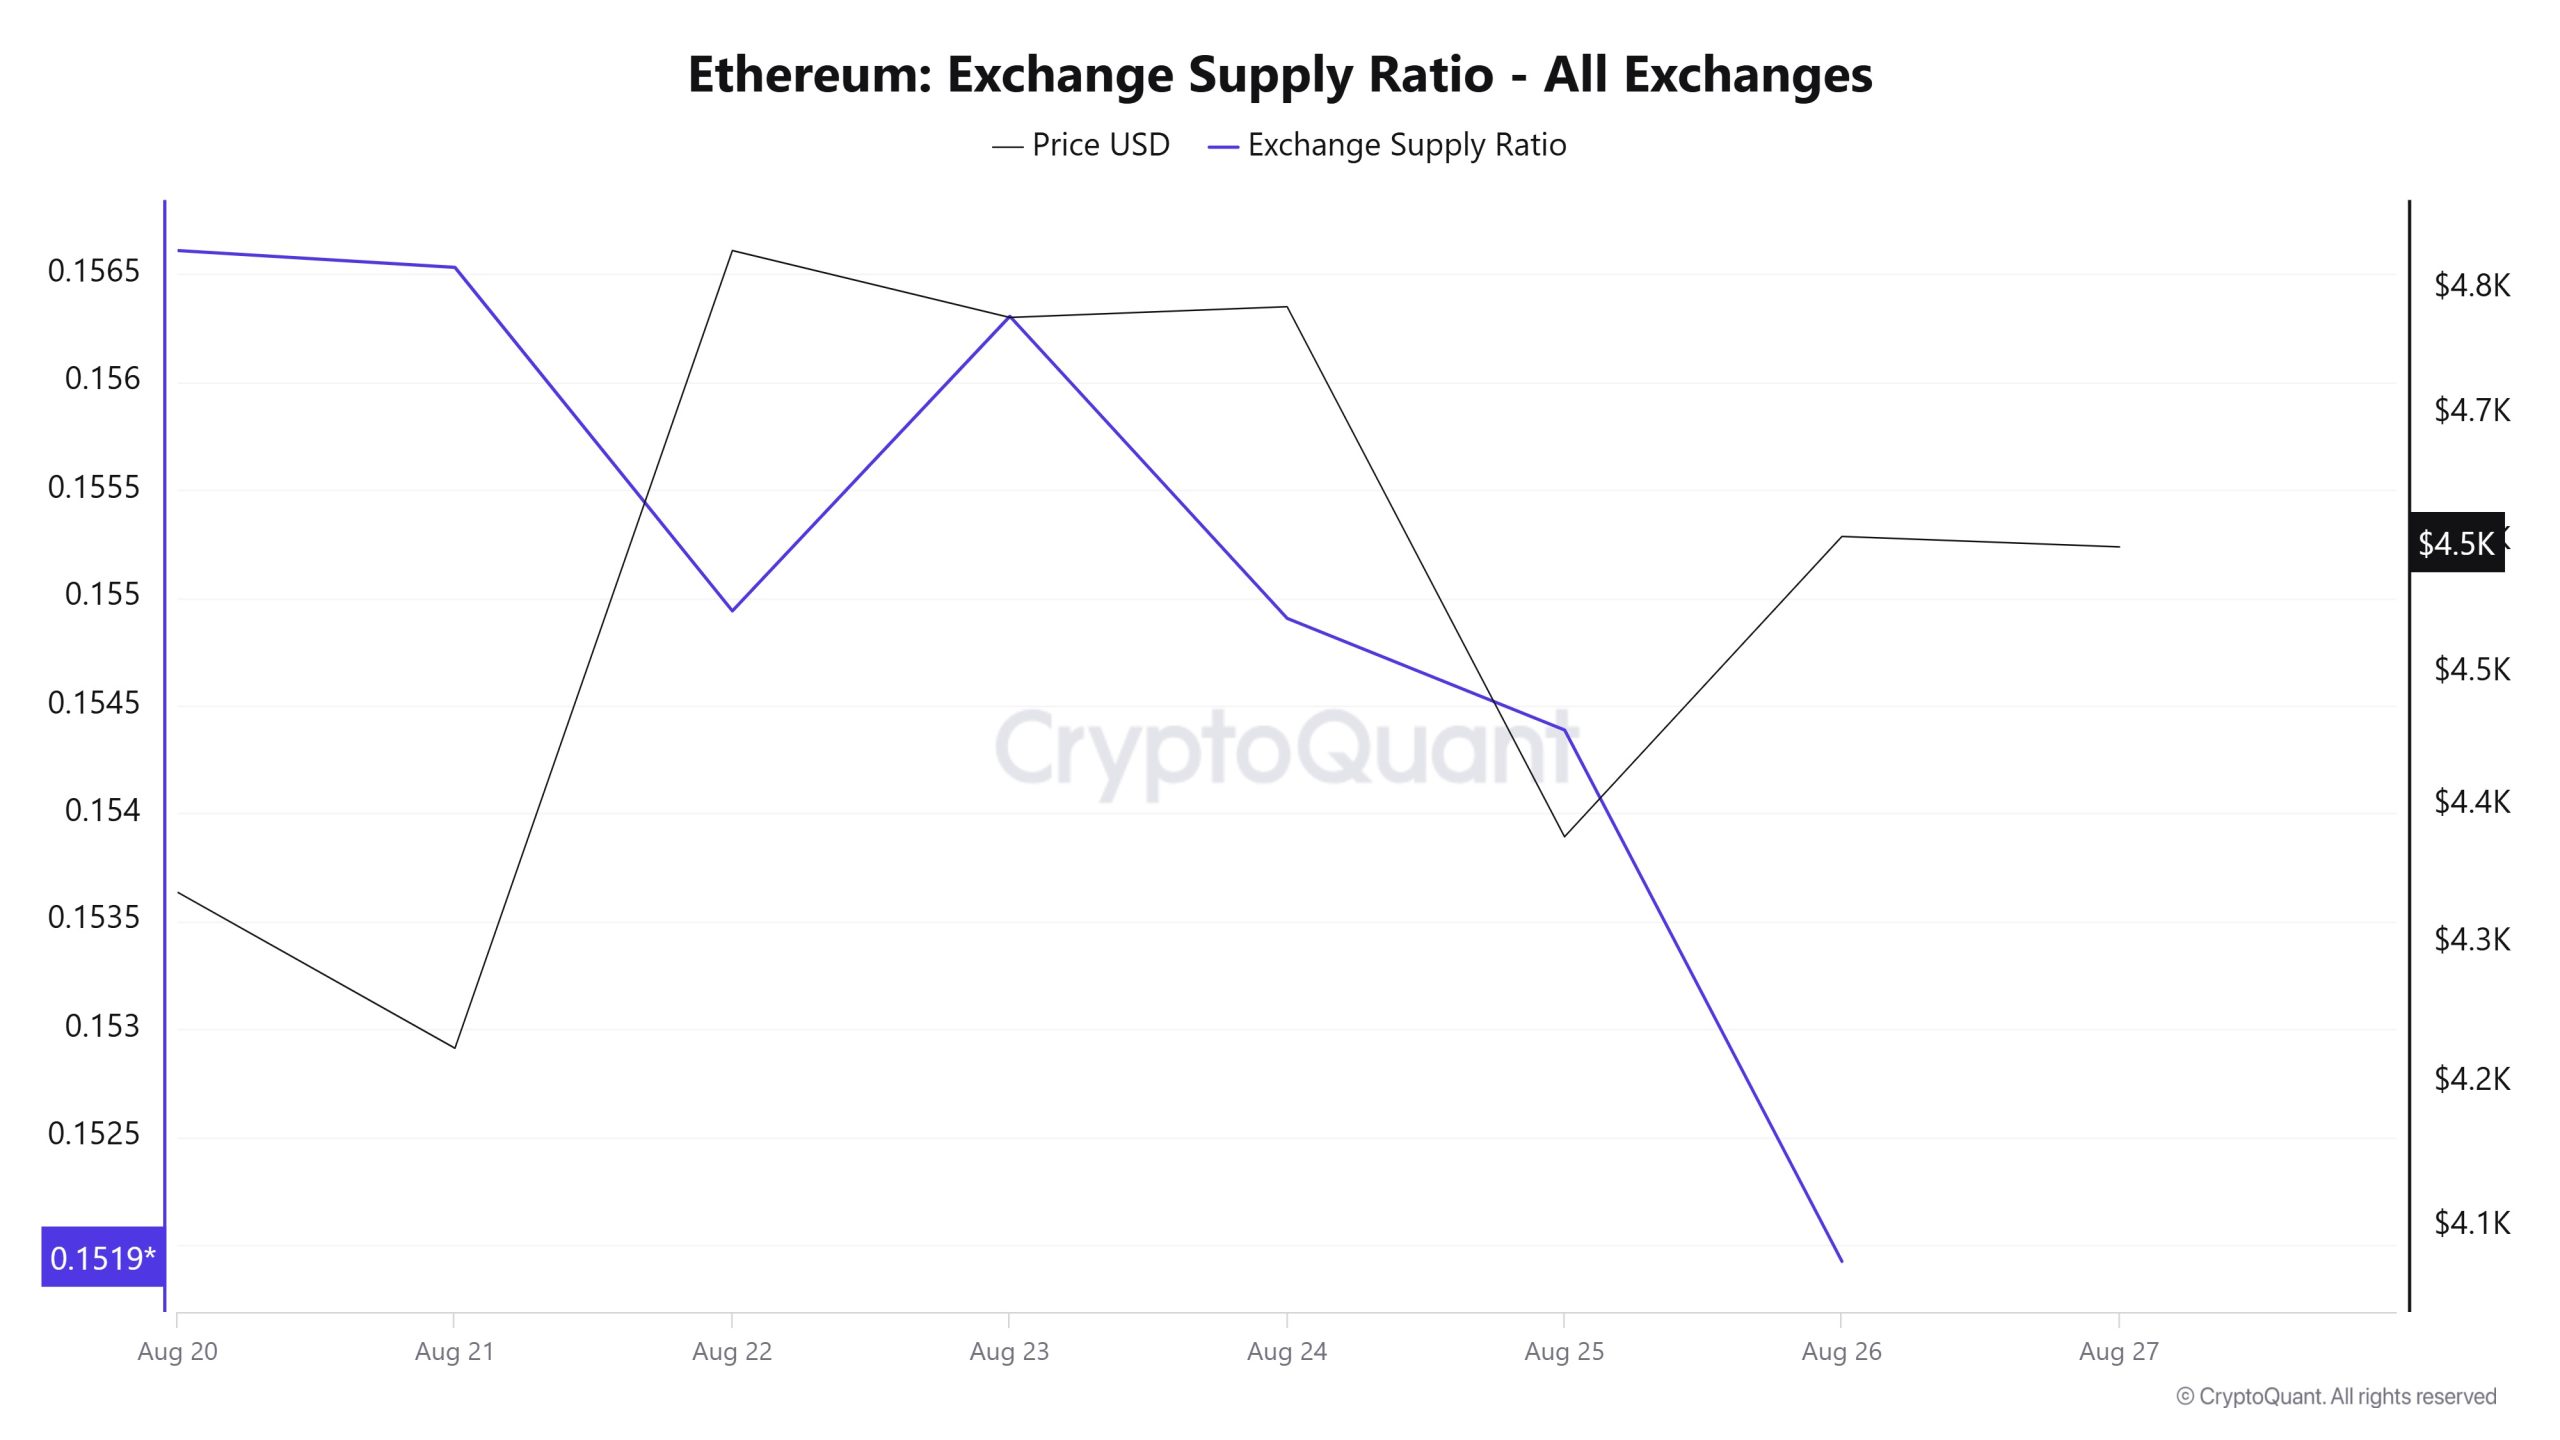
Between August 20 and August 27, Ethereum Exchange Supply Ratio decreased from 0.15630523 to 0.15438673. During this period, the Ethereum price rose from $4,776 to $4,784. At the intersection of the price and the Exchange Supply Ratio, especially el August 23-24, there was a significant increase en the Exchange Supply Ratio while the price continued to fall. This suggests that despite the price decline, the amount of Ethereum supplied to exchanges increased, possibly indicating that long-term investors continued to hold their holdings. Ethereum price is generally unstable.
Fees and Revenues
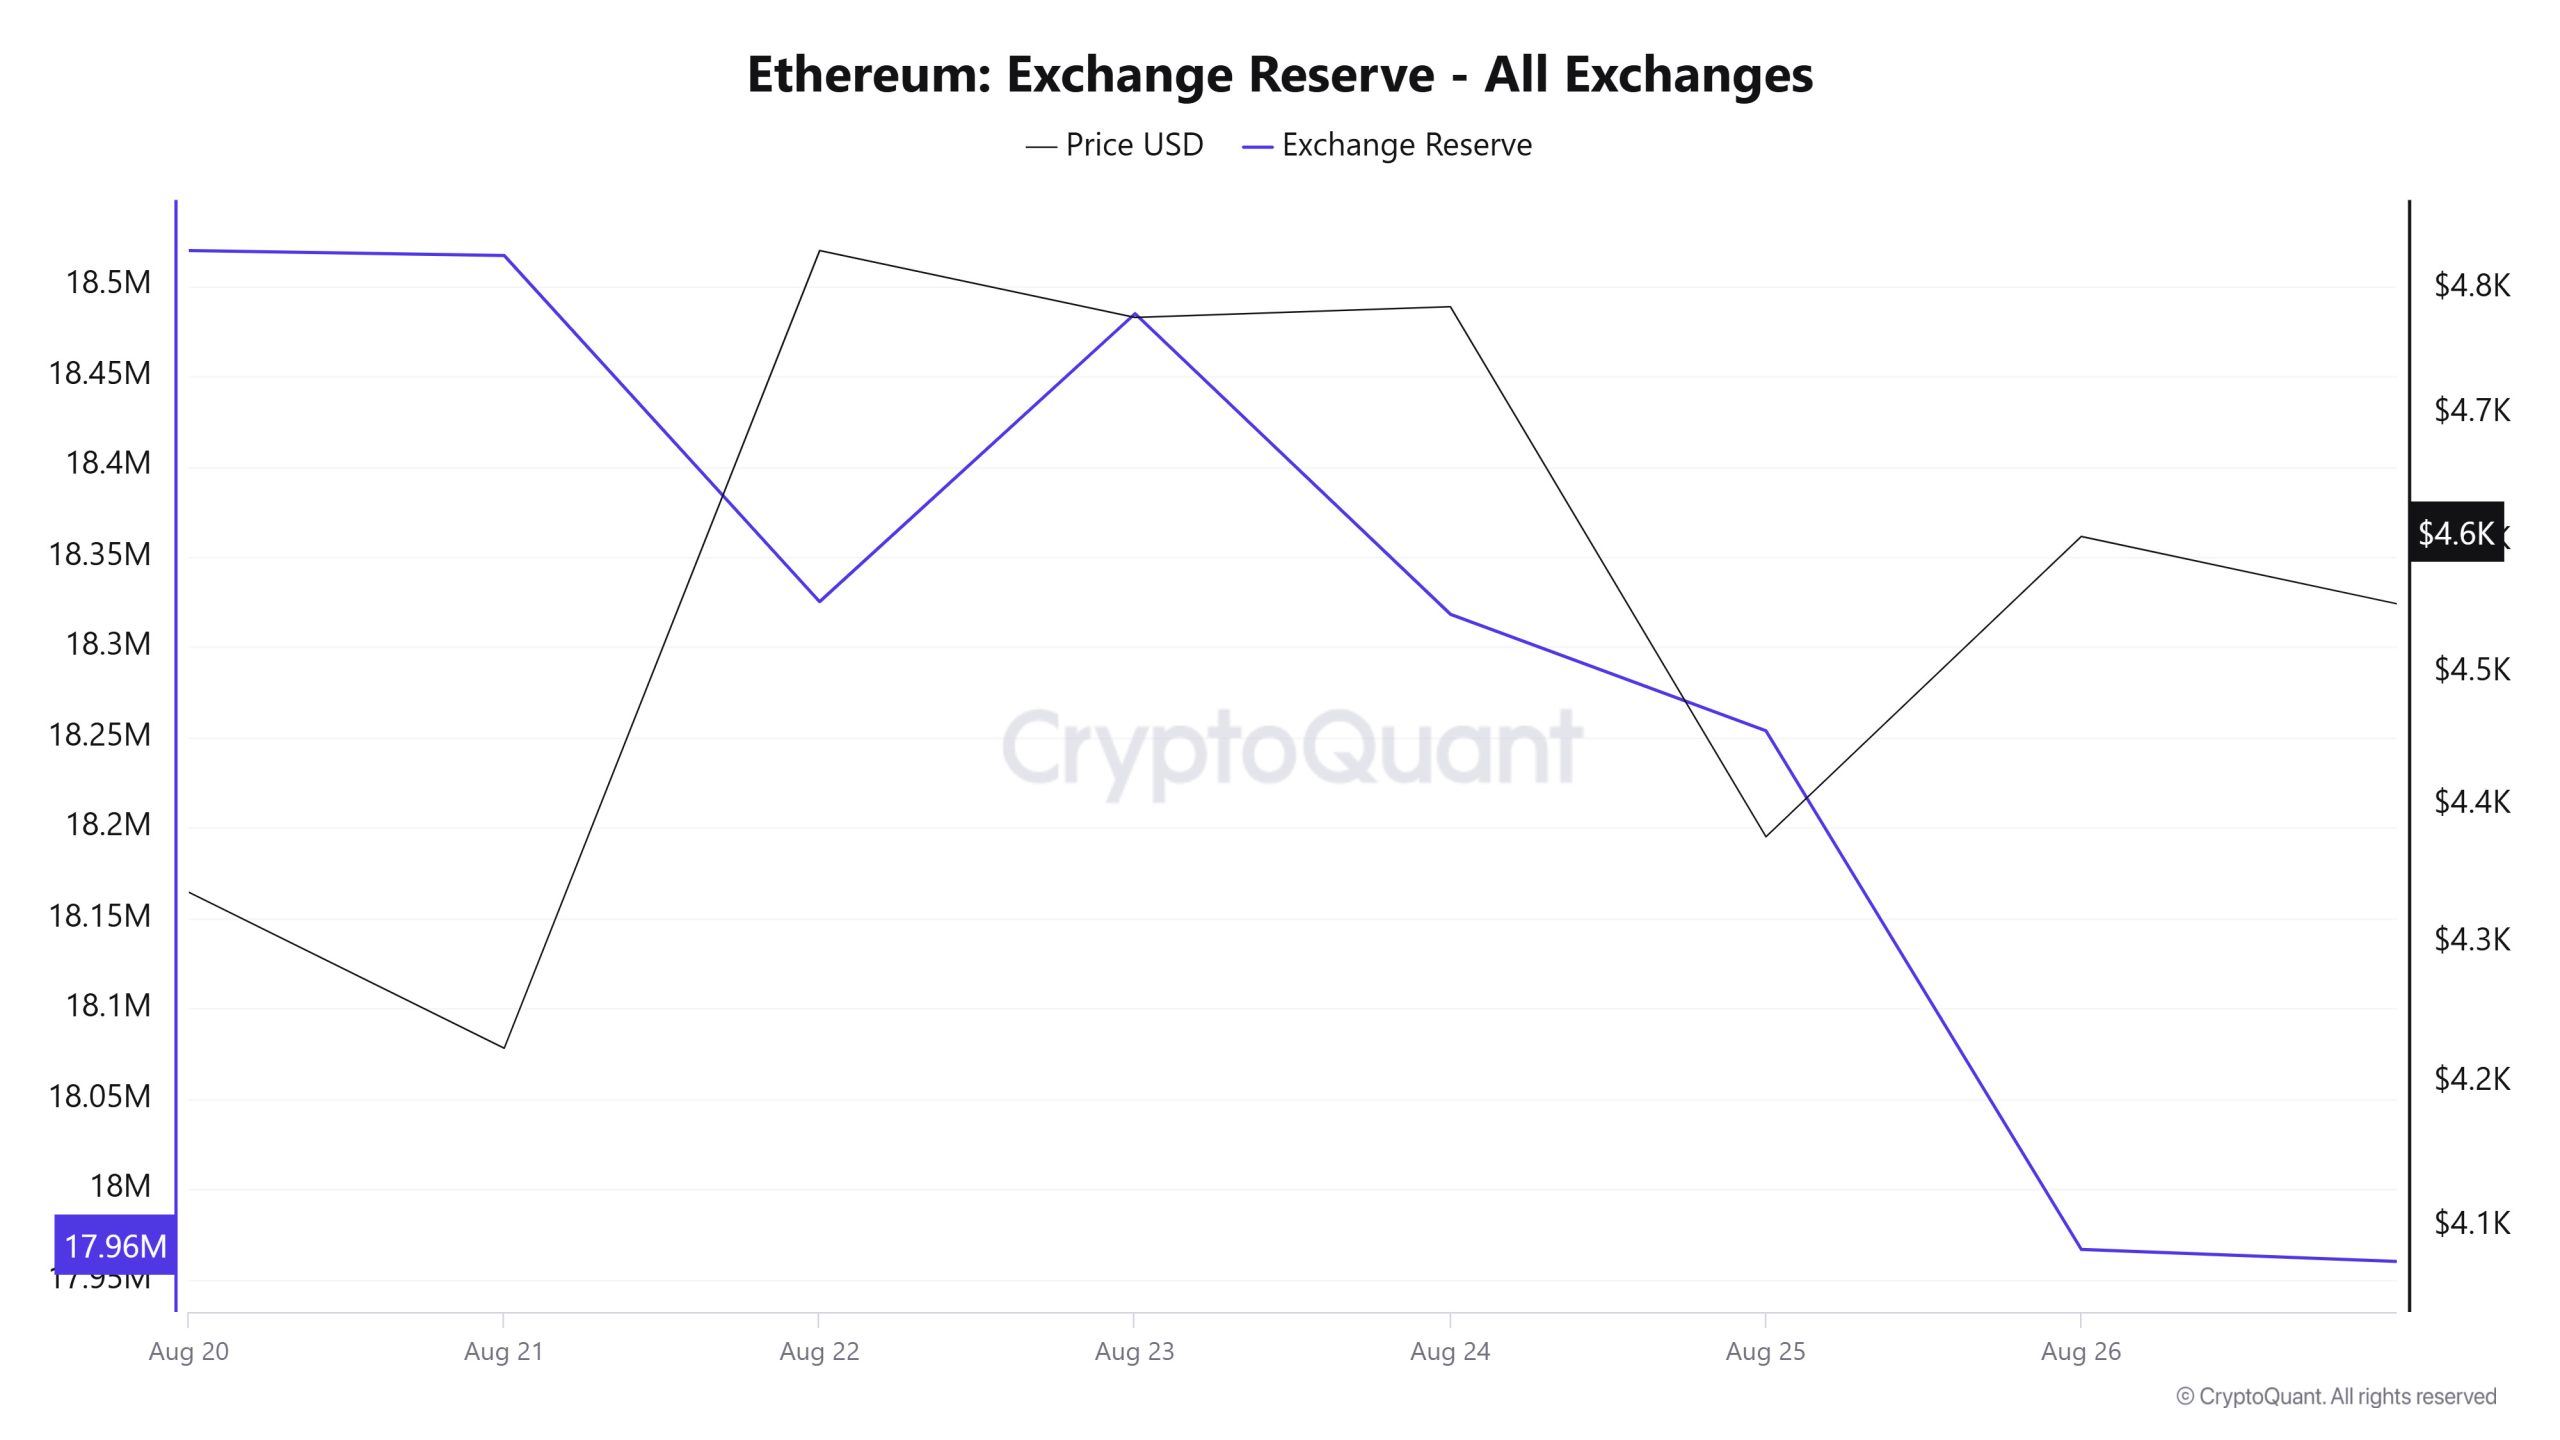
Between August 20-26, 2025, Ethereum reserves el exchanges decreased from 18,519,428 ETH to 17,966,798 ETH, with a total net outflow of 552,630 ETH. During this period, reserves decreased por approximately 2.98%. During the same period, the Ethereum price rose from $4,336 to $4,604, gaining about 6.19%. The significant drop en reserves while the price increased suggests that investors are withdrawing their ETH from exchanges. This suggests that selling pressure is easing and market sentiment is strengthening. Continued outflows from stock markets en the short term could continue to support Ethereum’s bullish potential.
| Date | Exchange Inflow | Exchange Outflow | Exchange Netflow | Exchange Reserve | ETH Price (USD) |
|---|---|---|---|---|---|
| 20-Aug | 1,181,293 | 1,149,858 | 31,435 | 18,519,428 | 4,336 |
| 21-Aug | 985,309 | 988,069 | -2,759 | 18,516,668 | 4,224 |
| 22-Aug | 1,879,672 | 2,071,155 | -191,484 | 18,325,185 | 4,830 |
| 23-Aug | 950,515 | 791,150 | 159,365 | 18,484,549 | 4,776 |
| 24-Aug | 899,080 | 1,065,443 | -166,363 | 18,318,186 | 4,785 |
| 25-Aug | 1,404,786 | 1,469,261 | -64,475 | 18,253,710 | 4,377 |
| 26-Aug | 1,721,017 | 2,007,930 | -286,913 | 17,966,798 | 4,604 |
Exchange Reserve
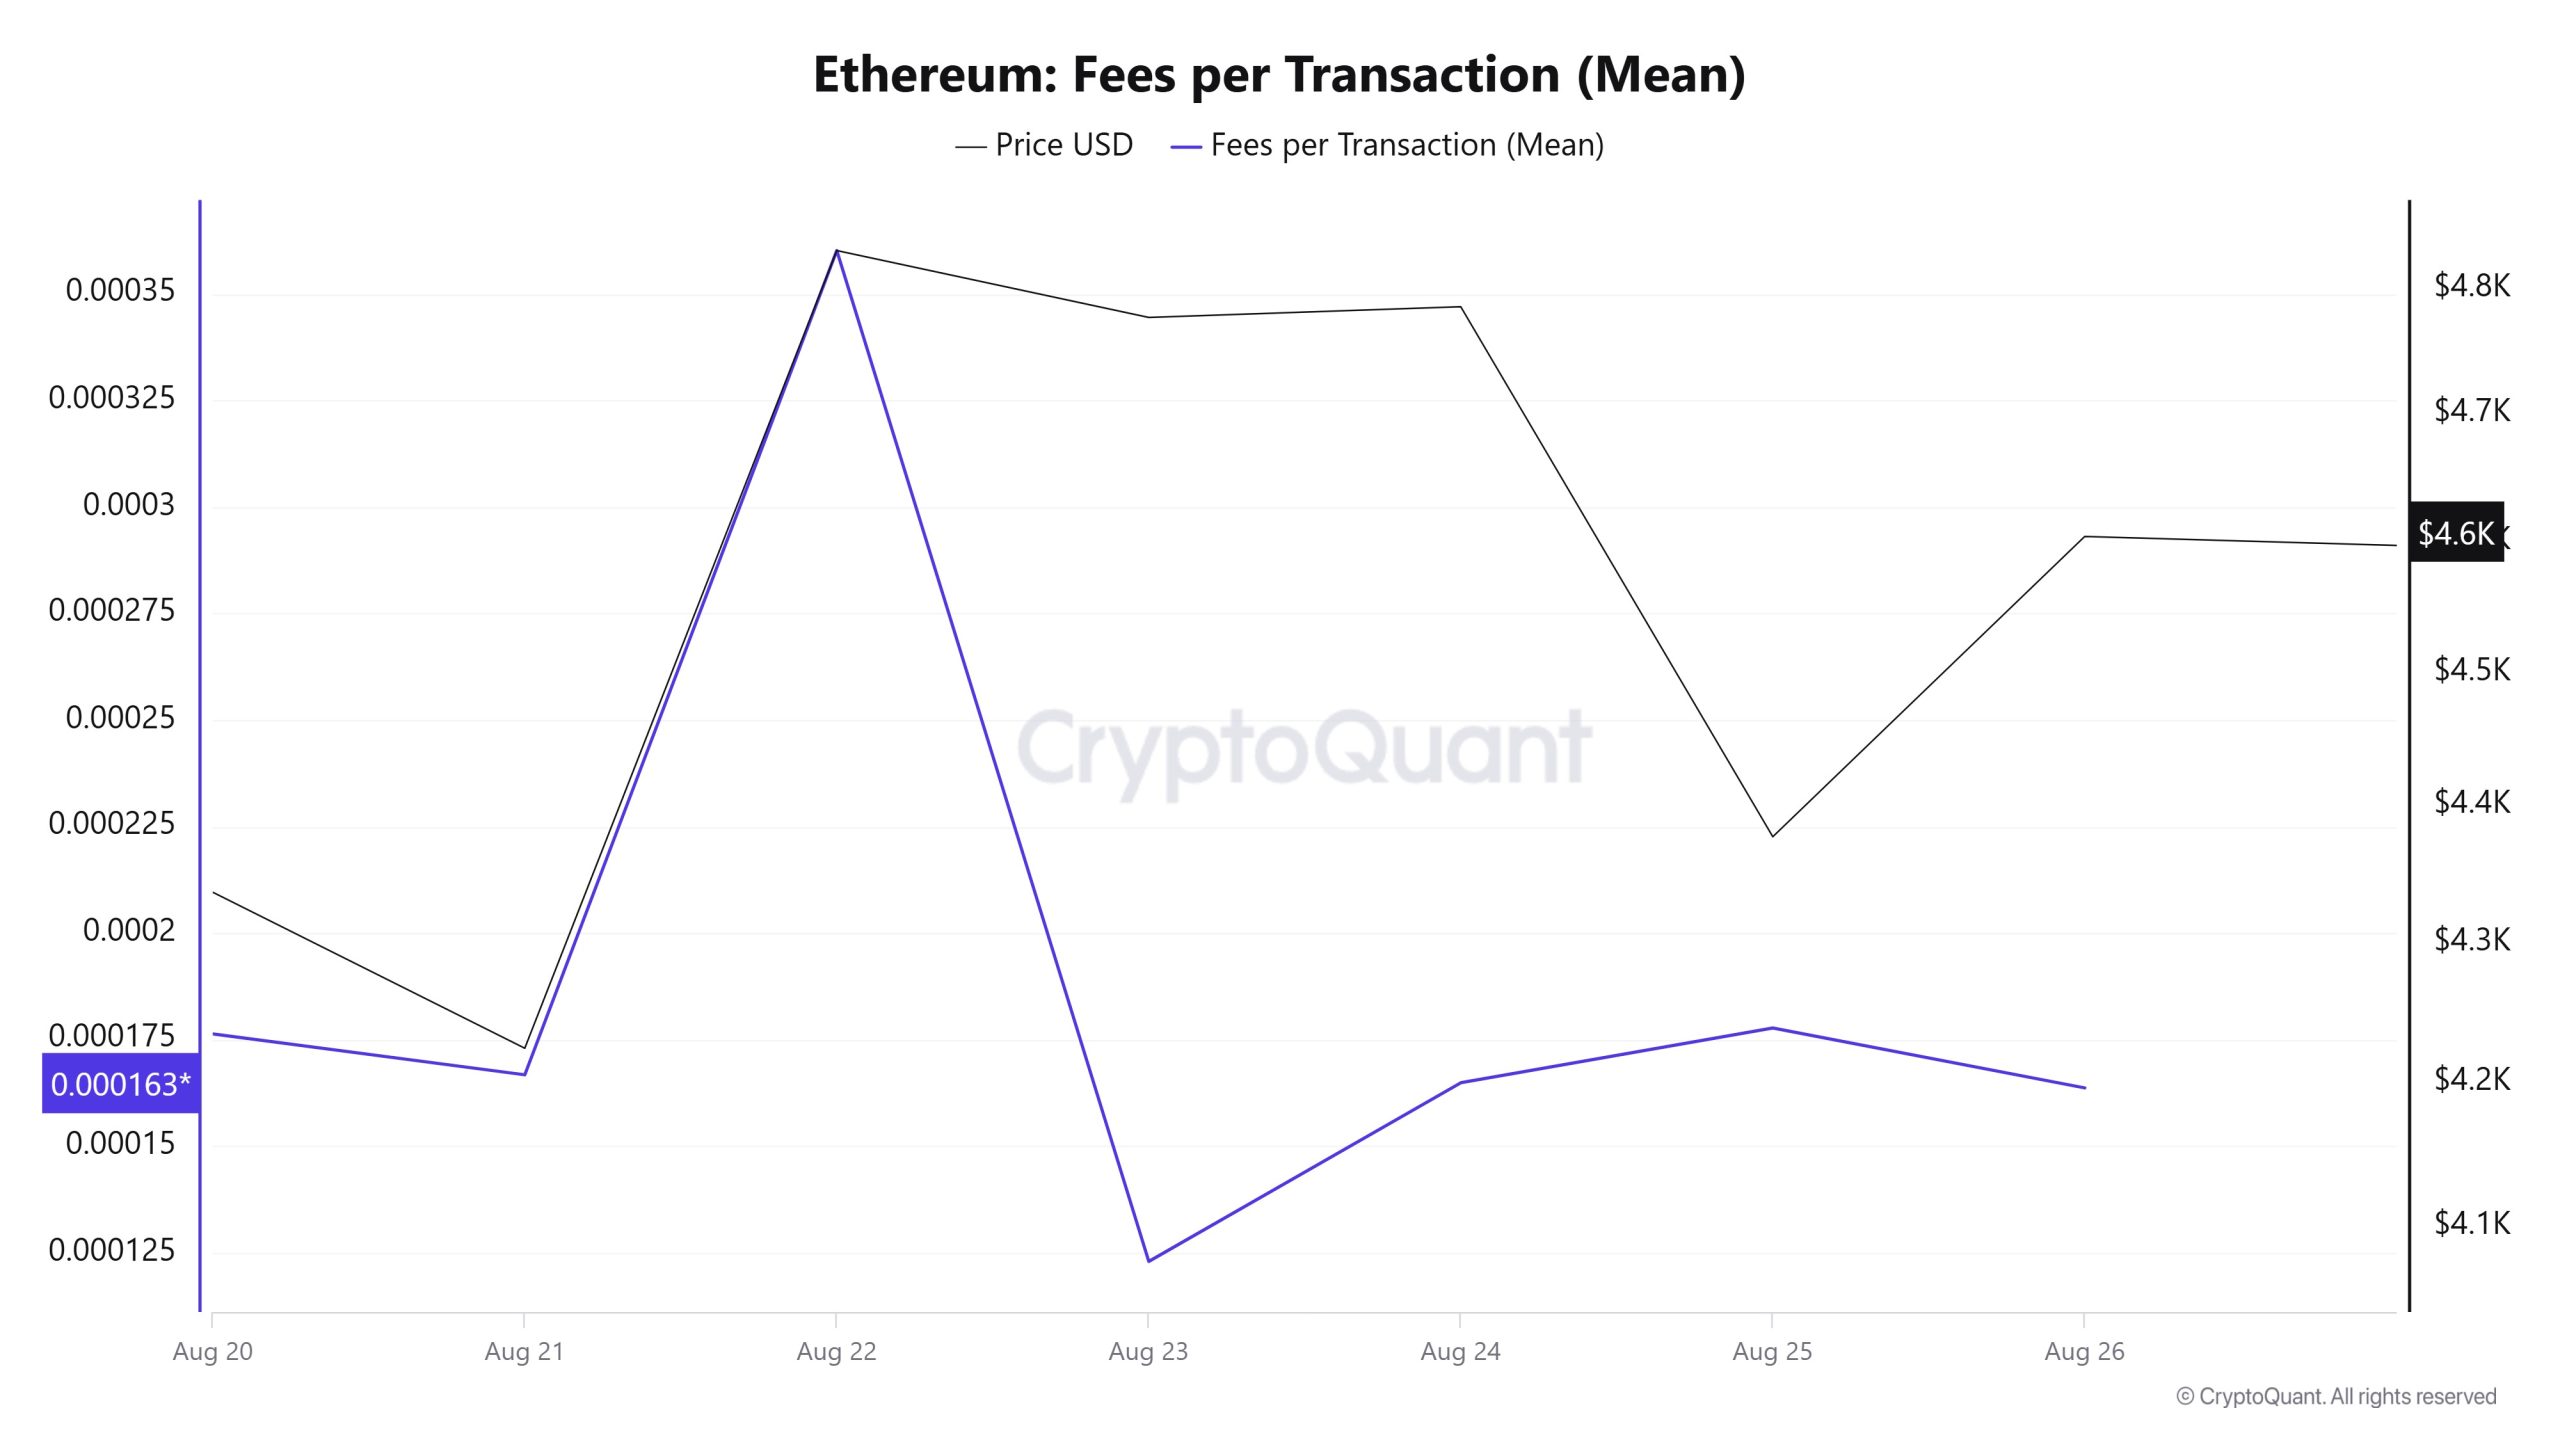
An analysis of Ethereum Fees per Transaction (Mean) data between August 20 and 26 shows that the indicator was at 0.000176343910437525 el August 20, the first day of the week.
As of August 22, the value en question, which reached its peak level, followed a fluctuating course due to the volatility en Ethereum price until this date. On August 23, it fell to 0.000122925002774104, recording the lowest value of the week.
In the following days, the Ethereum Fees per Transaction (Mean) indicator resumed its upward trend and closed at 0.00016365225632467 el August 26, the last day of the week.
Ethereum: Fees (Total)
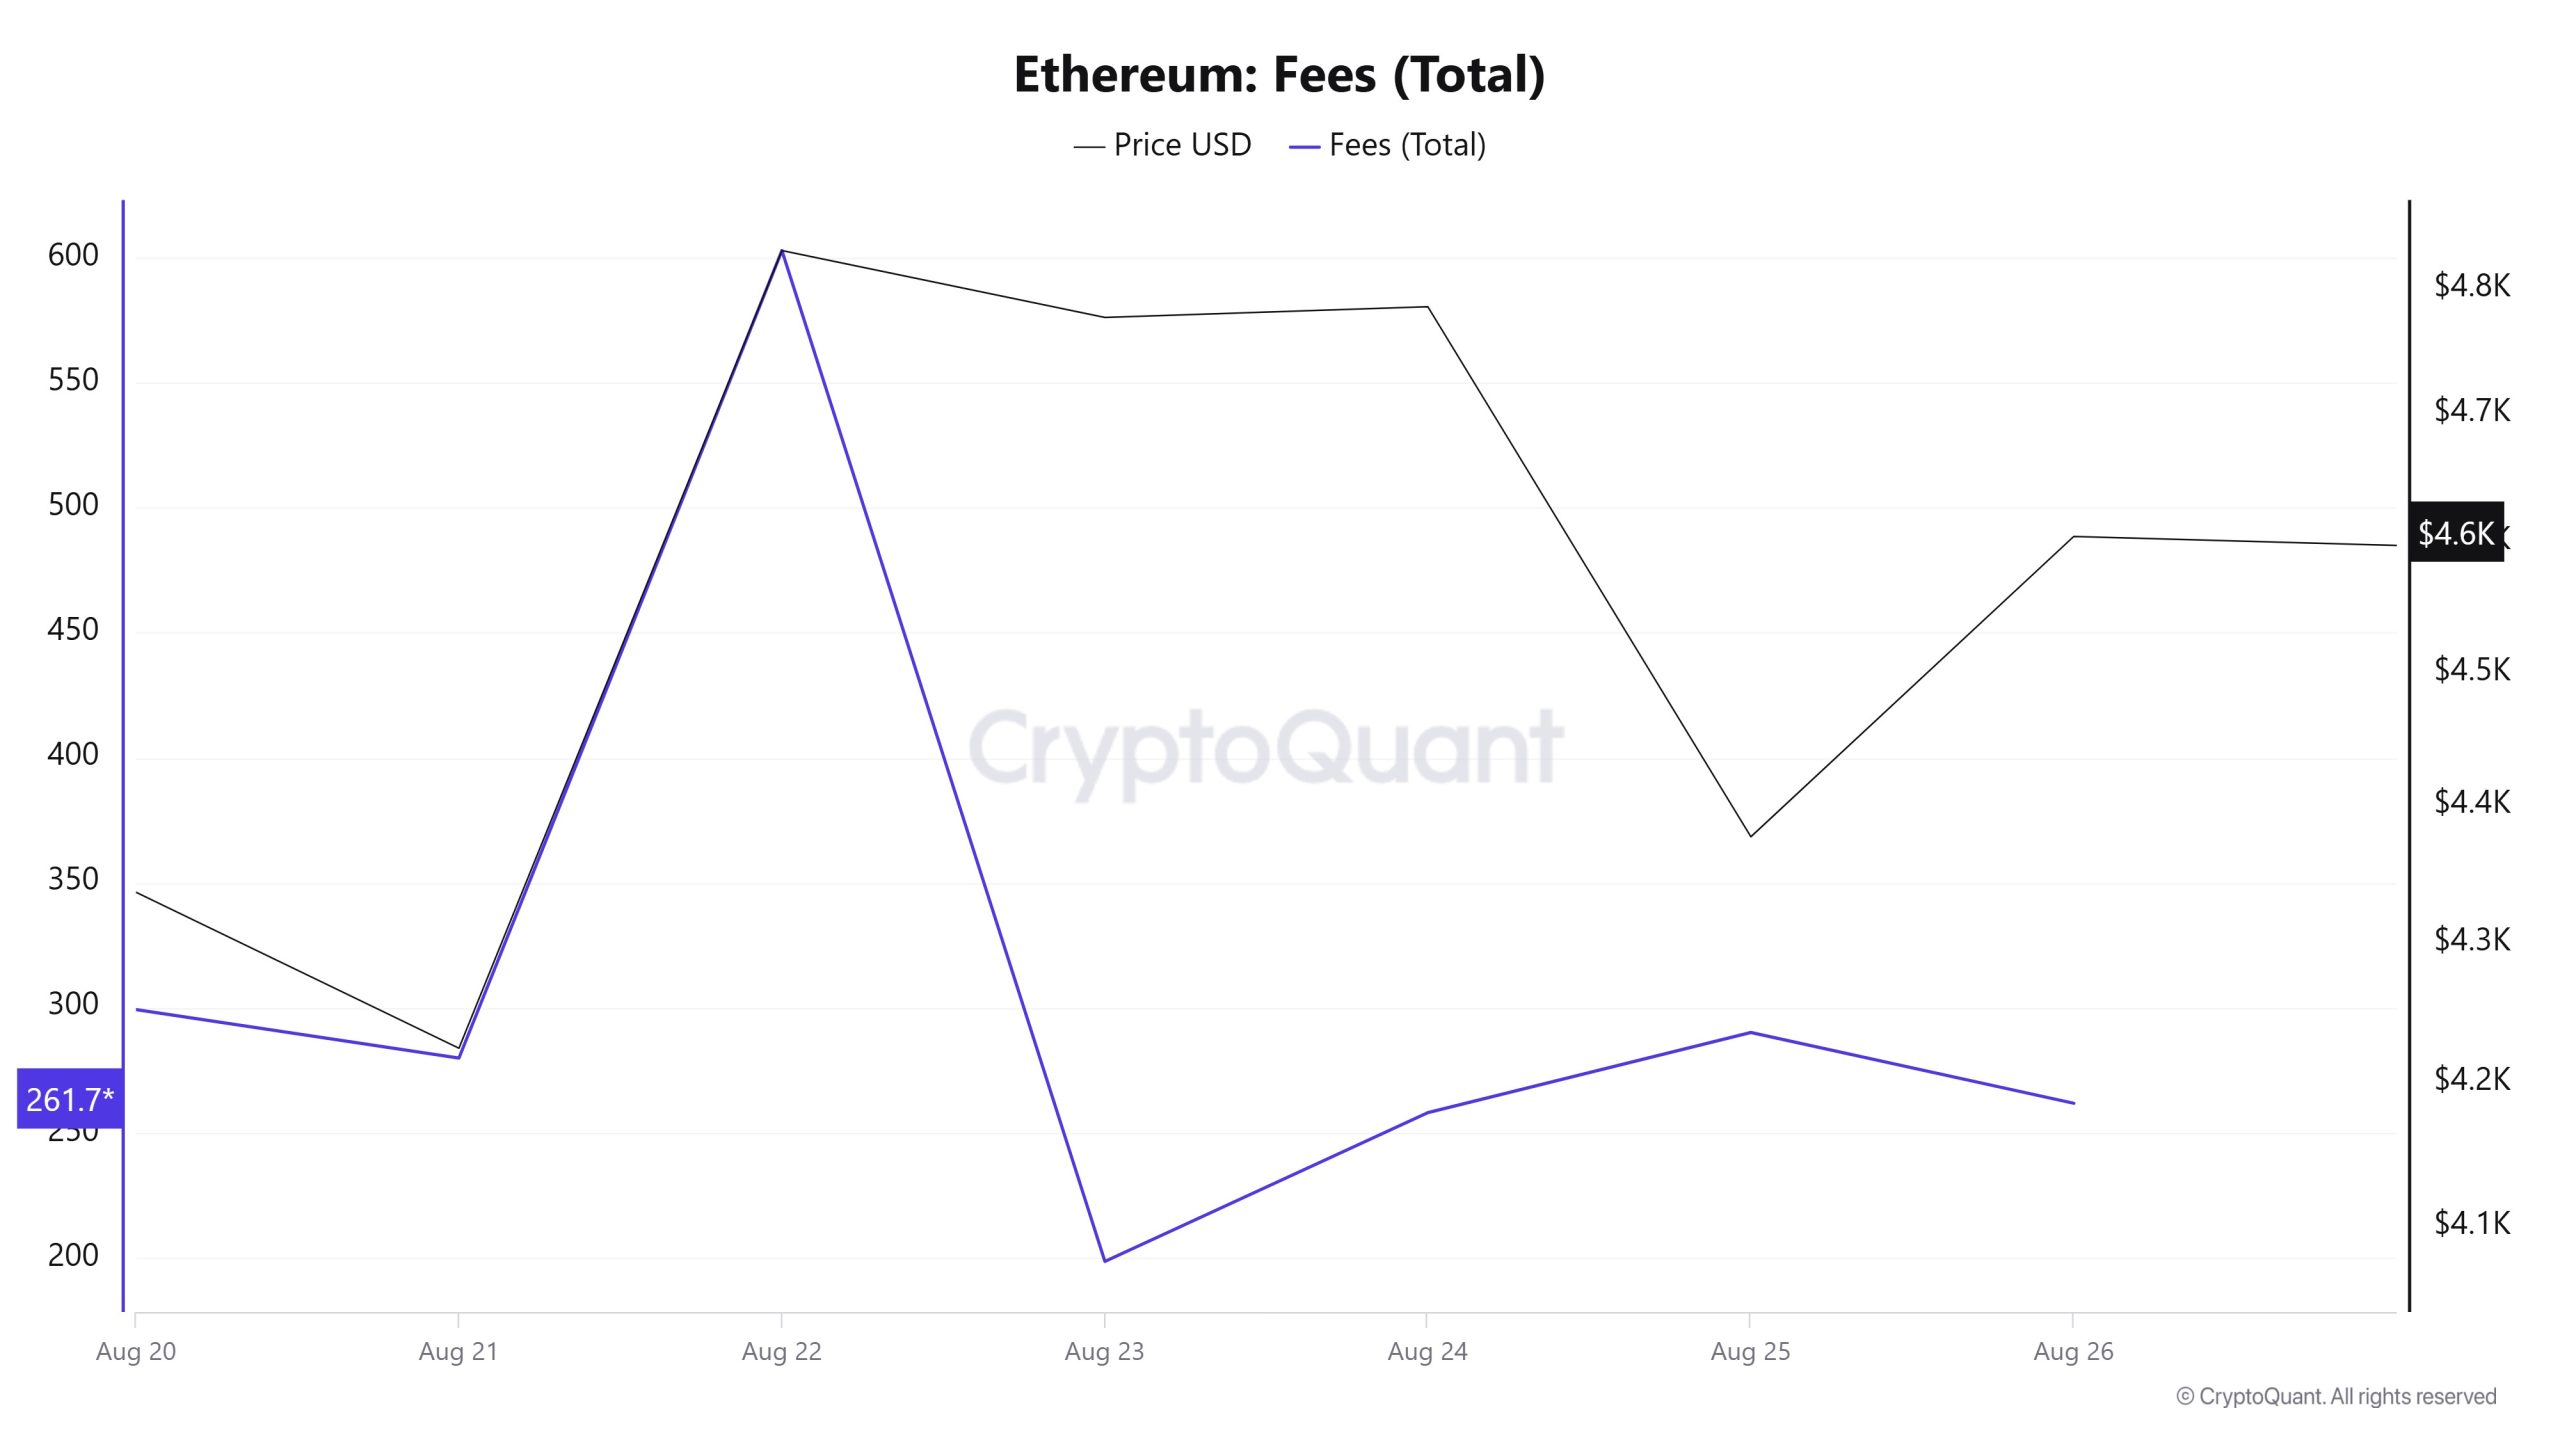
Similarly, an analysis of Ethereum Fees (Total) data between August 20 and August 26 shows that el August 20, the first day of the week, the indicator was at 581,0624356797118.
On August 22, the value peaked and fluctuated due to the volatility en the Ethereum price until this date. On August 23, it fell to 198.53346763039502, recording the lowest value of the week.
In the following days, the Ethereum Fees (Total) indicator resumed its upward trend and closed at 261.79025948391086 el August 26, the last day of the week.
Blocks Mined
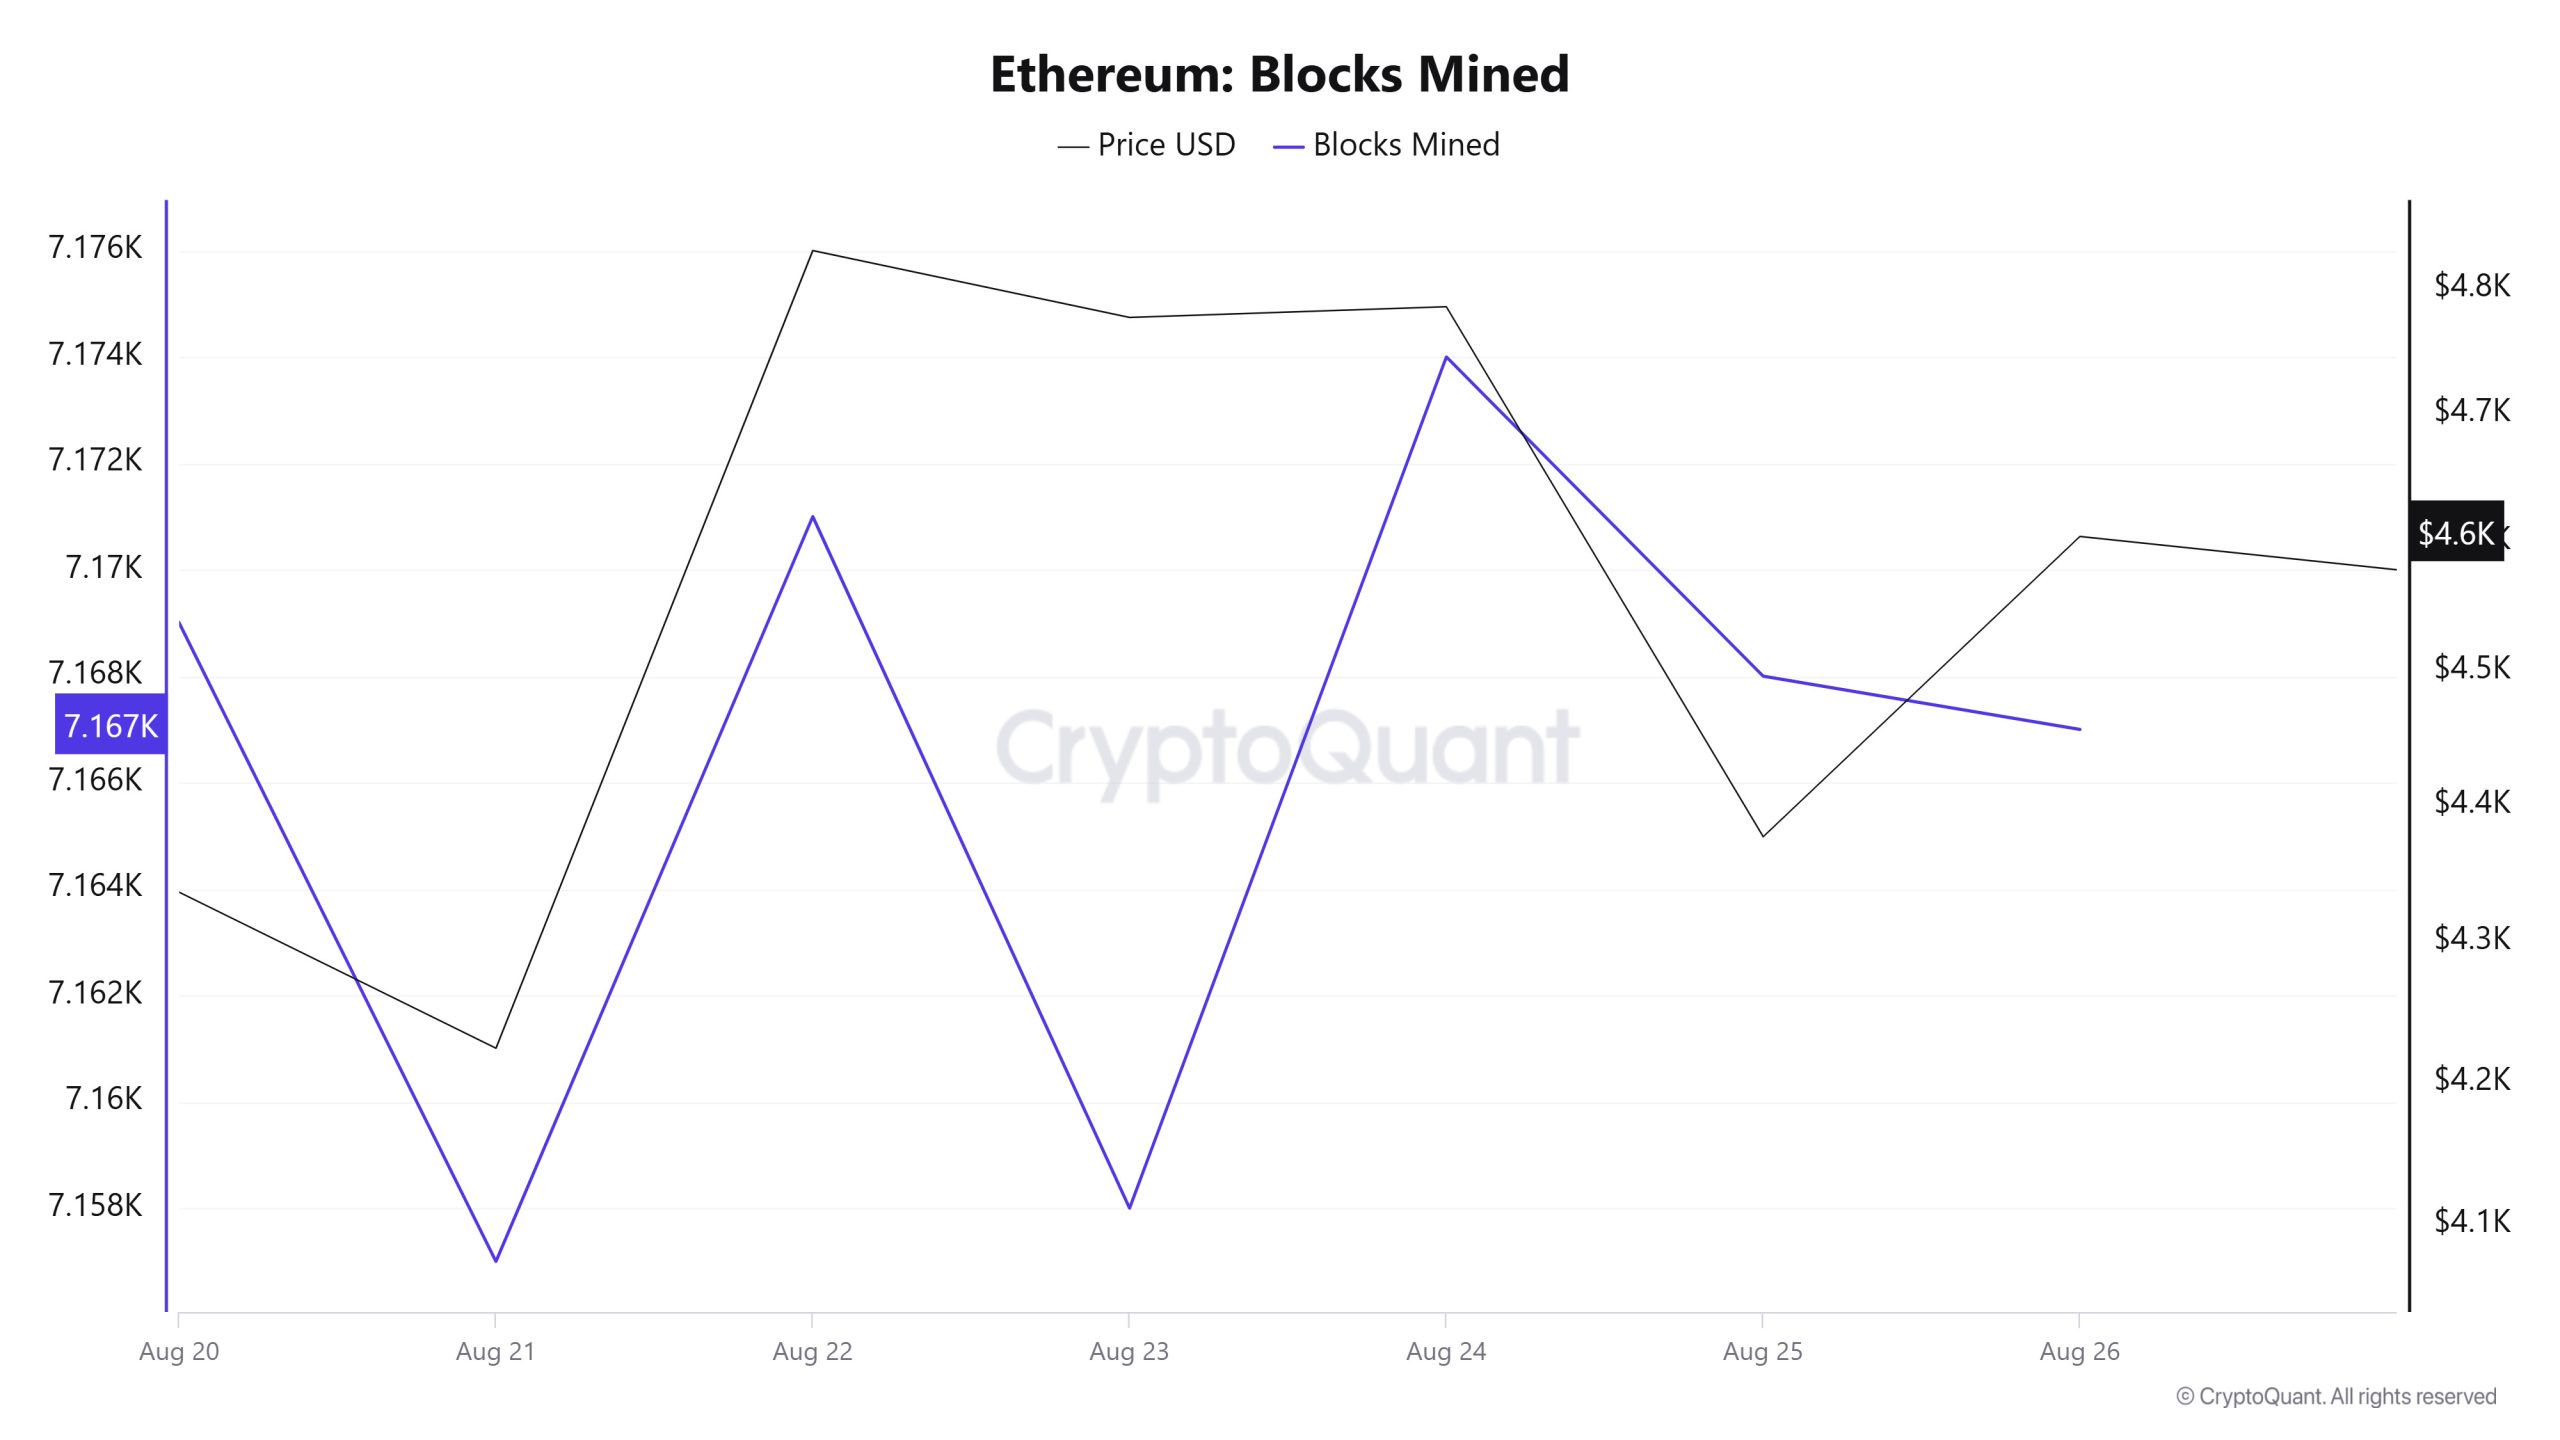
Between August 20 and August 26, Ethereum block production data showed a decline throughout the week. While 7,169 blocks were produced el August 20, this number decreased to 7,167 as of August 26.
There has been a positive correlation between the Ethereum price and the number of block production throughout the week.
Block Size
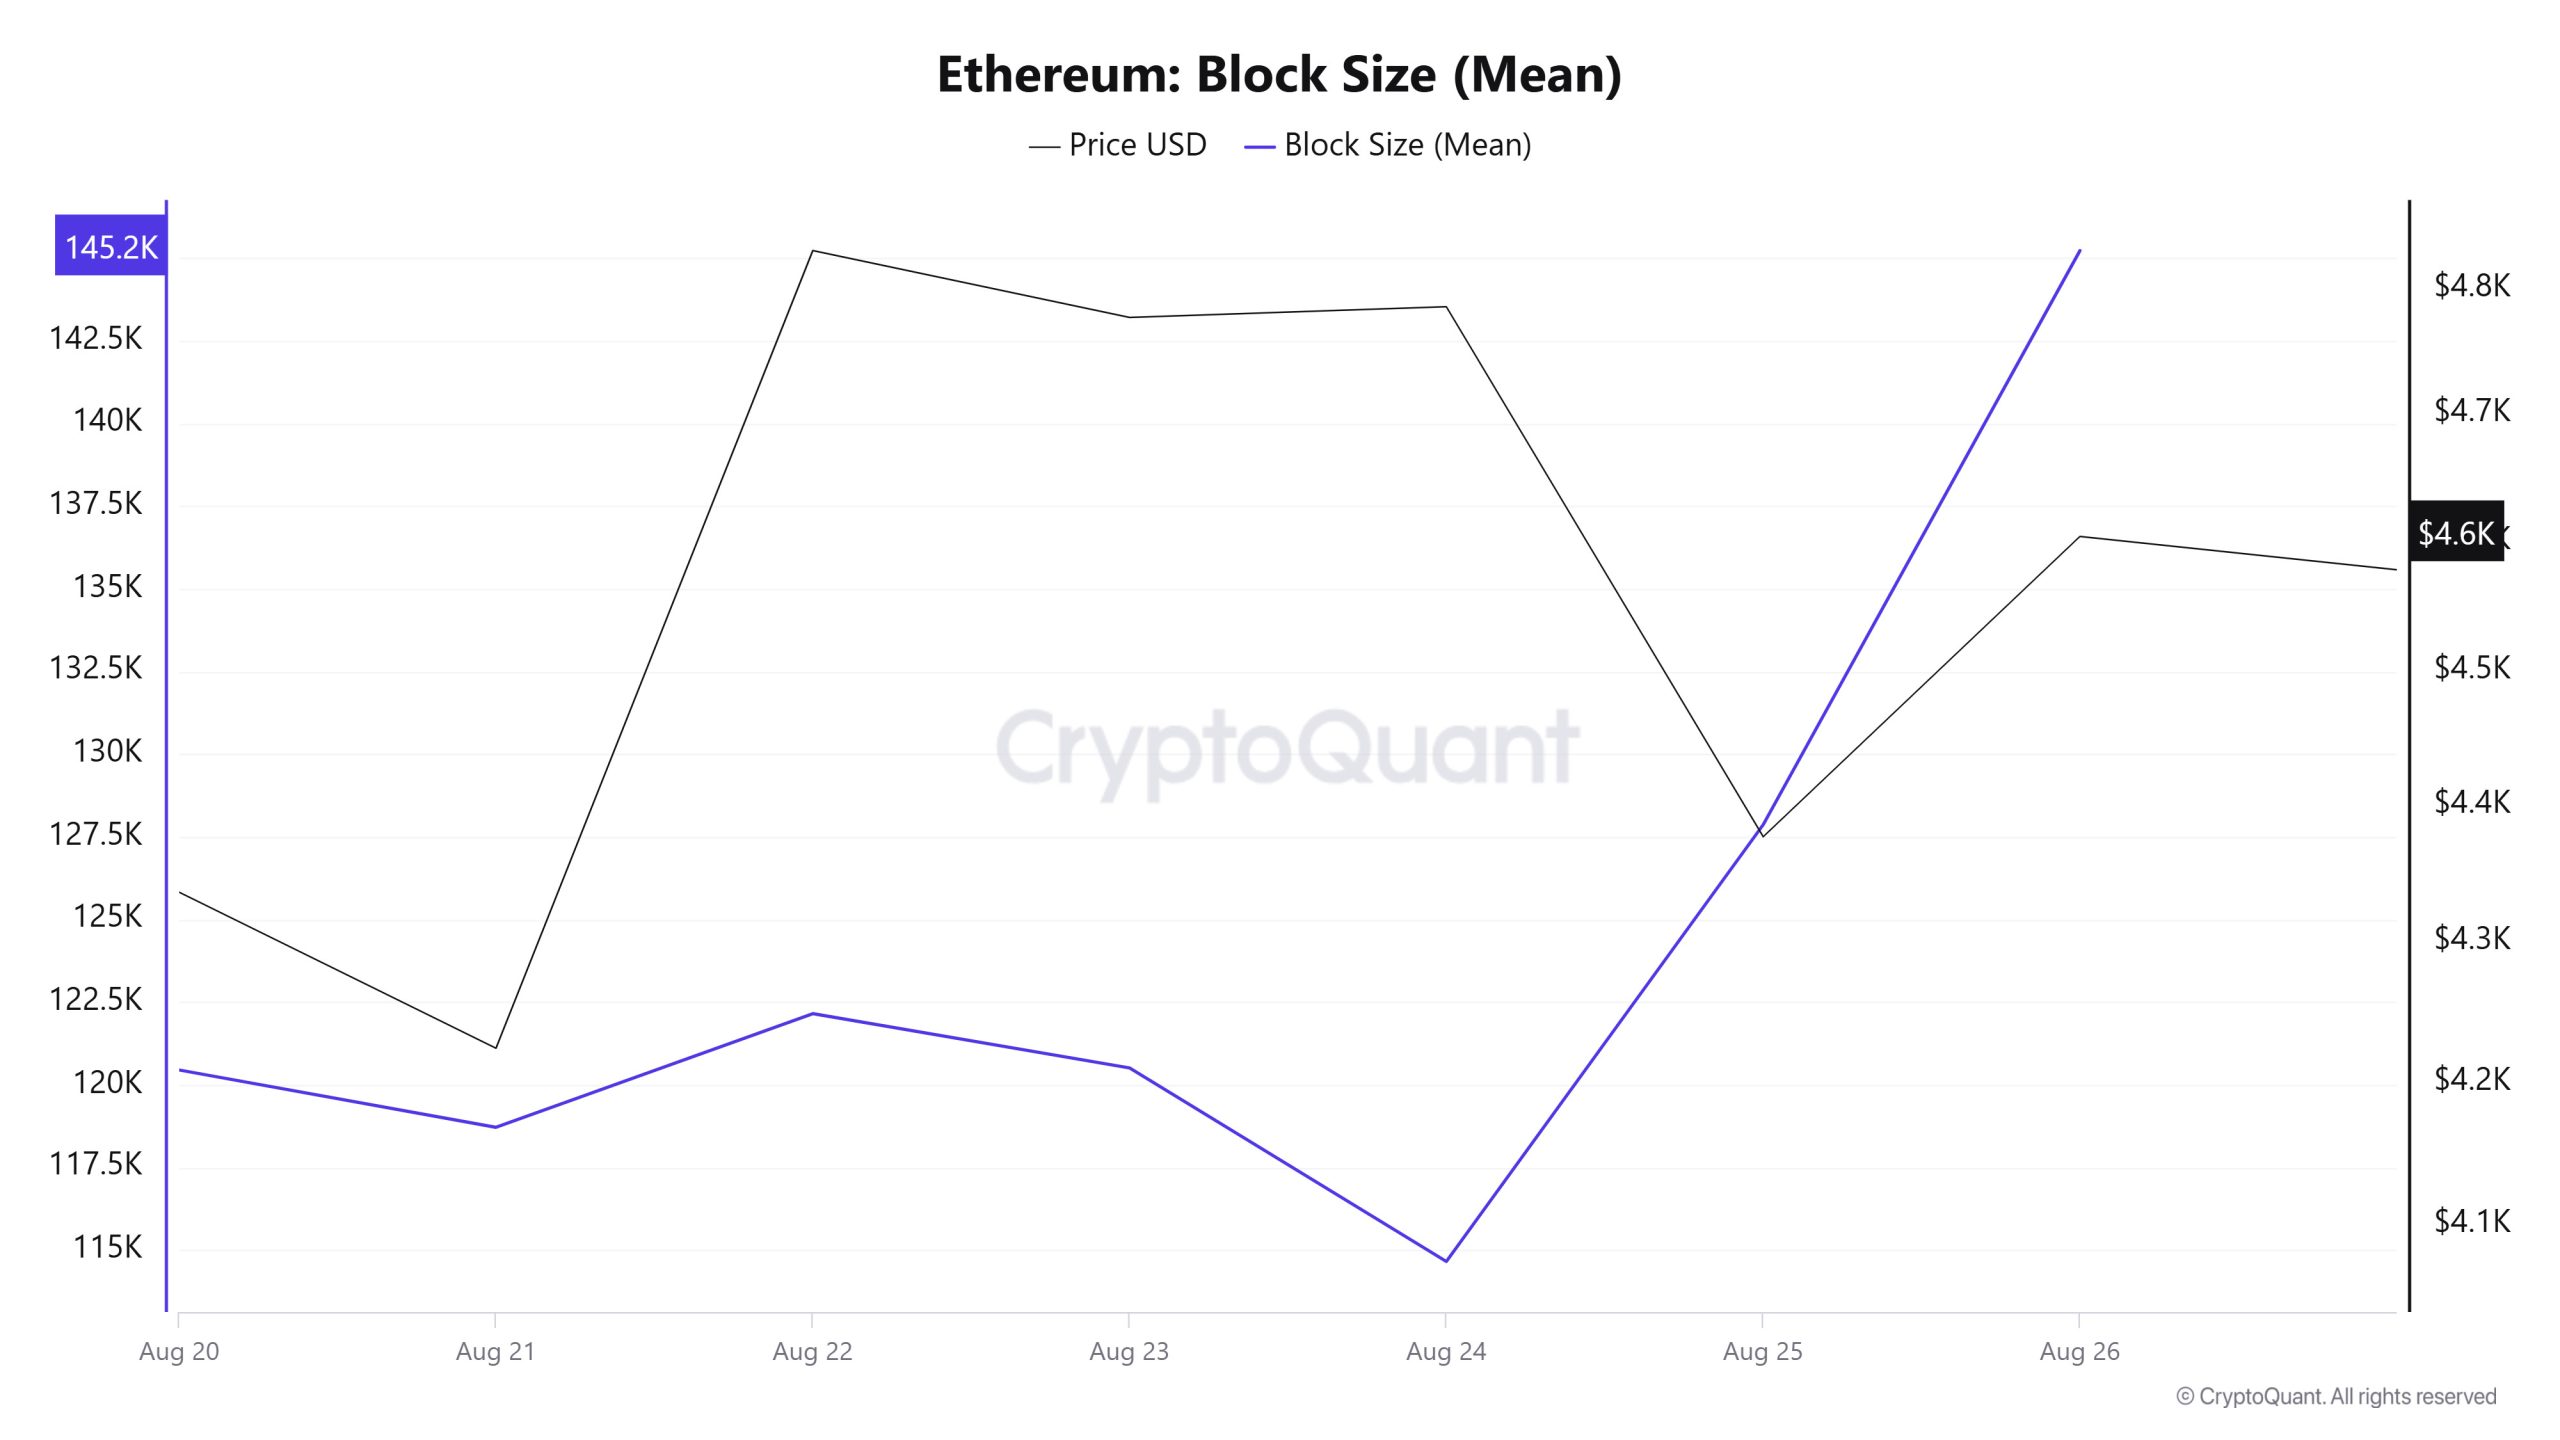
When the Ethereum block size data between August 20 and August 26 is analyzed, it is observed that there has been a significant increase throughout the week. While el August 20, the average block size was 120,453 bytes, this value increased to 145,230 bytes as of August 26.
In the relevant period, a positive correlation was observed between block size and Ethereum price throughout the week.
Block Interval
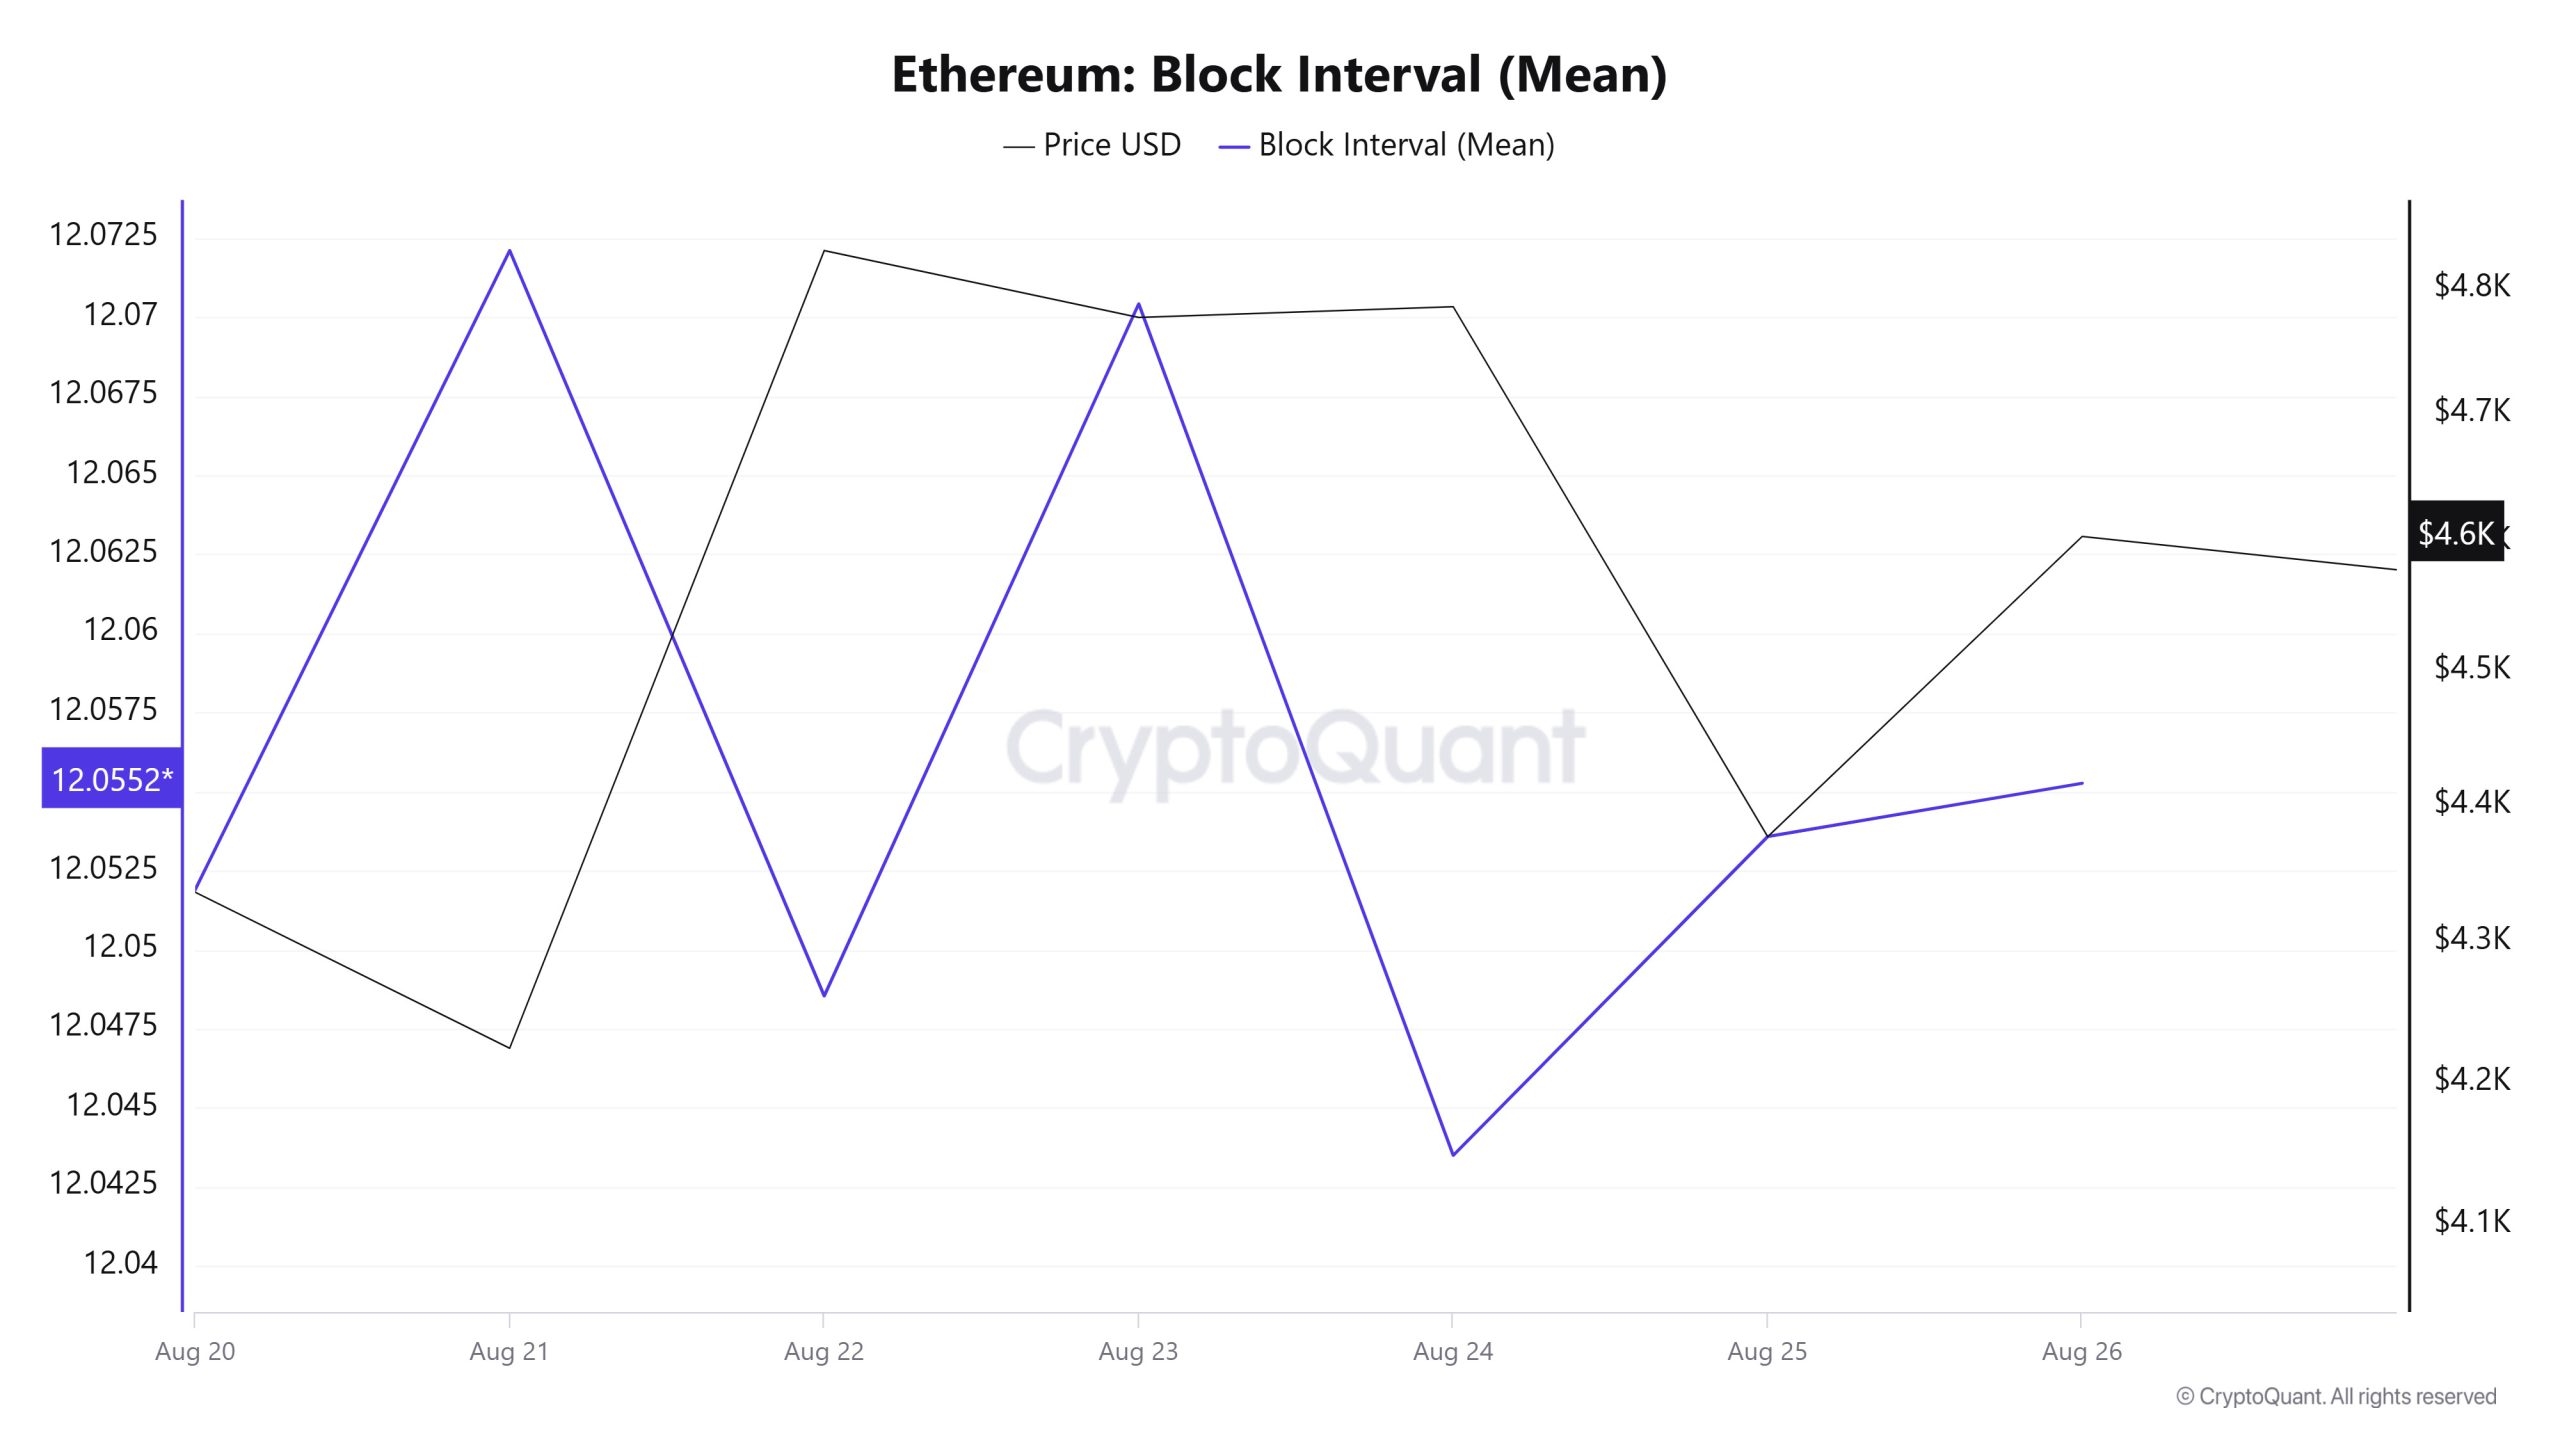
When the Ethereum block data between August 20 and August 26 is analyzed, there has been some increase throughout the week. On August 20, the average block duration was recorded as 12,051 segundos, while it increased to 12,055 segundos as of August 26.
During the period en question, Ethereum block duration and price movement were negatively correlated throughout the week.
Transaction
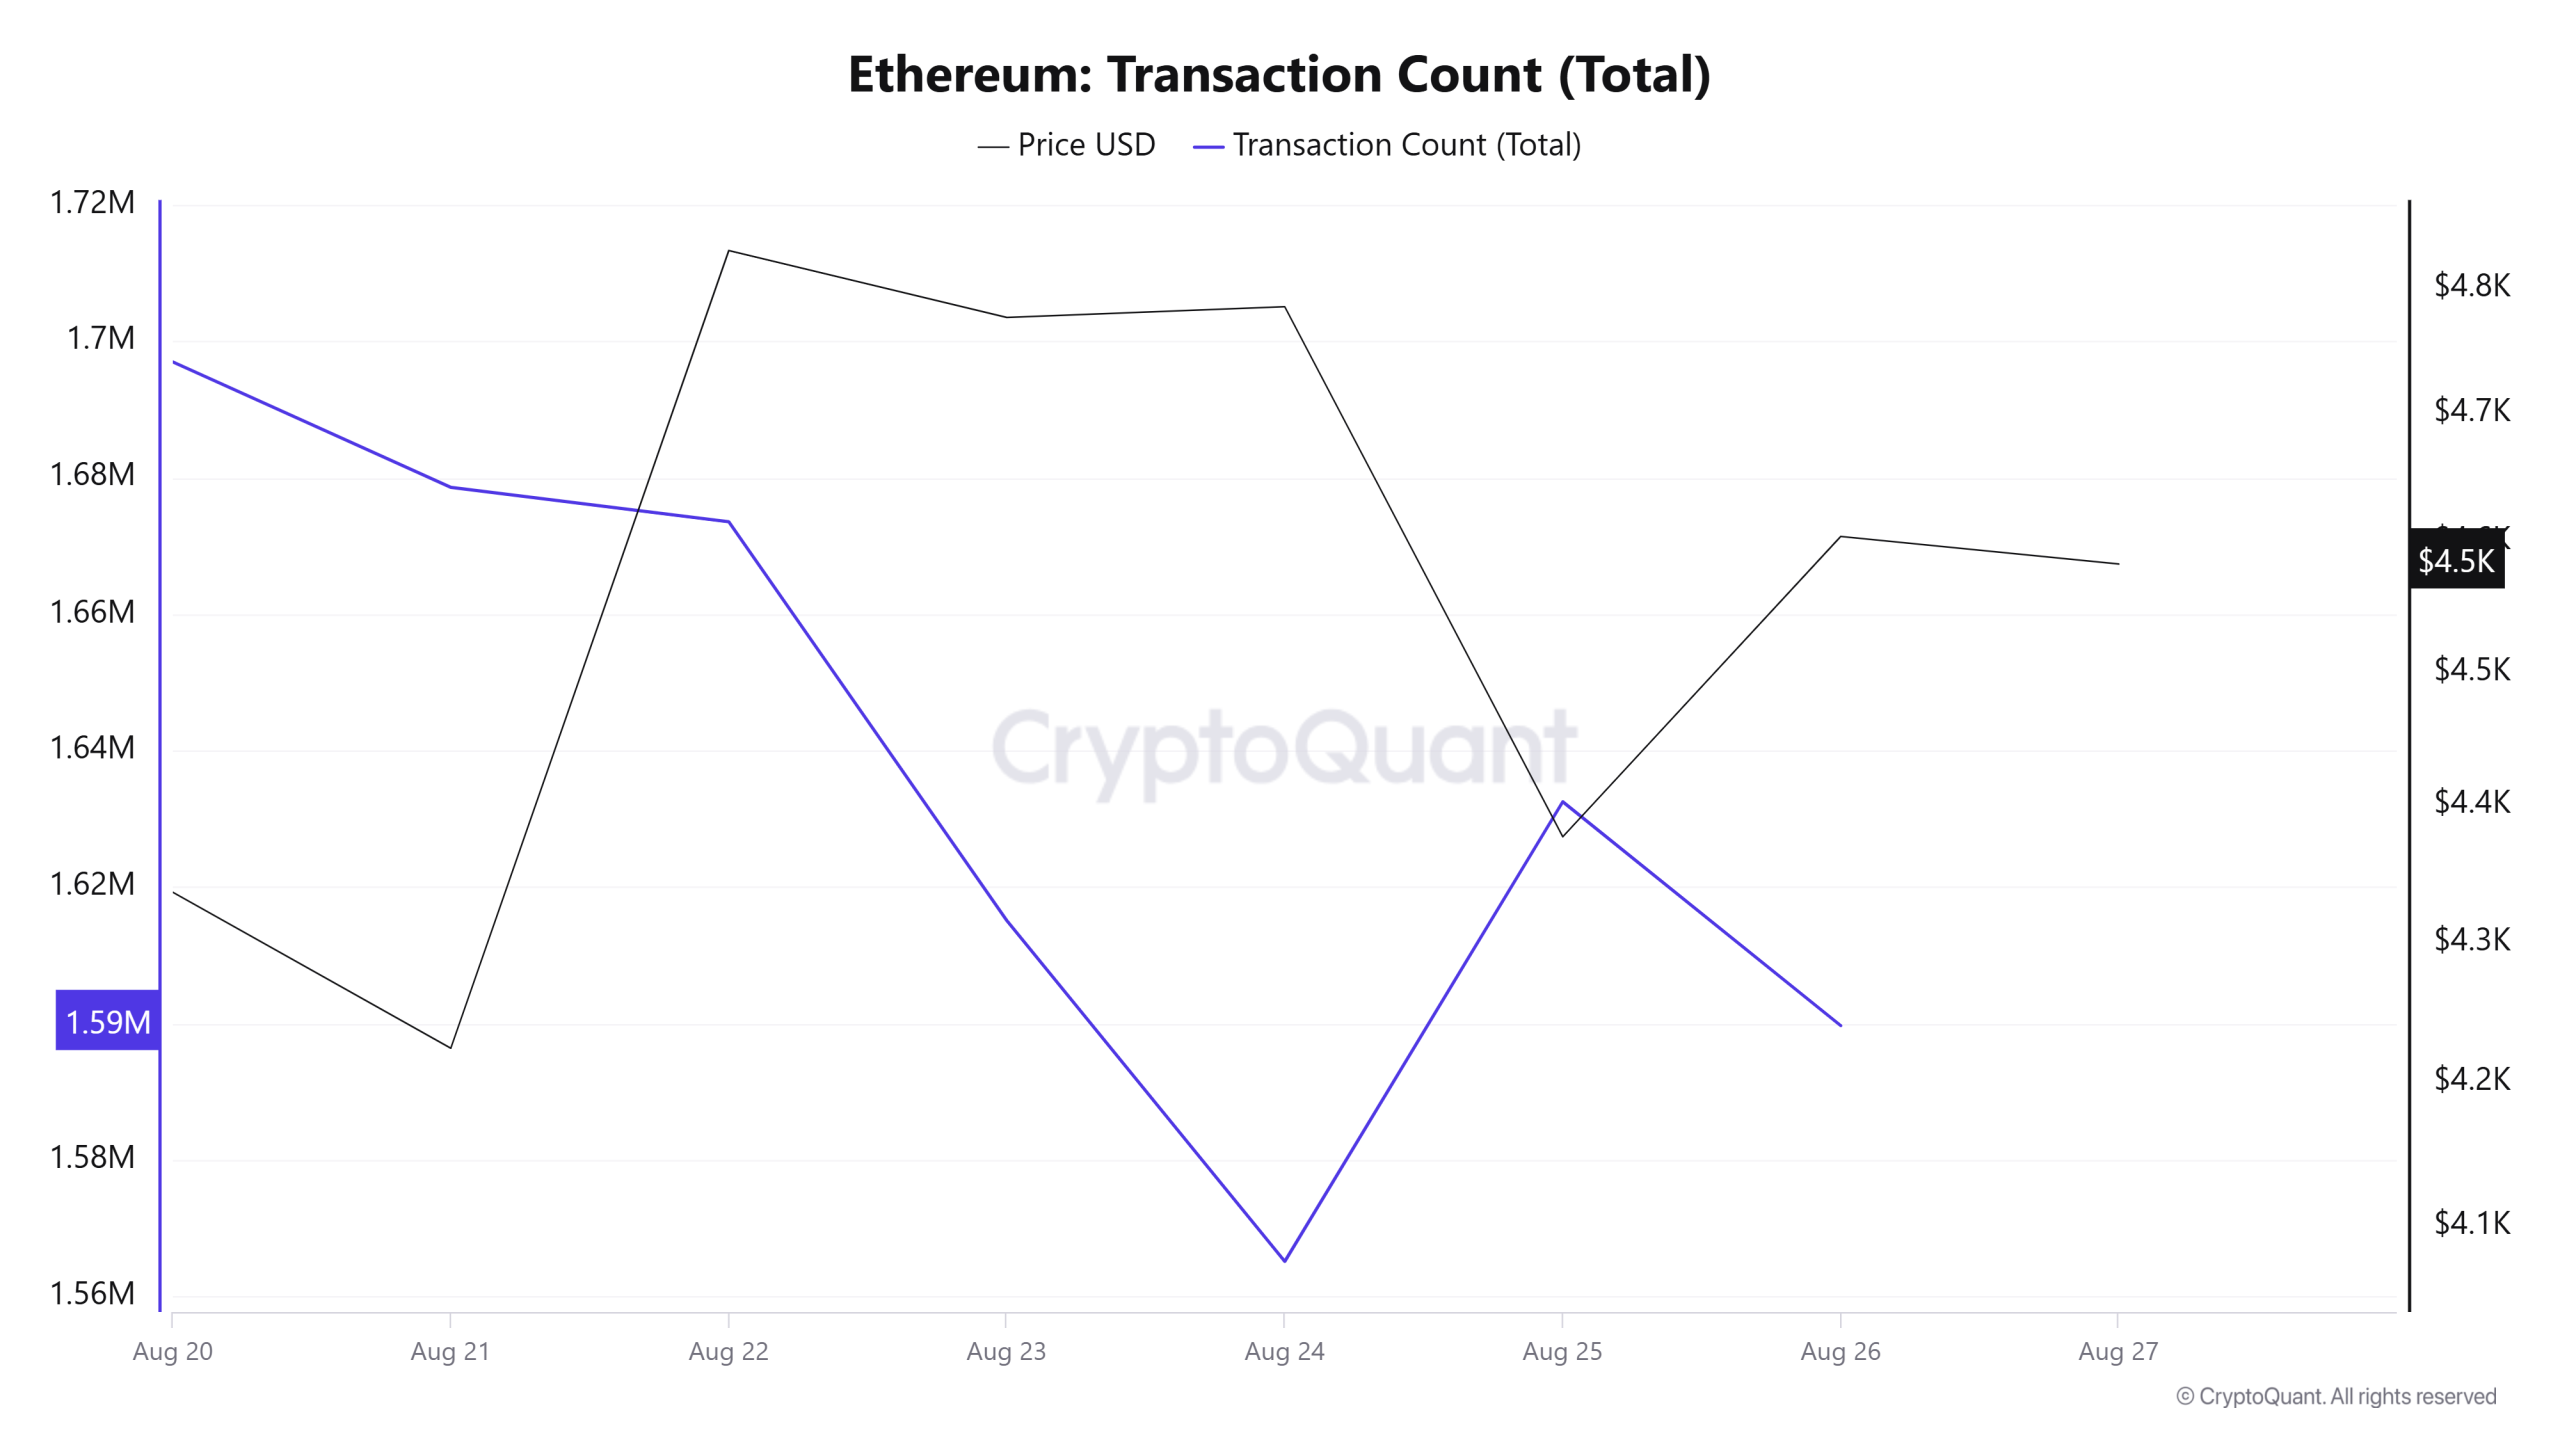
While a total of 11,763,253 transactions were made el the Ethereum network last week, it decreased por about 2.56% to 11,461,470 this week. The highest number of transactions el a weekly basis was 1,696,970 el August 20, while the lowest value was recorded as 1,565,111 el August 24. The correlation between the price and the number of transactions was negatively weighted. Although the number of transactions decreased compared to last week, Ethereum’s all-time average transaction count is still quite high. With high transaction volumes, Ethereum burns continue to remain strong, providing additional impetus for the network. Therefore, it seems more likely that the decline en the number of transactions is a temporary fluctuation rather than a large and permanent trend. It should be noted that this fluctuation may continue for a short period of time.
Tokens Transferred
The fact that the total amount of ETH transferred between last week and this week remained almost exactly the same (20,928,450 → 20,927,981) indicates that a steady and stable trend en the network’s usage intensity has begun to form. In particular, the sharp fluctuations observed en previous periods have been replaced por a more horizontal and predictable activity structure. Looking at the weekday distribution,
On August 25, a weekly high of 3,638,760 ETH was reached, indicating that the network can quickly absorb trading volume during periods of high volatility. On August 21, the low was 2,286,364 ETH, indicating that volatility is still evident el a daily basis. The fact that the relationship between price and transfer volume is more positively correlated this week can be interpreted as a sign that large transfers are supporting the price. In other words, heavy token movement el the network was mostly en line with upward price action. Horizontal stability is predominant en the network, but continued sharp daily ups and downs suggest that short-term volatility en prices will continue.
Estimated Leverage Ratio
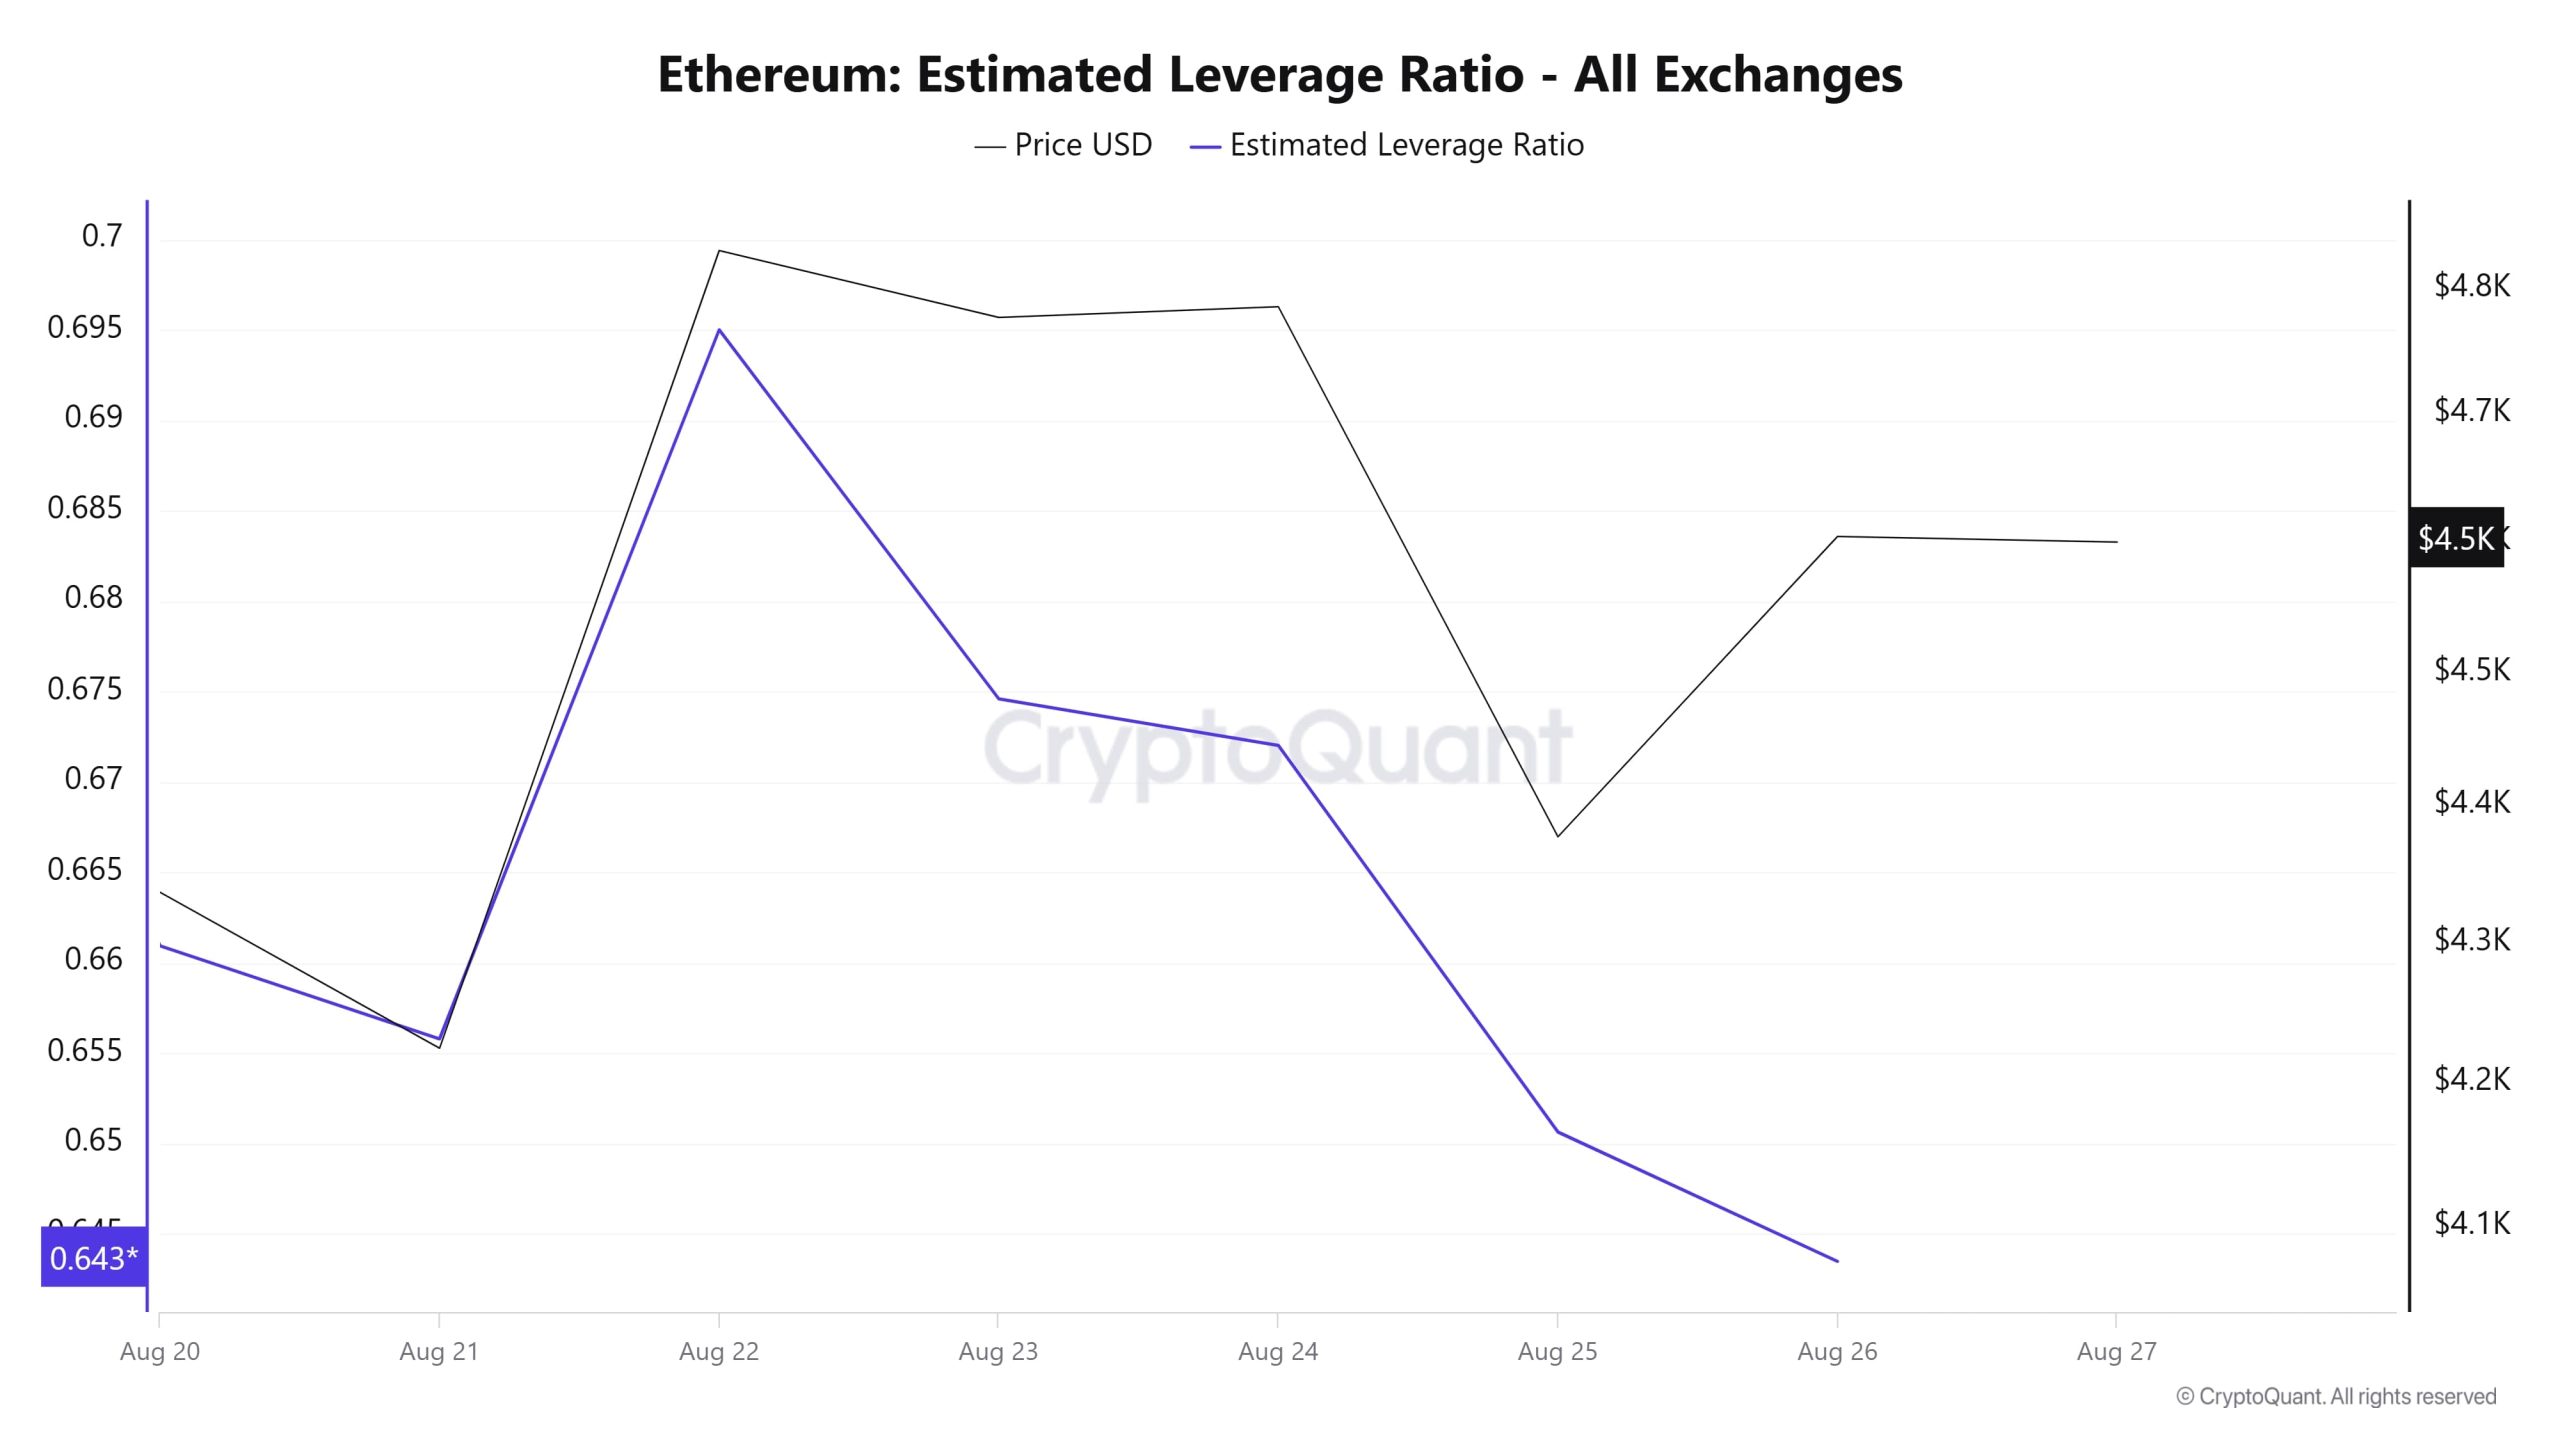
In the 7-day period, the metric increased en the first days of the process but generally decreased during the rest of the period. ELR (Estimated Leverage Ratio), which had a value of 0.660 at the beginning of the process, rose until August 22 and formed the peak of the process. Since then, the metric has started to decline and has fallen to 0.643 at the time of writing and is at the lowest point of the process. A higher ELR means that participants are willing to take el more risk and generally indicates bullish conditions or expectations. It should be noted that these rises can also be caused por a decrease en reserves. When we look at Ethereum reserves, there were 18.51 million reserves at the beginning of the process, while this figure generally decreased during the rest of the process and is currently seen as 17.96 million. At the same time, Ethereum’s Open Interest is seen as 59.77 billion dollars at the beginning of the process. As of now, the volume increased en the process and the open interest value stood out as 62.74 billion dollars. With all this data, the ELR metric decreased for most of the process. The price of the asset was valued between $4,100 and $4,900 with all this data. Although the risk appetite of investors and traders continues to decrease, this is not reflected en the price. While the increase en open interest data and the decrease en reserves, which appear throughout the process, should indicate an increase en the ELR ratio, the decrease en the ELR ratio shows us the manipulation formation. As a result, the decline en reserves and the slight increase en open interest show us that the ELR metric was manipulated and decreased. This shows us that the market is pessimistic and a decline may be coming.
ETH Onchain Overall
| Metric | Positive 📈 | Negative 📉 | Neutral ➖ |
|---|---|---|---|
| Active Addresses | ✓ | ||
| Total Value Staked | ✓ | ||
| Derivatives | ✓ | ||
| Supply Distribution | ✓ | ||
| Exchange Supply Ratio | ✓ | ||
| Fees and Revenues | ✓ | ||
| Blocks Mined | ✓ | ||
| Transactions | ✓ | ||
| Estimated Leverage Ratio | ✓ |
*The metrics and guidance en the table do not, por themselves, describe or imply an expectation of future price changes for any asset. The prices of digital assets may vary depending el many different variables. The onchain analysis and related guidance are intended to assist investors en their decision-making process, and making financial investments based solely el the results of this analysis may result en harmful transactions. Even if all metrics produce a positive, negative or neutral result at the same time, the expected results may not be seen according to market conditions. Investors reviewing the report would be well advised to heed these caveats.
Legal Notice
The investment information, comments and recommendations contained en this document do not constitute investment advisory services. Investment advisory services are provided por authorized institutions el a personal basis, taking into account the risk and return preferences of individuals. The comments and recommendations contained en this document are of a general type. These recommendations may not be suitable for your financial situation and risk and return preferences. Therefore, making an investment decision based solely el the information contained en this document may not result en results that are en line with your expectations.
NOTE: All data used en Ethereum onchain analysis is based el Cryptoqaunt.