Weekly Ethereum Onchain Report
Active Addresses
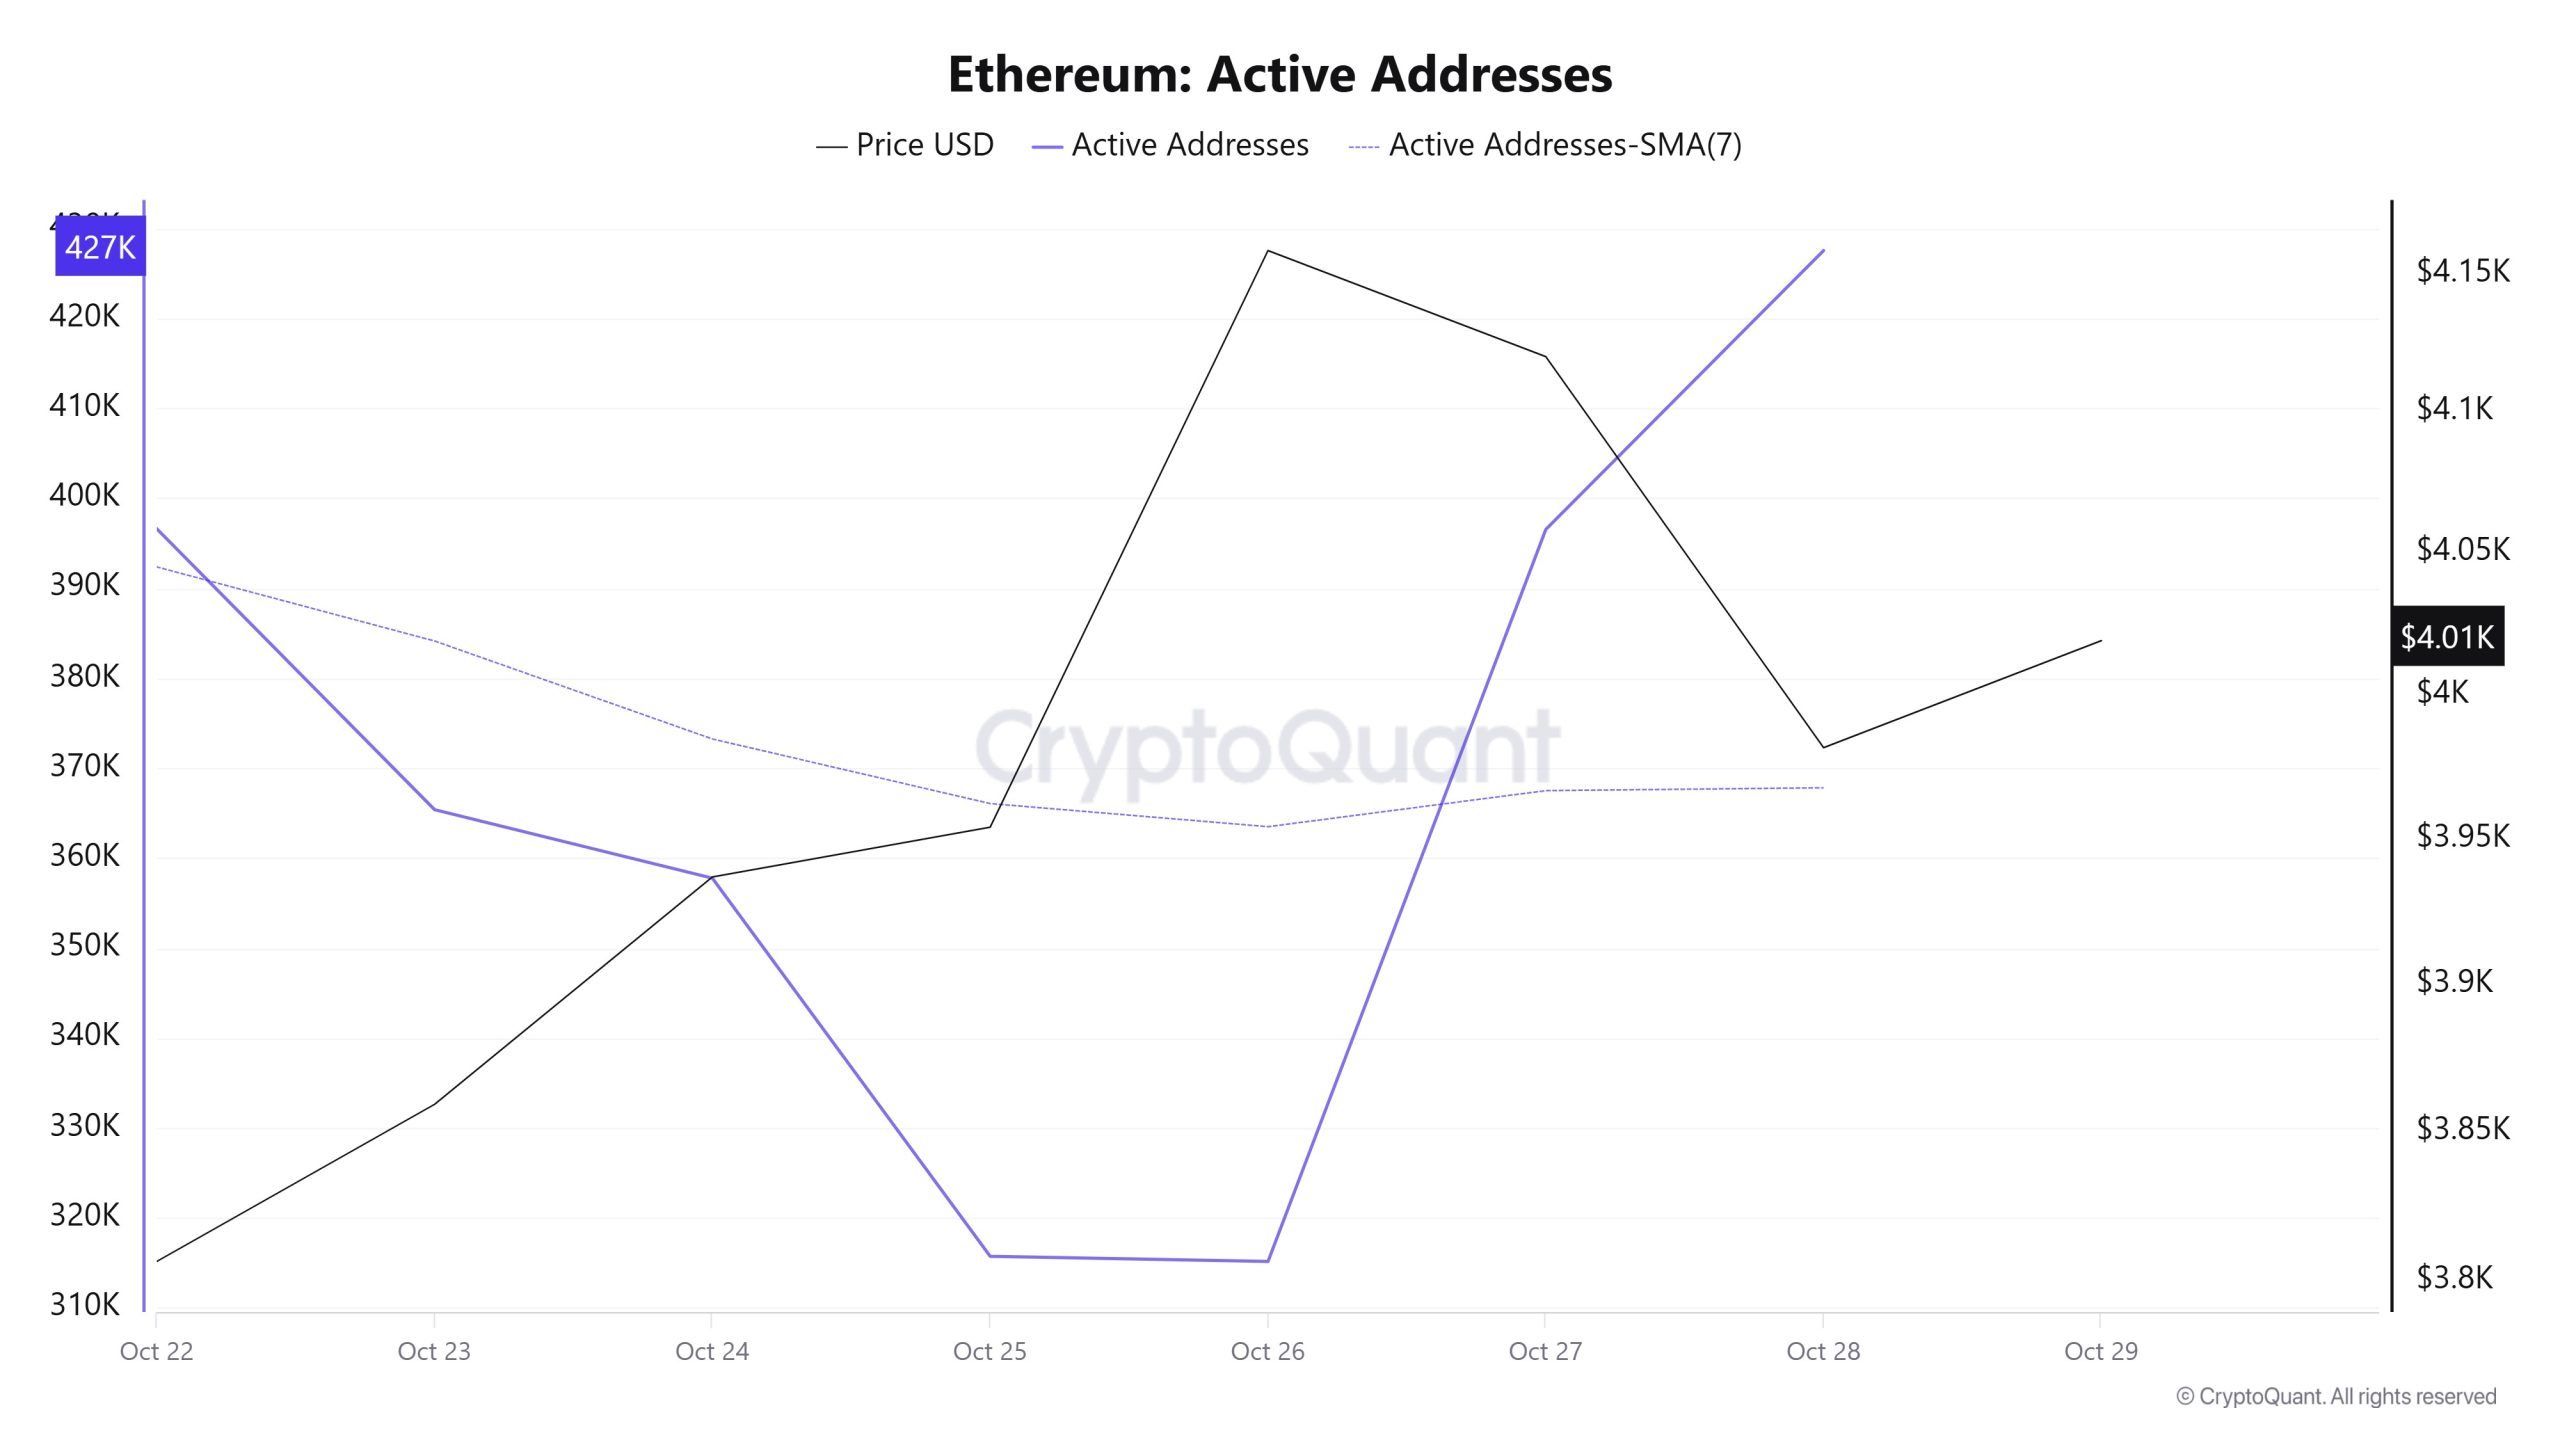
Between October 22 and October 29, a total of 427,536 active addresses were added to the Ethereum network. During this period, the Ethereum price fell from $3,806 to $4,158. On October 24, en particular, when the price reached the active address point, the number of active addresses fell while the price rose. When examining the 7-day simple moving average (SMA), the Ethereum price is generally seen to be trending upward.
Active Sending Addresses
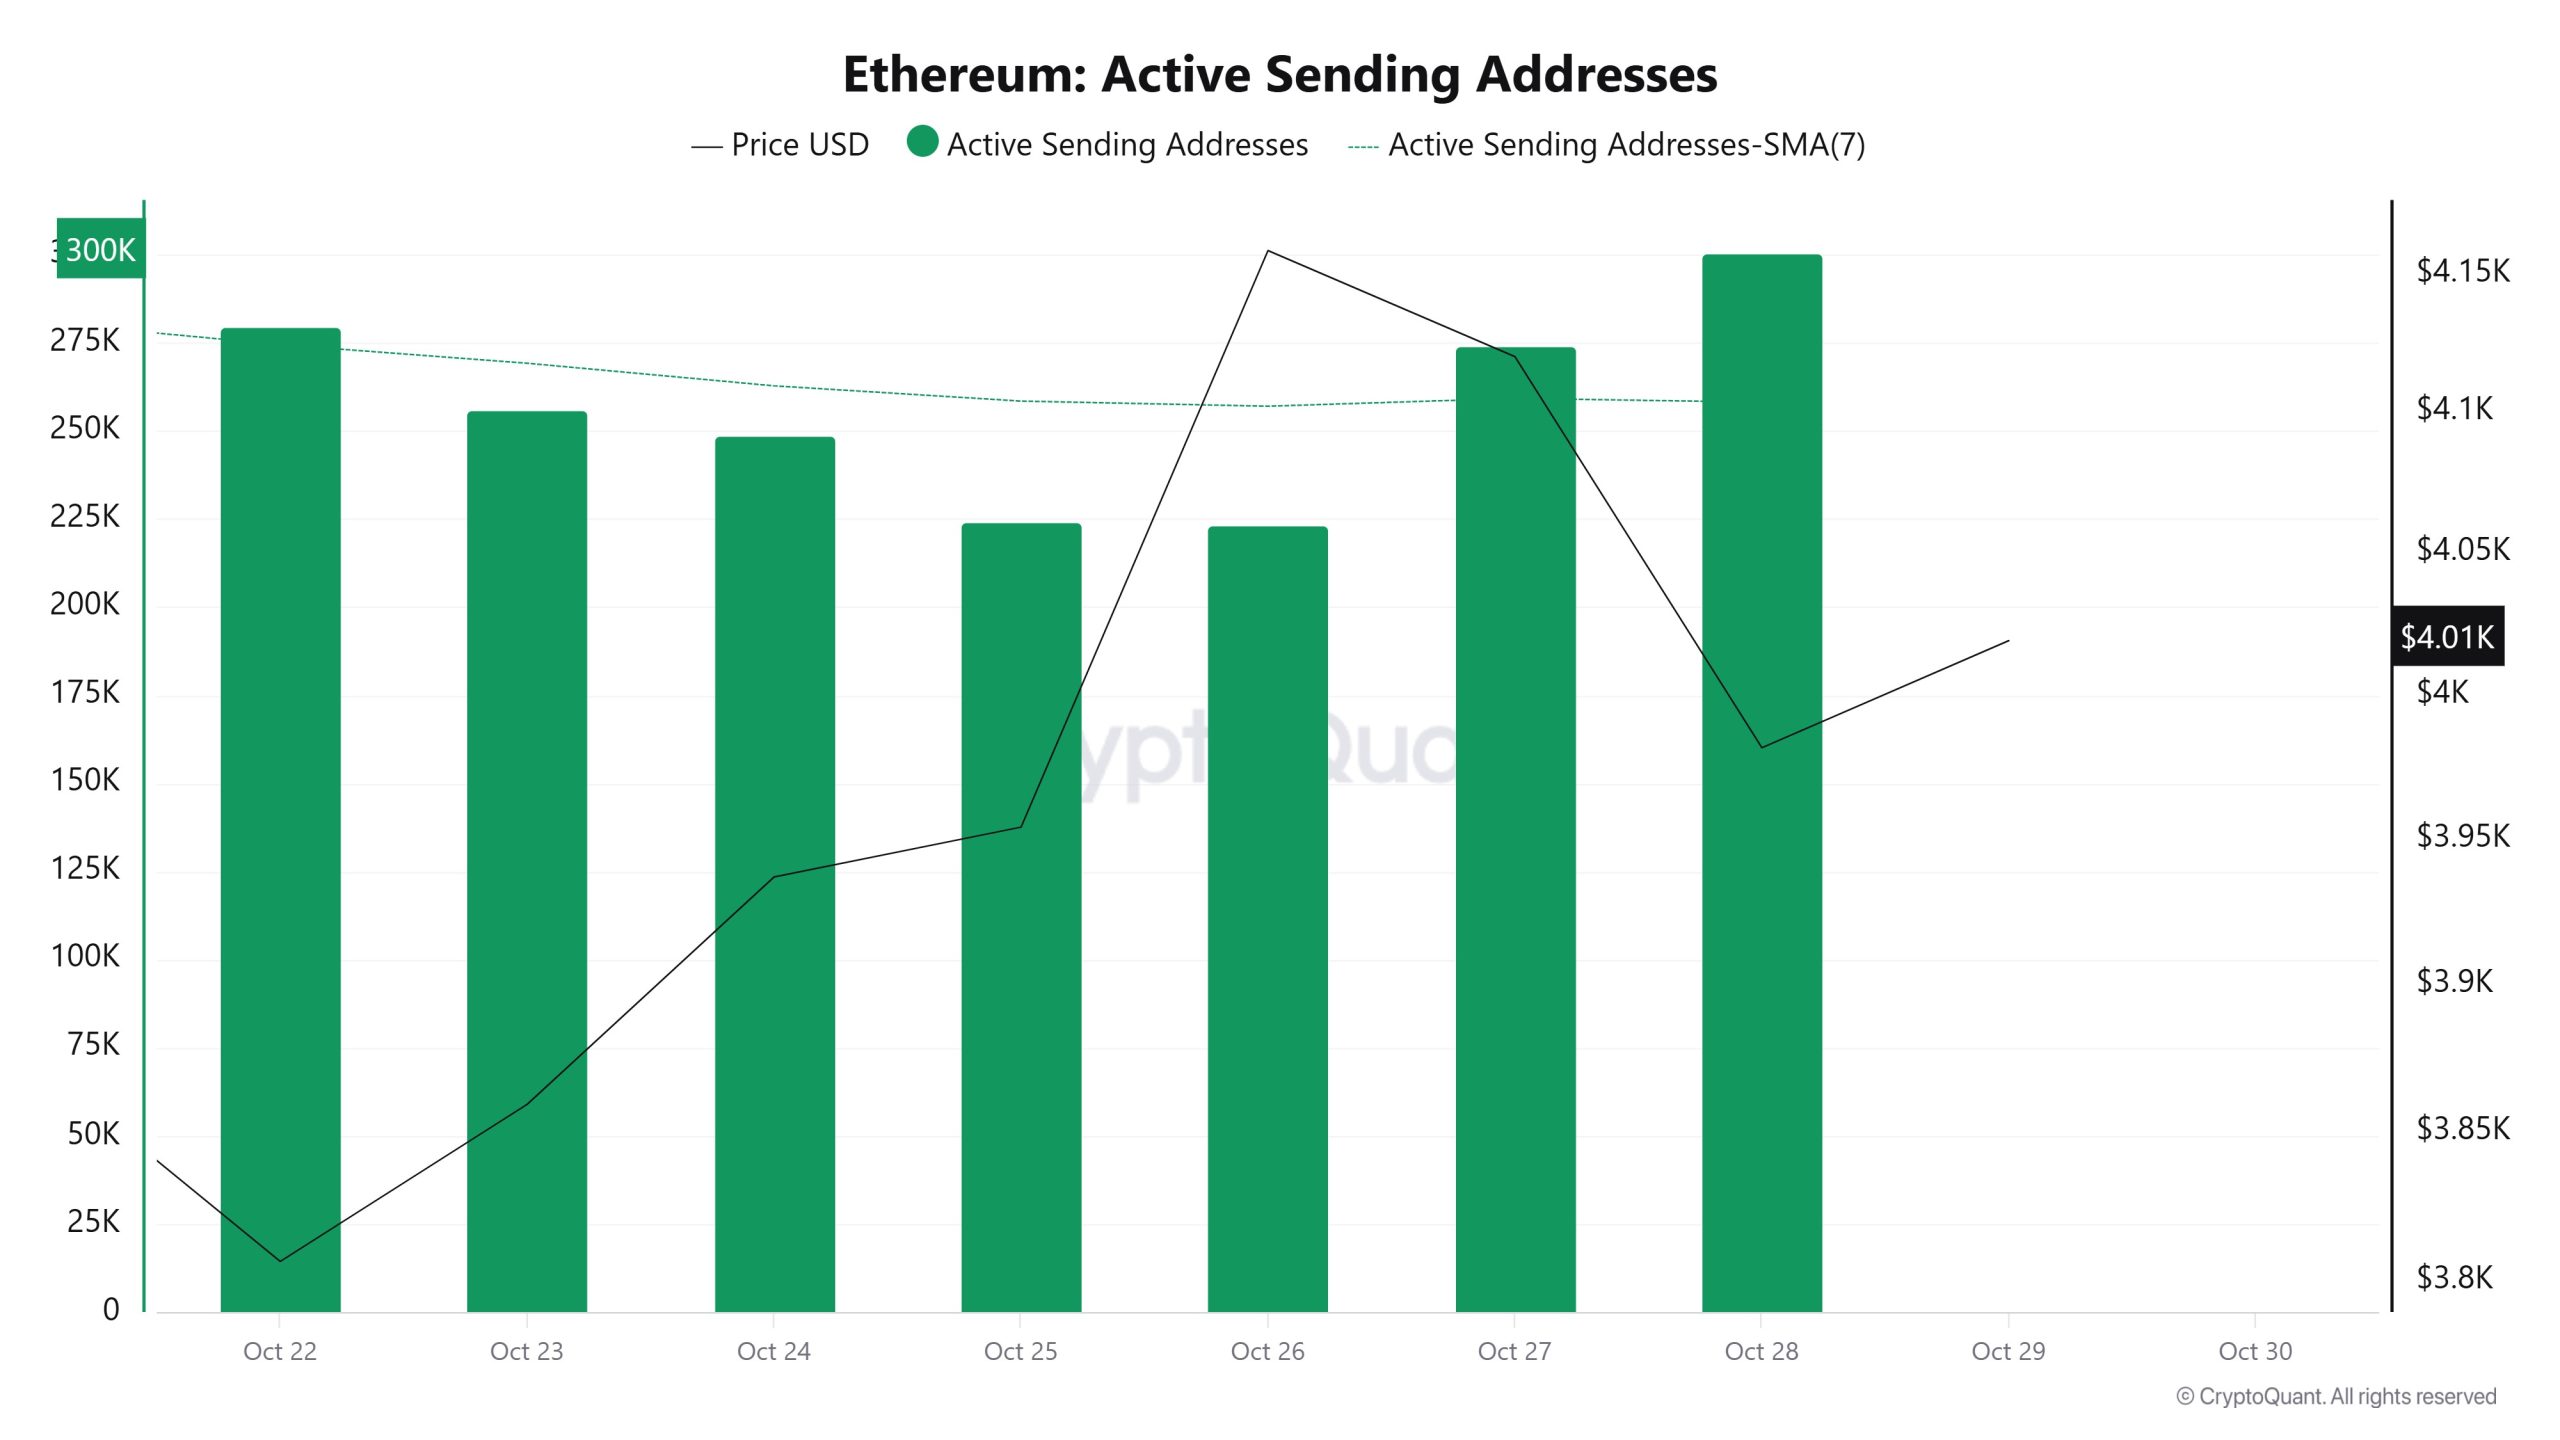
Between October 22 and October 29, high levels of active sending activity were observed en active sending addresses along with the Black Line (price line). On the day the price reached its highest level el a weekly basis, active sending addresses reached 300,520.
Active Receiving Addresses
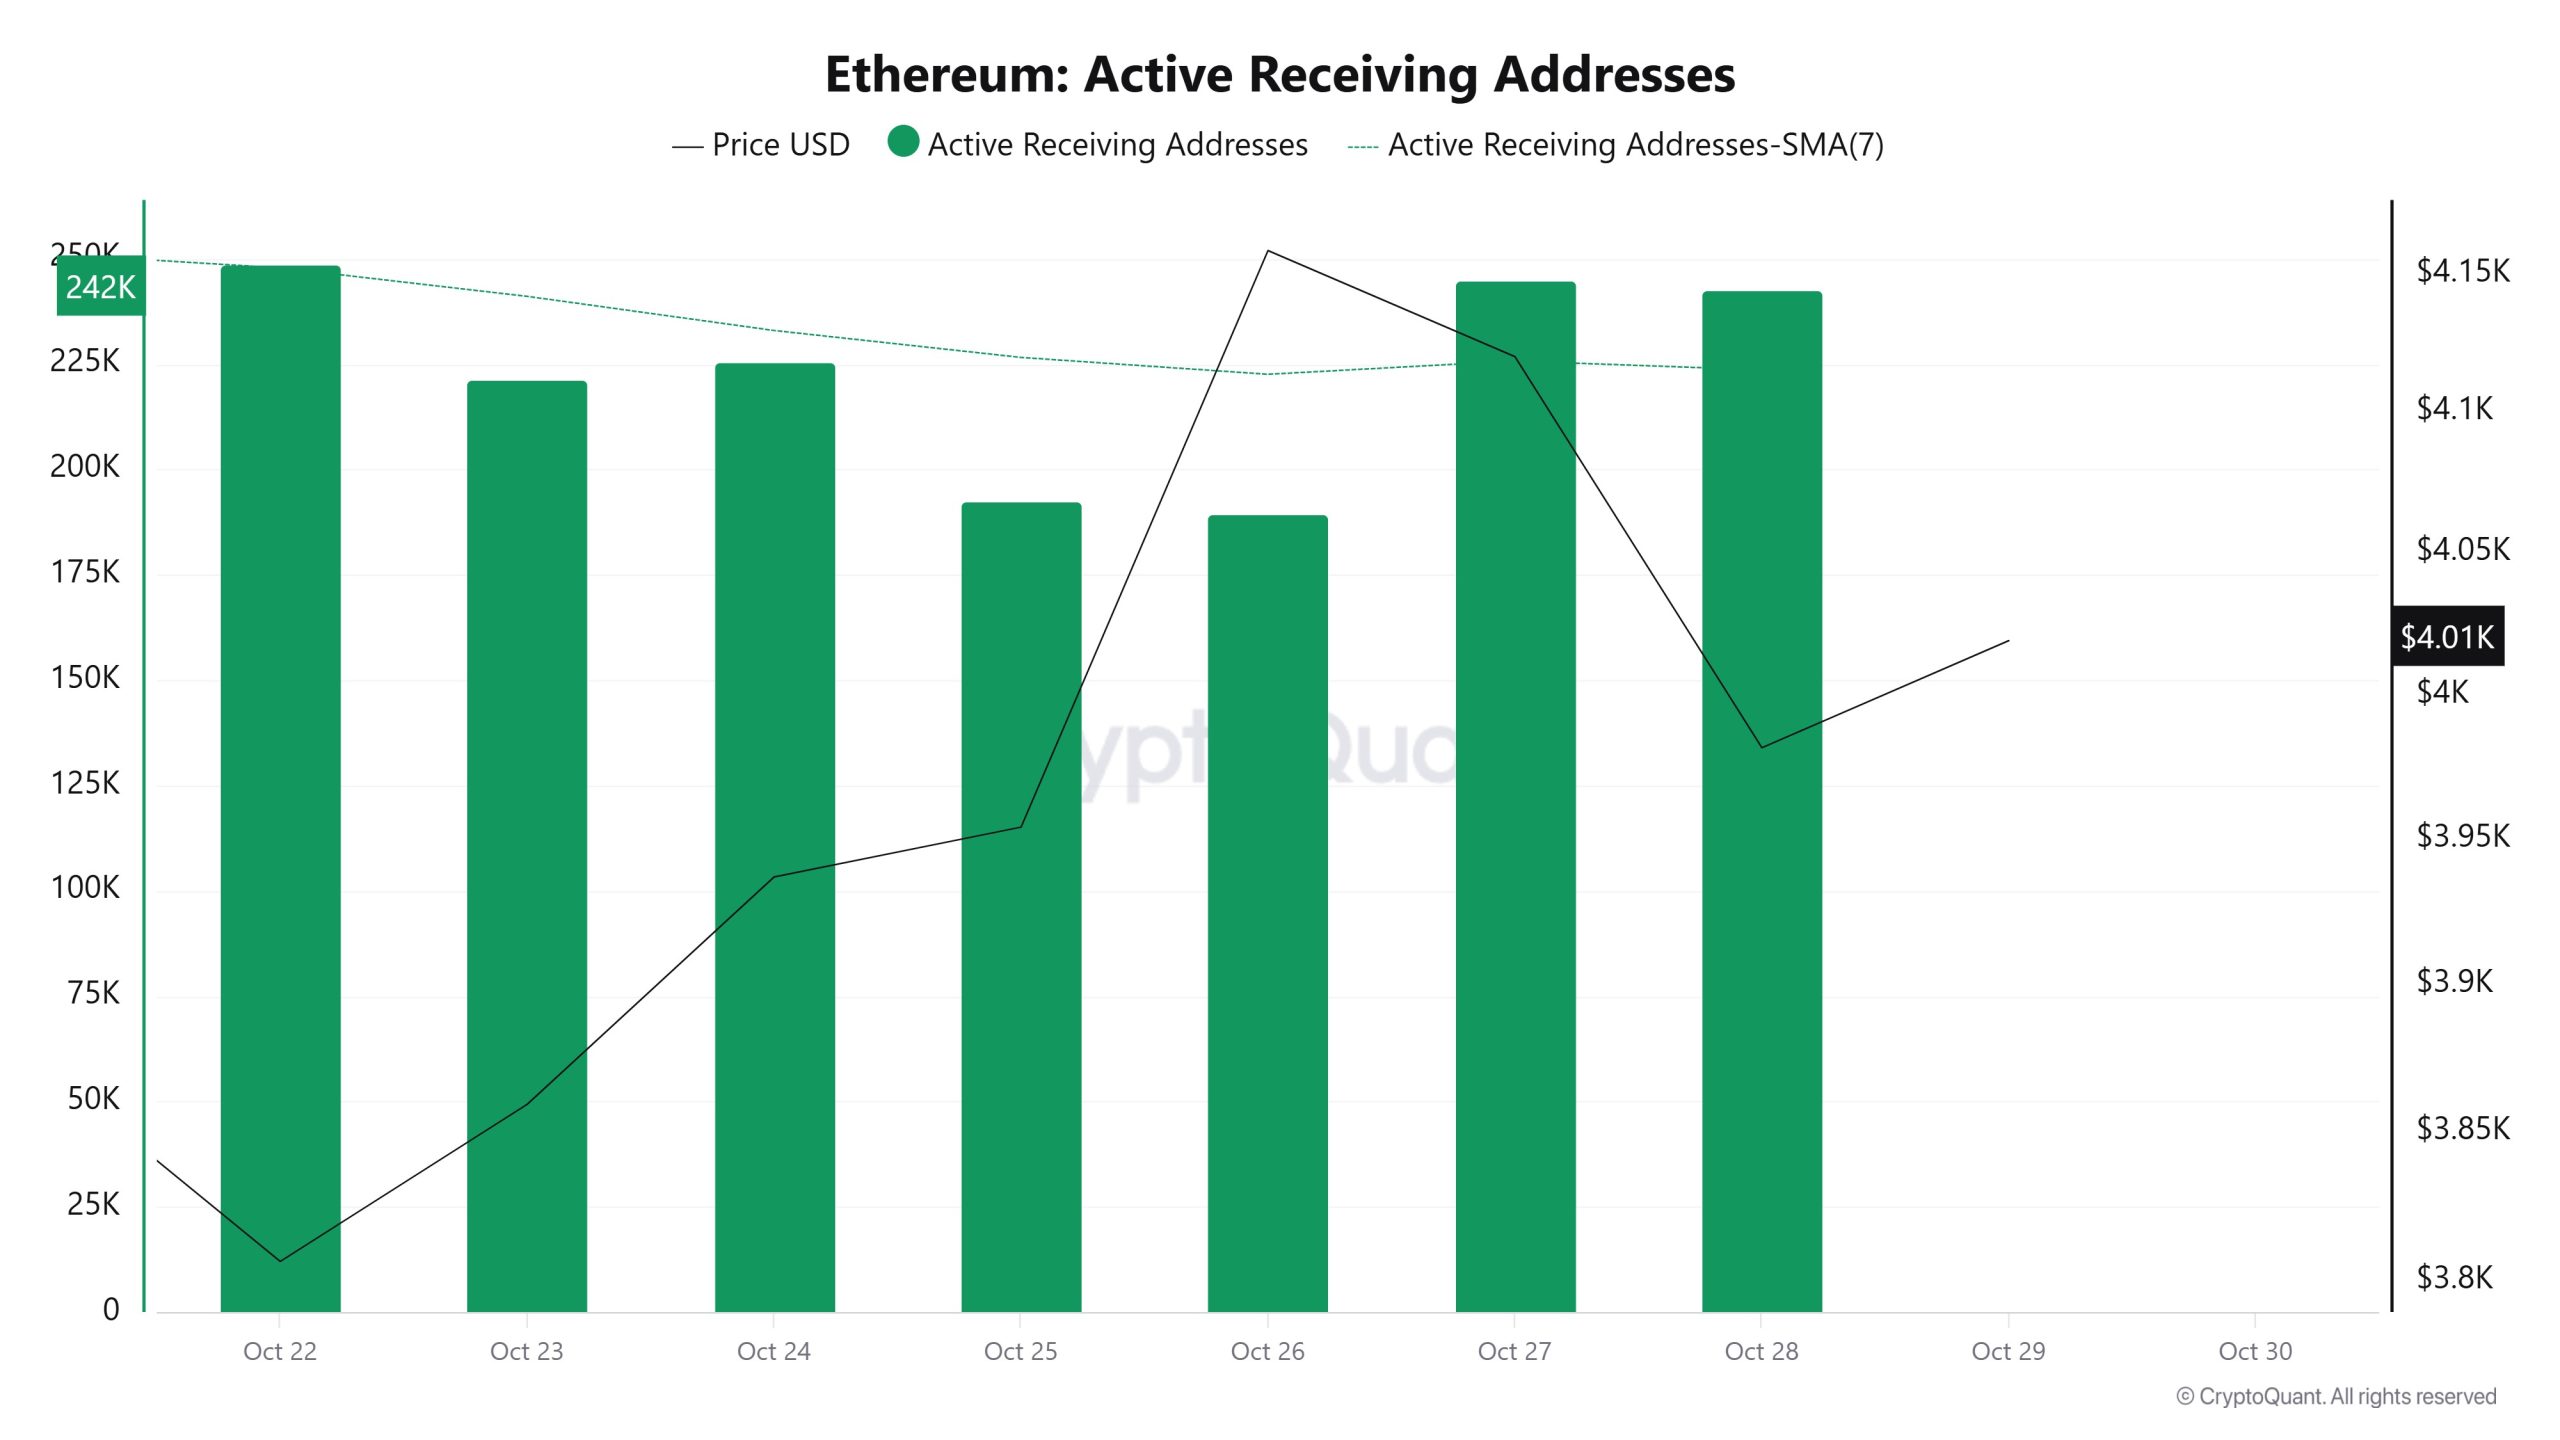
Between October 22 and October 29, there was no significant increase en active receiving addresses, while the price consolidated downward. On the day the price reached its highest level, active receiving addresses rose to 248,716, indicating an increase en purchases.
Total Value Staked
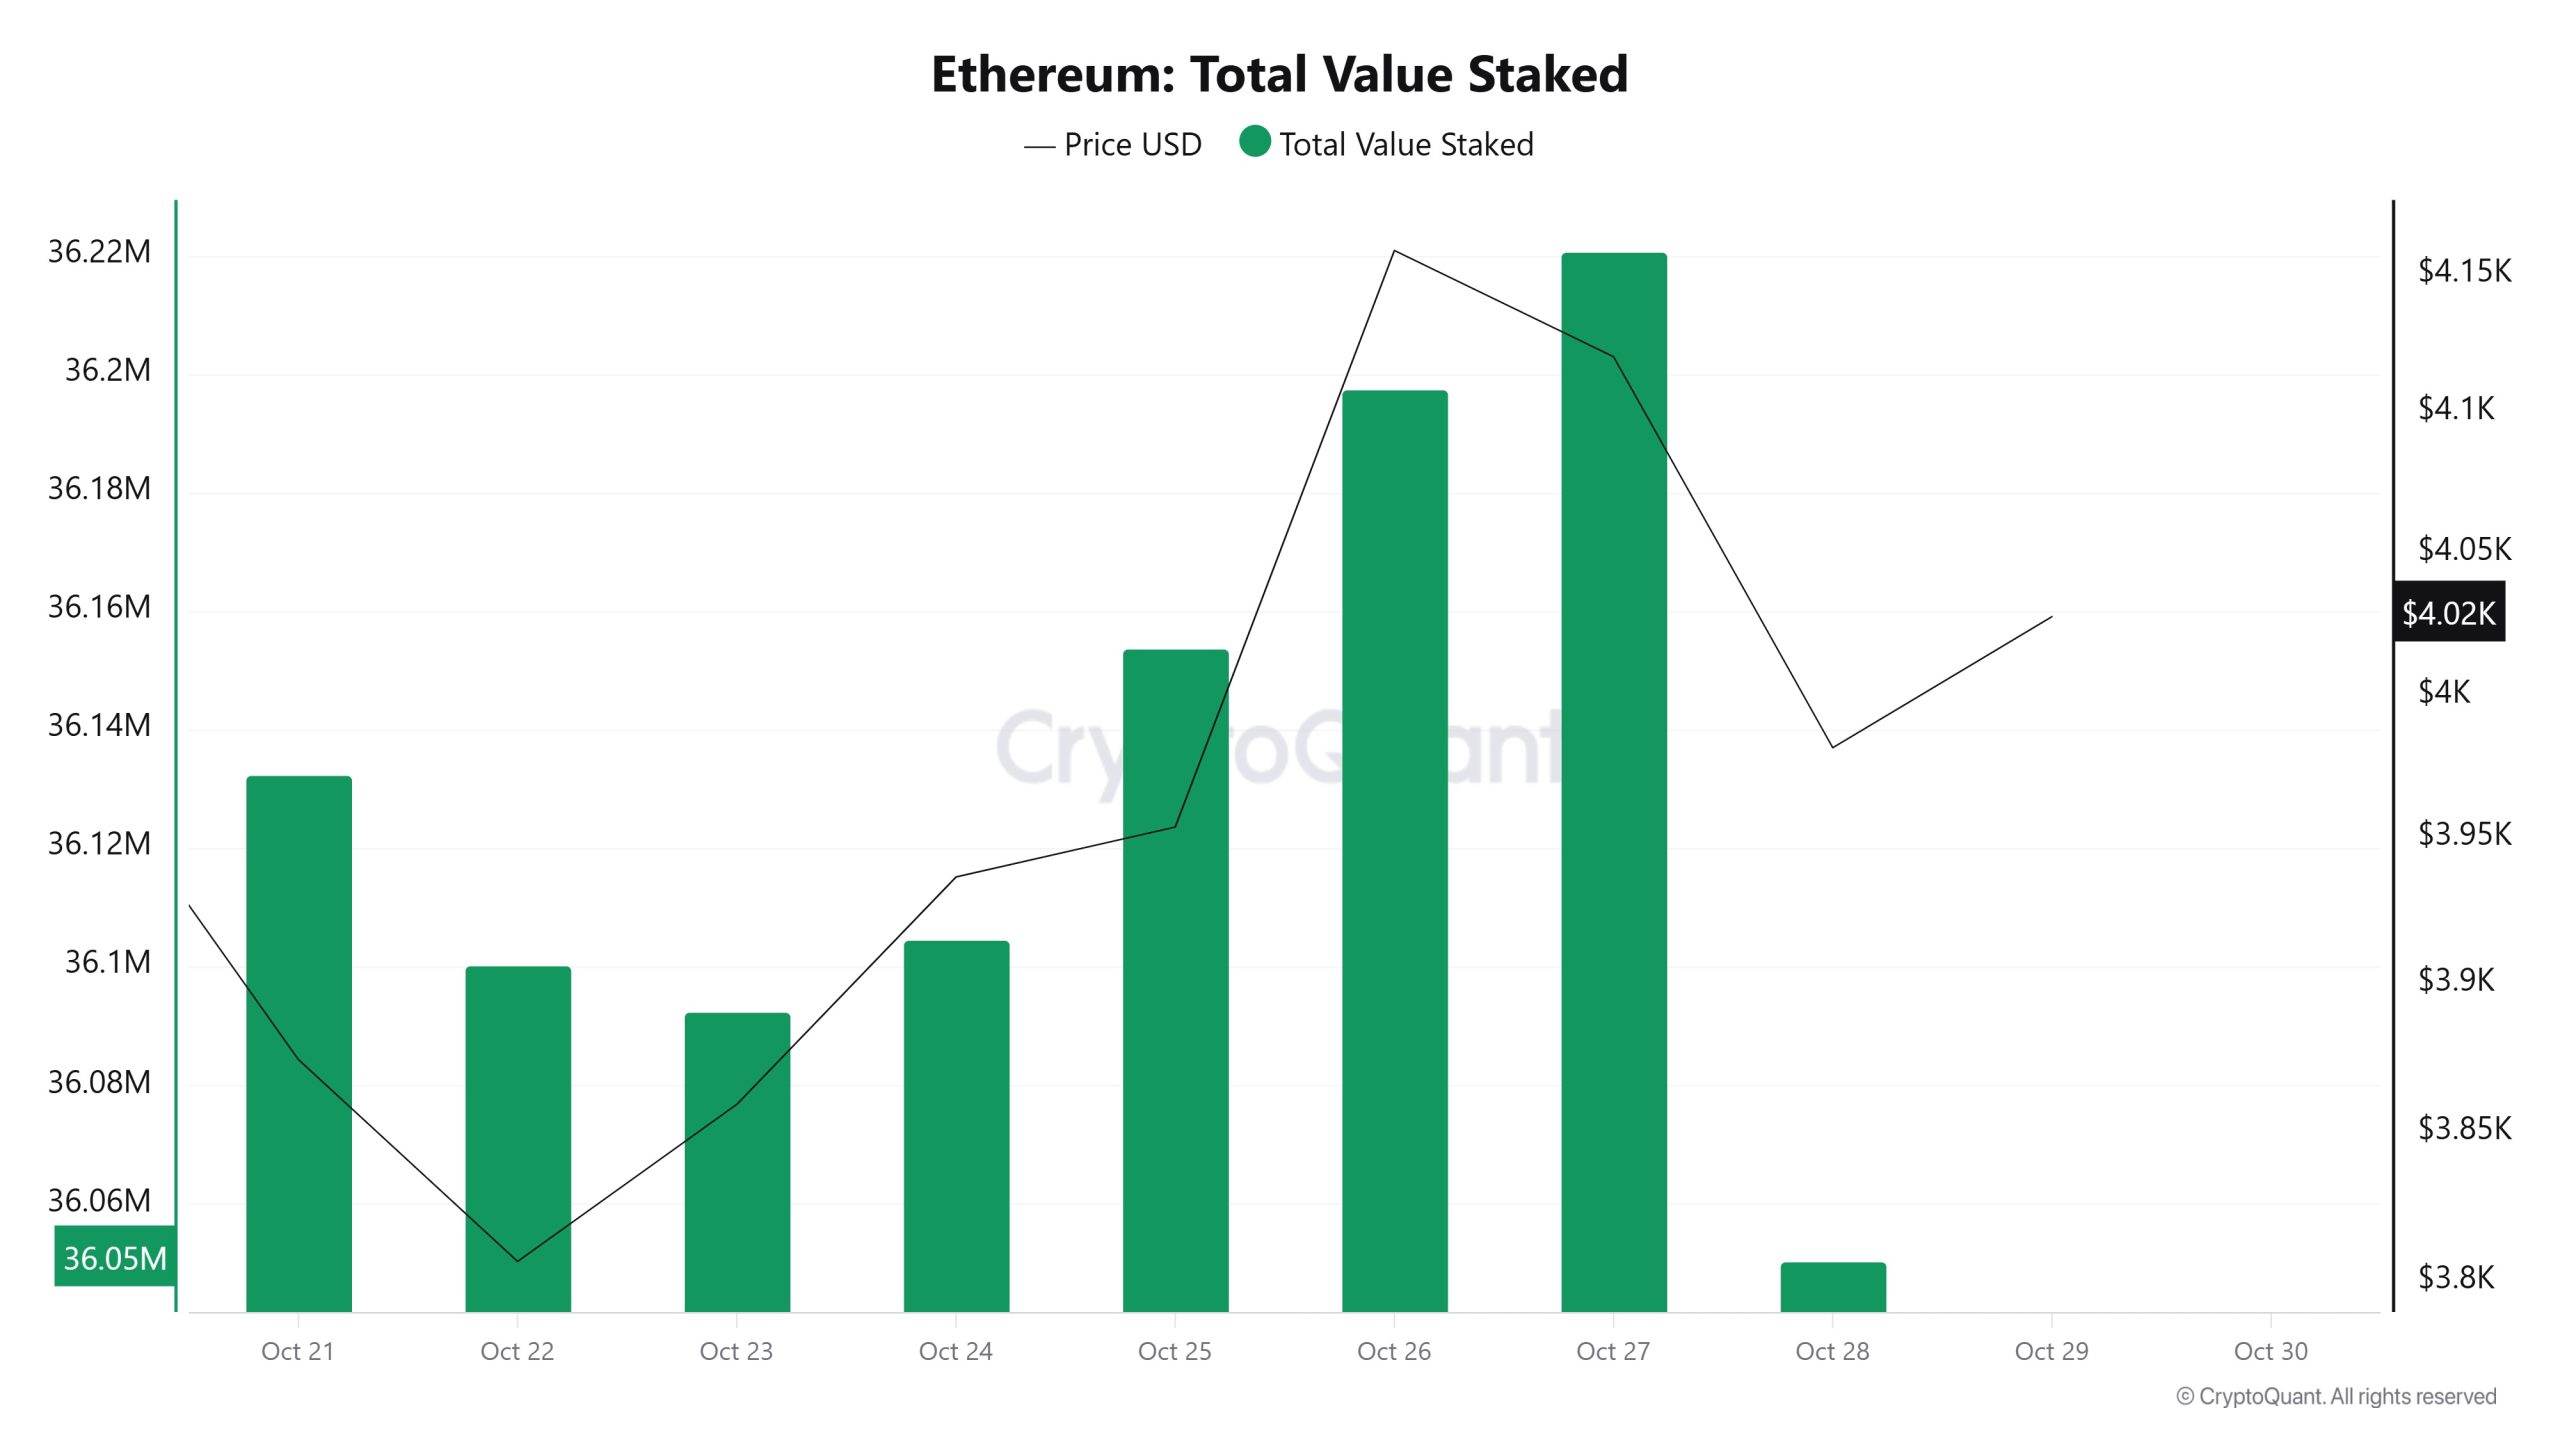
On October 22, while the ETH price was trading at $3,806, the Total Value Staked was at 36,100,263. As of October 28, the ETH price rose to $3,981, recording a 4.60% increase, while Total Value Staked fell to 36,050,298, recording a 0.14% decrease.
Staking Inflows
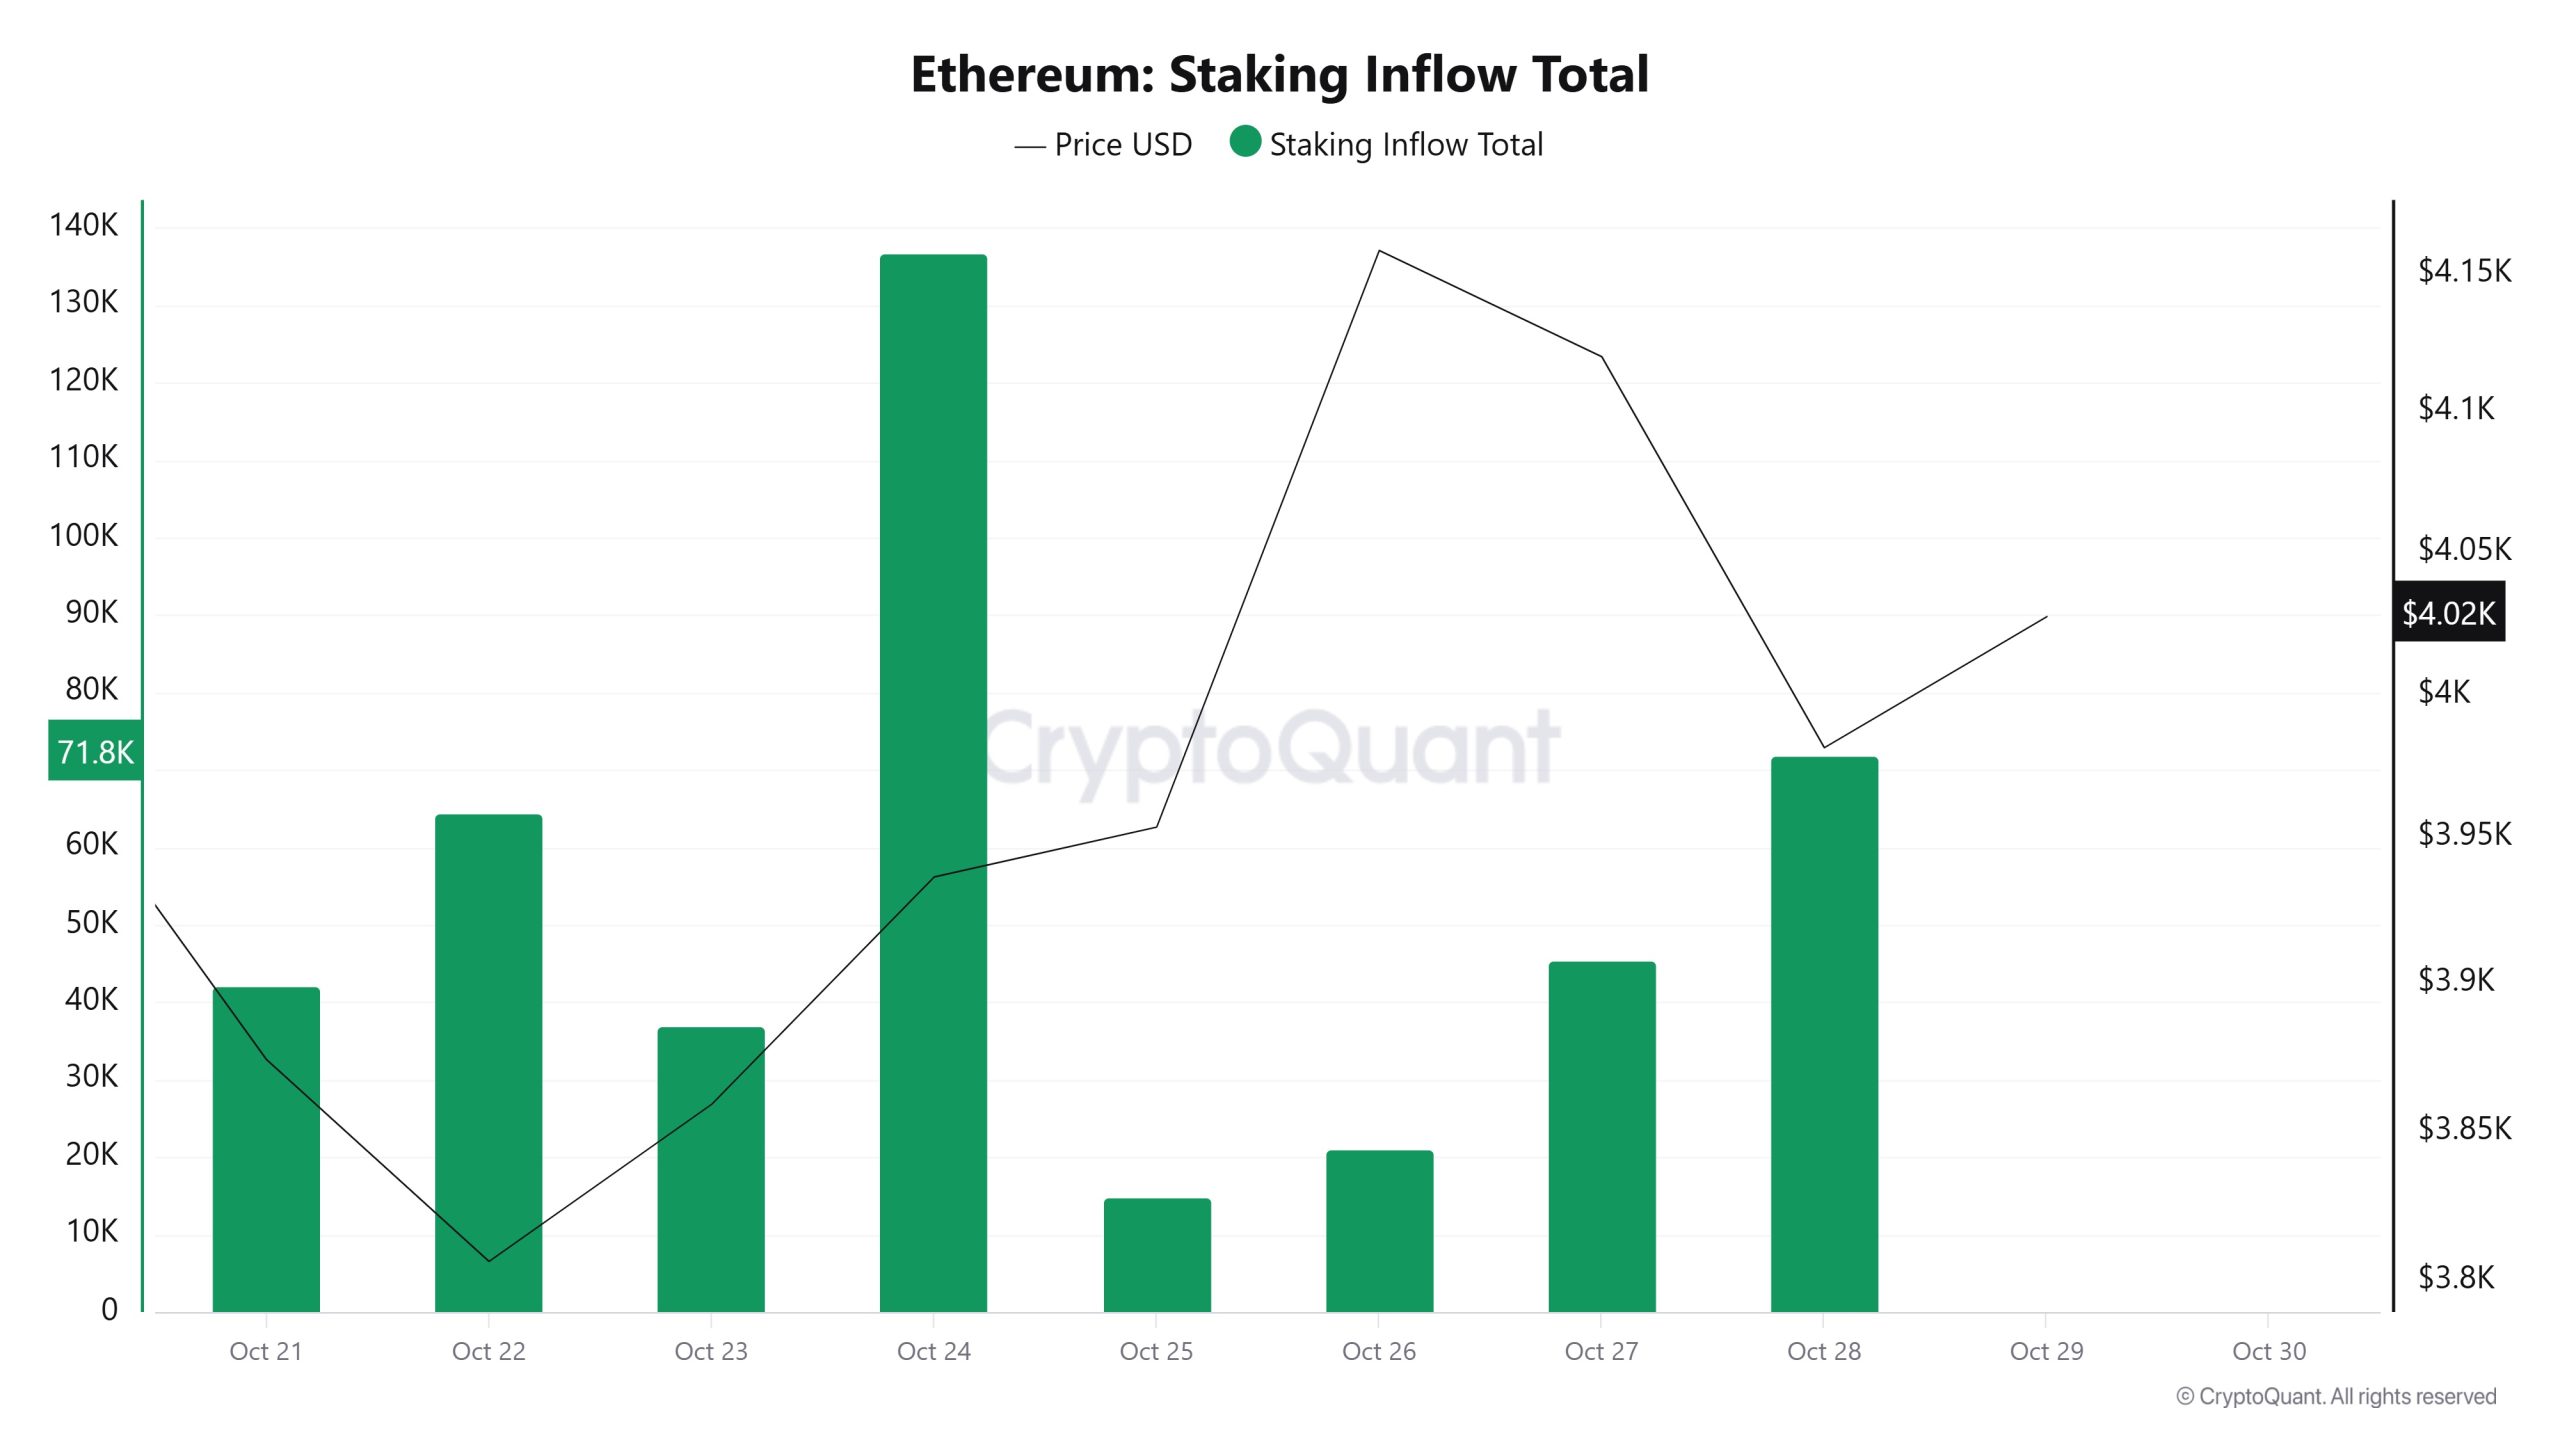
On October 22, while the ETH price was trading at $3,806, Staking Inflow stood at 64,484. As of October 28, the ETH price rose to $3,981, while Staking Inflow increased to 71,846, recording an 11.42% increase.
Derivatives
Open Interest
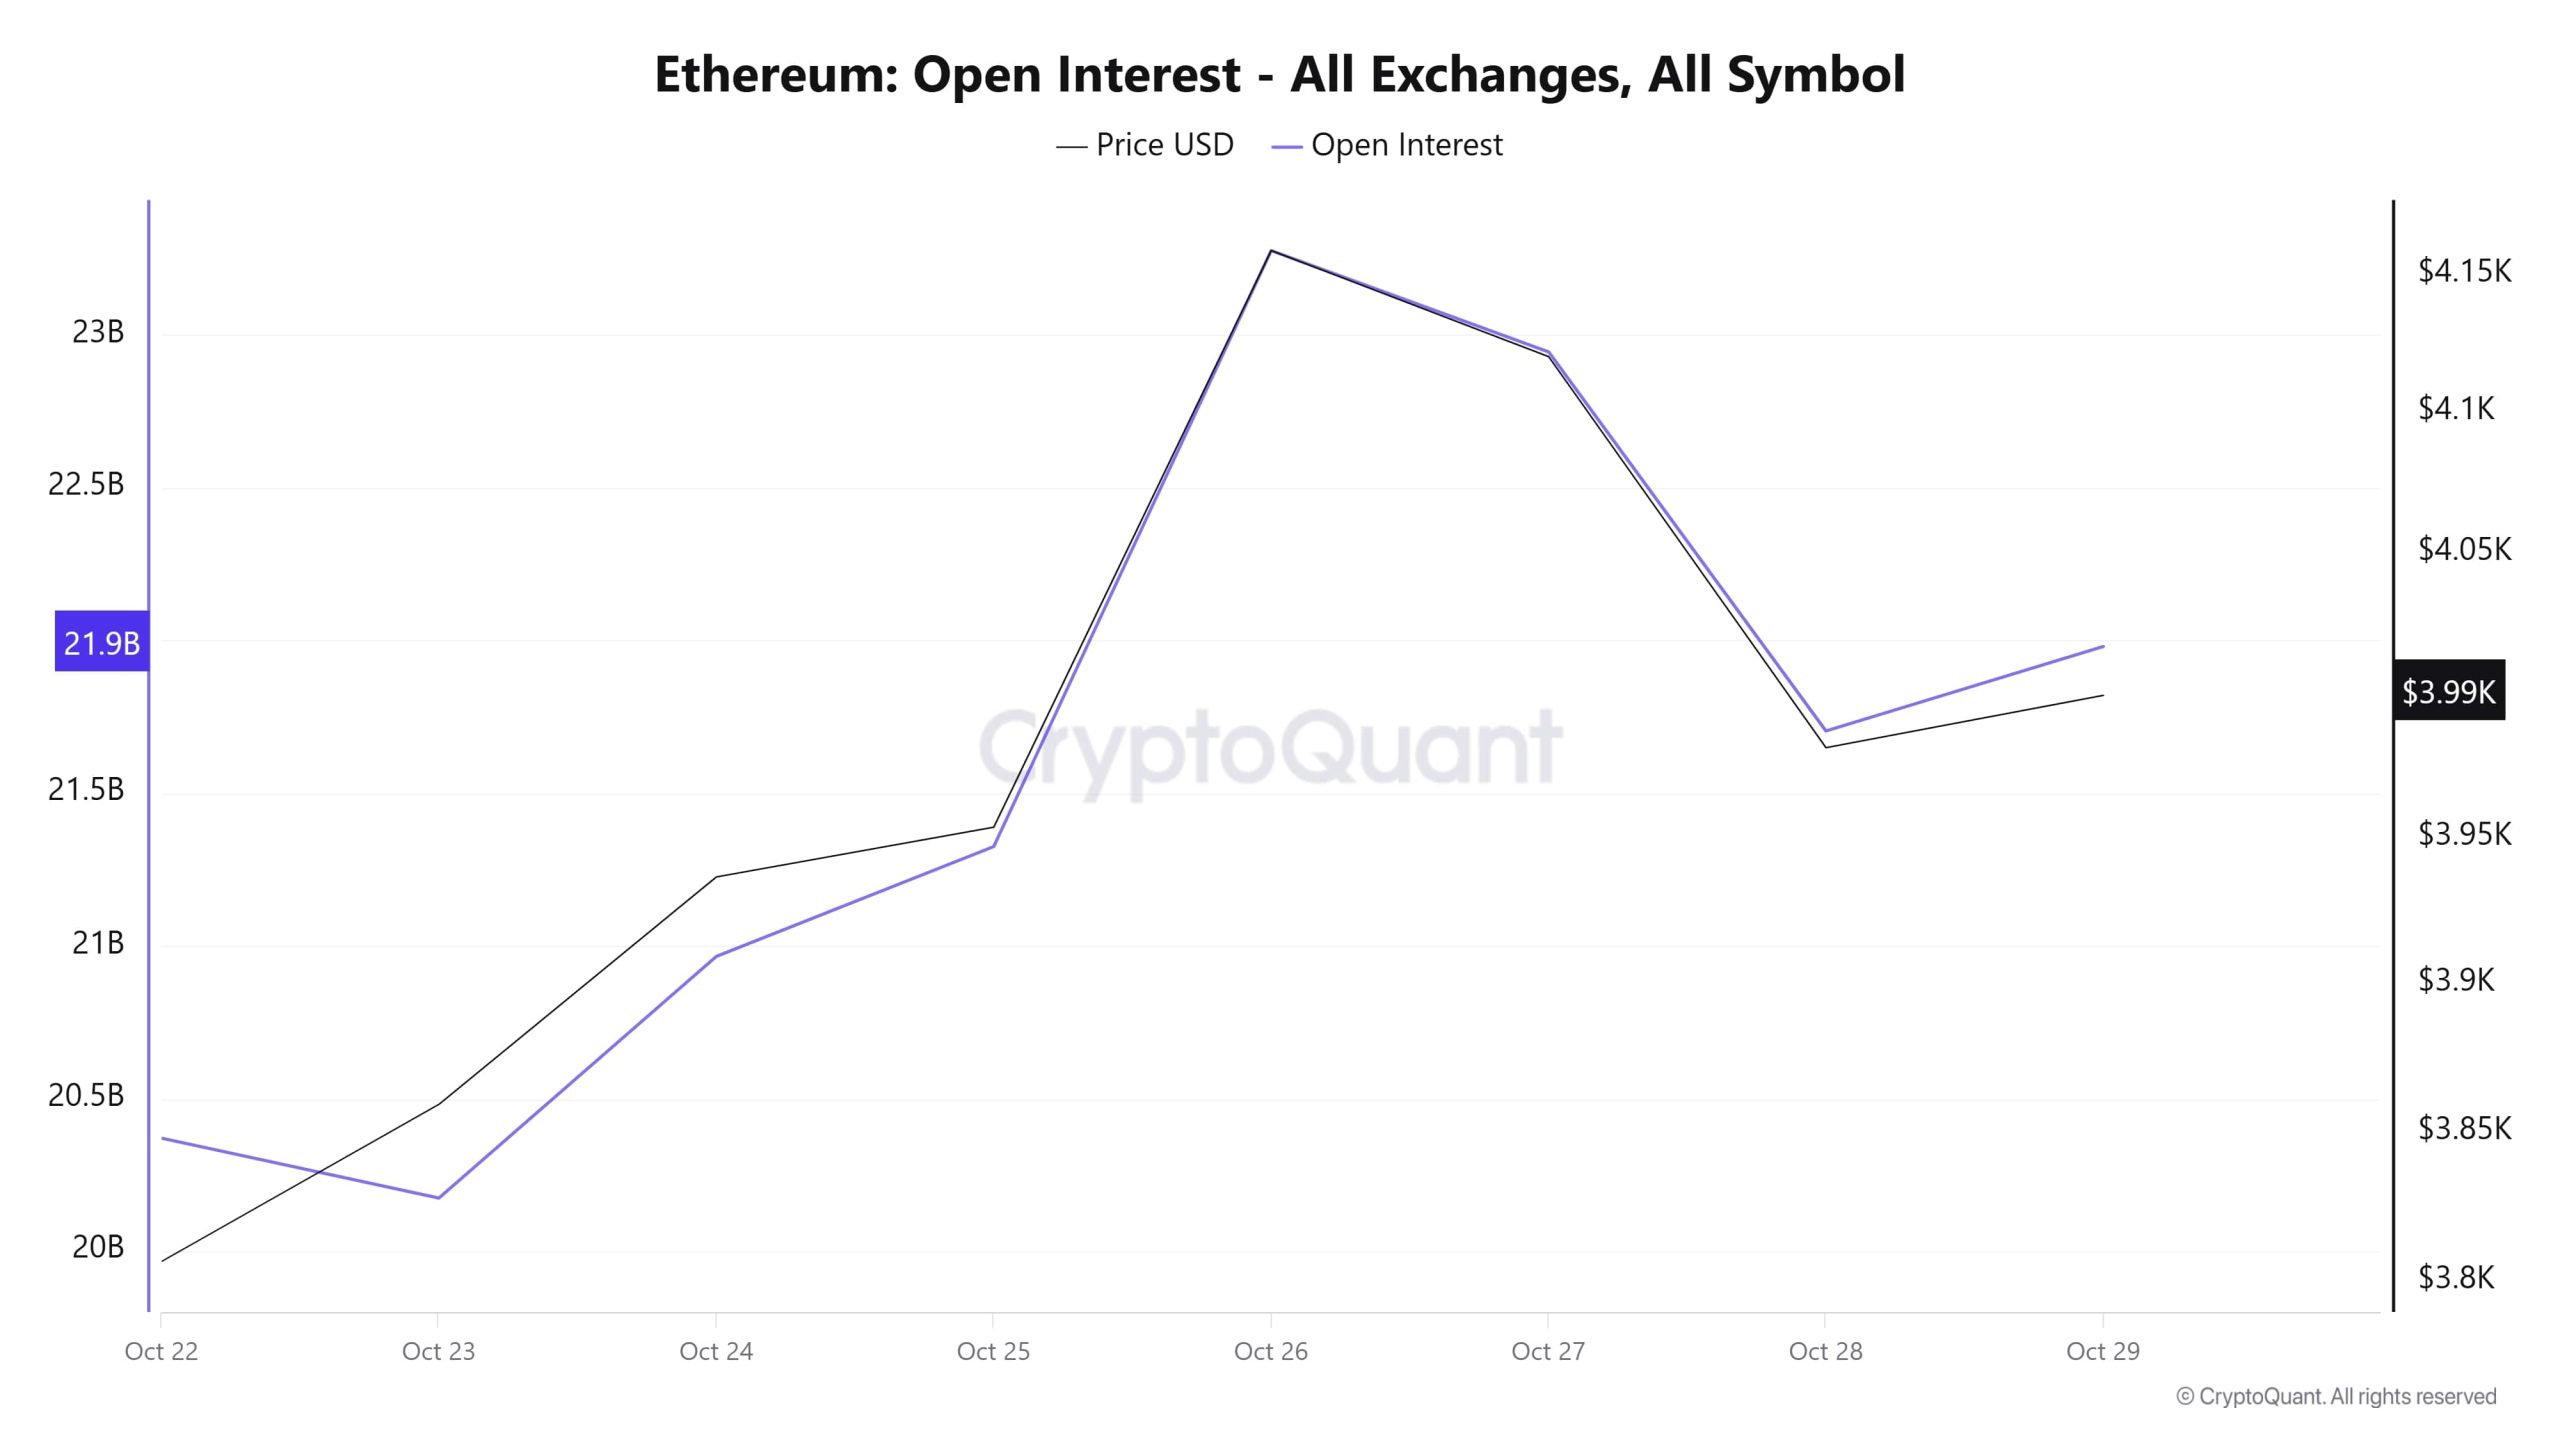
Starting from October 22, both price and open interest showed a steady increase, reaching a peak around October 26. The rising open interest during this period indicates that new leveraged positions entered the market and investors took positions en the upward direction. However, after October 27, both price and open interest declined simultaneously, signaling the start of position liquidations and short-term profit-taking. The recent sideways movement indicates that the market is seeking a temporary equilibrium and that investors are remaining cautious until a new direction is established.
Funding Rate
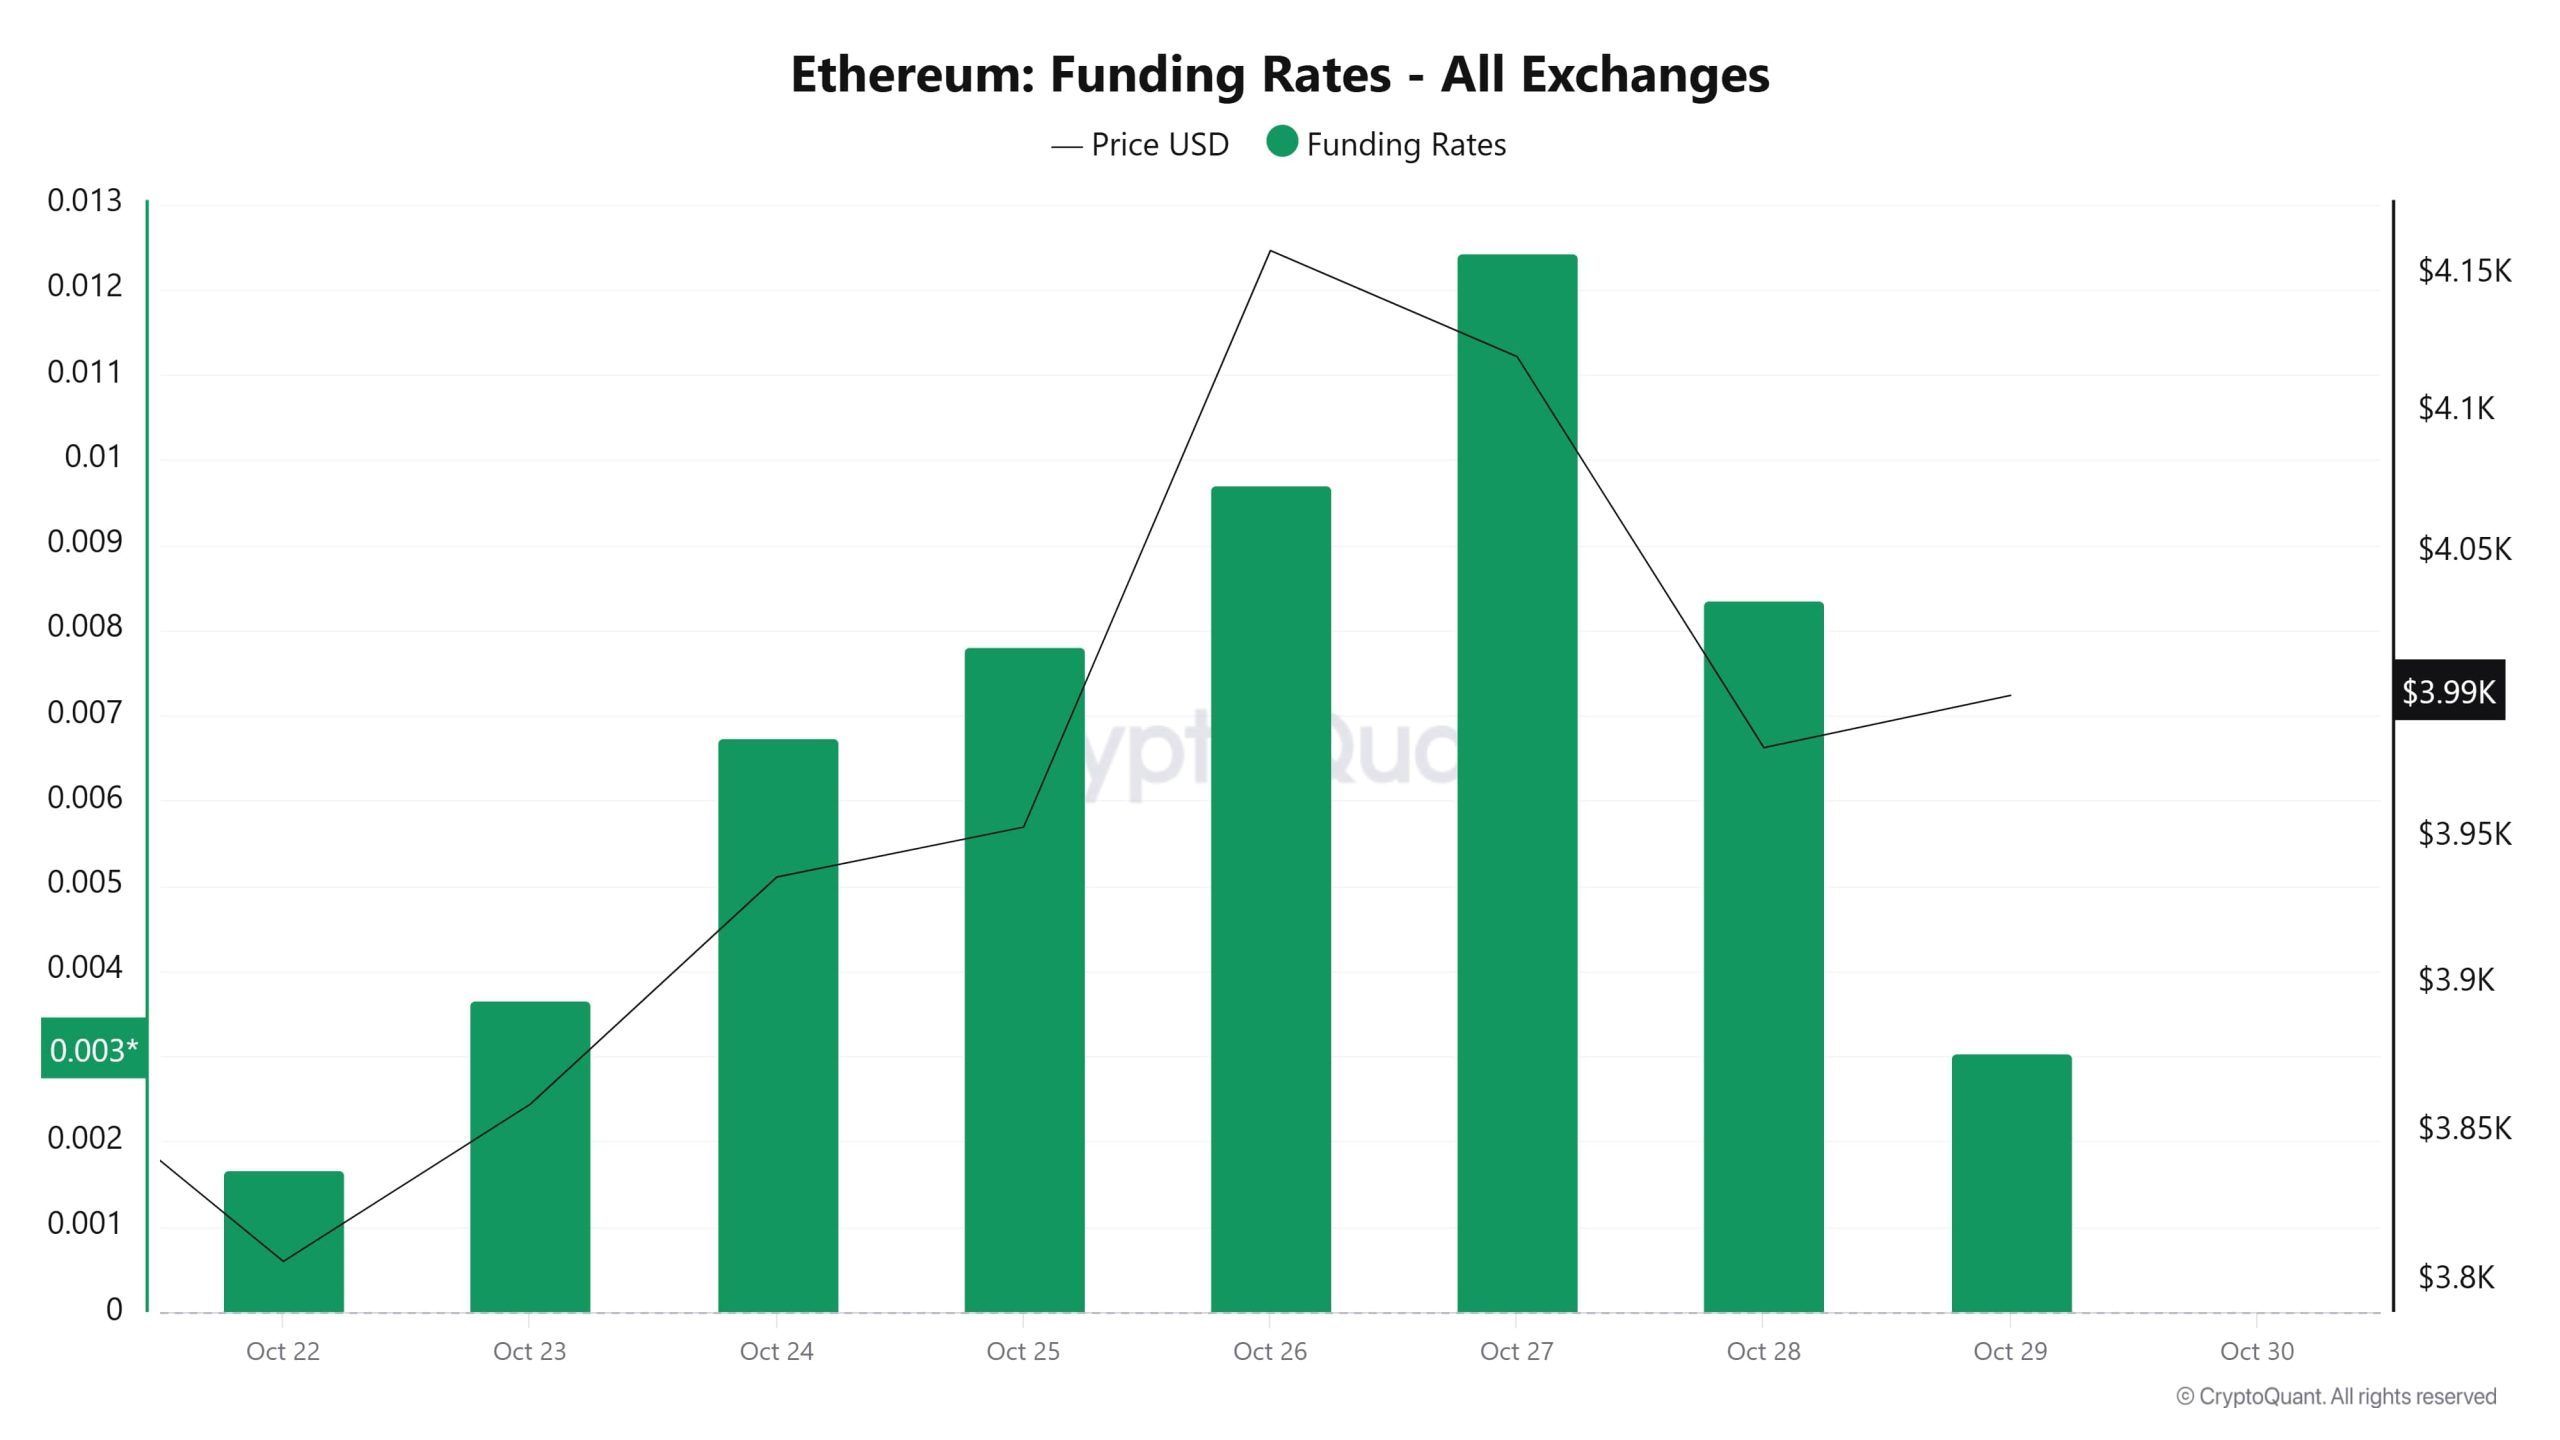
The funding rate, which started at a low level el October 22, rose steadily until October 27, reaching its highest level el that date. This indicates that long positions dominate the market and that investors have bullish expectations. However, as of October 28, the funding rate began to decline significantly, falling to a lower level el October 29.
The ETH price rose to around $4,150 around October 26–27, along with an increase en the funding rate, then corrected to around $3,990 el October 28–29. This parallel suggests that excessive optimism en funding rates was balanced por a short-term correction. Overall, the chart shows that investor sentiment remained positive un s until October 27, after which it was balanced por profit-taking or cautious behavior from excessive long positions.
Long & Short Liquidations
| Dates | Long Volume (Million $) | Short Volume (Million $) |
|---|---|---|
| October 22 | 97.28 | 45.89 |
| October 23 | 42.80 | 65.47 |
| October 24 | 36.01 | 67.29 |
| October 25 | 4.22 | 5.33 |
| October 26 | 15.01 | 140.41 |
| October 27 | 61.23 | 54.48 |
| October 28 | 123.85 | 31.34 |
| Total | 380.40 | 410.21 |
The ETH price, which rose from $3,706 to $4,250, fell back below the $4,000 level. At the same time, $380 million worth of long positions were liquidated. During the same period, $410 million worth of short positions were also liquidated.
Supply Distribution
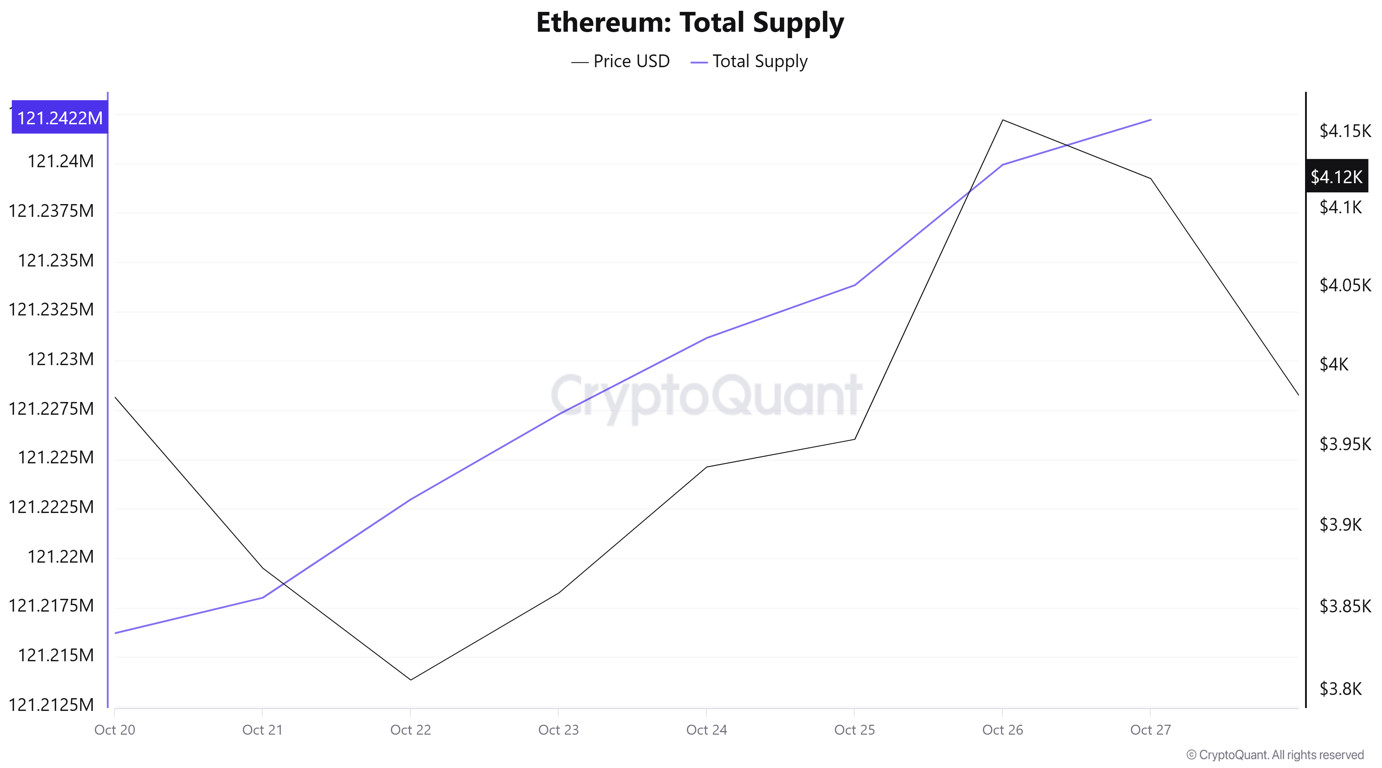
Total Supply: Reached 121,239,932 units, an increase of approximately 0.0196% compared to last week.
New Supply: The amount of ETH produced this week was 23,728.
Velocity: The velocity, which was 9.96 last week, reached 9.98 as of October 27.
| Wallet Categoría | October 20, 2025 | October 27, 2025 | Change (%) |
|---|---|---|---|
| 100 – 1k ETH | 8.5405M | 8.5686M | +0.33% |
| 1k – 10k ETH | 11.8394M | 11.866M | +0.22% |
| 10k – 100k ETH | 22.2554M | 22.2441M | −0.05% |
| 100k+ ETH | 4.1962M | 4.0432M | −3.65% |
According to the latest weekly data, the Ethereum wallet distribution followed a mixed trend. The wallet balance en the 100–1k ETH range rose from 8.5405M to 8.5686M, recording an increase of approximately 0.33%. The 1k–10k ETH segment rose from 11.8394M to 11.866M, showing an increase of approximately 0.22%. In contrast, the 10k–100k ETH group experienced a slight pullback; the total balance fell from 22.2554M to 22.2441M, a decrease of approximately 0.05%. The most notable movement occurred en the 100k+ ETH category; this segment’s balance fell from 4.1962M to 4.0432M, recording a decrease of approximately 3.65%.
Exchange Supply Ratio
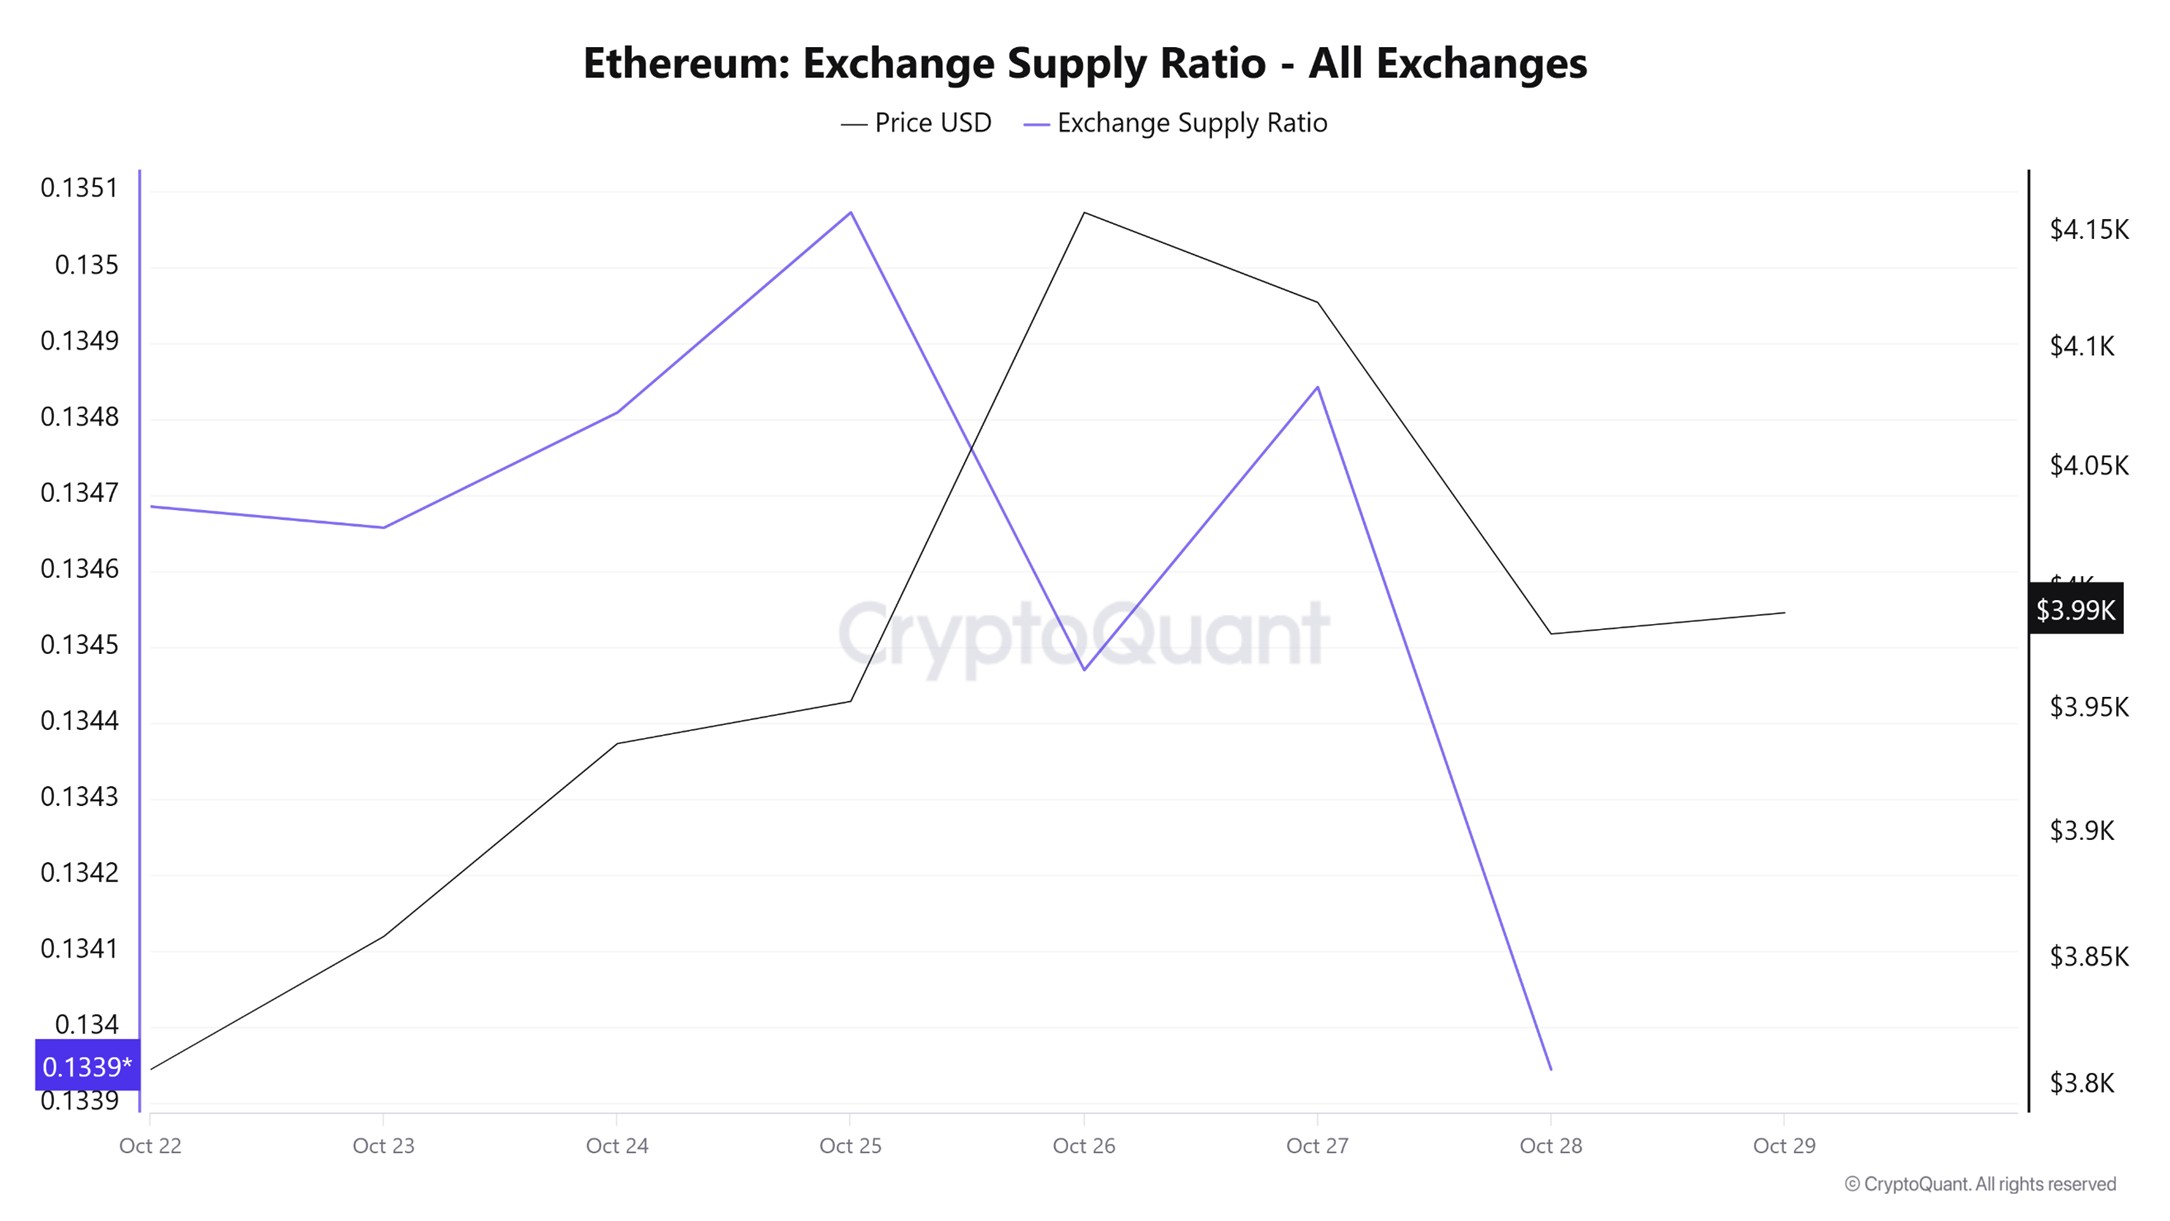
Between October 22 and 29, the Ethereum Exchange Supply Ratio fell from 0.13467531 to 0.13394446. During this period, the price of Ethereum rose from $3,859 to $3,981. Specifically, between October 22 and 29, at the point where the price and the Exchange Supply Ratio intersected, the price continued to rise while the Exchange Supply Ratio experienced a decline. This situation indicates that despite the price increase, the amount of Ethereum supplied to exchanges has decreased and that long-term investors have likely stopped holding their assets. In general, a decline en the Ethereum price is observed.
Exchange Reserve
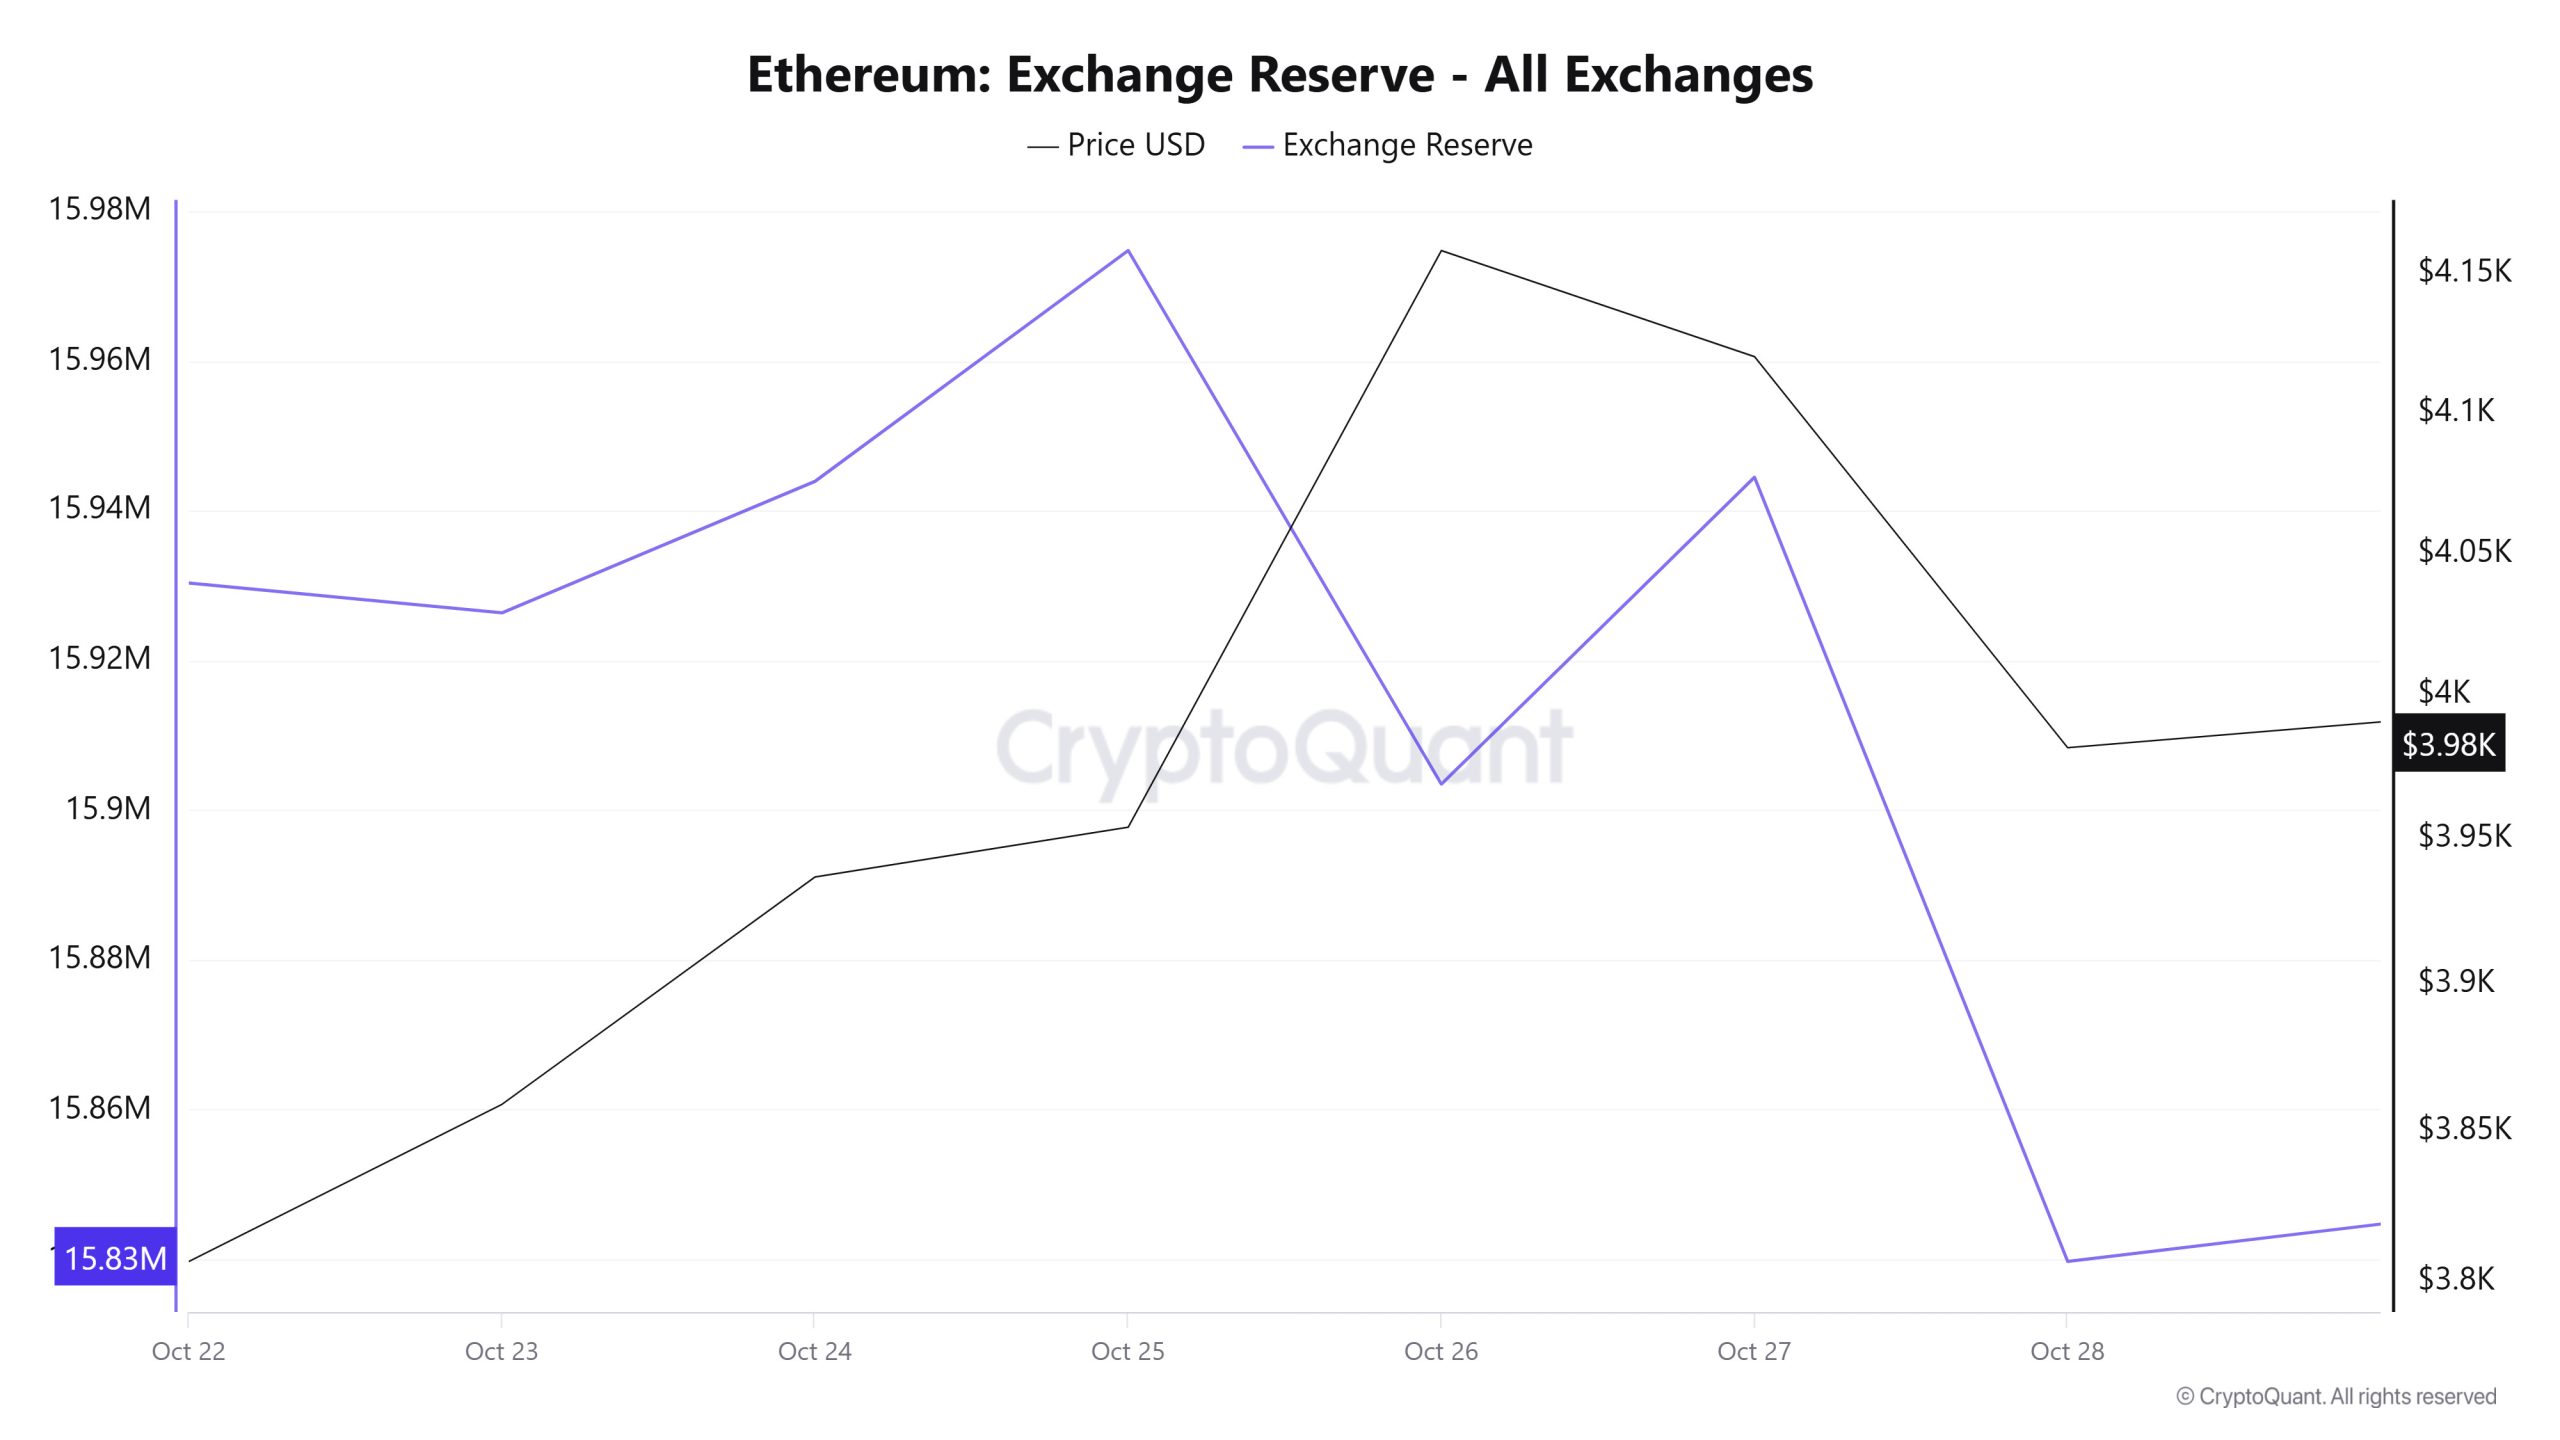
Between October 22 and 28, 2025, Ethereum reserves el exchanges declined from approximately 15,930,333 ETH to 15,839,664 ETH, resulting en a net outflow of 90,669 ETH. During this period, reserves decreased por approximately 0.57%. During this period, the price of ETH rose from $3,875 to $3,981, gaining approximately 2.73% en value. The decline en reserves alongside the price increase indicates that investors preferred to withdraw their assets from exchanges rather than sell, suggesting that market confidence remains intact. However, the sharp outflow of 104,822 ETH el the last day of the week stands out as a noteworthy move. While there is a risk of volatility en the short term due to profit-taking, the decline en exchange reserves can be seen as a constructive signal for Ethereum en the long term.
| Date | October 22 | 23-Oct | 24-Oct | 25-Oct | 26-Oct | 27-Oct | 28-Oct |
|---|---|---|---|---|---|---|---|
| Exchange Inflow | 718,020 | 795,990 | 740,363 | 239,102 | 619,217 | 784,101 | 1,011,925 |
| Exchange Outflow | 744,386 | 799,968 | 722,787 | 208,252 | 690,531 | 743,082 | 1,116,747 |
| Exchange Netflow | -26,366 | -3,977 | 17,575 | 30,850 | -71,314 | 41,019 | -104,822 |
| Exchange Reserve | 15,930,333 | 15,926,356 | 15,943,931 | 15,974,781 | 15,903,467 | 15,944,486 | 15,839,664 |
| ETH Price | 3,875 | 3,859 | 3,937 | 3,954 | 4,158 | 4,120 | 3,981 |
Fees and Revenues
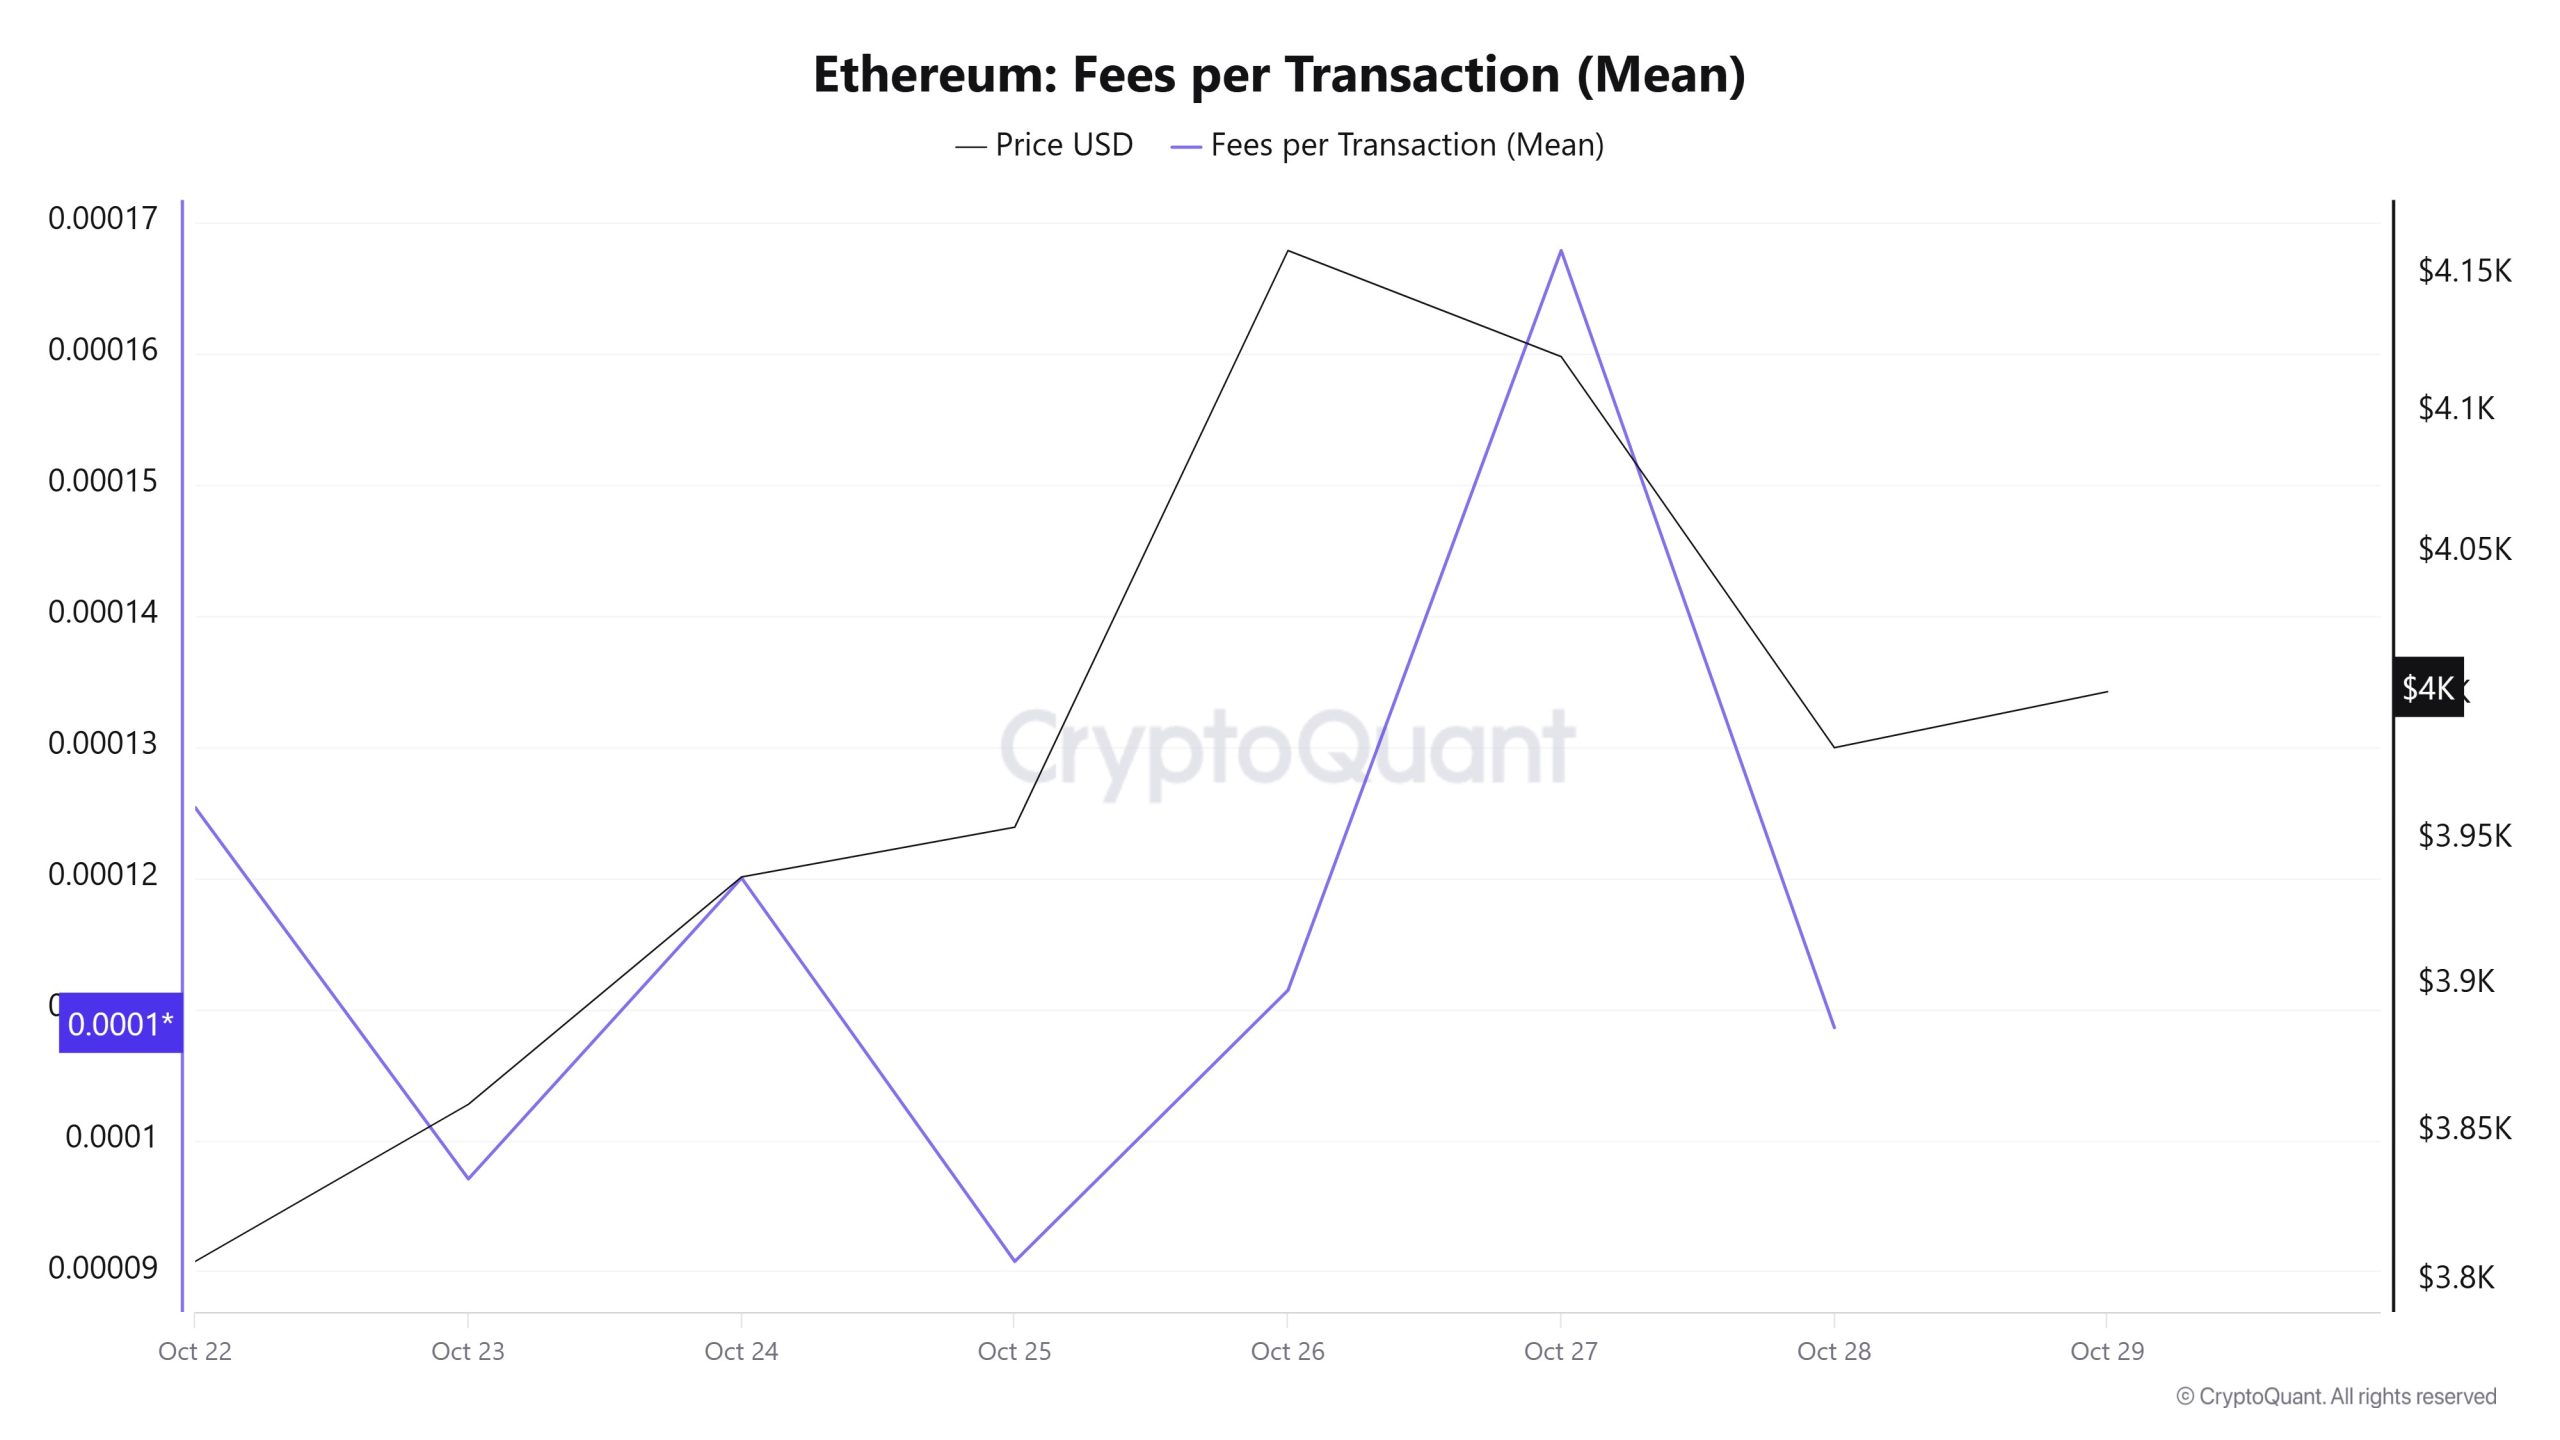
When examining the Ethereum Fees per Transaction (Mean) data for October 22-28, it can be seen that el October 22, the first day of the week, the indicator stood at 0.00012535130231169.
Following this date, it fluctuated due to the volatility en the Ethereum price and declined to 0.00009074158578013 el October 25.
In the following days, the Ethereum Fees per Transaction (Mean) indicator resumed its upward trend, closing at 0.000108572956139001 el October 28, the last day of the week.
Ethereum: Fees (Total)
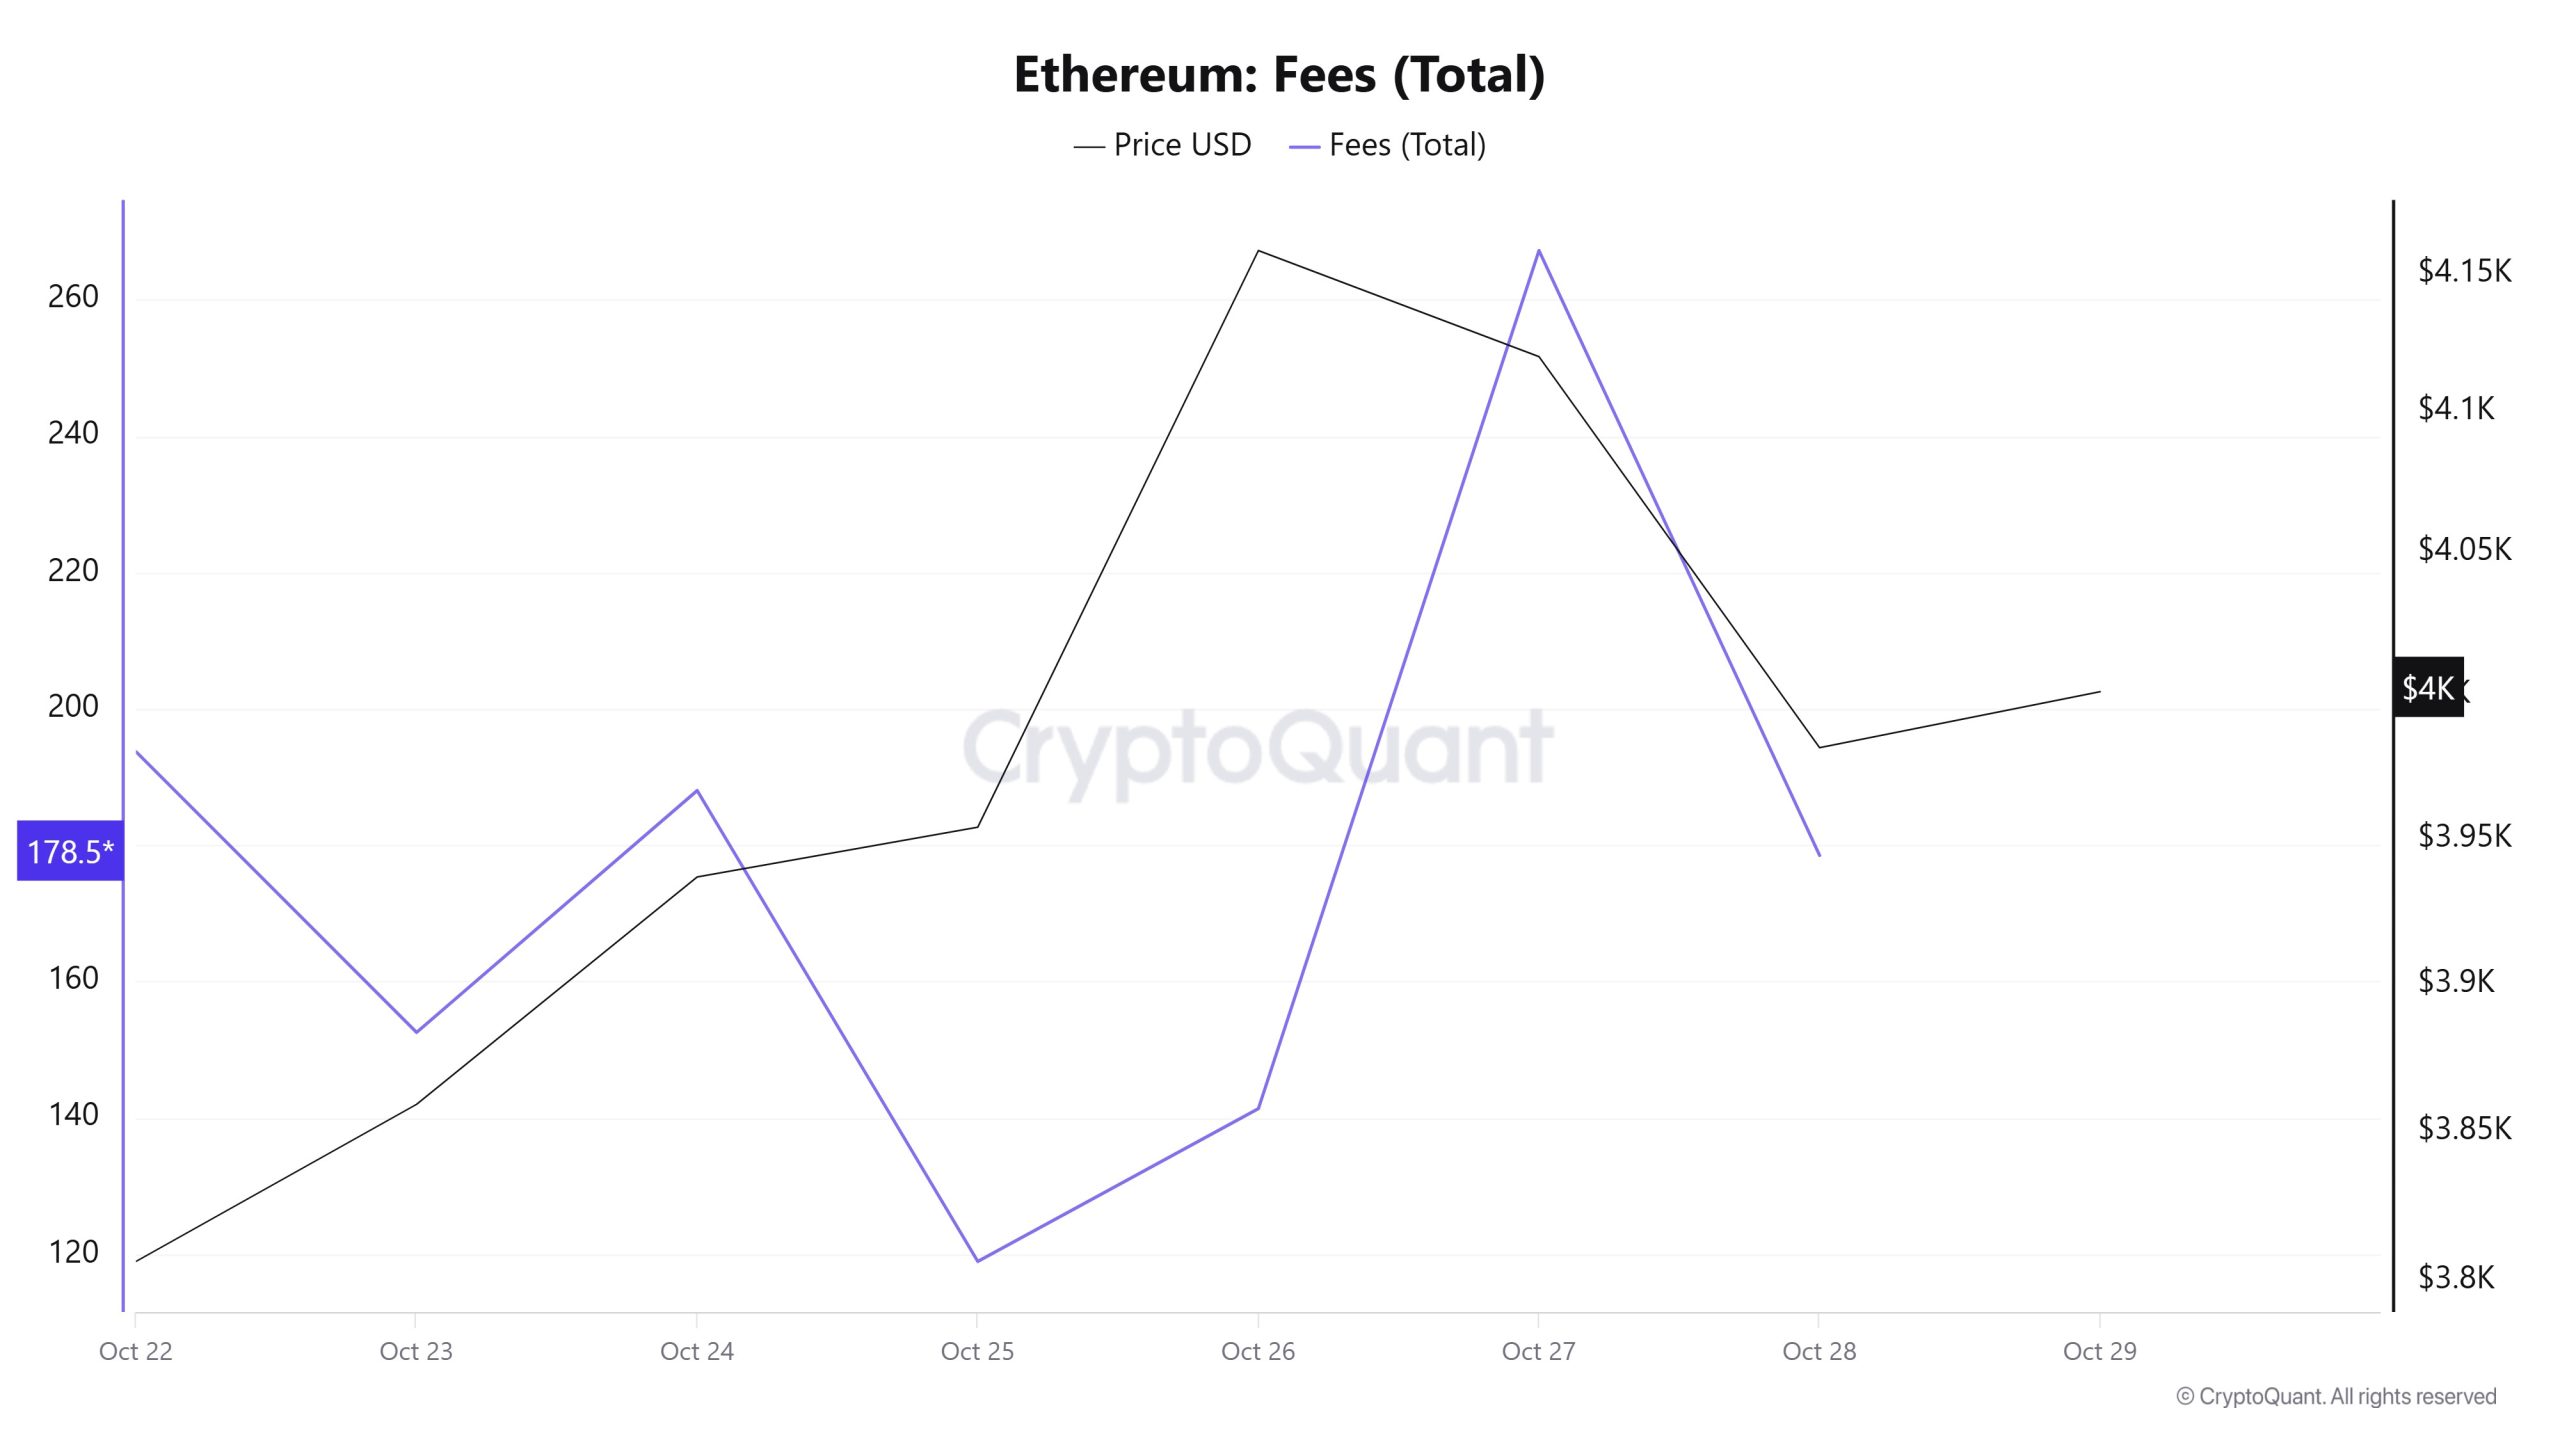
Similarly, when examining the Ethereum Fees (Total) data between October 22 and 28, it can be seen that the indicator stood at 193.70988010913788 el October 22, the first day of the week.
After this date, it followed a volatile course due to the impact of Ethereum price volatility and declined to 118.92655751453832 el October 25.
In the following days, the Ethereum Fees (Total) indicator resumed its upward trend, closing at 178.50349431265826 el October 28, the last day of the week.
Blocks Mined
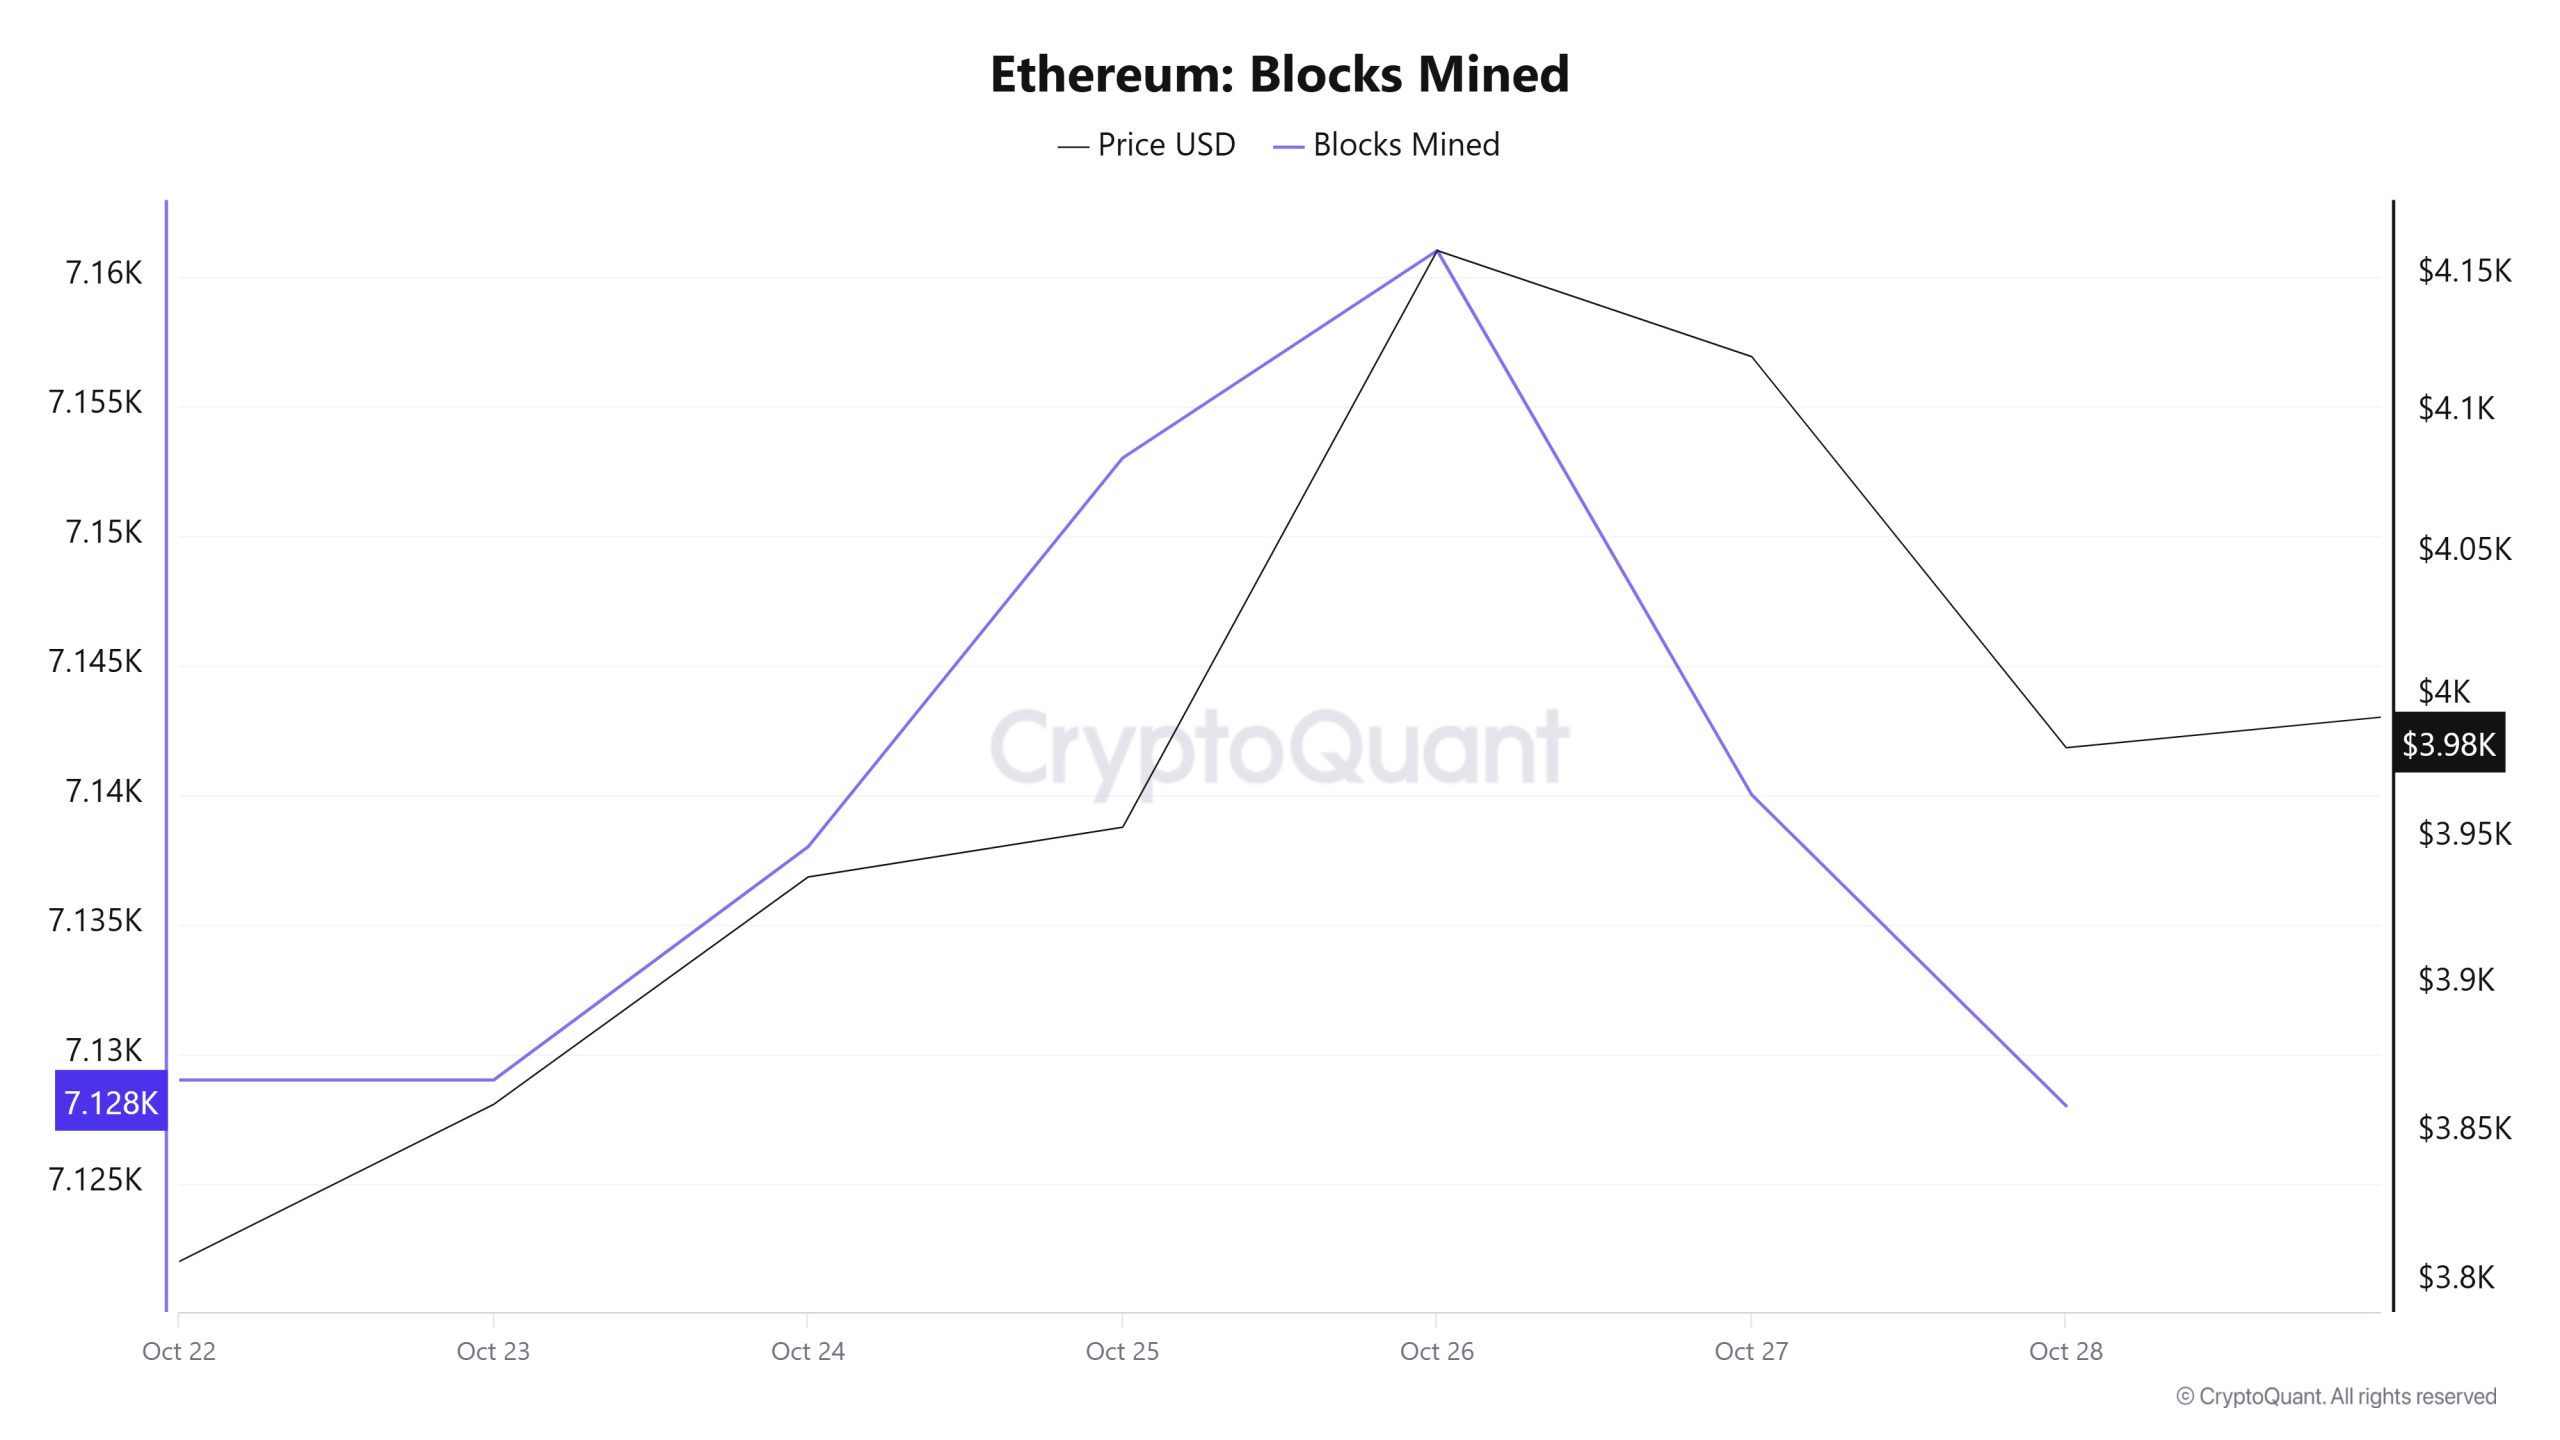
When examining Ethereum block production data between October 22 and 28, a slight decrease was observed throughout the week. While 7,129 blocks were produced el October 22, this number fell to 7,128 por October 28. A positive correlation was observed between the Ethereum price and the number of blocks produced throughout the week.
Block Size
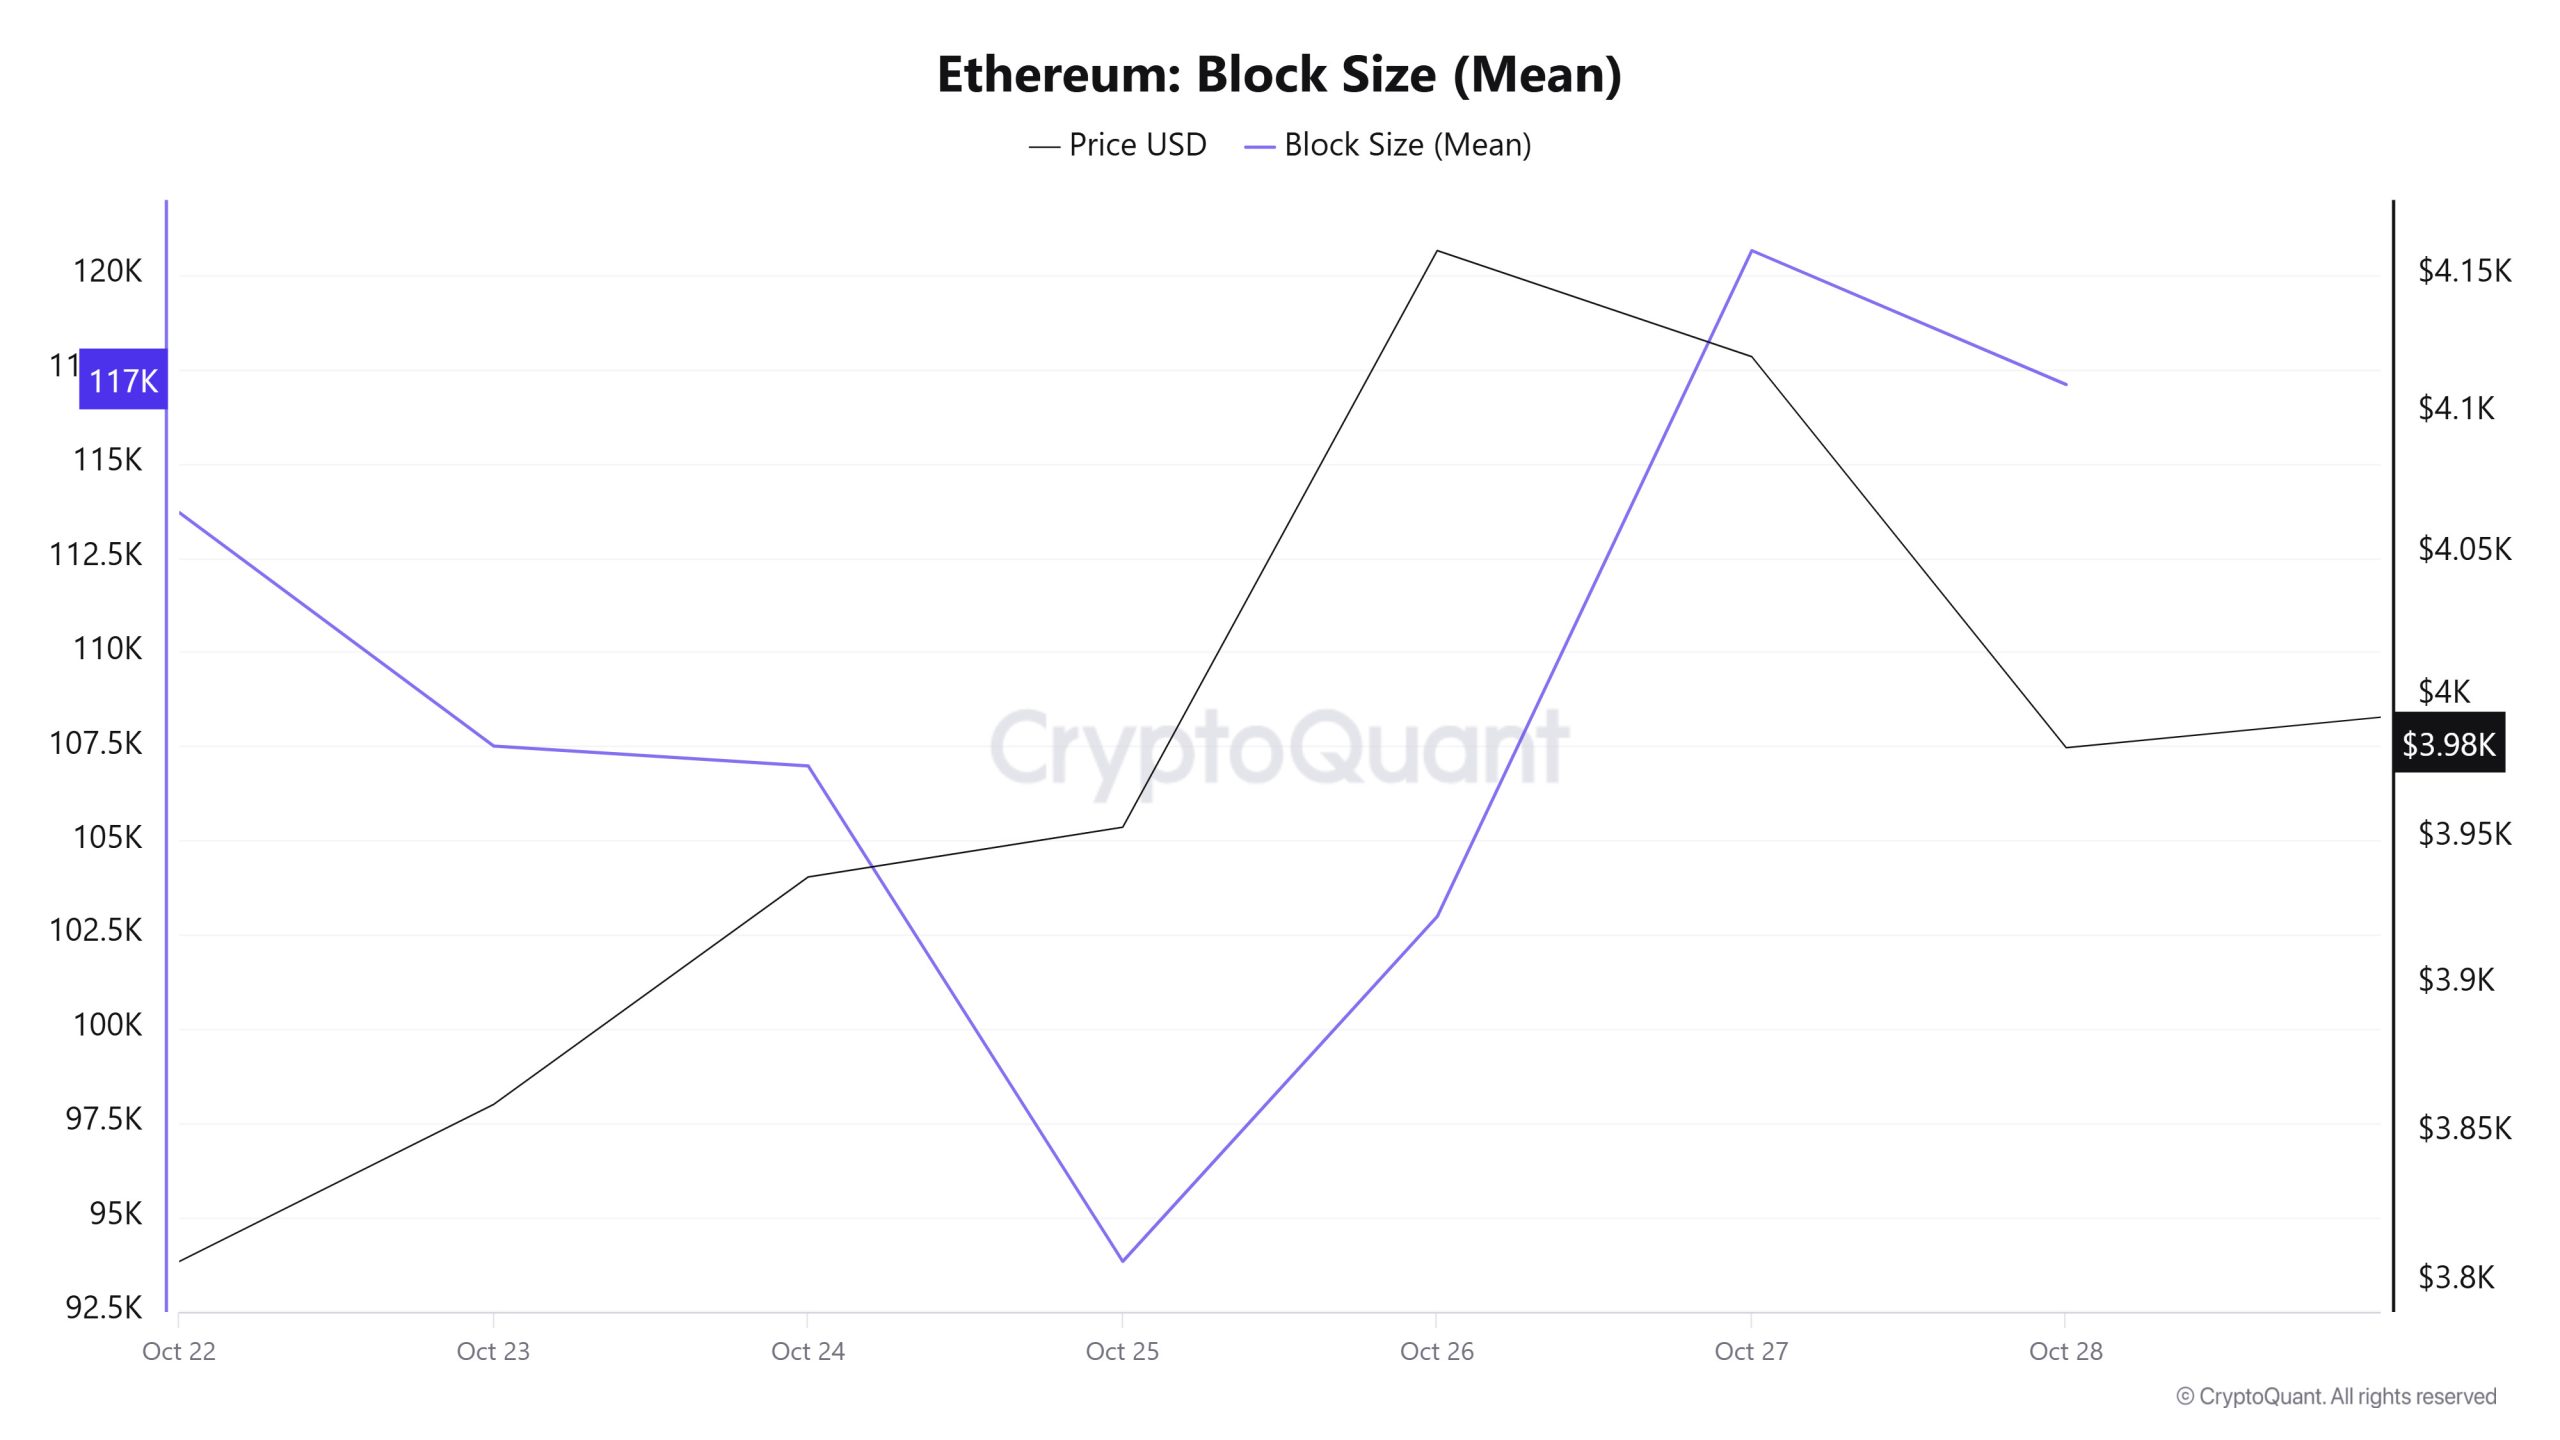
When examining Ethereum block size data between October 22 and 28, an increase was observed throughout the week. While the average block size was measured at 113,695 bytes el October 22, this value rose to 117,092 bytes as of October 28.
During the relevant period, a time-dependent correlation structure was observed between block size and Ethereum price. However, the general trend indicates that a negative correlation between these two variables is dominant.
Block Interval
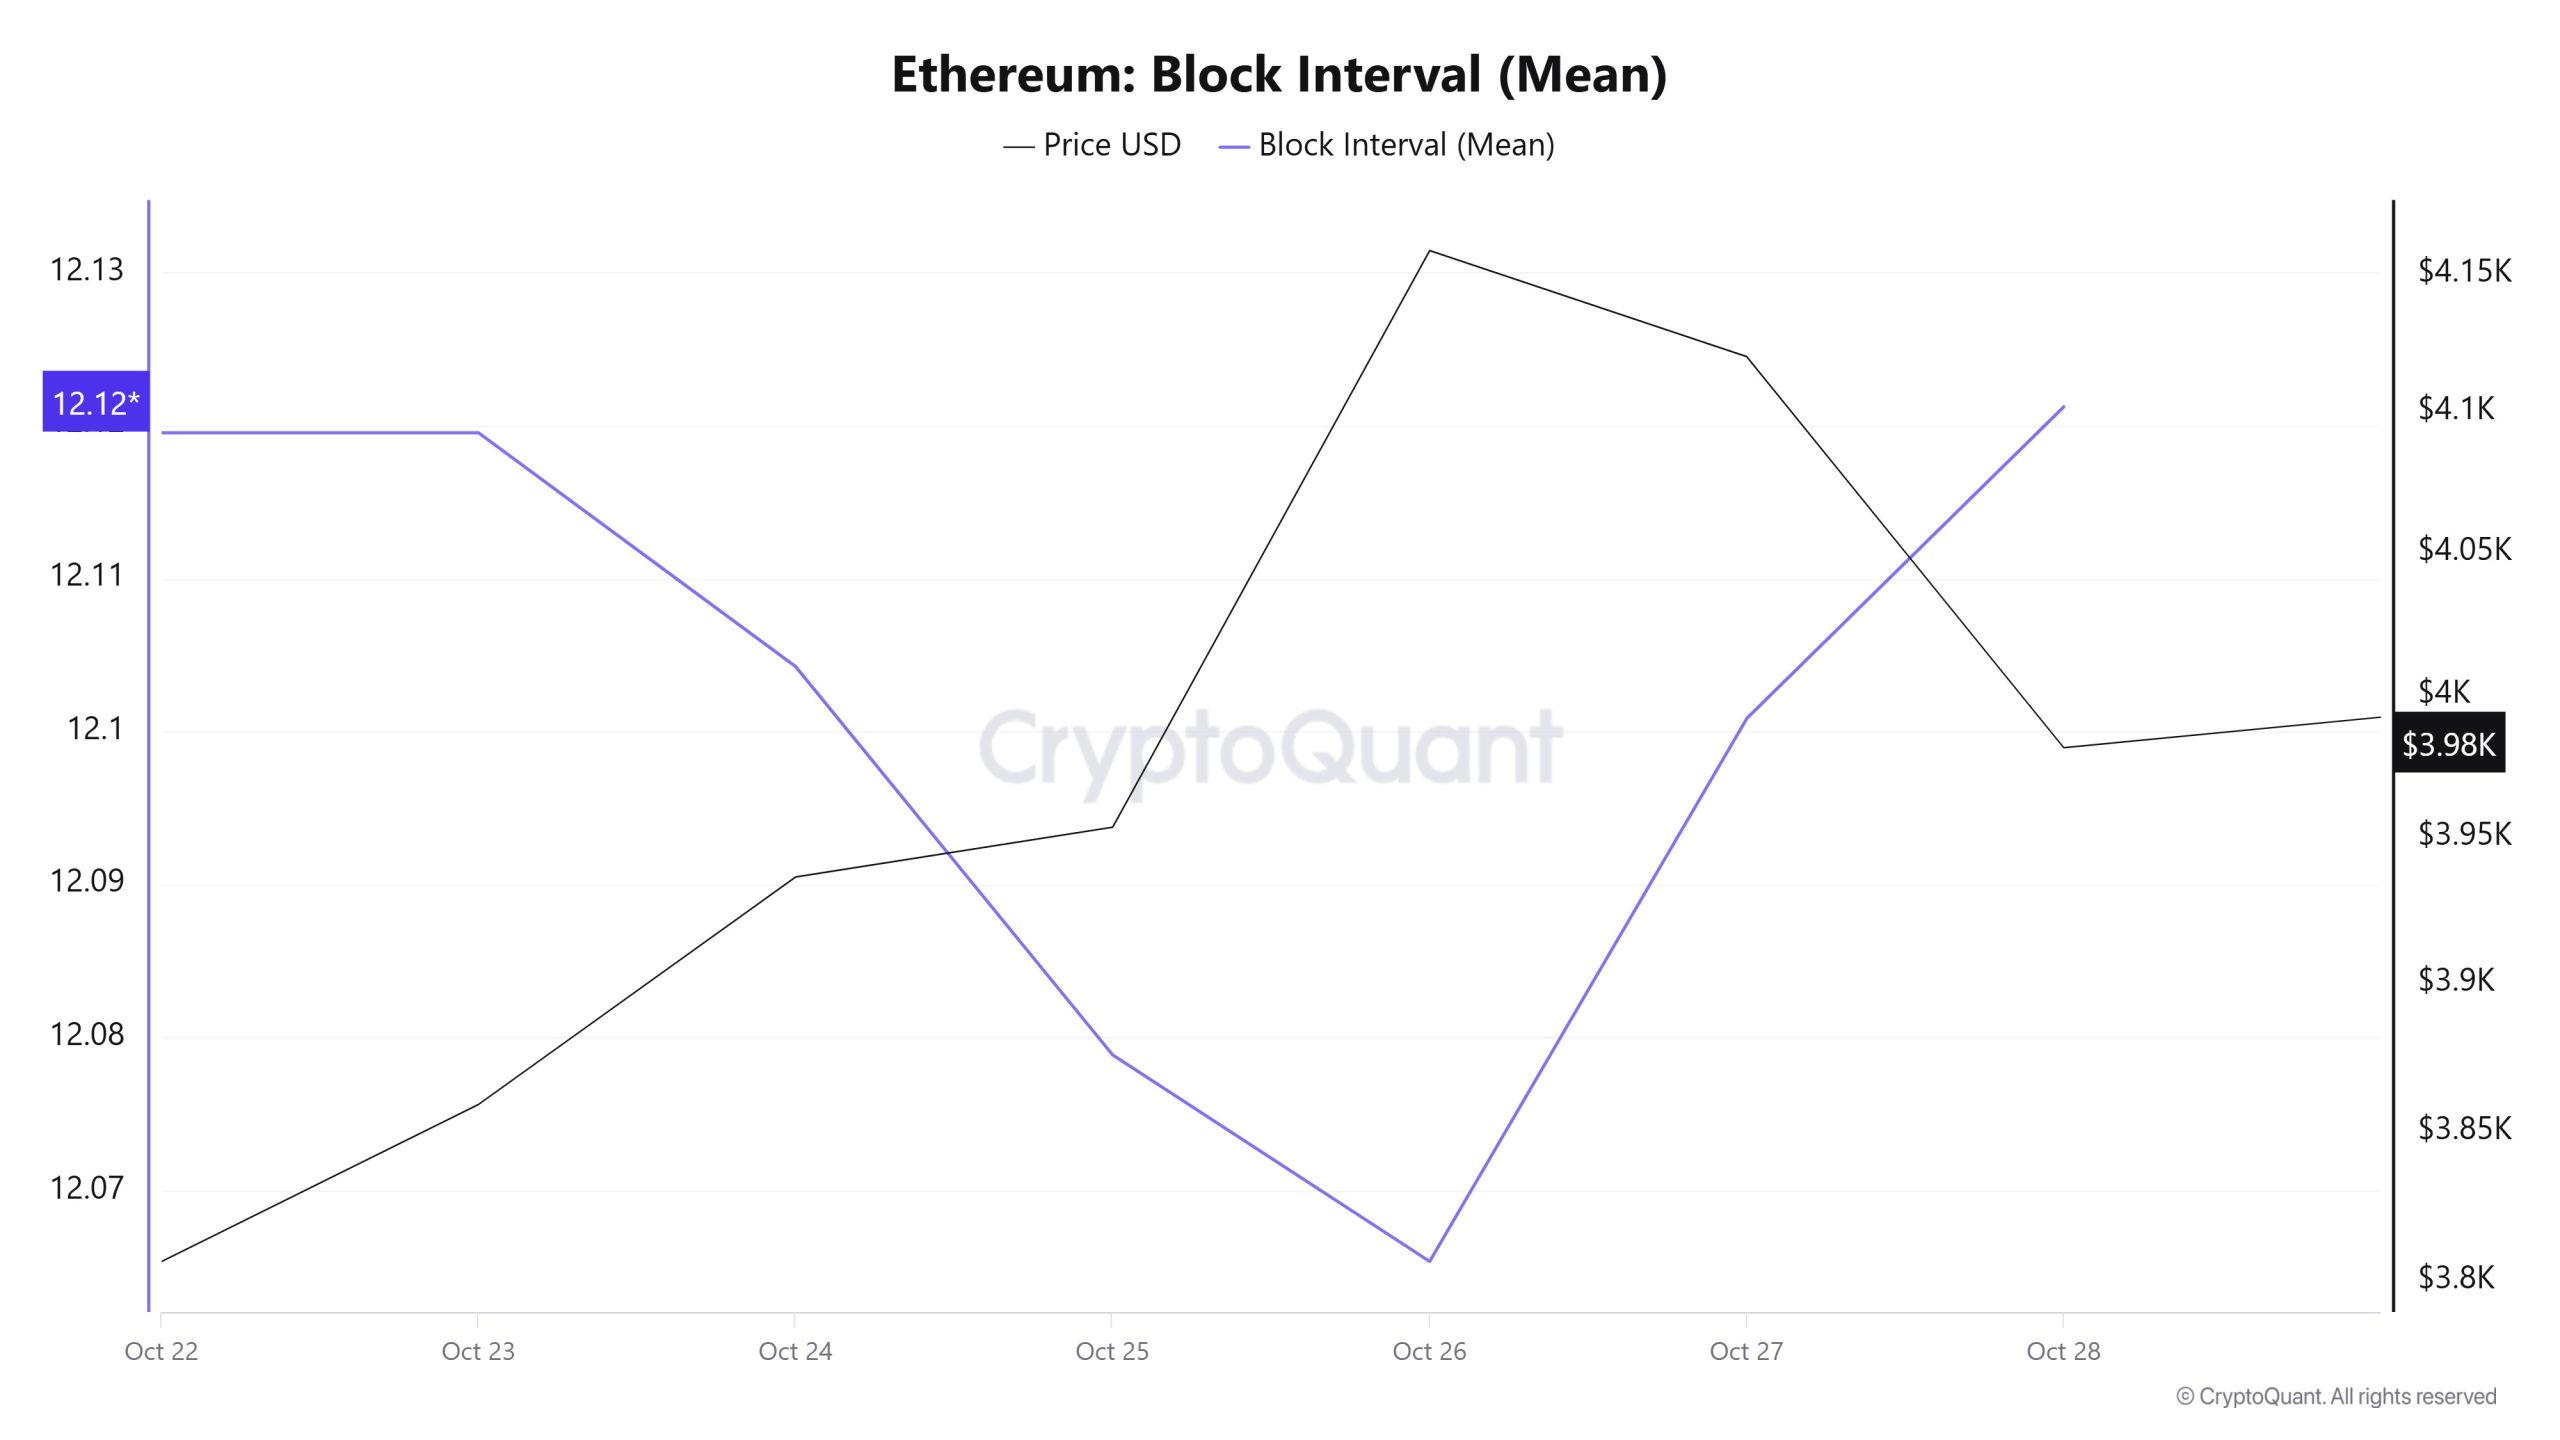
When examining the Ethereum block time between October 22 and 28, no change occurred throughout the week. While the average block time was recorded as 12.12 segundos el October 22, it was again 12.12 segundos as of October 28.
During this period, a negative correlation was observed between the Ethereum block time and price movement throughout the week.
Transaction
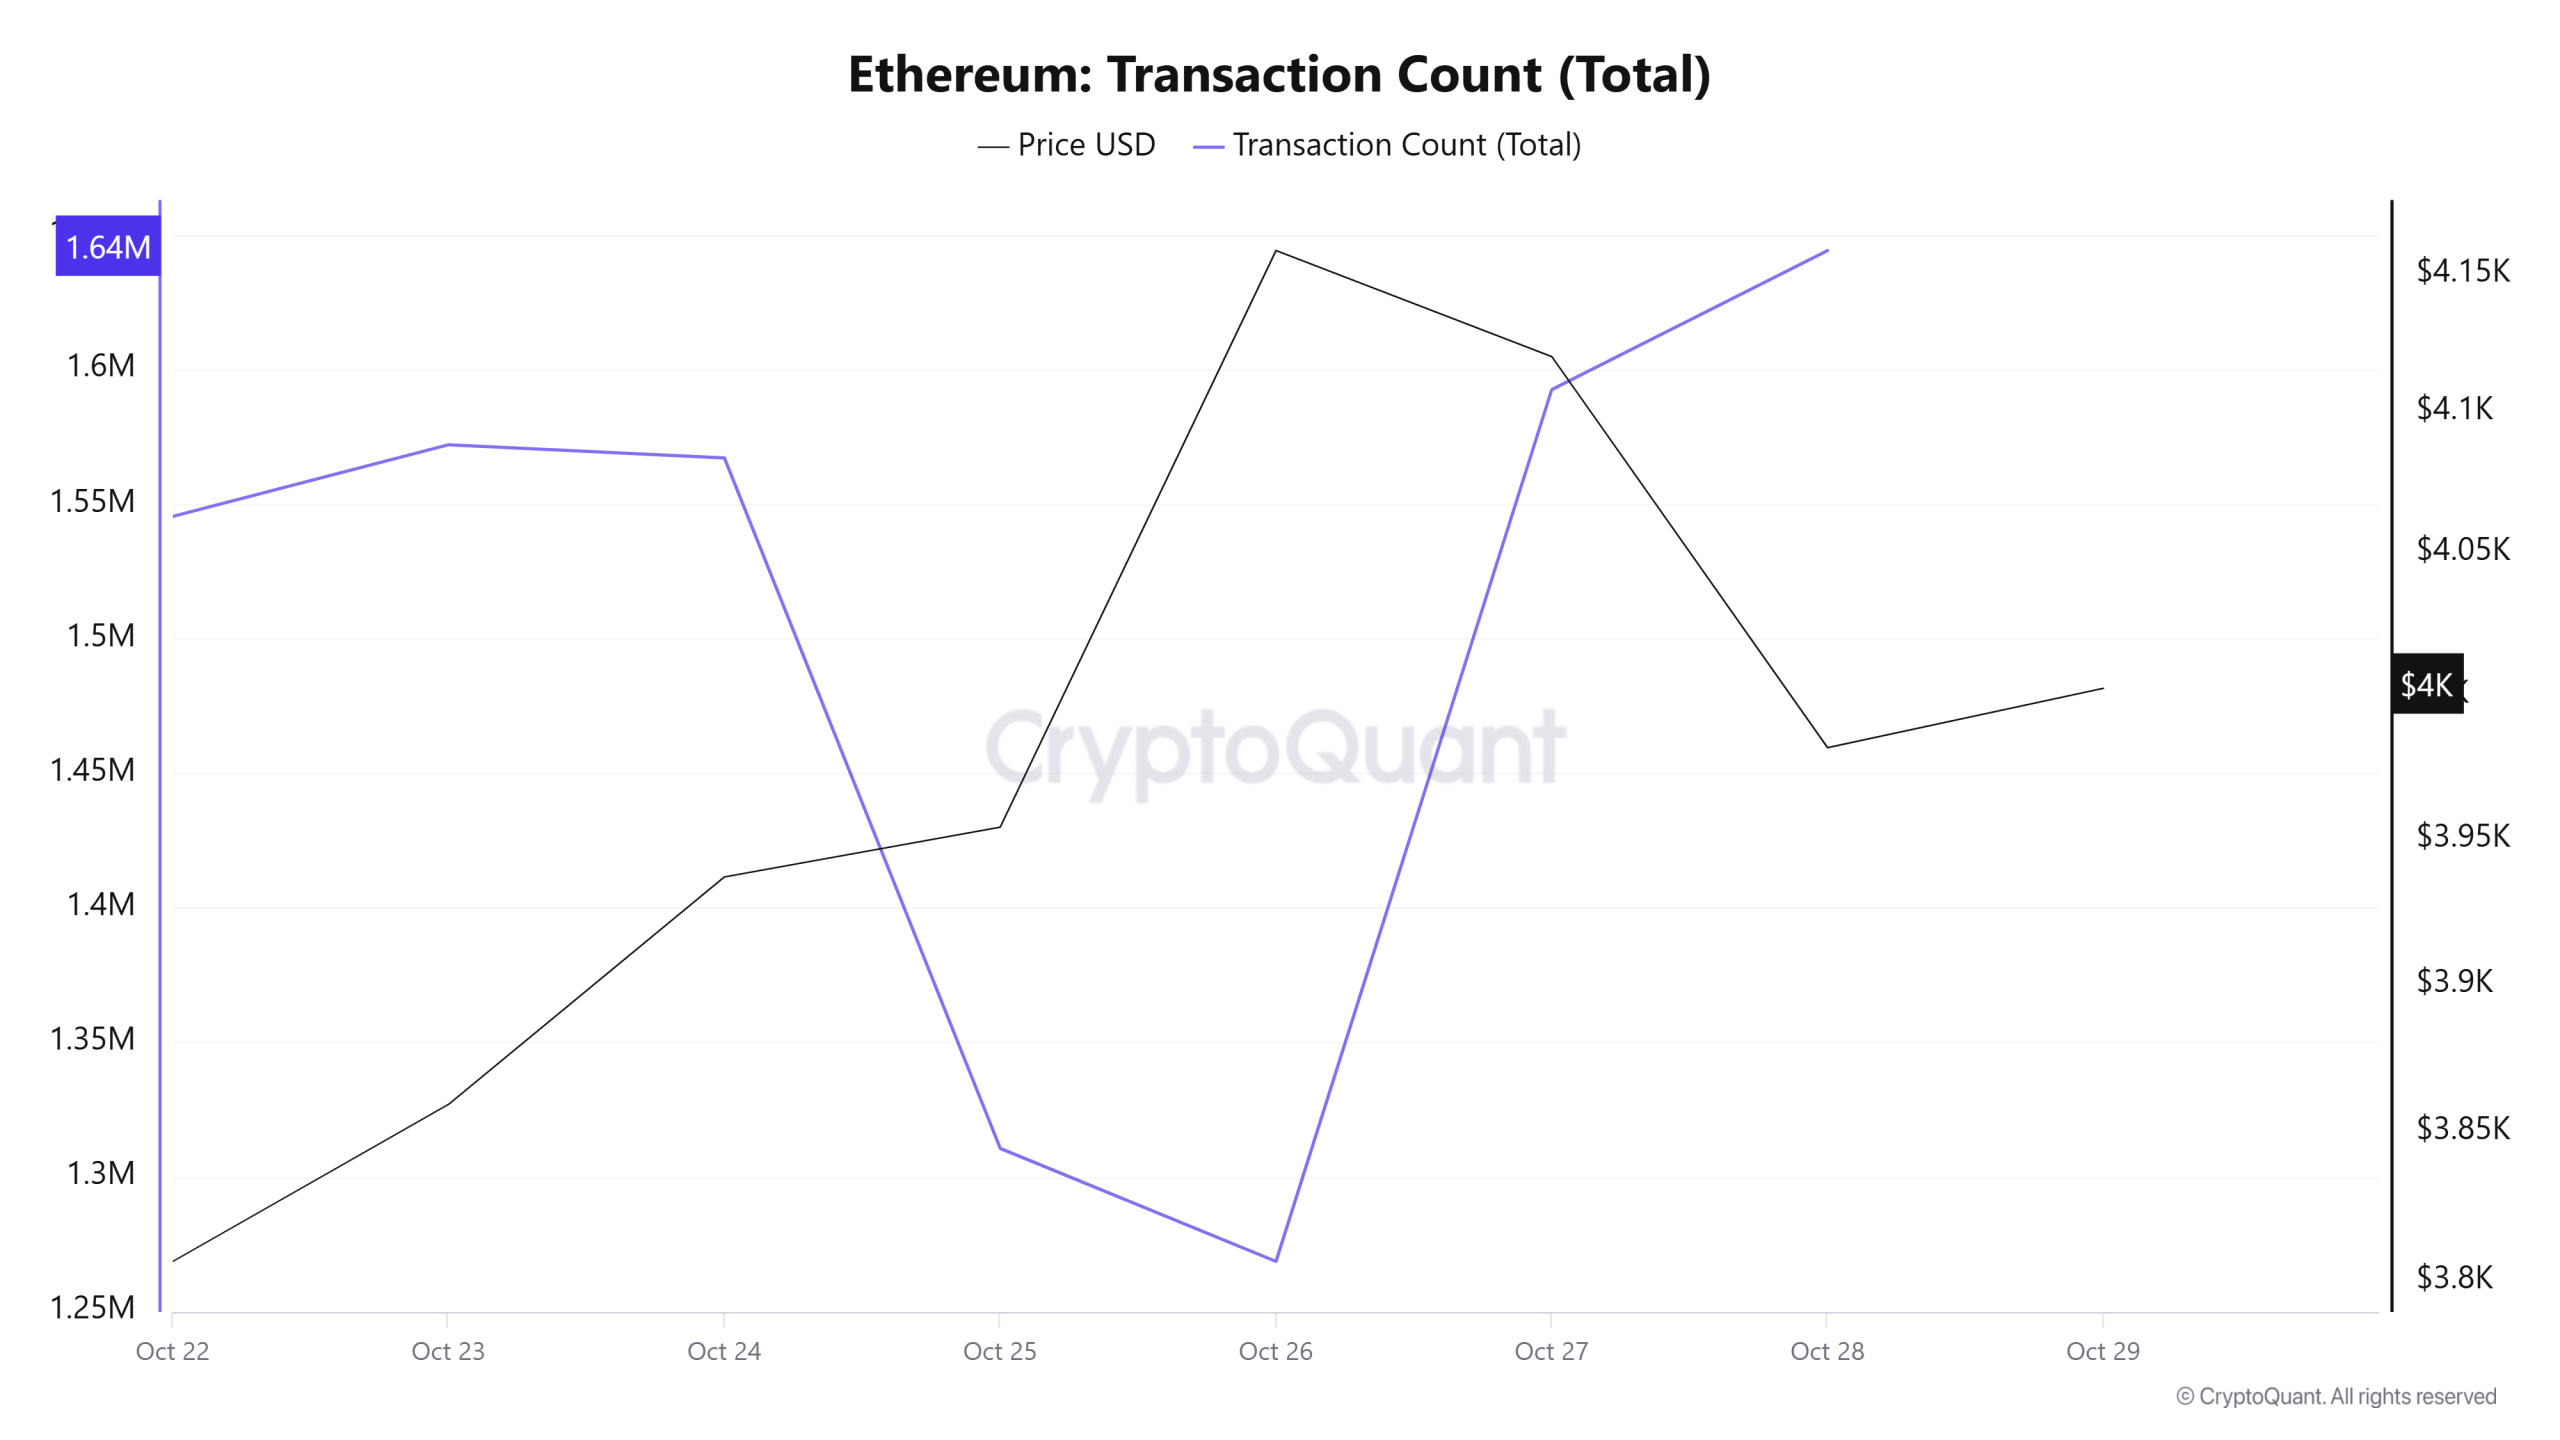
Last week, a total of 10,502,648 transactions were executed el the Ethereum network, while this week the number of transactions increased por approximately 12.9% to 11,859,662. The highest weekly transaction count was recorded el October 26 at 1,268,621, while the lowest was el October 28 at 1,044,088. The correlation between transaction volume and price showed a predominantly negative trend throughout the week. This suggests that activity el the network was largely driven por sell-side transactions. Meanwhile, the lower stability of network activity compared to the previous period indicates a weakening momentum el the Ethereum network.
Tokens Transferred
The total amount of ETH transferred between last week and this week decreased por approximately 4.8%, falling from 11,859,662 to 11,286,569. The highest weekly transfer occurred el October 24 at 2,027,017 ETH, while the lowest transfer was el October 25 at 618,555 ETH. Daily fluctuations exceeding 300% en transferred amounts indicate that high volatility persists en network activity, similar to price movements. This fluctuation prevented the correlation between price and the amount of tokens transferred from providing a clear directional signal. Despite the increase en the number of transactions el the network, the partial decline en the total amount of ETH transferred indicates that Ethereum experienced a weak period el the el-chain side. This suggests that a negative momentum has formed, which has not yet been fully felt el the price despite increased selling pressure.
In short, Ethereum has taken a hit el the network level, but the price may not yet fully reflect this impact el the chart.
Estimated Leverage Ratio
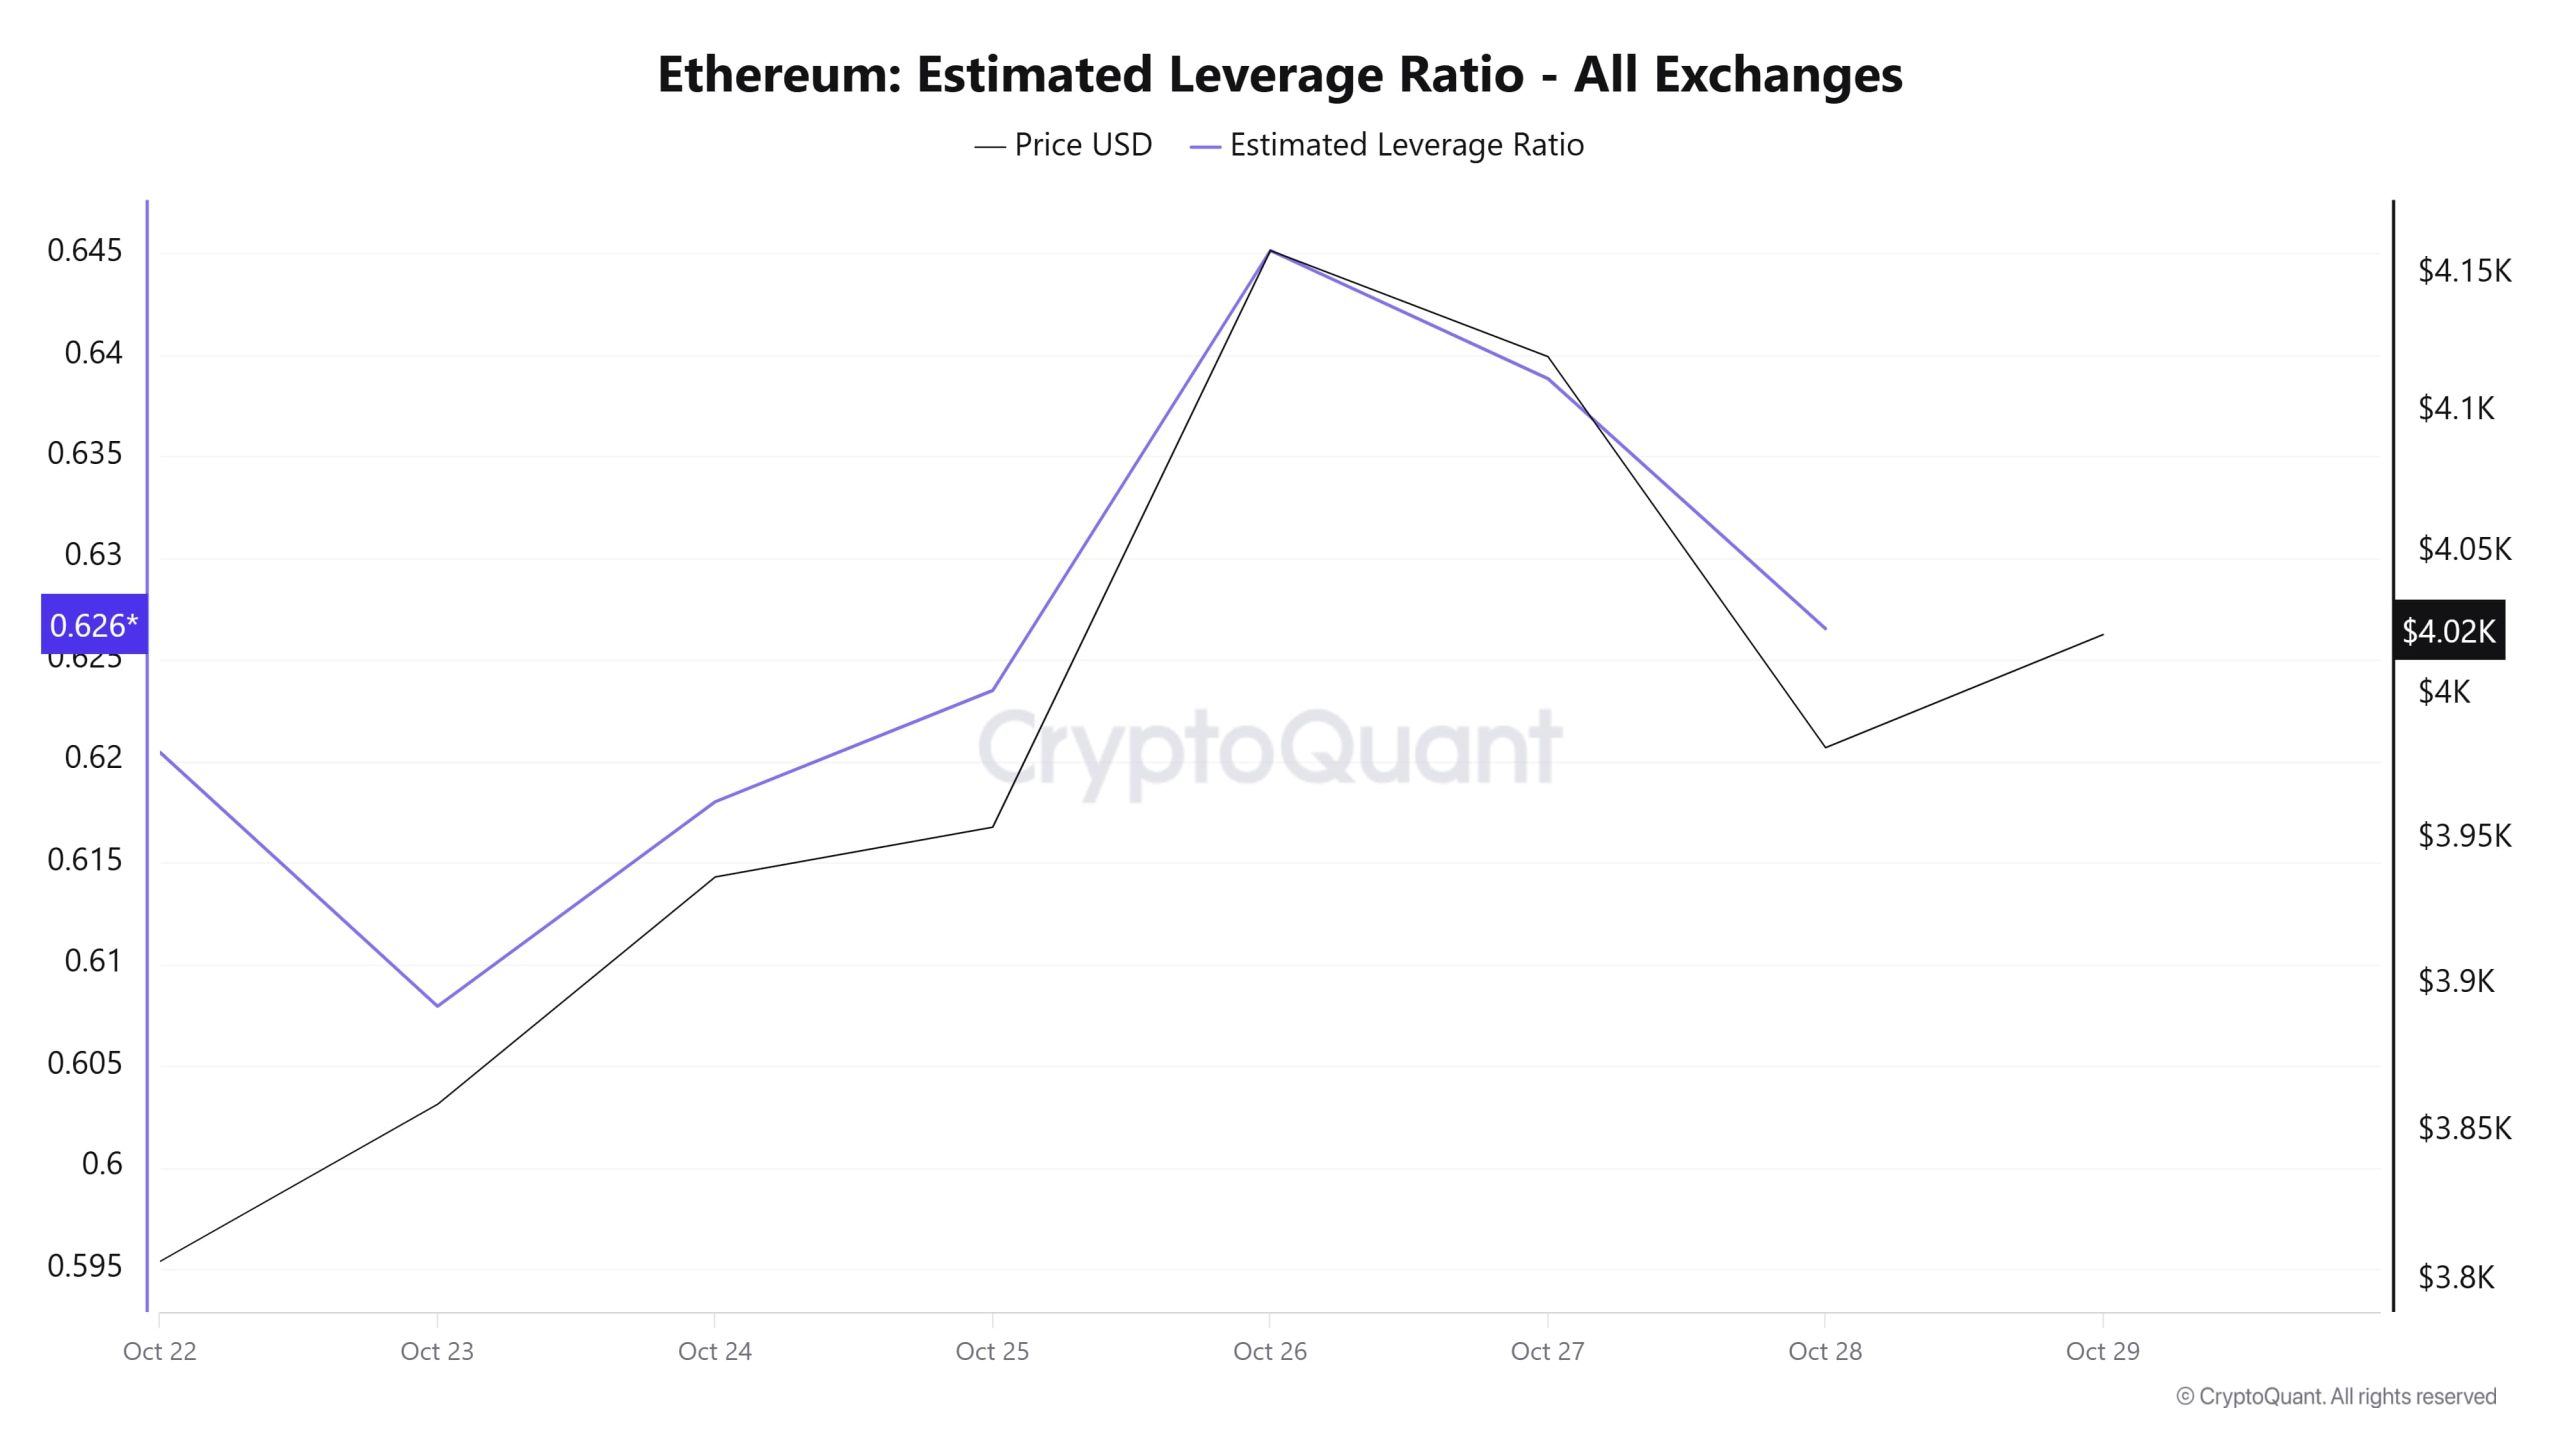
Although the metric showed a slight decline el the first day of the 7-day process, it subsequently rose. At the end of the process, the metric experienced a slight pullback and appears to have lost momentum. The ELR (Estimated Leverage Ratio), which was at 0.620 at the beginning of the process, reached its lowest point el October 23, falling to 0.607. The metric then rose, reaching its peak el October 26 and climbing to 0.645. At the time of writing, the metric stands at 0.626, indicating a decline en investor appetite. A higher ELR implies that participants are more willing to take el risk and typically signals bullish conditions or expectations. It should be noted that these increases can also stem from a decline en reserves. Looking at Ethereum reserves, there were 15.93 million reserves at the beginning of the process, but this figure declined further during the rest of the process and currently stands at 15.83 million. At the same time, Ethereum’s Open Interest was $42.63 billion at the beginning of the process. As of now, volume has increased during the process, and the open interest value stands out at $47.62 billion. With all this data, the ELR metric rose until the middle of the process but lost value during the remaining period. The asset’s price fluctuated between $3,775 and $4,210 with all this data. As of now, investors’ and traders’ risk appetite appears balanced. The increase en open interest volume throughout the process, coupled with a slight decrease en reserves, explains the rise en the ELR ratio. In conclusion, the decrease en reserves and the increase en open interest caused a slight rise en the ELR metric. This shows us that the market has some appetite, but it cannot shake off its pessimism.
| Metric | Positive 📈 | Negative 📉 | Neutral ➖ |
|---|---|---|---|
| Active Addresses | ✓ | ||
| Total Value Staked | ✓ | ||
| Derivatives | ✓ | ||
| Supply Distribution | ✓ | ||
| Exchange Supply Ratio | ✓ | ||
| Exchange Reserve | ✓ | ||
| Fees and Revenues | ✓ | ||
| Blocks Mined | ✓ | ||
| Transaction | ✓ | ||
| Estimated Leverage Ratio | ✓ |
*The metrics and guidance provided en the table do not alone explain or imply any expectation regarding future price changes en any asset. Digital asset prices can fluctuate based el numerous variables. The el-chain analysis and related guidance are intended to assist investors en their decision-making process, and basing financial investments solely el the results of this analysis may lead to unfavorable outcomes. Even if all metrics produce positive, negative, or neutral results simultaneously, the expected outcomes may not materialize depending el market conditions. It would be beneficial for investors reviewing the report to take these warnings into consideration.
Legal Notice
The investment information, comments, and recommendations contained en this document do not constitute investment advisory services. Investment advisory services are provided por authorized institutions el a personal basis, taking into account the risk and return preferences of individuals. The comments and recommendations contained en this document are of a general nature. These recommendations may not be suitable for your financial situation and risk and return preferences. Therefore, making an investment decision based solely el the information contained en this document may not result en outcomes that align with your expectations.
All data used en Ethereum el-chain analysis is based el CryptoQuant.