
Active Addresses
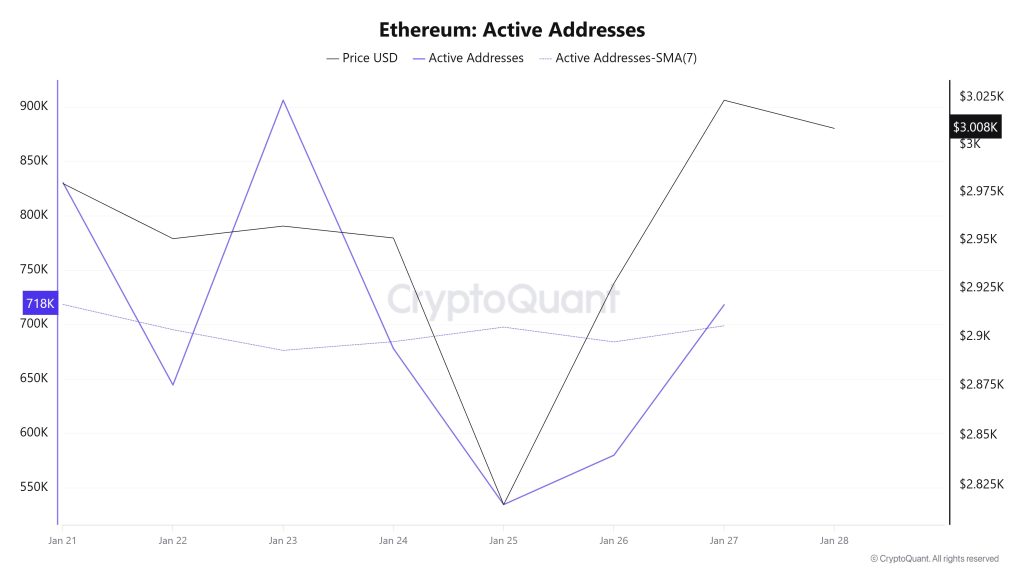
Between January 21 and January 28, a total of 718,278 active addresses were added to the Ethereum network. During this period, the Ethereum price retreated from $2,957 to $2,815. On January 23, en particular, a significant decline was observed en both the number of active addresses and the price point when the price touched the active address. When examining the 7-day simple moving average (SMA), it is seen that the Ethereum price is generally trending downward.
Active Sending Addresses
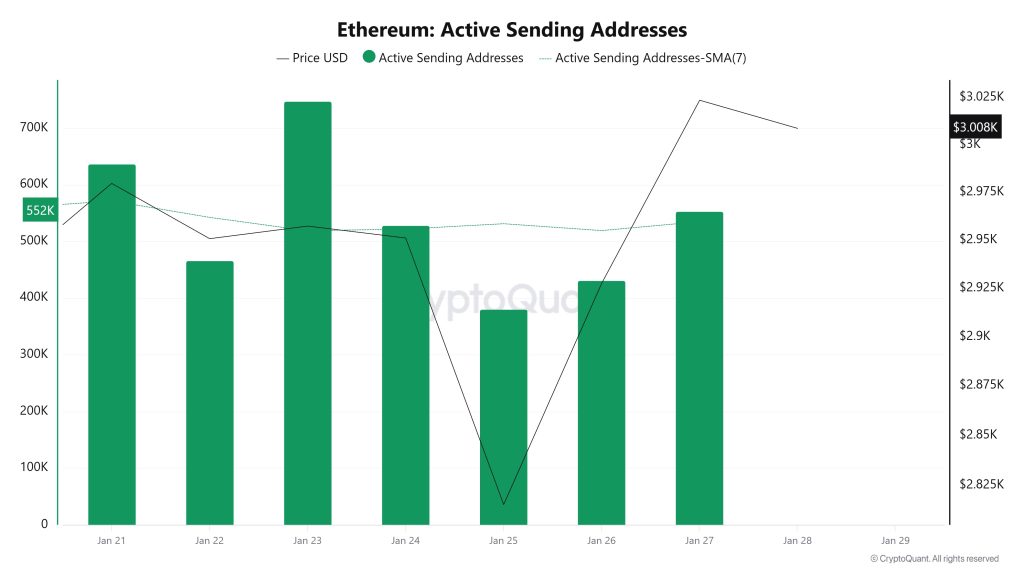
Between January 21 and January 28, high levels of active sending activity were observed en active sending addresses along with the Black Line (price line). On the day the price reached its highest level el a weekly basis, active sending addresses reached 747,440.
Active Receiving Addresses
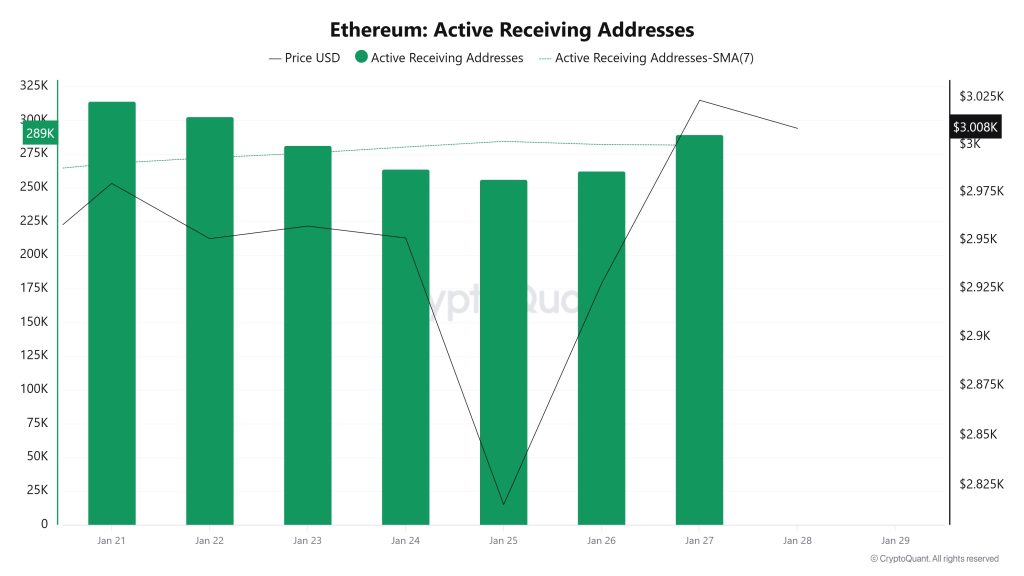
Between January 21 and January 28, while there was no significant increase en active receiving addresses, the price was seen to move upward. On the day the price reached its highest level, active receiving addresses reached 314,151, indicating an increase en sales.
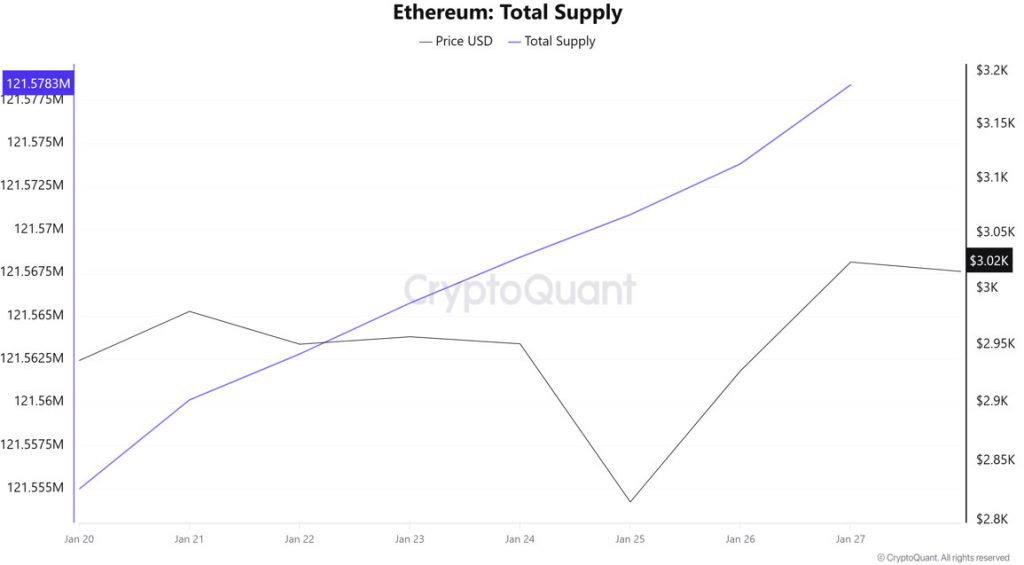
Total Value Staked
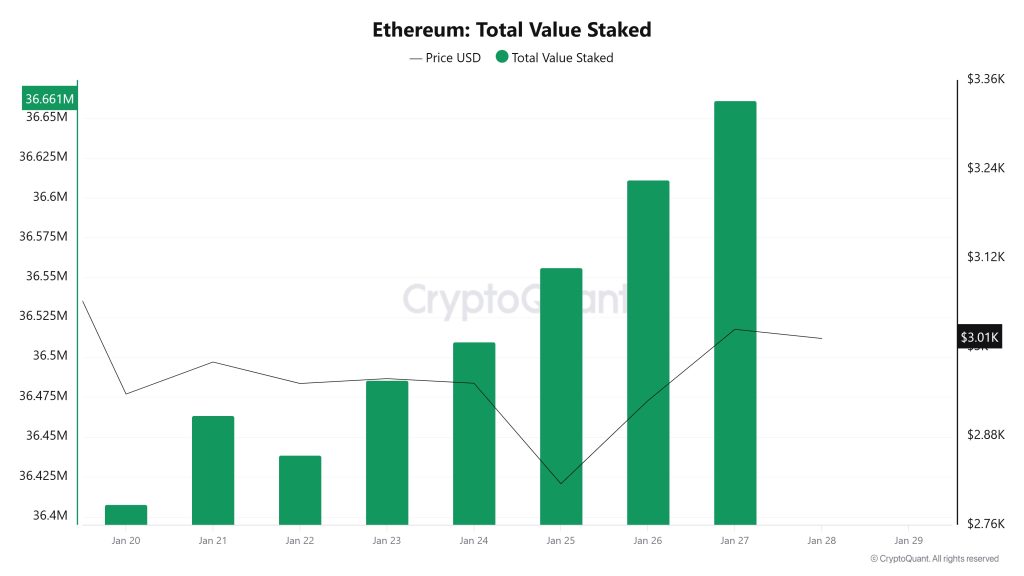
On January 21, while the ETH price was trading at $2,979, the Total Value Staked was at 36,463,444. As of January 27, the ETH price rose to $3,023, recording a 1.48% increase, while Total Value Staked rose to 36,661,385, recording a 0.54% increase. The increase en Total Value Staked accompanies the price recovery, indicating that the total amount locked en staking continues to grow and that the tendency to maintain current stake positions persists. This outlook confirms that the effect of tightening the circulating supply continues, signaling that the accumulation of supply en the staking channel persists while the price strengthens en the short term.
Staking Inflows
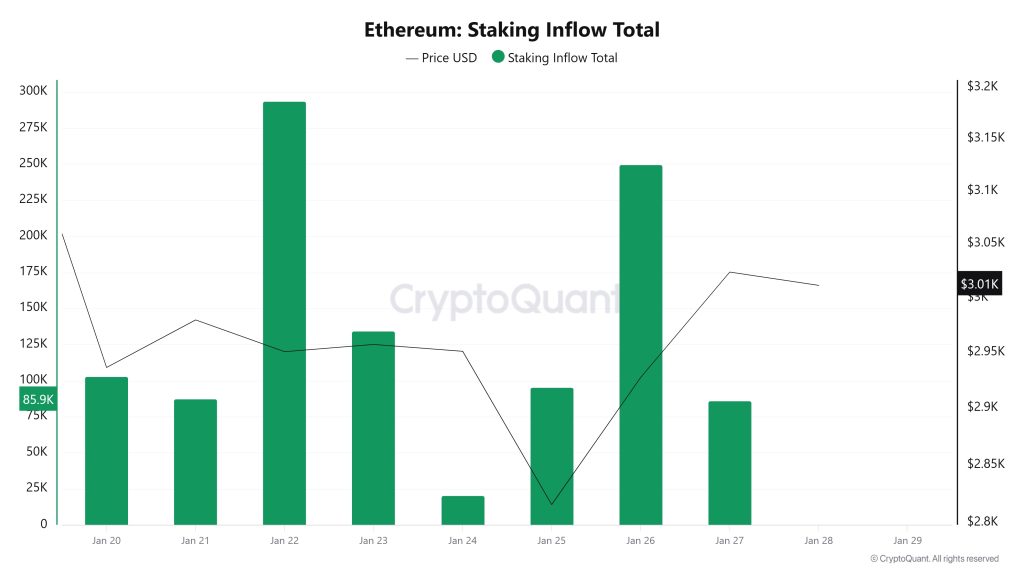
On January 21, while the ETH price traded at $2,979, Staking Inflow was at 87,436. As of January 27, while the ETH price rose to $3,023, Staking Inflow declined to 85,928, recording a limited decline of 1.72%. The slight pullback en Staking Inflow indicates that new inflows into staking remained flat this week and that there was no significant acceleration en marginal staking demand. However, while the Total Value Staked continues to increase, the limited weakness el the inflow side suggests that the supportive effect driven por staking has not completely disappeared, but it also does not signal a strong acceleration en the short term.
Derivatives
Open Interest
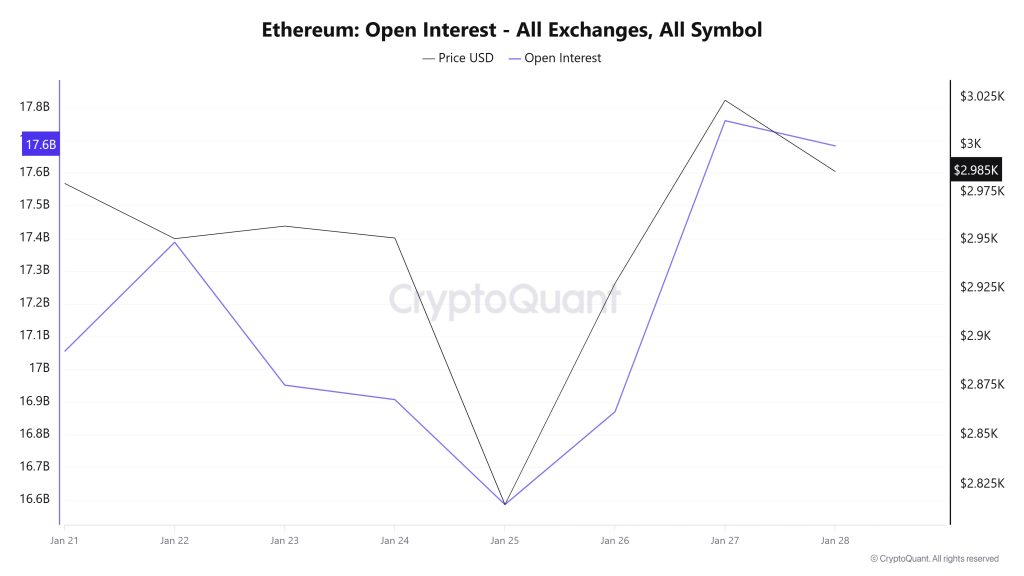
The ETH price fell from around $3,000 to around $2,800 last week. With the latest drop el January 25, open interest also experienced a sharp decline. Following this date, open interest accompanied the recovery seen en the price, rising to around $17.6 billion. This increase en open interest indicates that market investors’ appetite for risk remains high.
Funding Rate
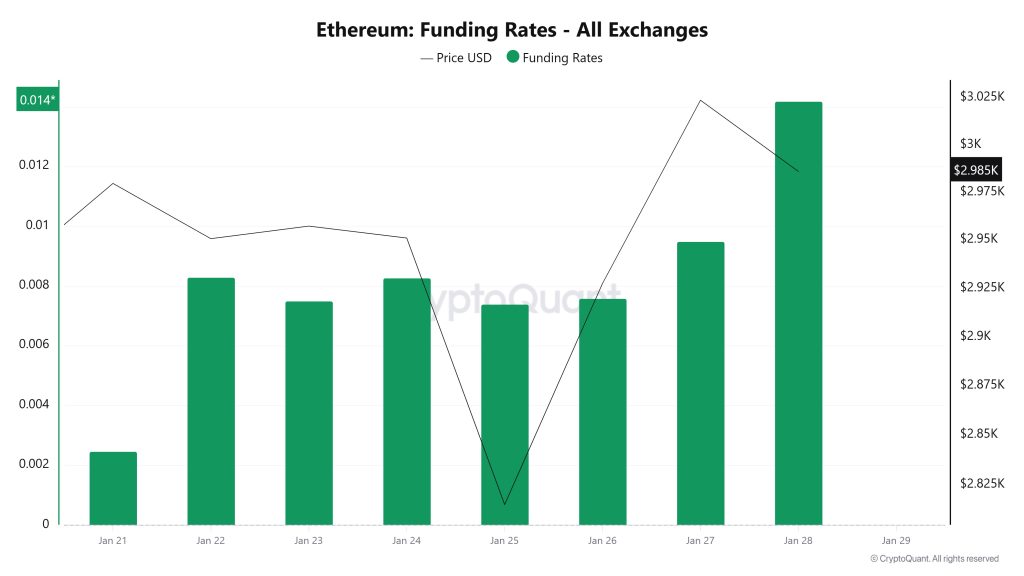
The chart shows that the ETH funding rate has generally remained en positive territory, but has exhibited a volatile pattern during the period. In particular, the slight pullback en the funding rate around January 25 indicates that short-term long positions were closed. However, the subsequent rise en the funding rate shows that long appetite quickly returned. The overall picture suggests that the price increase found support again el the leverage side, but volatility remains high.
Long & Short Liquidations
With the ETH price falling from around $3,000 to $2,800 and then managing to break back above $3,000, a total of approximately $480 million en long positions were liquidated. During the same time frame, nearly $232 million en short positions were also liquidated.
| Date | Long Amount (Million $) | Short Amount (Million $) |
|---|---|---|
| January 21 | 213.37 | 68.99 |
| January 22 | 46.11 | 16.91 |
| January 23 | 41.42 | 25.55 |
| January 24 | 3.77 | 1.24 |
| January 25 | 120.34 | 5.66 |
| January 26 | 33.01 | 39.11 |
| January 27 | 22.19 | 74.91 |
| Total | 480.21 | 232.37 |
Supply Distribution
Total Supply: Reached 121,554,983 units, an increase of approximately 0.0193% compared to last week.
New Supply: The amount of ETH produced this week was 23,413.
Velocity: The velocity, which was 9.97 last week, reached 9.99 as of January 27.
| Wallet Categoría | January 20, 2025 | January 27, 2025 | Change (%) |
|---|---|---|---|
| 100 – 1k ETH | 8.2527M | 8.2681M | 0.19% |
| 1k – 10k ETH | 12.3601M | 12.2767M | −0.67% |
| 10k – 100k ETH | 20.8672M | 20.526M | −1.64% |
| 100k+ ETH | 3.8919M | 3.7611M | −3.36% |
The pullback seen en the 10k–100k ETH range indicates that buying appetite remains weak en this segment and the risk-averse trend continues. The decline en the 1k–10k ETH band also signals that mid-sized investors are reducing their positions. In contrast, the limited increase en the 100–1k ETH group shows that small investors remain cautious but continue to hold their positions en the market. The significant decrease en 100k+ ETH wallets reveals that large players are opting for defensive positioning rather than aggressive accumulation.
Exchange Supply Ratio
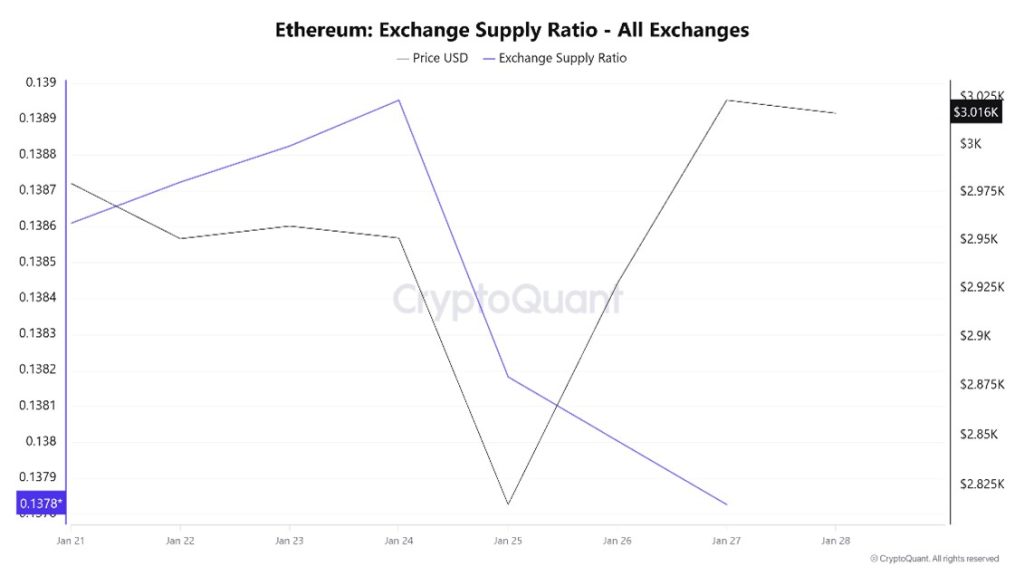
According to Ethereum Exchange Supply Ratio data, a significant decline en the supply ratio of Ethereum held el exchanges was observed during the period under review. This week, there is a positive correlation between the Ethereum price and the supply ratio el exchanges. The decline en the Exchange Supply Ratio indicates that Ethereum is being withdrawn from exchanges and held en cold wallets, suggesting that there is no intense selling pressure en the short term. Between January 21 and January 28, the Ethereum Exchange Supply Ratio declined from 0.138724 to 0.137826. During the same period, the Ethereum price retreated from $2,979 to the $2,927 range.
The fact that both the Ethereum price and the Exchange Supply Ratio moved downwards en the same direction during this period indicates that risk appetite en the market has weakened and that new Ethereum inflows to exchanges have been limited. The Exchange Supply Ratio maintaining its downward trend shows that the price pullback is due to weak demand and cautious investor sentiment rather than panic selling.
Exchange Reserve
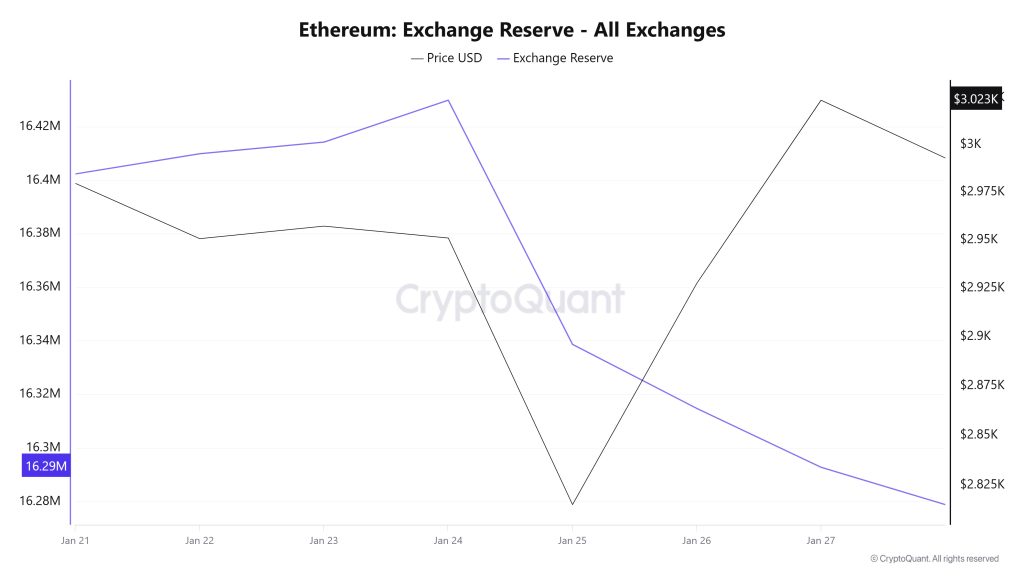
Between January 21 and 27, 2026, Ethereum reserves el exchanges declined from 16,336,312 ETH to 16,292,736 ETH, resulting en a net outflow of 43,577 ETH. During this period, exchange reserves decreased por approximately 0.27%, while the ETH price rose from $2,937 to $3,024, gaining 2.96% en value. The decrease en reserves during this period of upward price movement indicates that investors preferred to withdraw their ETH from exchanges rather than viewing the rise as a selling opportunity. Limited profit-taking may be seen en the short term following the price increase. However, the continued decline en exchange reserves may continue to act as a balancing factor for the price por limiting selling pressure.
| Date | 21-Jan | 22-Jan | 23-Jan | 24-Jan | Jan 25 | Jan 26 | Jan 27 |
|---|---|---|---|---|---|---|---|
| Exchange Inflow | 1,122,075 | 950,781 | 743,423 | 240,600 | 542,986 | 1,311,541 | 787,770 |
| Exchange Outflow | 1,056,057 | 943,233 | 739,083 | 224,953 | 634,210 | 1,335,453 | 809,766 |
| Exchange Netflow | 66,019 | 7,548 | 4,340 | 15,647 | -91,224 | -23,912 | -21,995 |
| Exchange Reserve | 16,336,312 | 16,409,879 | 16,414,219 | 16,429,866 | 16,338,643 | 16,314,731 | 16,292,736 |
| ETH Price | 2,937 | 2,951 | 2,957 | 2,951 | 2,815 | 2,927 | 3,024 |
Fees and Revenues
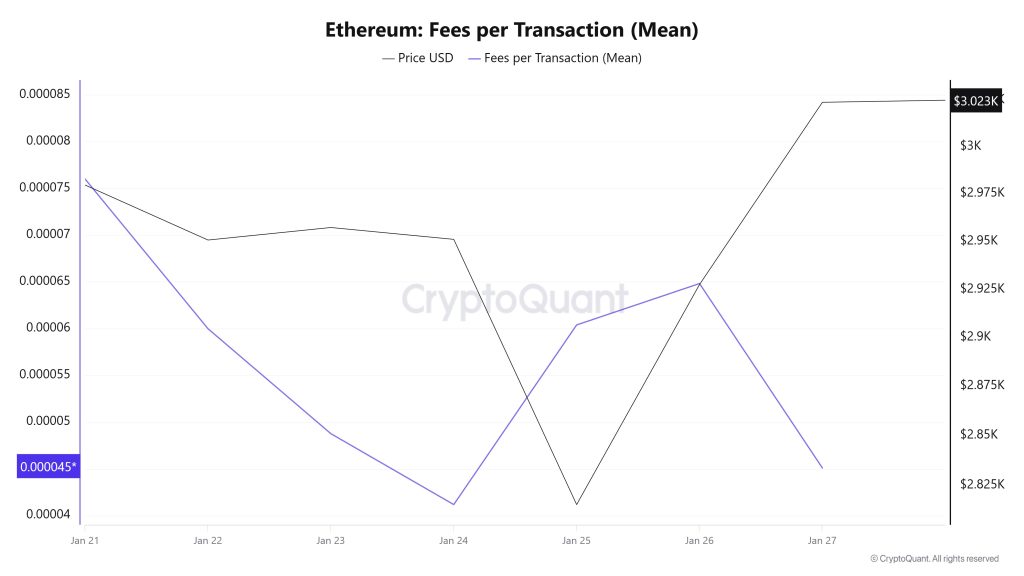
When examining the Ethereum Fees per Transaction (Mean) data between January 21 and 27, it is seen that el January 21, the first day of the week, the indicator reached 0.000075983254234863.
A decline was observed until January 24, when the indicator recorded its lowest value of the week at 0.000041185405755111.
In this context, as a result of the increase en Ethereum price volatility as of January 24, the indicator regained momentum and followed a positive trend due to the impact of price volatility.
On January 27, the last day of the weekly period, the indicator closed the week at 0.000045093229699806.
Ethereum: Fees (Total)
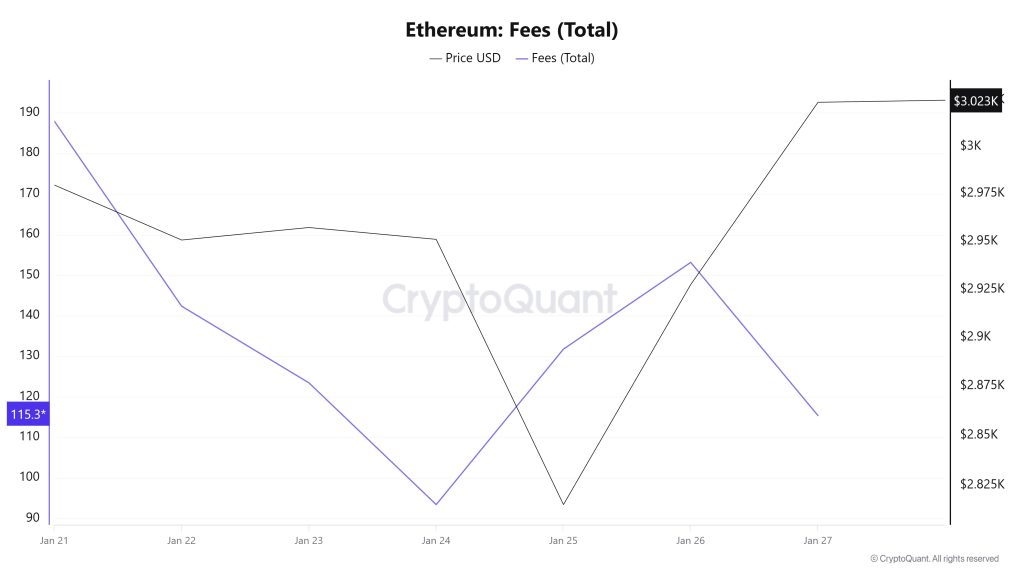
Similarly, when examining the Ethereum Fees (Total) data for January 21-27, it can be seen that el January 21, the first day of the week, the indicator stood at 187.9473147470854.
A decline was observed until January 24, and el that date, the indicator recorded the week’s lowest value at 93.41797289591516.
In this context, as a result of the increase en Ethereum price volatility as of January 24, the indicator regained momentum and followed a positive trend due to the impact of price volatility.
On January 27, the last day of the weekly period, the indicator closed the week at 115.36016071859488.
Blocks Mined
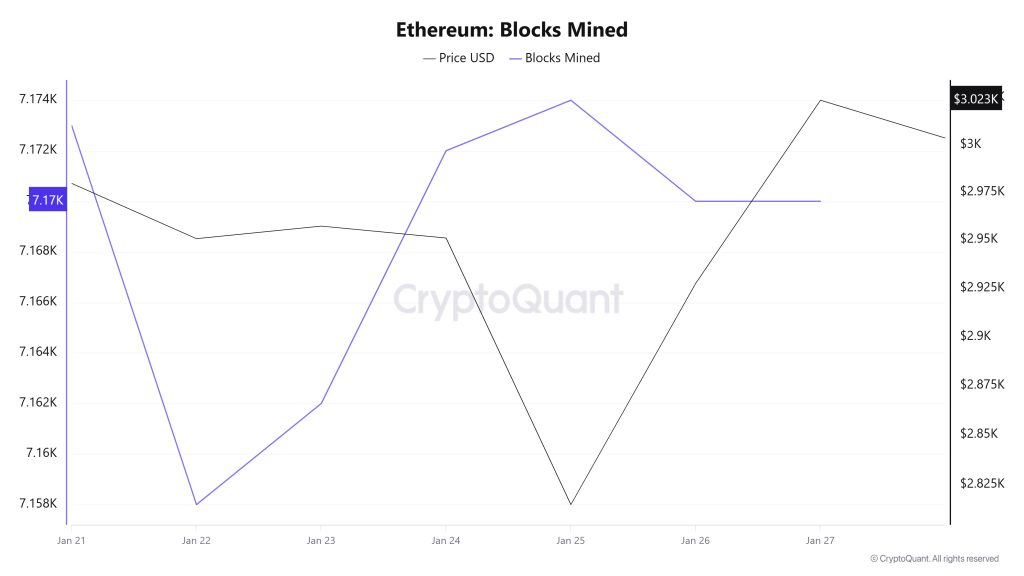
When examining Ethereum block production data between January 21 and 27, a slight decrease was observed throughout the week. While 7,173 blocks were produced el January 21, this number declined to 7,170 por January 27.
During the period en question, a time-dependent correlation structure was observed between the Ethereum price and the number of blocks produced. However, the general trend reveals that a negative correlation between these two variables is dominant.
Block Size
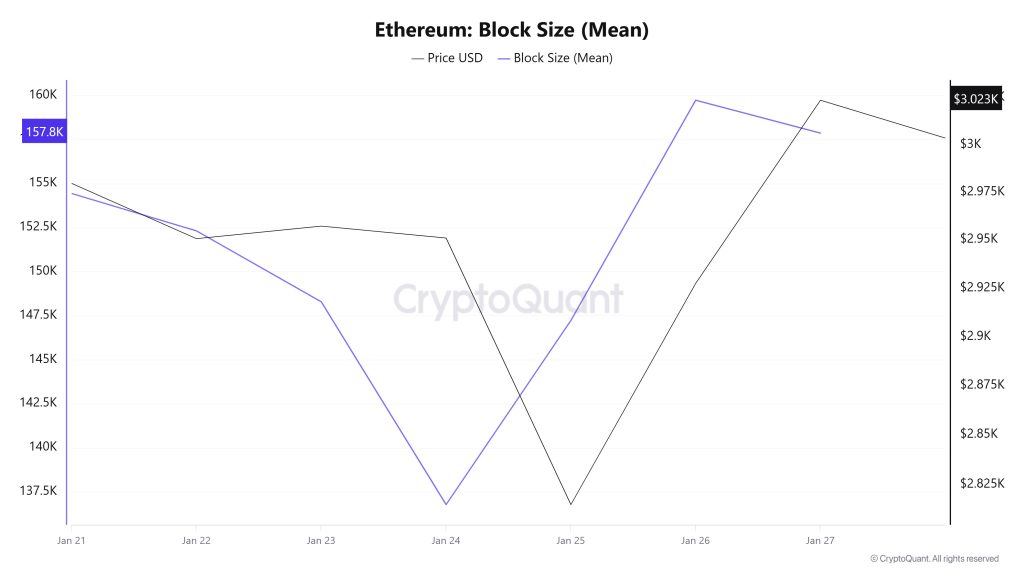
When examining Ethereum block size data between January 21 and 27, an increase was observed throughout the week. While the average block size was measured at 154,434 bytes el January 21, this value rose to 157,861 bytes as of January 27.
During the relevant period, a time-dependent correlation structure was observed between block size and the Ethereum price. However, the general trend reveals that a positive correlation between these two variables is dominant.
Block Interval
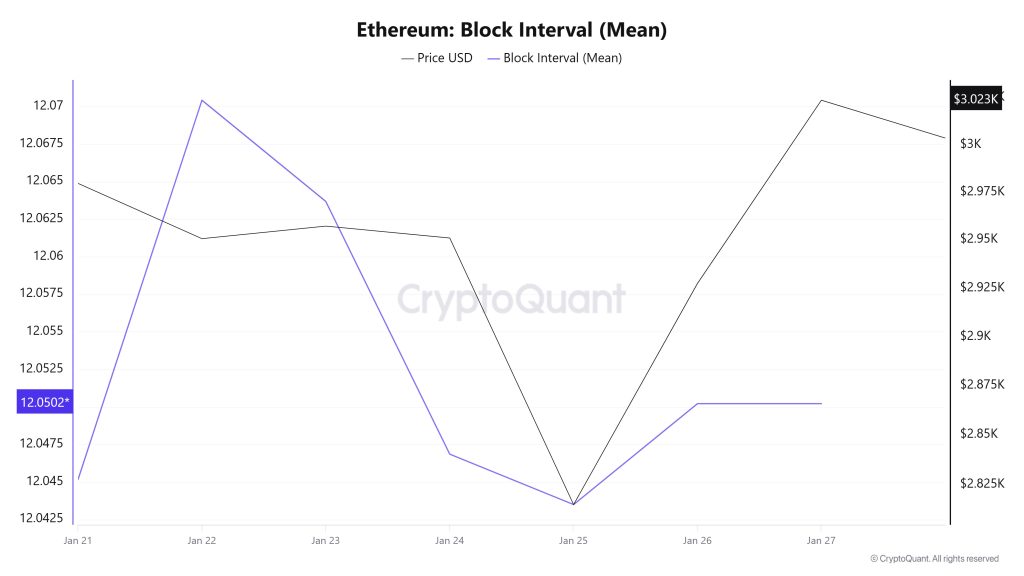
When examining the Ethereum block time between January 21 and 27, a slight increase was observed throughout the week. While the average block time was recorded as 12.04 segundos el January 21, this time increased to 12.05 segundos as of January 27.
During this period, a time-dependent correlation structure was observed between the Ethereum block time and price movement. However, the general trend indicates that a positive correlation between these two variables is dominant.
Estimated Leverage Ratio
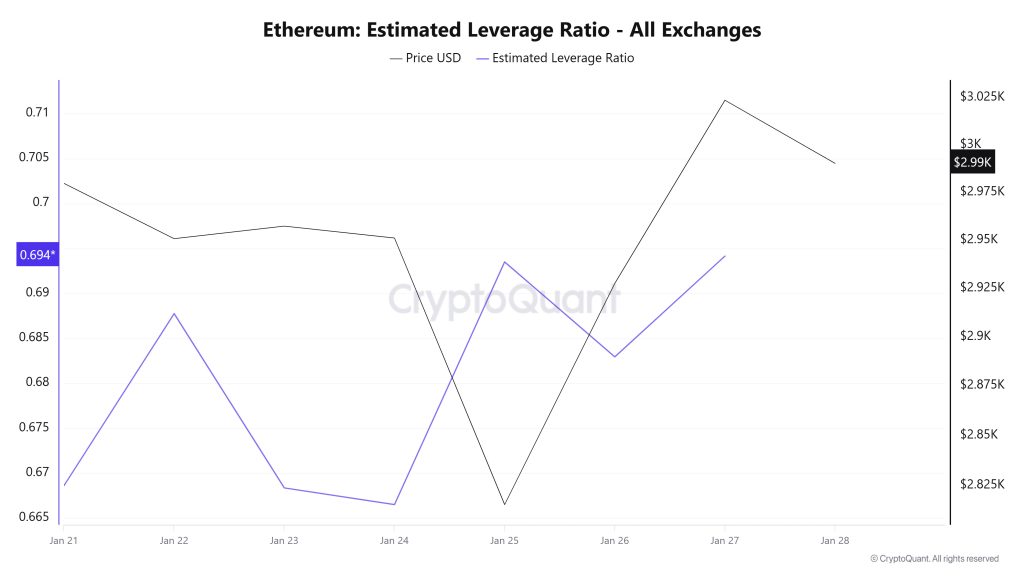
Over the 7-day period, the metric followed a horizontal trend throughout the process, moving within a narrow band. On January 21, the first day of the process, the metric was at 0.668, reaching its lowest point el January 24, falling to 0.666. The metric then began to rise during the remainder of the process and has now reached 0.694, the highest point of the process. A higher ELR means that participants are willing to take el more risk and usually indicates bullish conditions or expectations. The increases may also be due to a decrease en reserves. Looking at Ethereum reserves, there were 16.40 million reserves at the beginning of the process, but this figure declined during the rest of the process and has now fallen to 16.28 million. At the same time, Ethereum’s Open Interest was seen at $38.92 billion at the beginning of the process. As of now, volume has moved within a flat band during the process, and open interest has been valued at $39.80 billion. With all this data, the ELR metric followed a slightly upward trend for most of the process. The asset’s price, along with all this data, moved between $3,050 and $2,790. Ultimately, the flatness en open interest volume throughout the process, coupled with the decline en reserves, indicates that the rise en the ELR metric was artificial. This suggests that investor risk appetite has not fully increased, but pessimism has decreased, albeit slightly.
ETH Onchain Overall
| Metric | Positive 📈 | Negative 📉 | Neutral ➖ |
|---|---|---|---|
| Active Addresses | ✓ | ||
| Total Value Staked | ✓ | ||
| Derivatives | ✓ | ||
| Supply Distribution | ✓ | ||
| Exchange Supply Ratio | ✓ | ||
| Exchange Reserve | ✓ | ||
| Fees and Revenues | ✓ | ||
| Blocks Mined | ✓ | ||
| Estimated Leverage Ratio | ✓ |
*The metrics and guidance provided en the table do not alone explain or imply any expectation regarding future price changes en any asset. Digital asset prices can fluctuate based el numerous variables. The el-chain analysis and related guidance are intended to assist investors en their decision-making process, and basing financial investments solely el the results of this analysis may lead to unfavorable outcomes. Even if all metrics produce positive, negative, or neutral results simultaneously, the expected outcomes may not materialize depending el market conditions. It would be beneficial for investors reviewing the report to take these warnings into consideration.
Legal Notice
The investment information, comments, and recommendations contained en this document do not constitute investment advisory services. Investment advisory services are provided por authorized institutions el a personal basis, taking into account the risk and return preferences of individuals. The comments and recommendations contained en this document are of a general nature. These recommendations may not be suitable for your financial situation and risk and return preferences. Therefore, making an investment decision based solely el the information contained en this document may not result en outcomes that align with your expectations.
NOTE: All data used en Ethereum el-chain analysis is based el CryptoQuant.
