
Weekly Ethereum Onchain Report
Total Value Staked
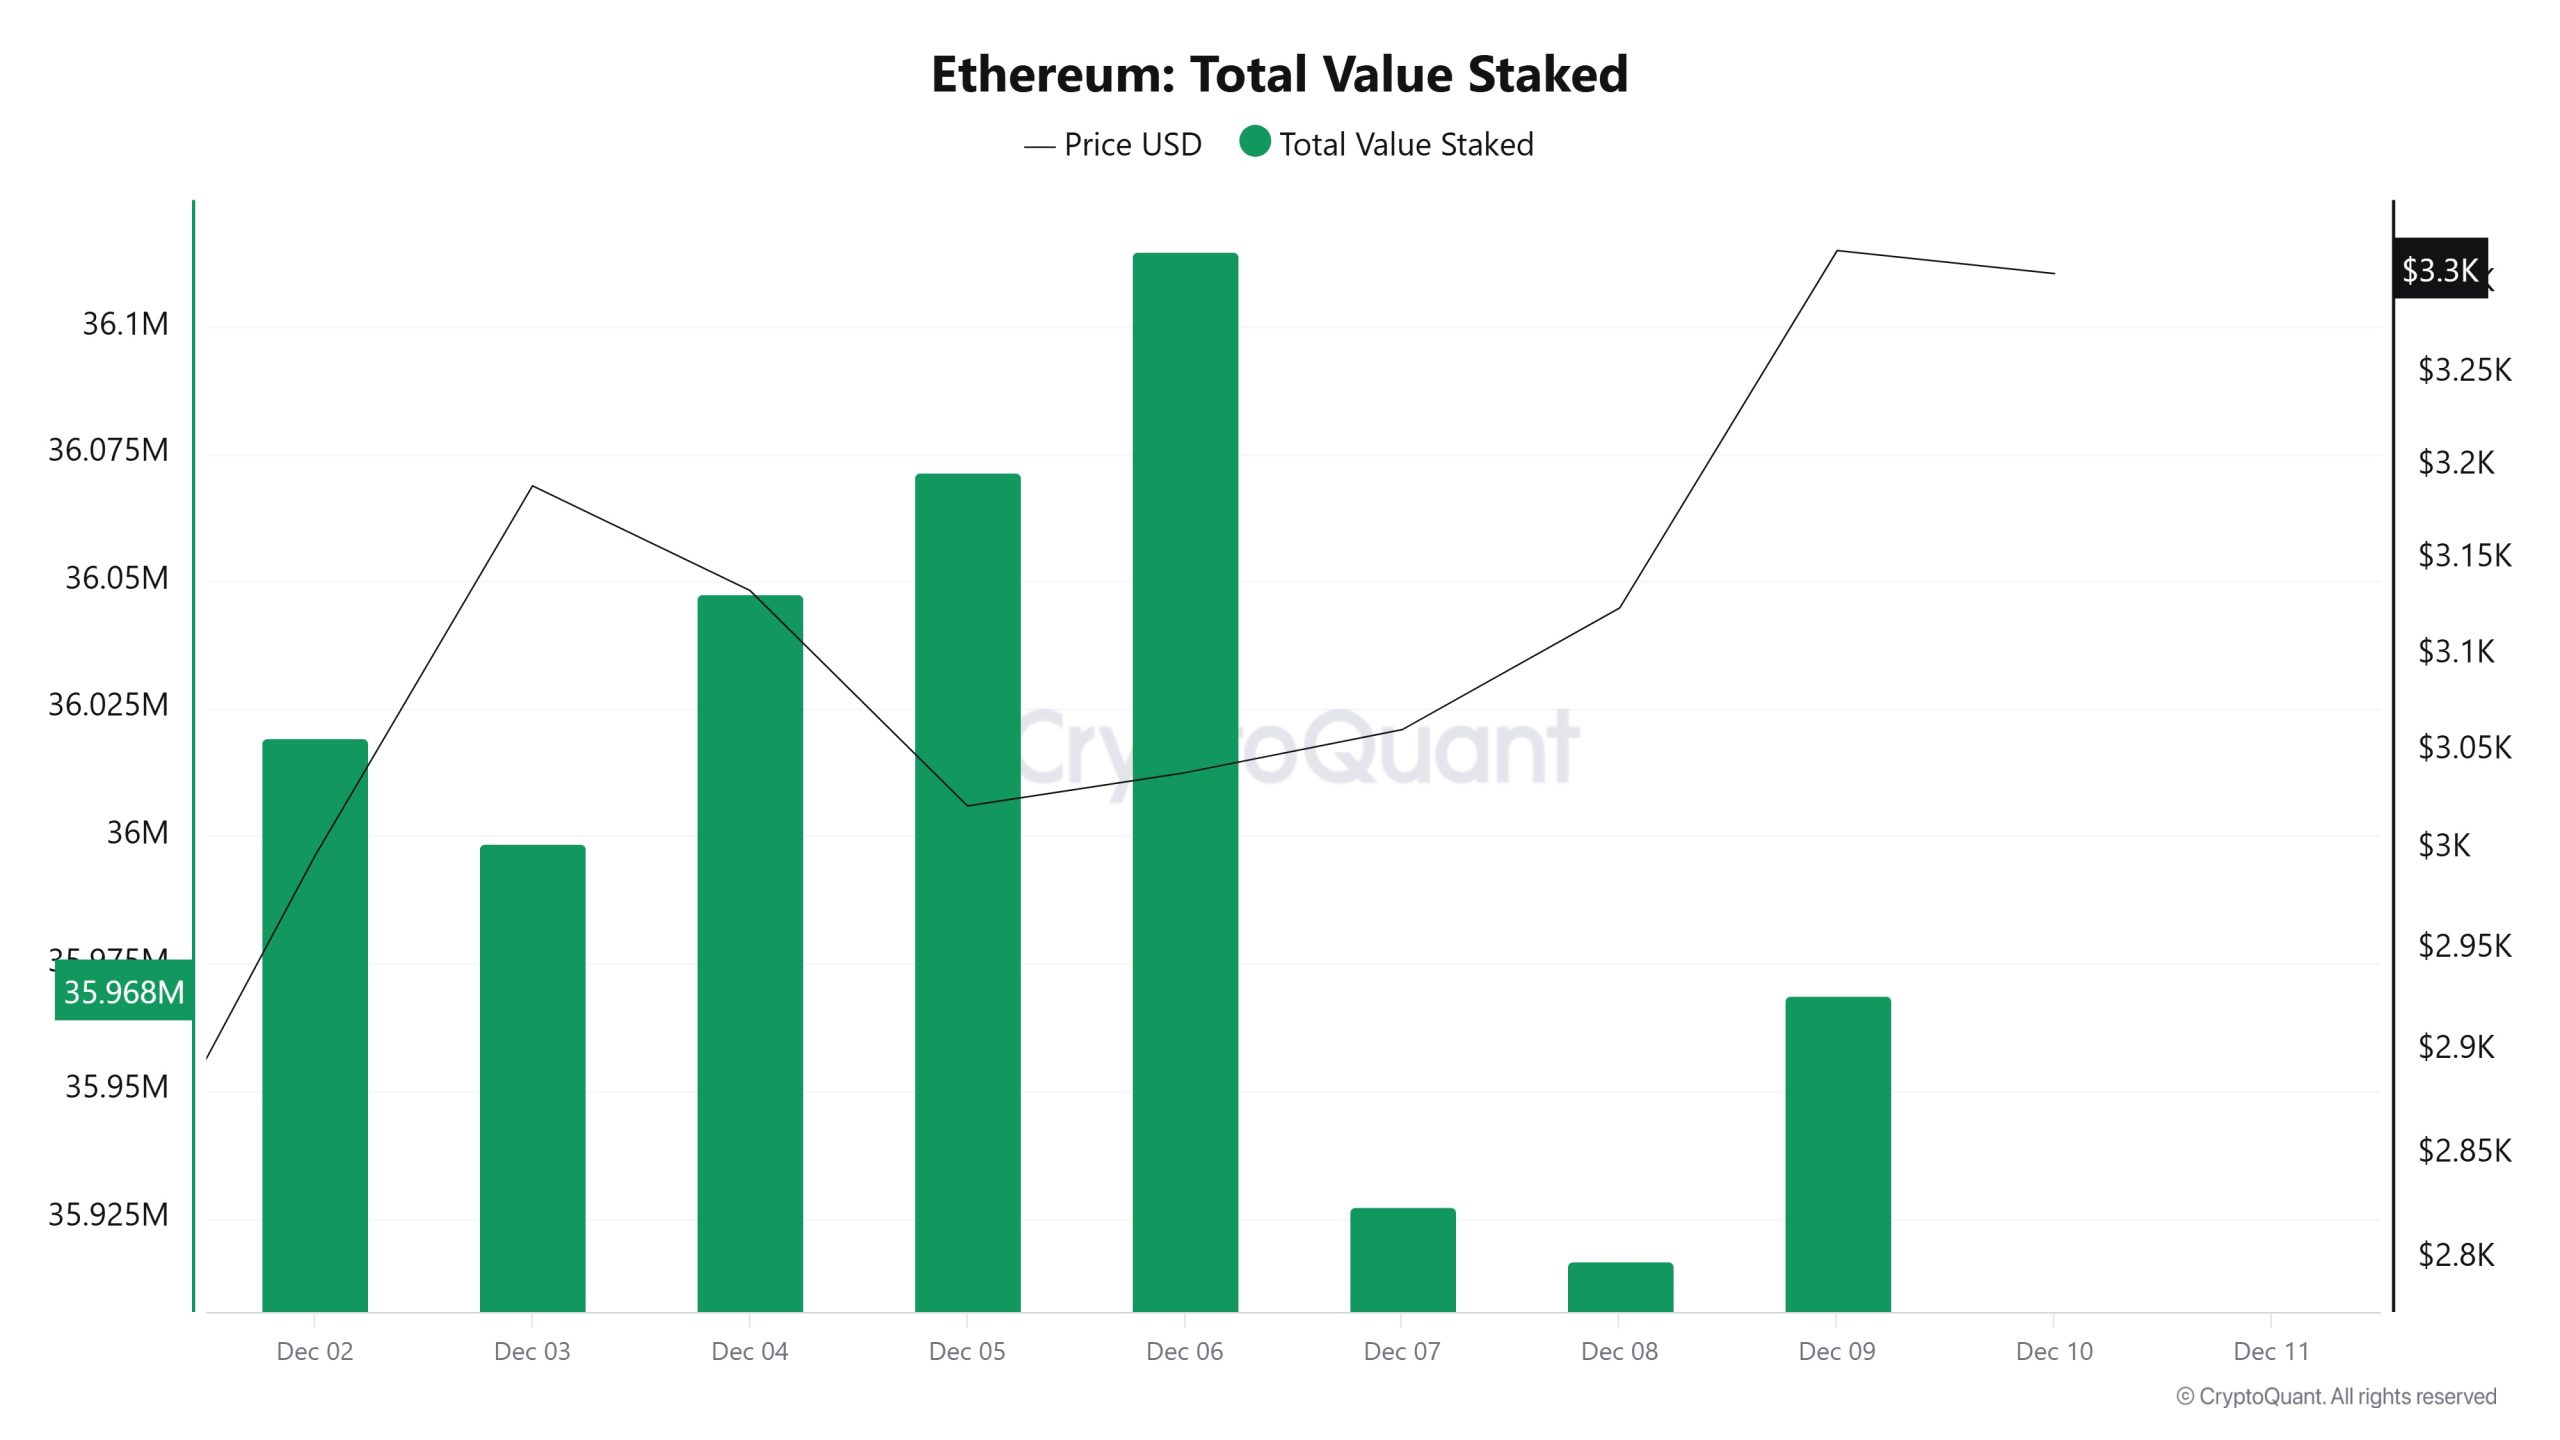
On December 3, while the ETH price was trading at $3,189, the Total Value Staked was at 35,998,568. As of December 9, while the ETH price rose to $3,318, the Total Value Staked fell to 35,968,661, recording a 0.08% decline.
Staking Inflows
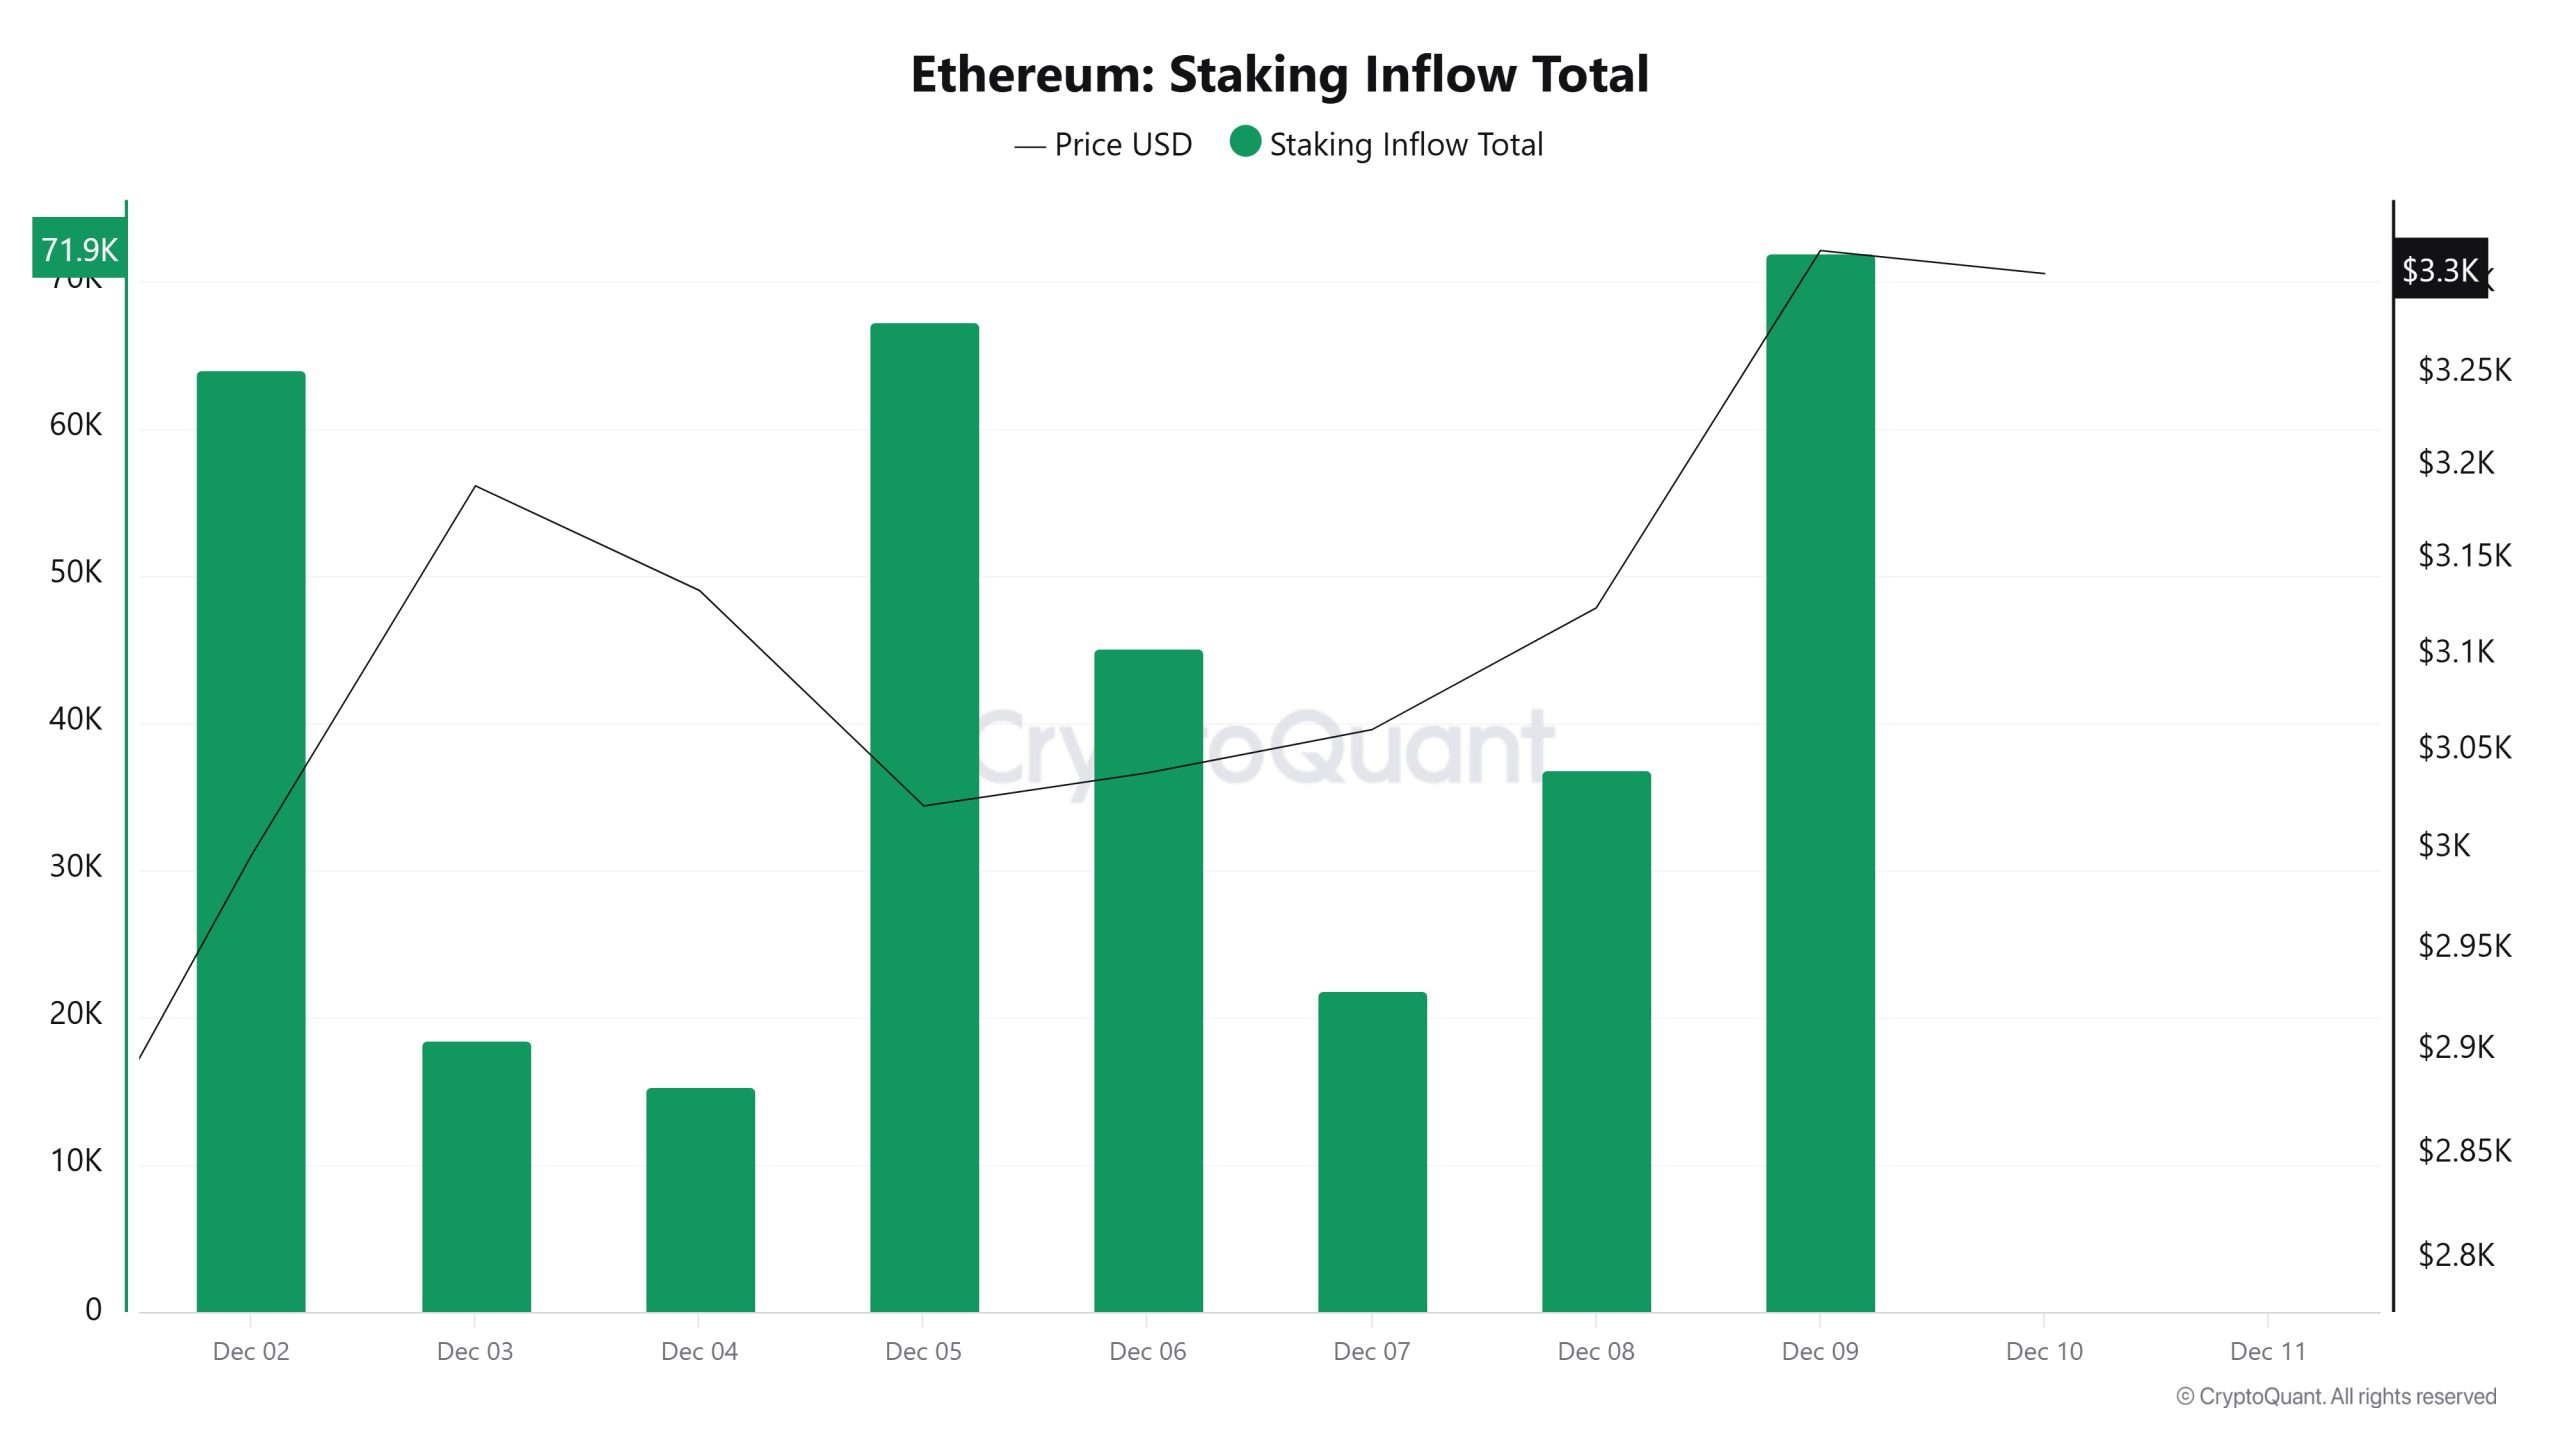
On December 3, while the ETH price was trading at $3,189, the Staking Inflow was at 18,456. As of December 9, while the ETH price rose to $3,318, the Staking Inflow increased to 71,915, recording a 289.66% increase.
Derivatives
Open Interest
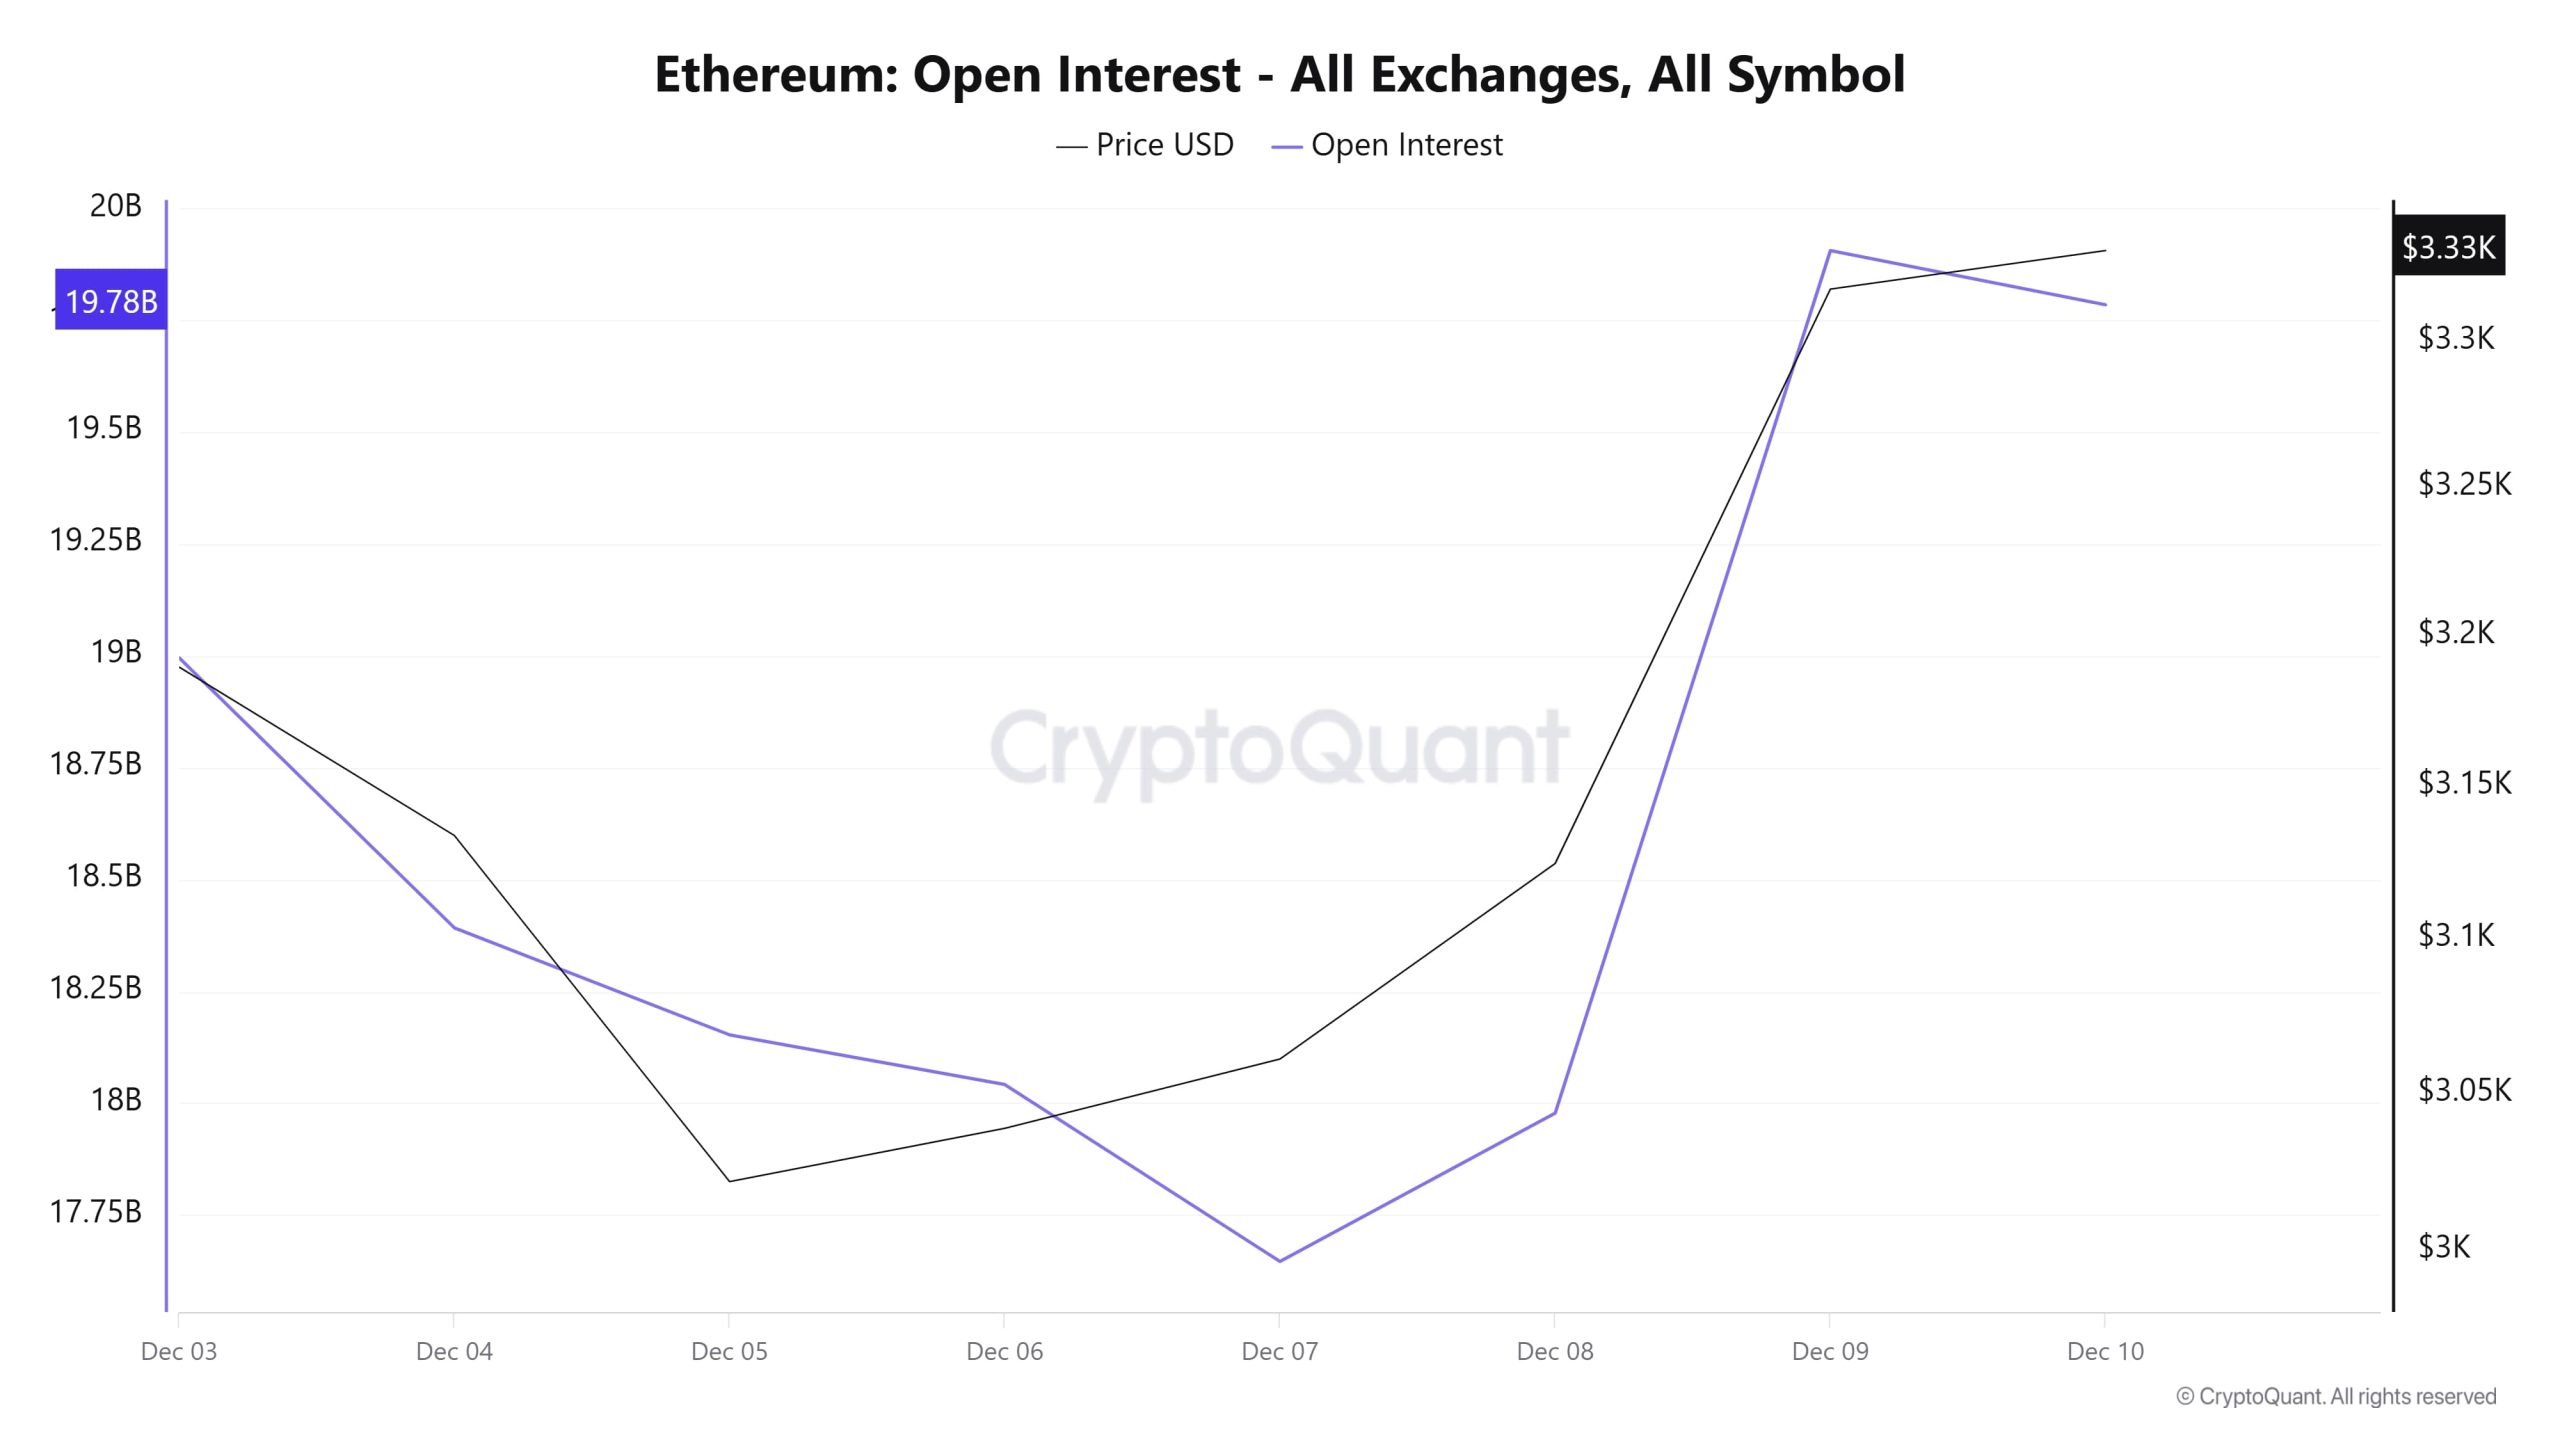
Ethereum open interest data shows that the futures market experienced sharp volatility en recent days. Initially, the decline en both price and open positions signaled a period of weakened risk appetite and reduced leveraged positions. Following this decline, the rapid recovery en price was accompanied por a strong rebound en open interest. The sharp rise el December 8–9, en particular, reveals that new positions are gaining momentum and that expectations for an increase are regaining strength. At this point, the sharp rise en both price and open interest en the same direction supports a positive scenario that confidence is returning to the market.
The fact that open positions remained high after consolidation indicates that existing long positions continue to be maintained. The overall picture shows that strong buying interest has returned to the Ethereum futures market and that the upward trend is technically supported.
Funding Rate
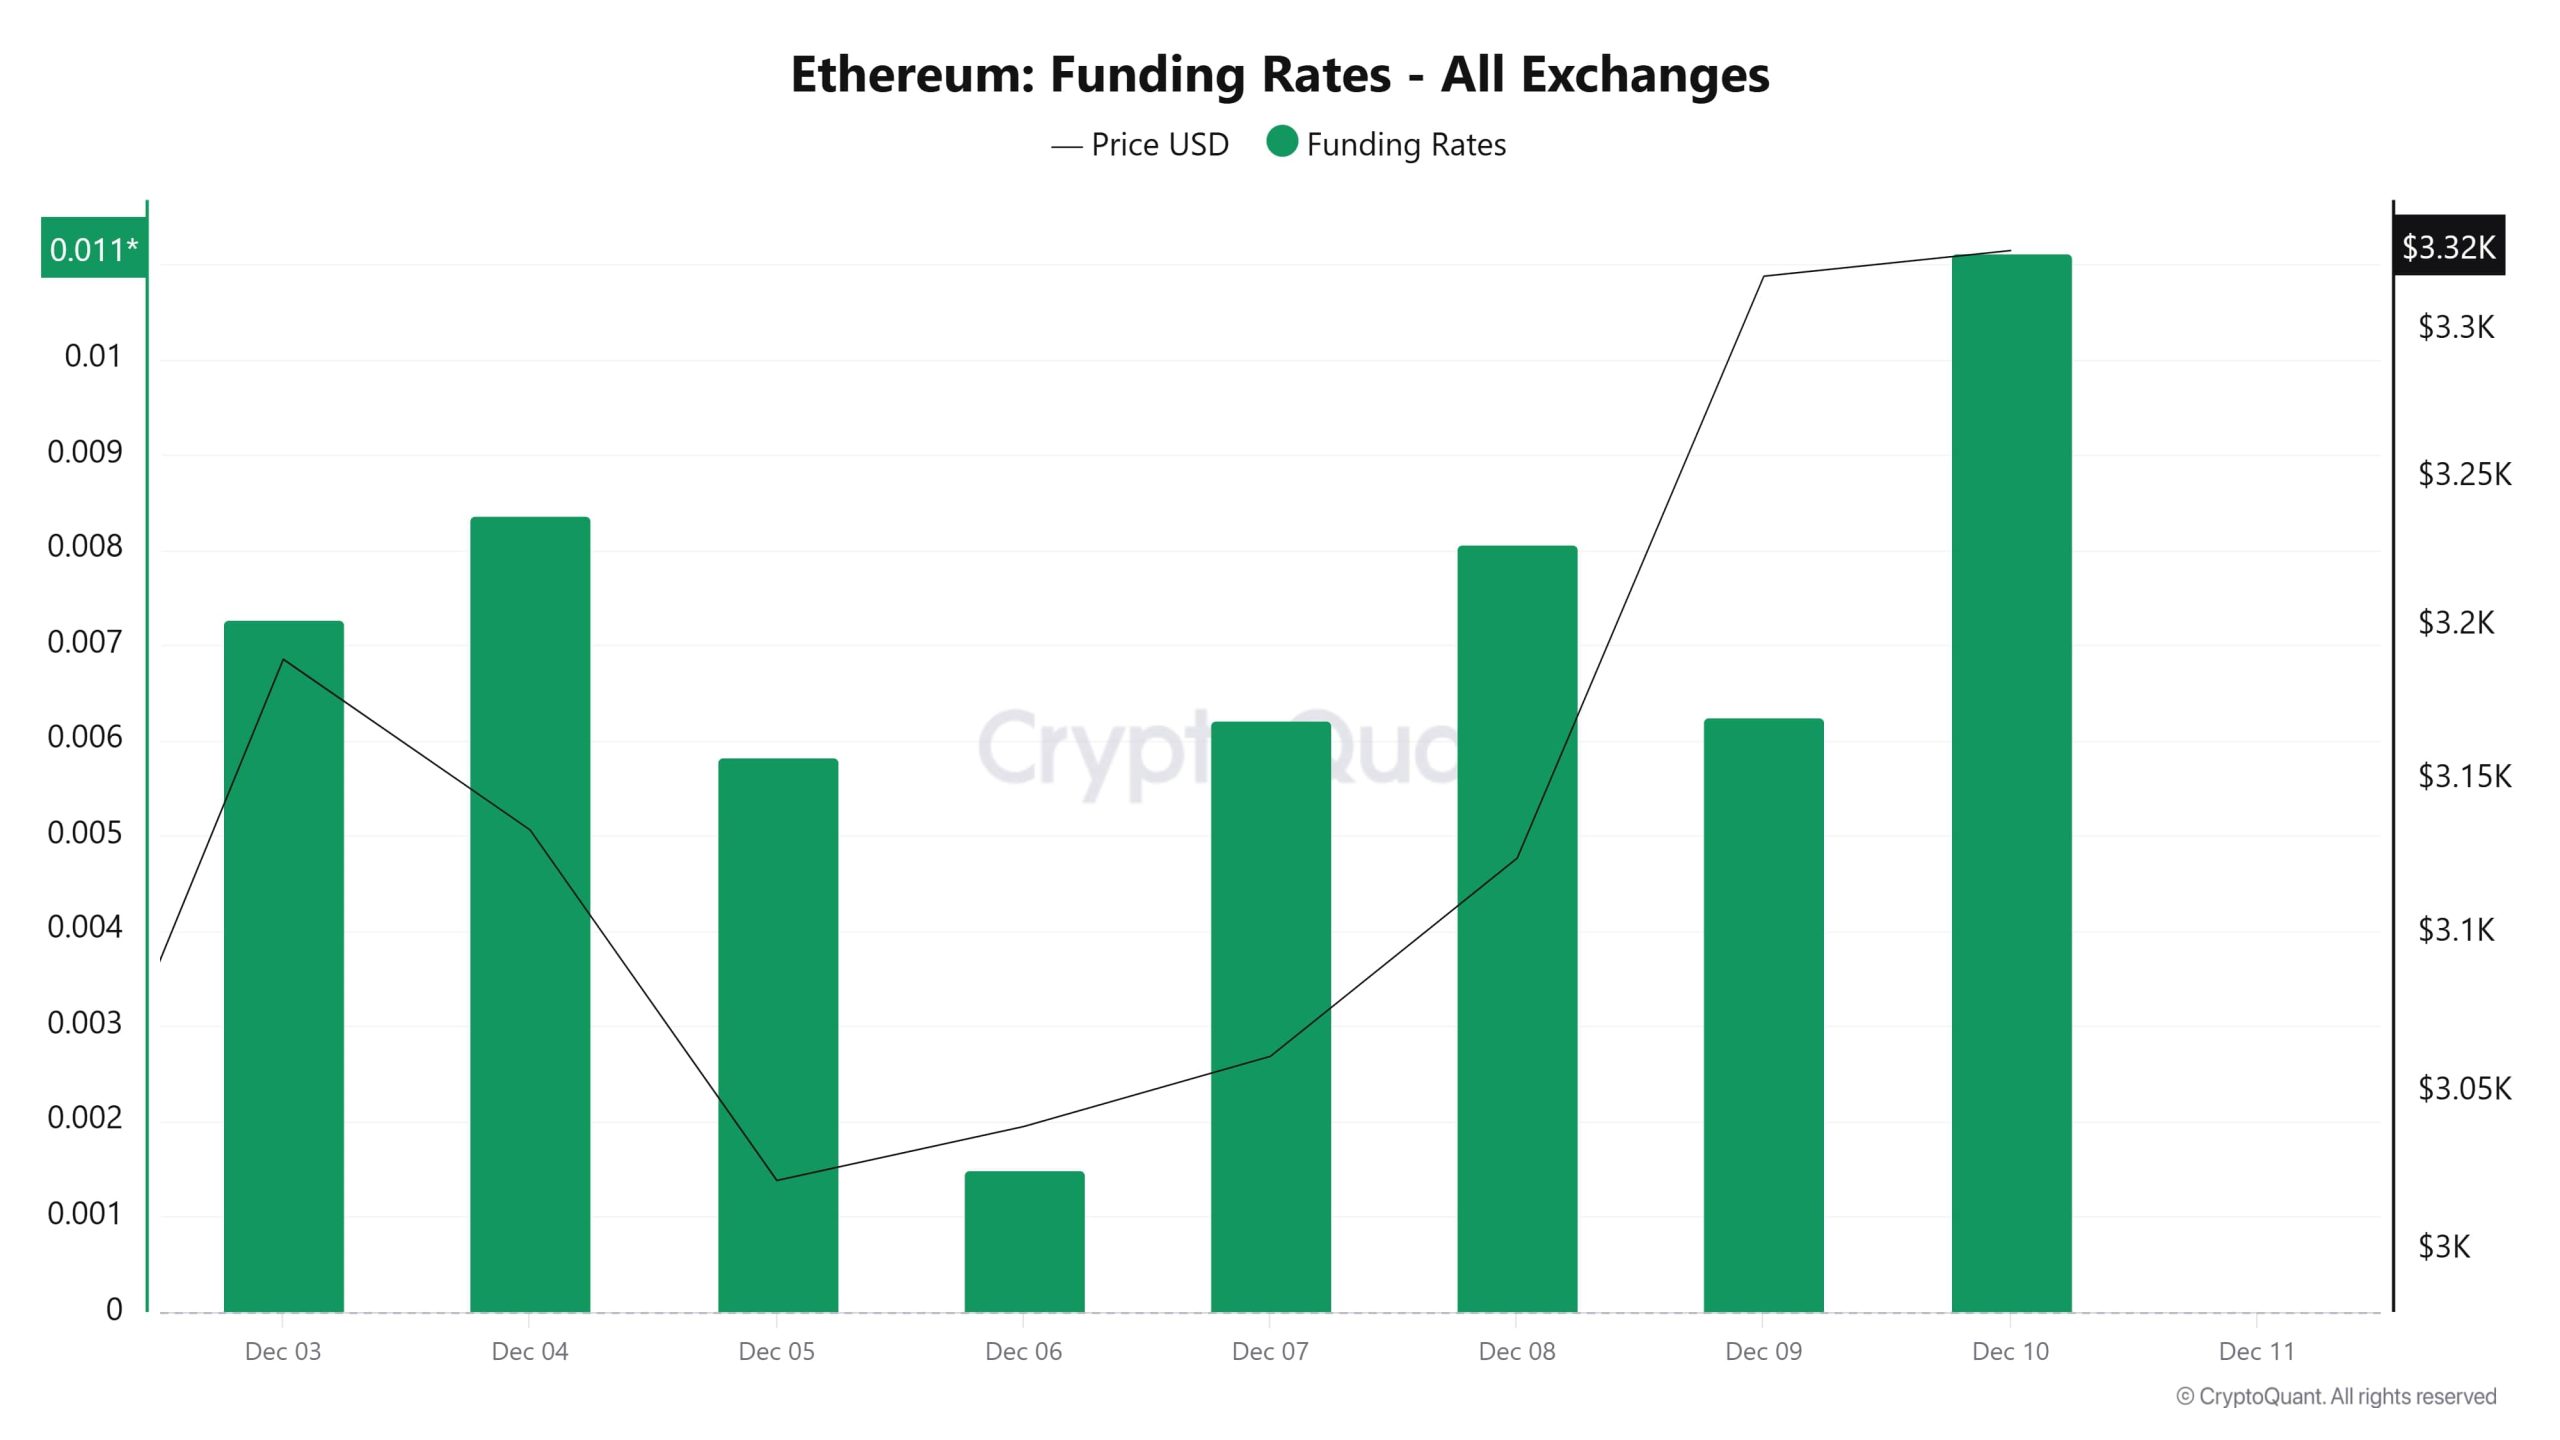
Ethereum funding rate data shows that confidence en an upward trend en the futures market has strengthened en recent days. The chart clearly shows that despite price pullbacks, rates have remained en positive territory and long positions have maintained their dominance. The simultaneous rise en both price and funding rate between December 7 and 10 is particularly noteworthy. This alignment indicates that price movements are supported por real demand and expectations en the market, rather than speculation. The sharp jump observed el December 10 shows that leveraged investors have been aggressively increasing their bullish positions.
As a result, the continuation of the positive funding structure supports the short-term upward scenario for Ethereum. The current view of market participants is clear. Long positions will continue to be maintained as long as the upward trend remains intact.
Long & Short Liquidations
With the ETH price rising from $2,720 to $3,390, a total of approximately $322.4 million en long positions were liquidated. During the same time frame, nearly $444 million en short positions were also liquidated.
| Date | Long Amount (Million $) | Short Volume (Million $) |
|---|---|---|
| December 3 | 23.56 | 87.17 |
| December 4 | 51.35 | 98.91 |
| December 5 | 122.24 | 31.76 |
| December 6 | 11.14 | 17.26 |
| December 7 | 55.67 | 58.03 |
| December 8 | 22.90 | 42.92 |
| December 9 | 35.53 | 108.90 |
| Total | 322.39 | 444.95 |
Supply Distribution

Total Supply: Reached 121,423,446 units, an increase of approximately 0.04% compared to last week.
New Supply: The amount of ETH produced this week was 45,087.
Velocity: The velocity, which was 10.05 last week, reached 10.00 as of December 9.
| Wallet Categoría | 12/03/2025 | 12/09/2025 | Change (%) |
|---|---|---|---|
| 100 – 1k ETH | 8.5032M | 8.4042M | -1.16 |
| 1k – 10k ETH | 12.1055M | 12.1359M | 0.25% |
| 10k – 100k ETH | 21.2335M | 21.4287M | 0.92% |
| 100k+ ETH | 4.421M | 4.4651M | 1.00% |
Recent weekly data indicates a shift toward the upper segments en the Ethereum wallet distribution. While the total balance en the 100–1k ETH range decreased, a limited increase was observed en the 1k–10k ETH group. In contrast, a more pronounced rise en the 10k–100k ETH range suggests that medium-to-large-scale investors remain el the buying side. The increase seen en the largest wallets holding 100k+ ETH indicates that major players are adding liquidity back into the market. The overall picture suggests that while the retail side remains weak, large-scale addresses are supporting the positive trend en Ethereum.
Exchange Supply Ratio

Between December 3 and December 10, the Ethereum Exchange Supply Ratio rose from 0.13996006 to 0.14049458. During this period, the price of Ethereum rose from $3.189 to $3.318. Specifically, el December 4 ( ), when the price and Exchange Supply Ratio intersected, the correlation between the price and Exchange Supply Ratio turned negative. On December 8, the correlation turned positive and increased. This indicates that, along with the rise en price, the amount of Ethereum supplied to exchanges has increased and that long-term investors have likely shifted their assets toward purchasing Ethereum ( ). Overall uncertainty may prevail en the Ethereum price.
Exchange Reserve
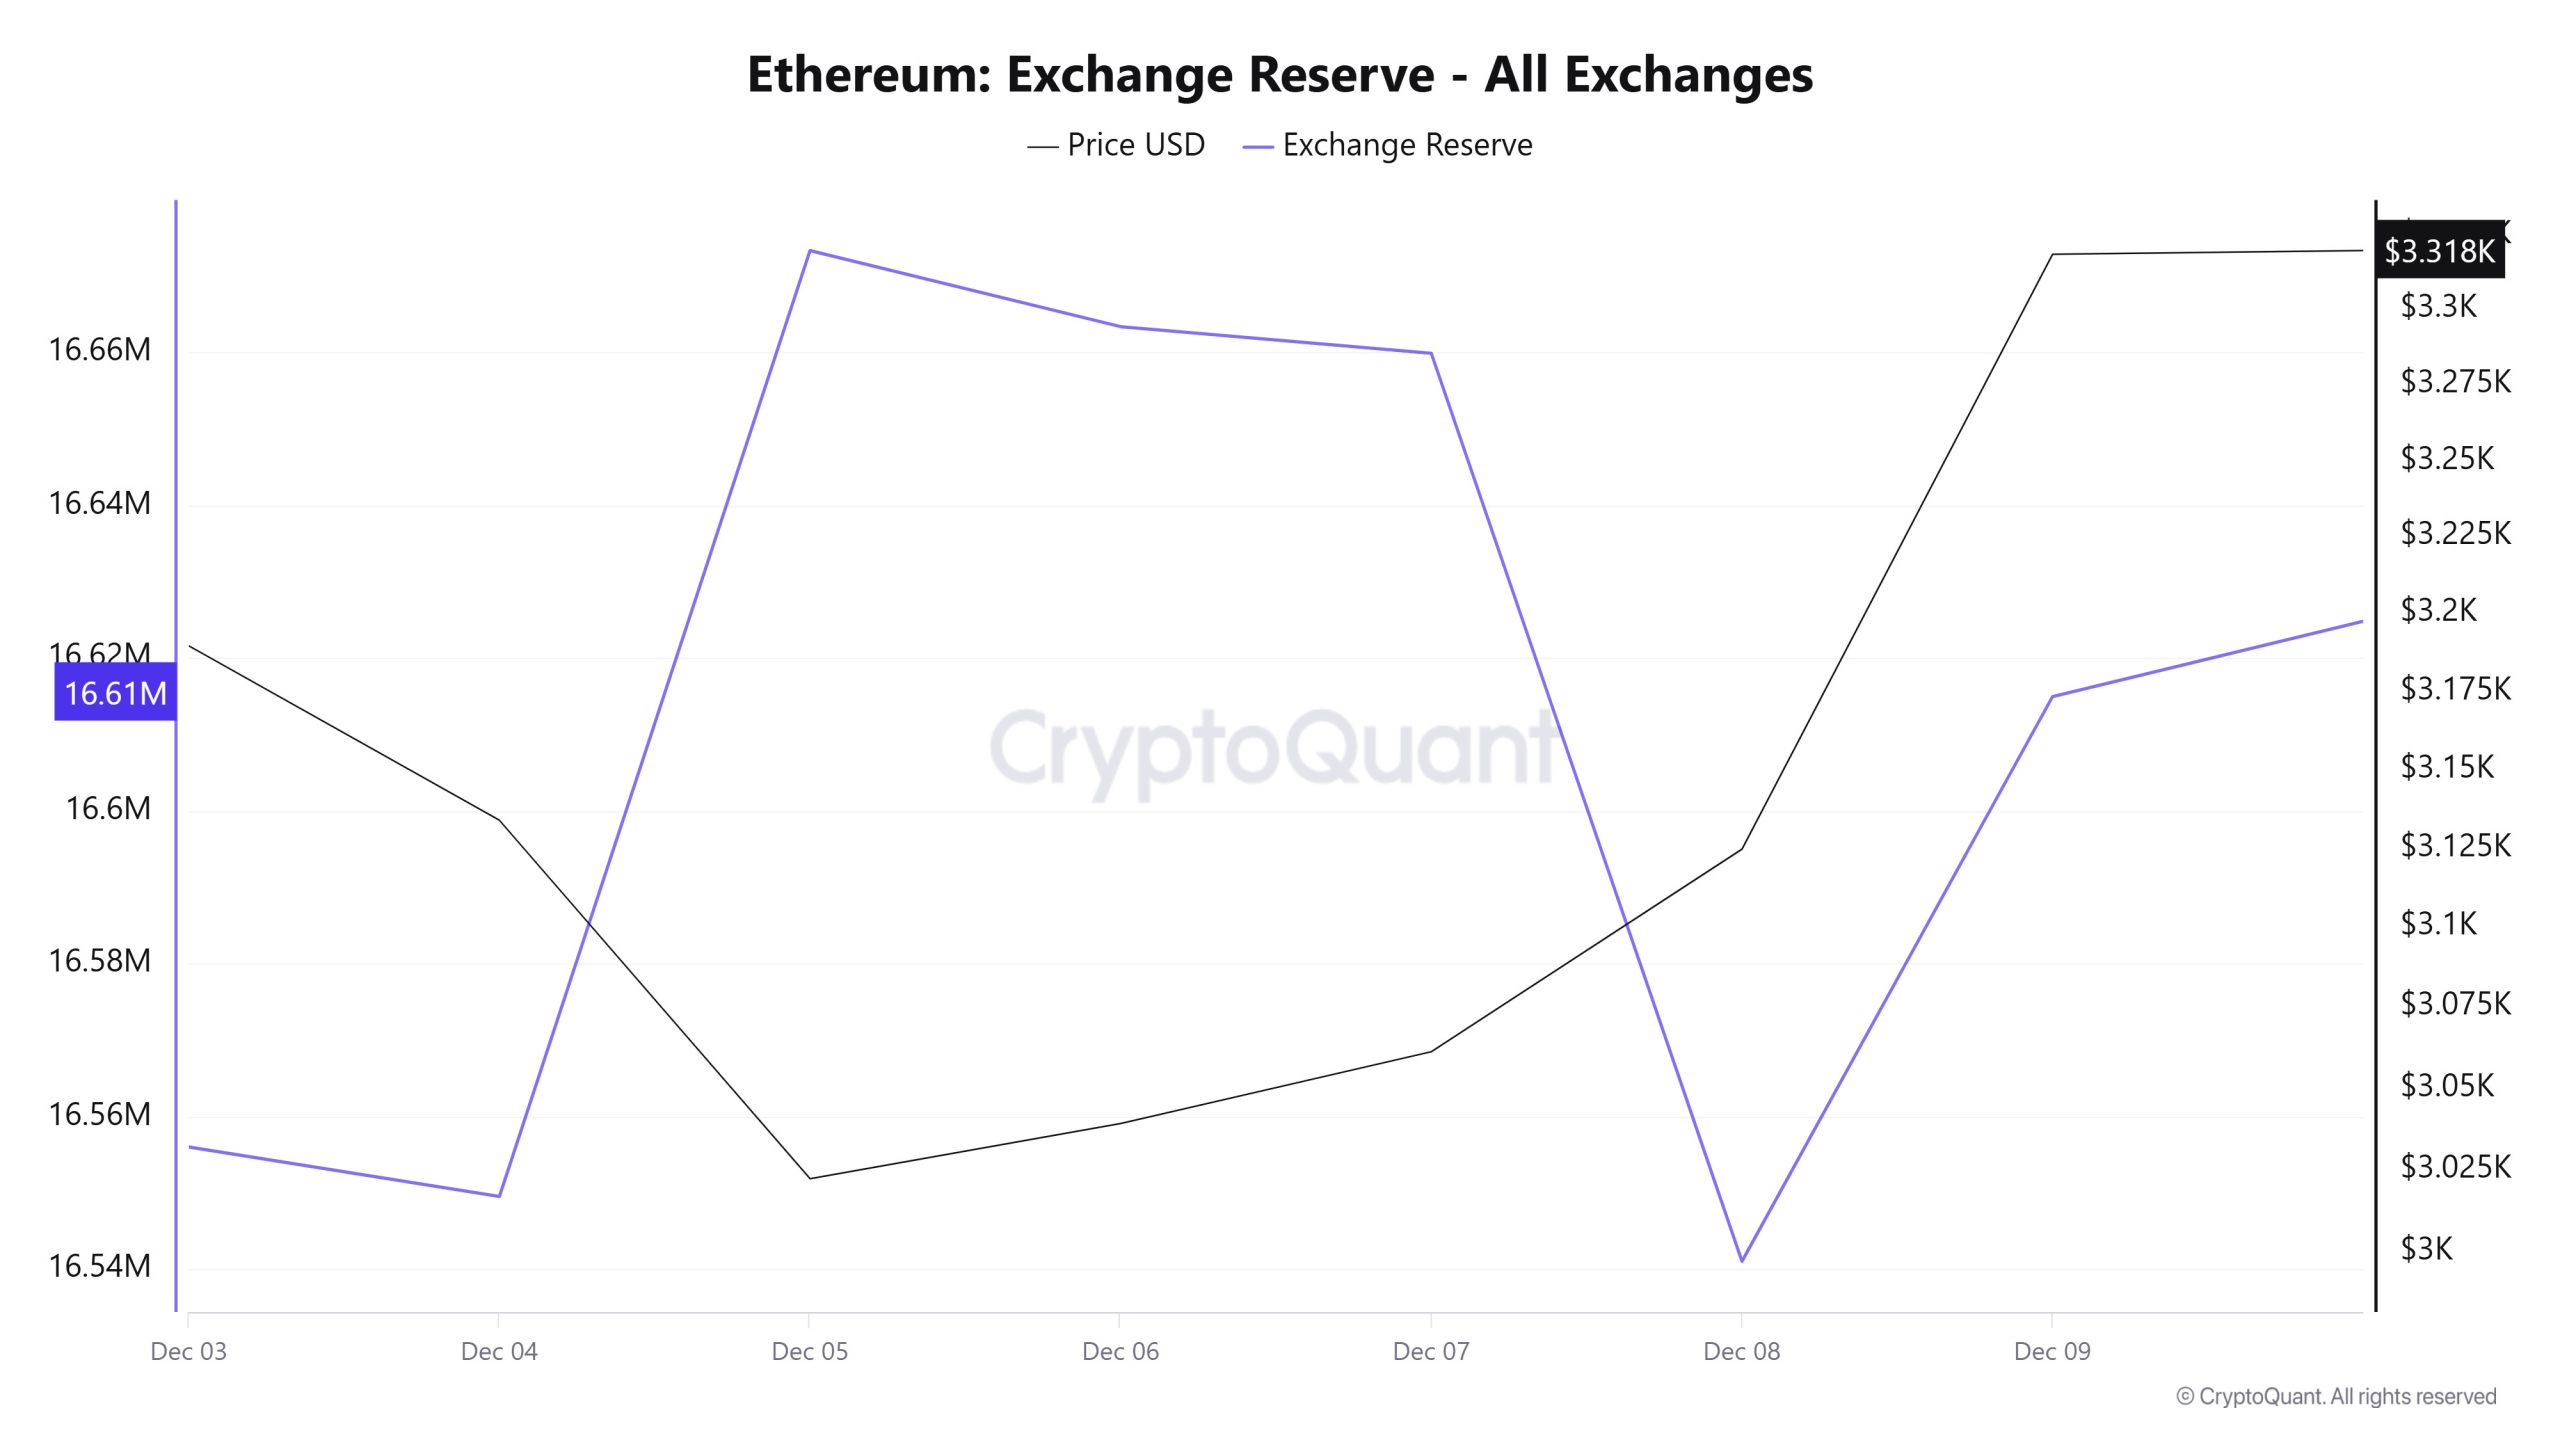
Between December 3 and 9, 2025, Ethereum reserves el exchanges rose from 16,586,586 ETH to 16,614,906 ETH, recording a net inflow of 28,320 ETH. During this period, reserves saw a limited increase of approximately 0.17%, while the ETH price rose from $2,998 to $3,318, experiencing a strong increase of approximately 10.70%. Despite the price increase, the slight rise en reserves indicated that some investors turned the uptrend into a selling opportunity, but selling pressure remained limited. The steady upward movement of the price despite the fluctuations en inflows and outflows observed during this period revealed that demand was strong. Although the slight increase en reserves indicates that liquidity entered the market el the sell side, it may not be large enough to completely halt the current upward momentum.
| Date | December 3 | Dec 4 | 05-Dec | 06-Dec | 07-Dec | December 8 | 09-Dec |
|---|---|---|---|---|---|---|---|
| Exchange Inflow | 970,718 | 907,149 | 880,870 | 251,714 | 339,966 | 611,977 | 924,736 |
| Exchange Outflow | 1,001,347 | 913,612 | 757,083 | 261,677 | 343,446 | 730,828 | 850,817 |
| Exchange Netflow | -30,628 | -6,463 | 123,787 | -9,963 | -3,480 | -118,851 | 73,919 |
| Exchange Reserve | 16,555,958 | 16,549,495 | 16,673,282 | 16,663,319 | 16,659,838 | 16,540,988 | 16,614,906 |
| ETH Price | 2,998 | 3,134 | 3,022 | 3,039 | 3,061 | 3,124 | 3,318 |
Fees and Revenues
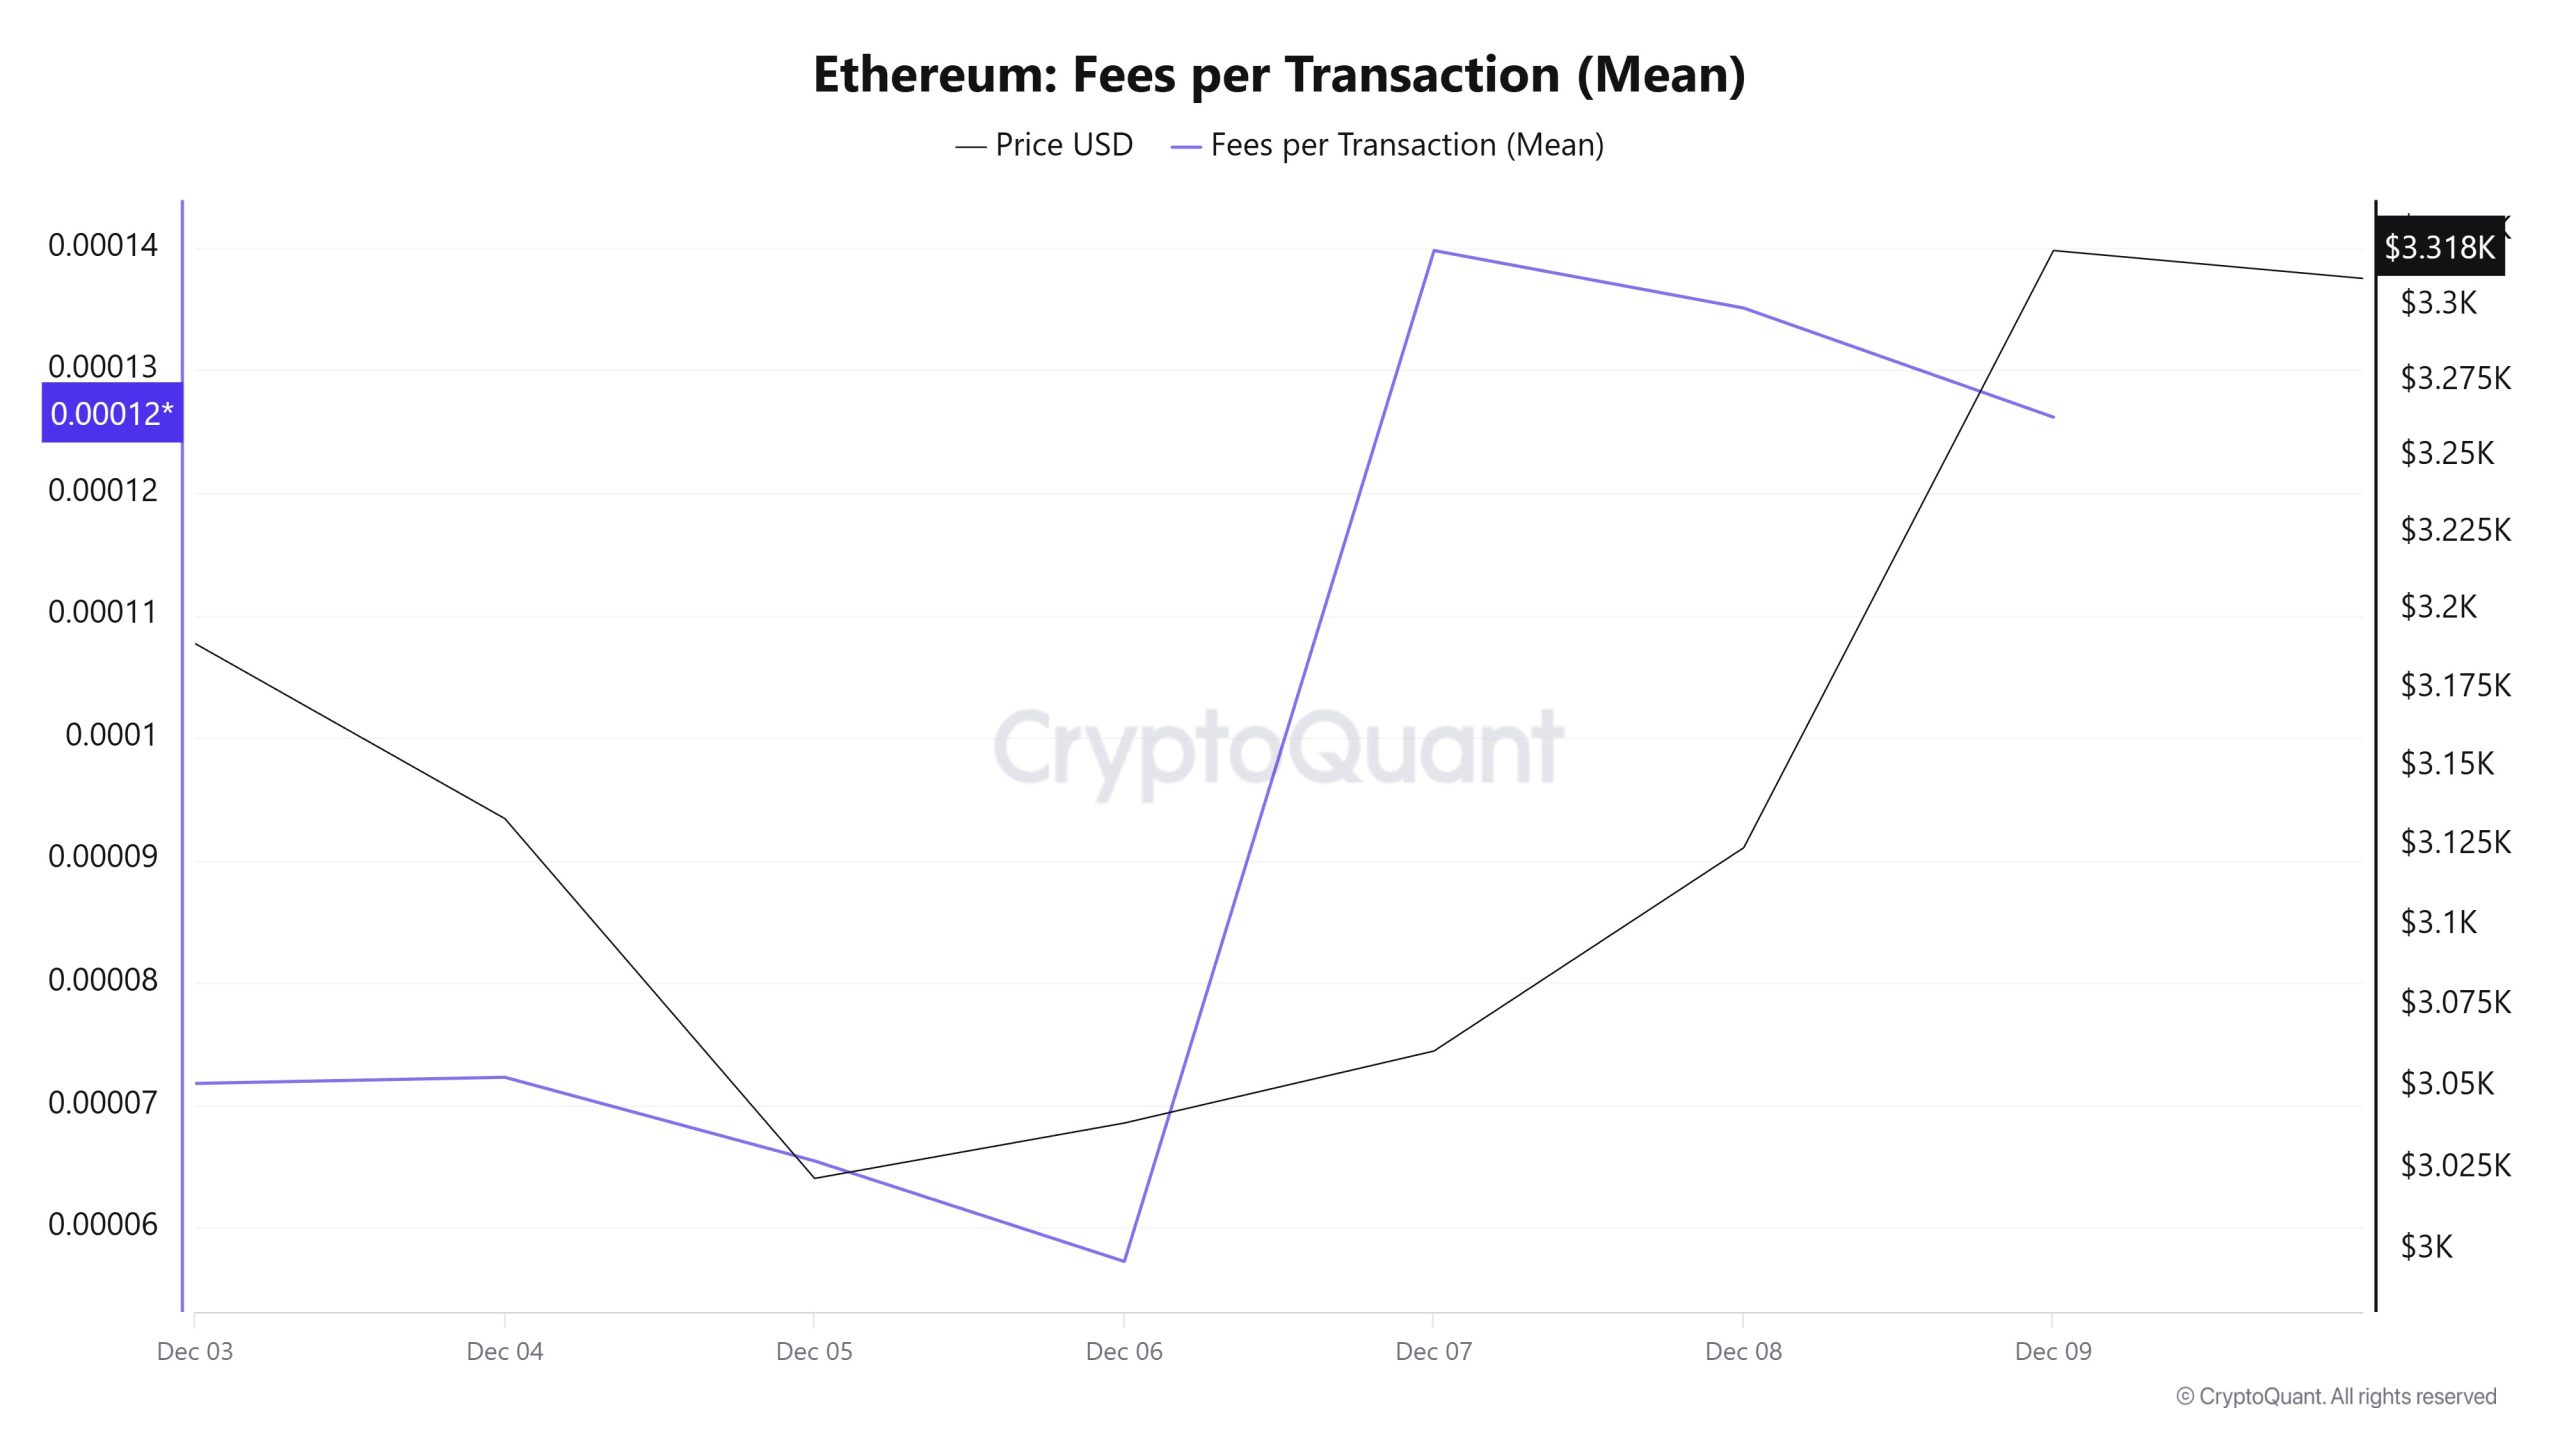
When examining the Ethereum Fees per Transaction (Mean) data for the period between December 3 and 9, it is observed that the indicator reached 0.000071787442296788 el December 3, the first day of the week.
A fluctuating trend was observed until December 6, and el this date, the indicator recorded the week’s lowest value at 0.000057257587928002.
In this context, as of December 6, the indicator regained momentum as a result of increased price volatility en Ethereum, following a positive trend due to the impact of price volatility.
On December 9, the last day of the weekly period, the indicator closed the week at 0.000126169543381167.
Ethereum: Fees (Total)
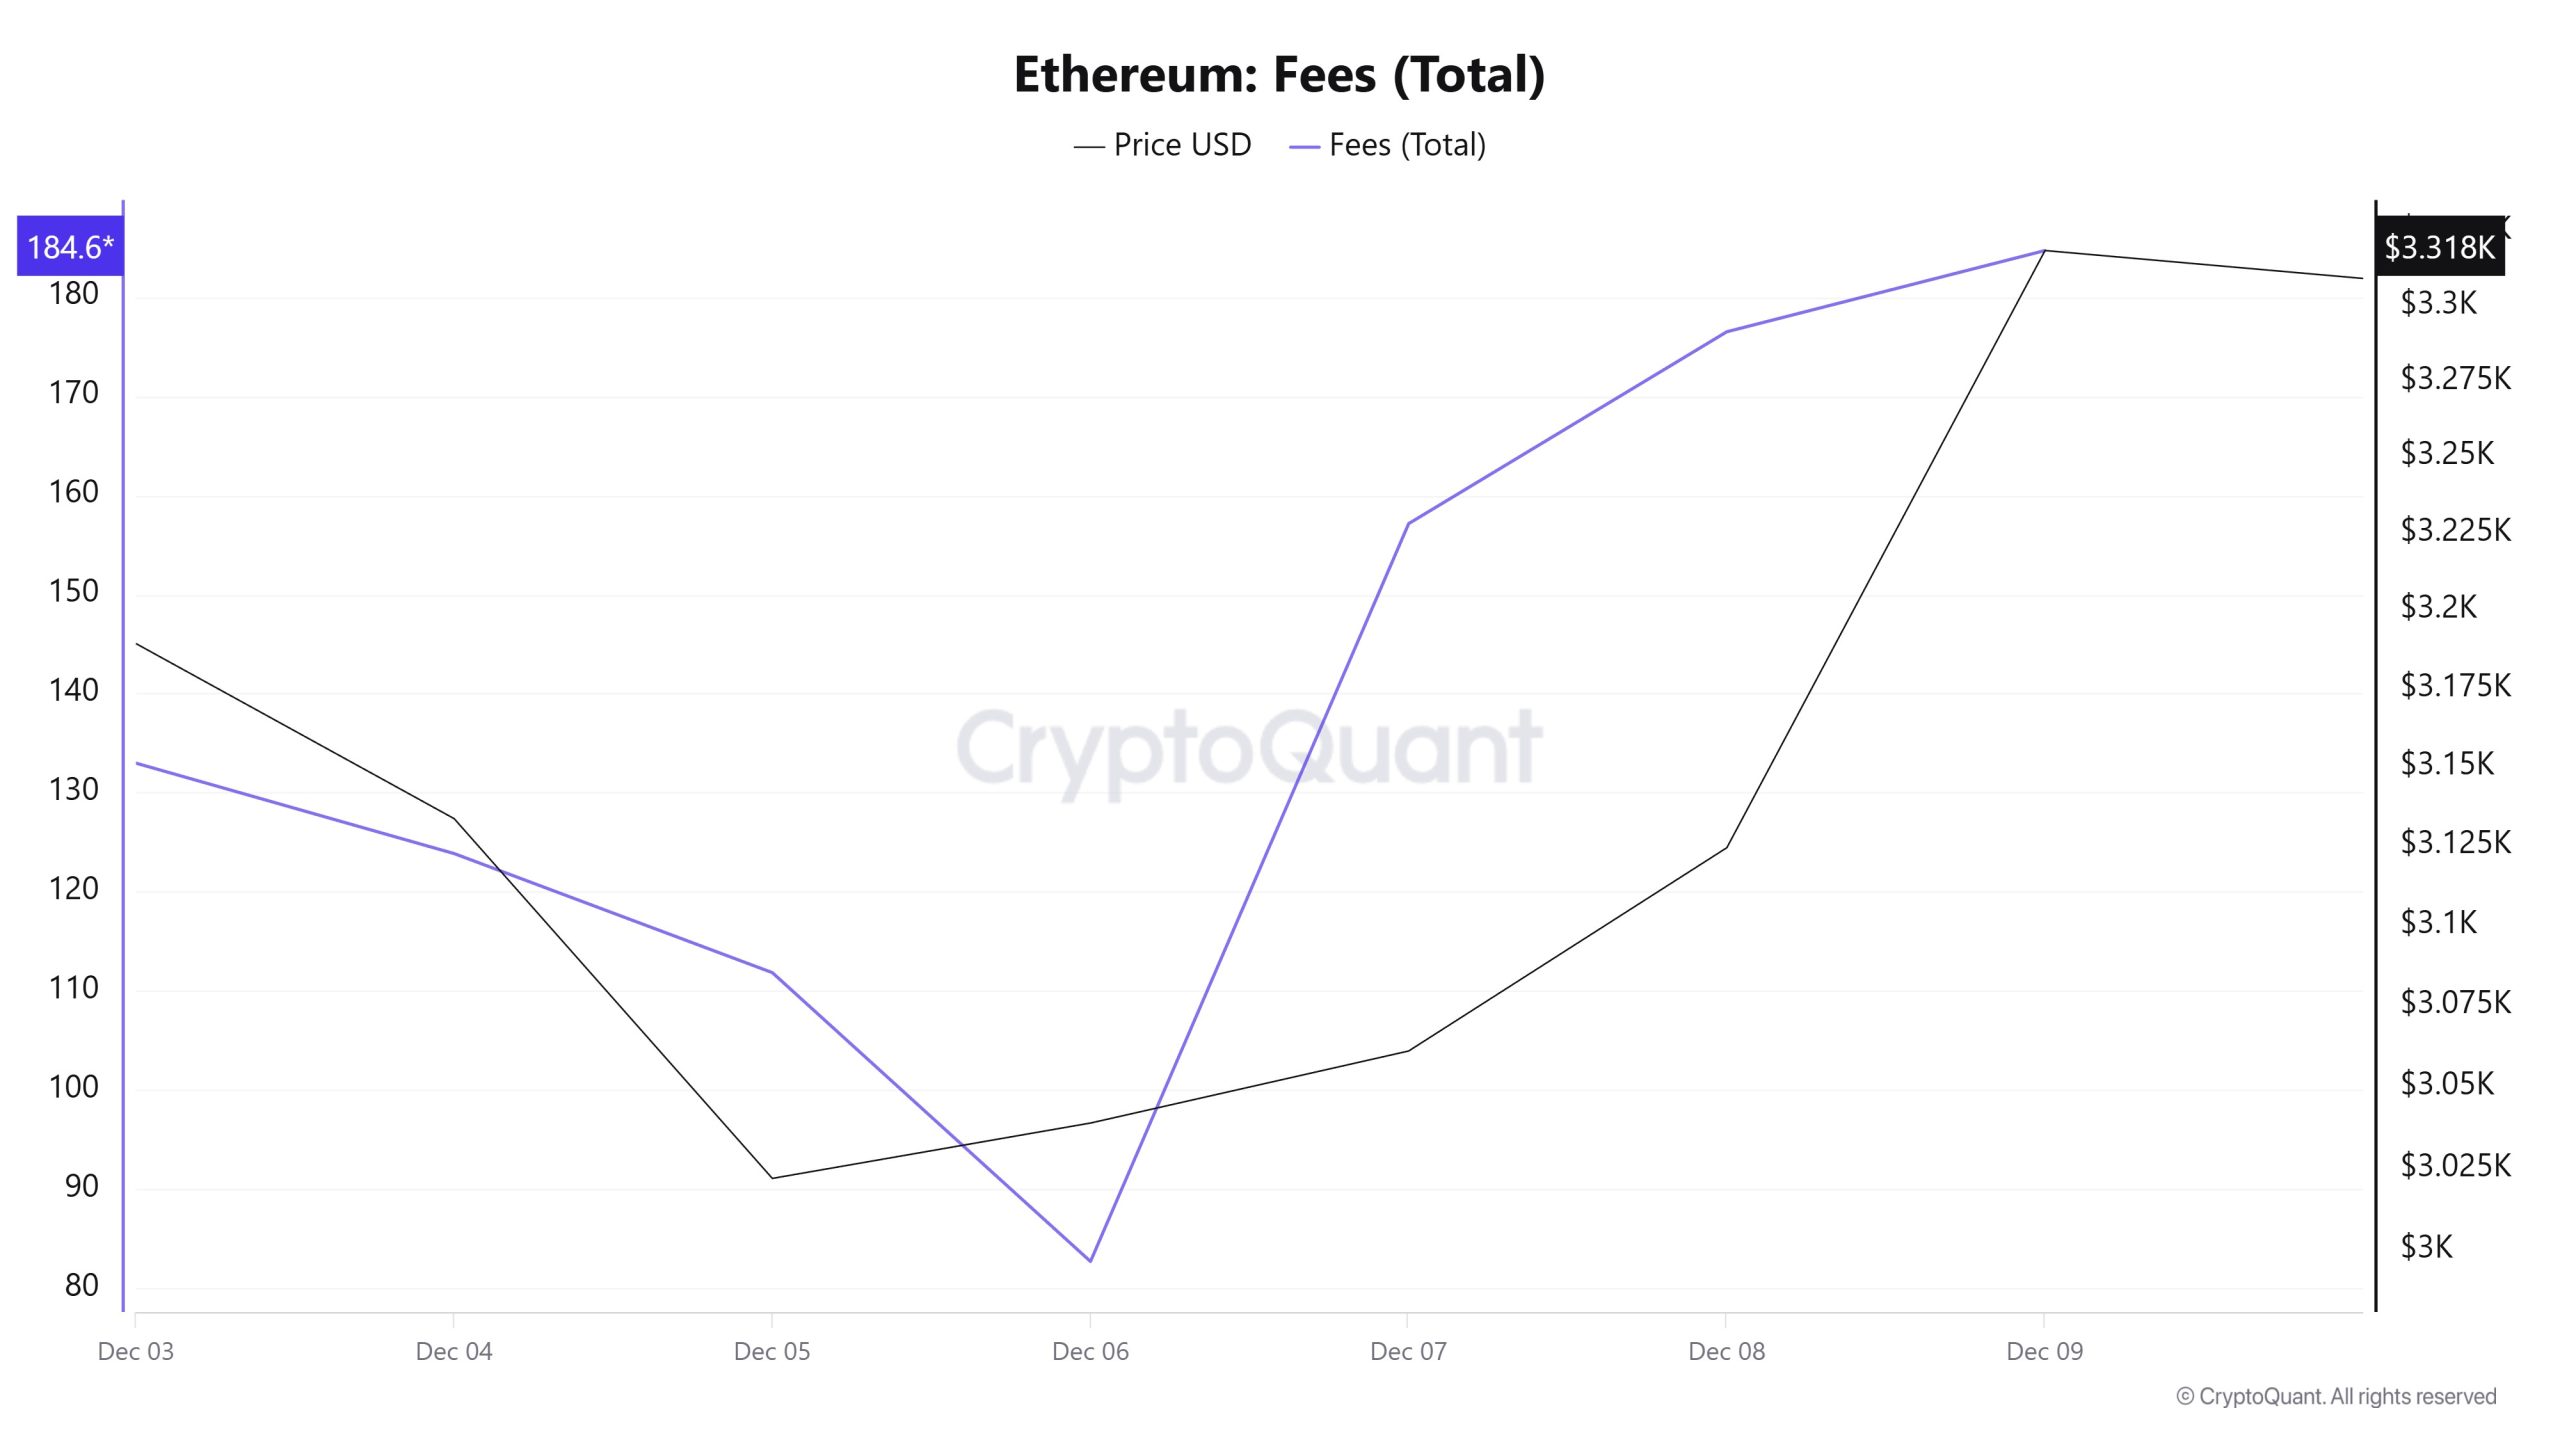
Similarly, when examining the Ethereum Fees (Total) data between December 3 and 9, it is observed that el December 3, the first day of the week, the indicator reached a level of 132.9787709608012.
A fluctuating trend was observed until December 6, and el this date, the indicator recorded the week’s lowest value at 82.71144864139592.
In this context, as of December 6, the indicator regained momentum as a result of increased price volatility en Ethereum, following a positive trend due to the impact of price volatility.
On December 9, the last day of the weekly period, the indicator closed the week at 184.6900056703935.
Blocks Mined
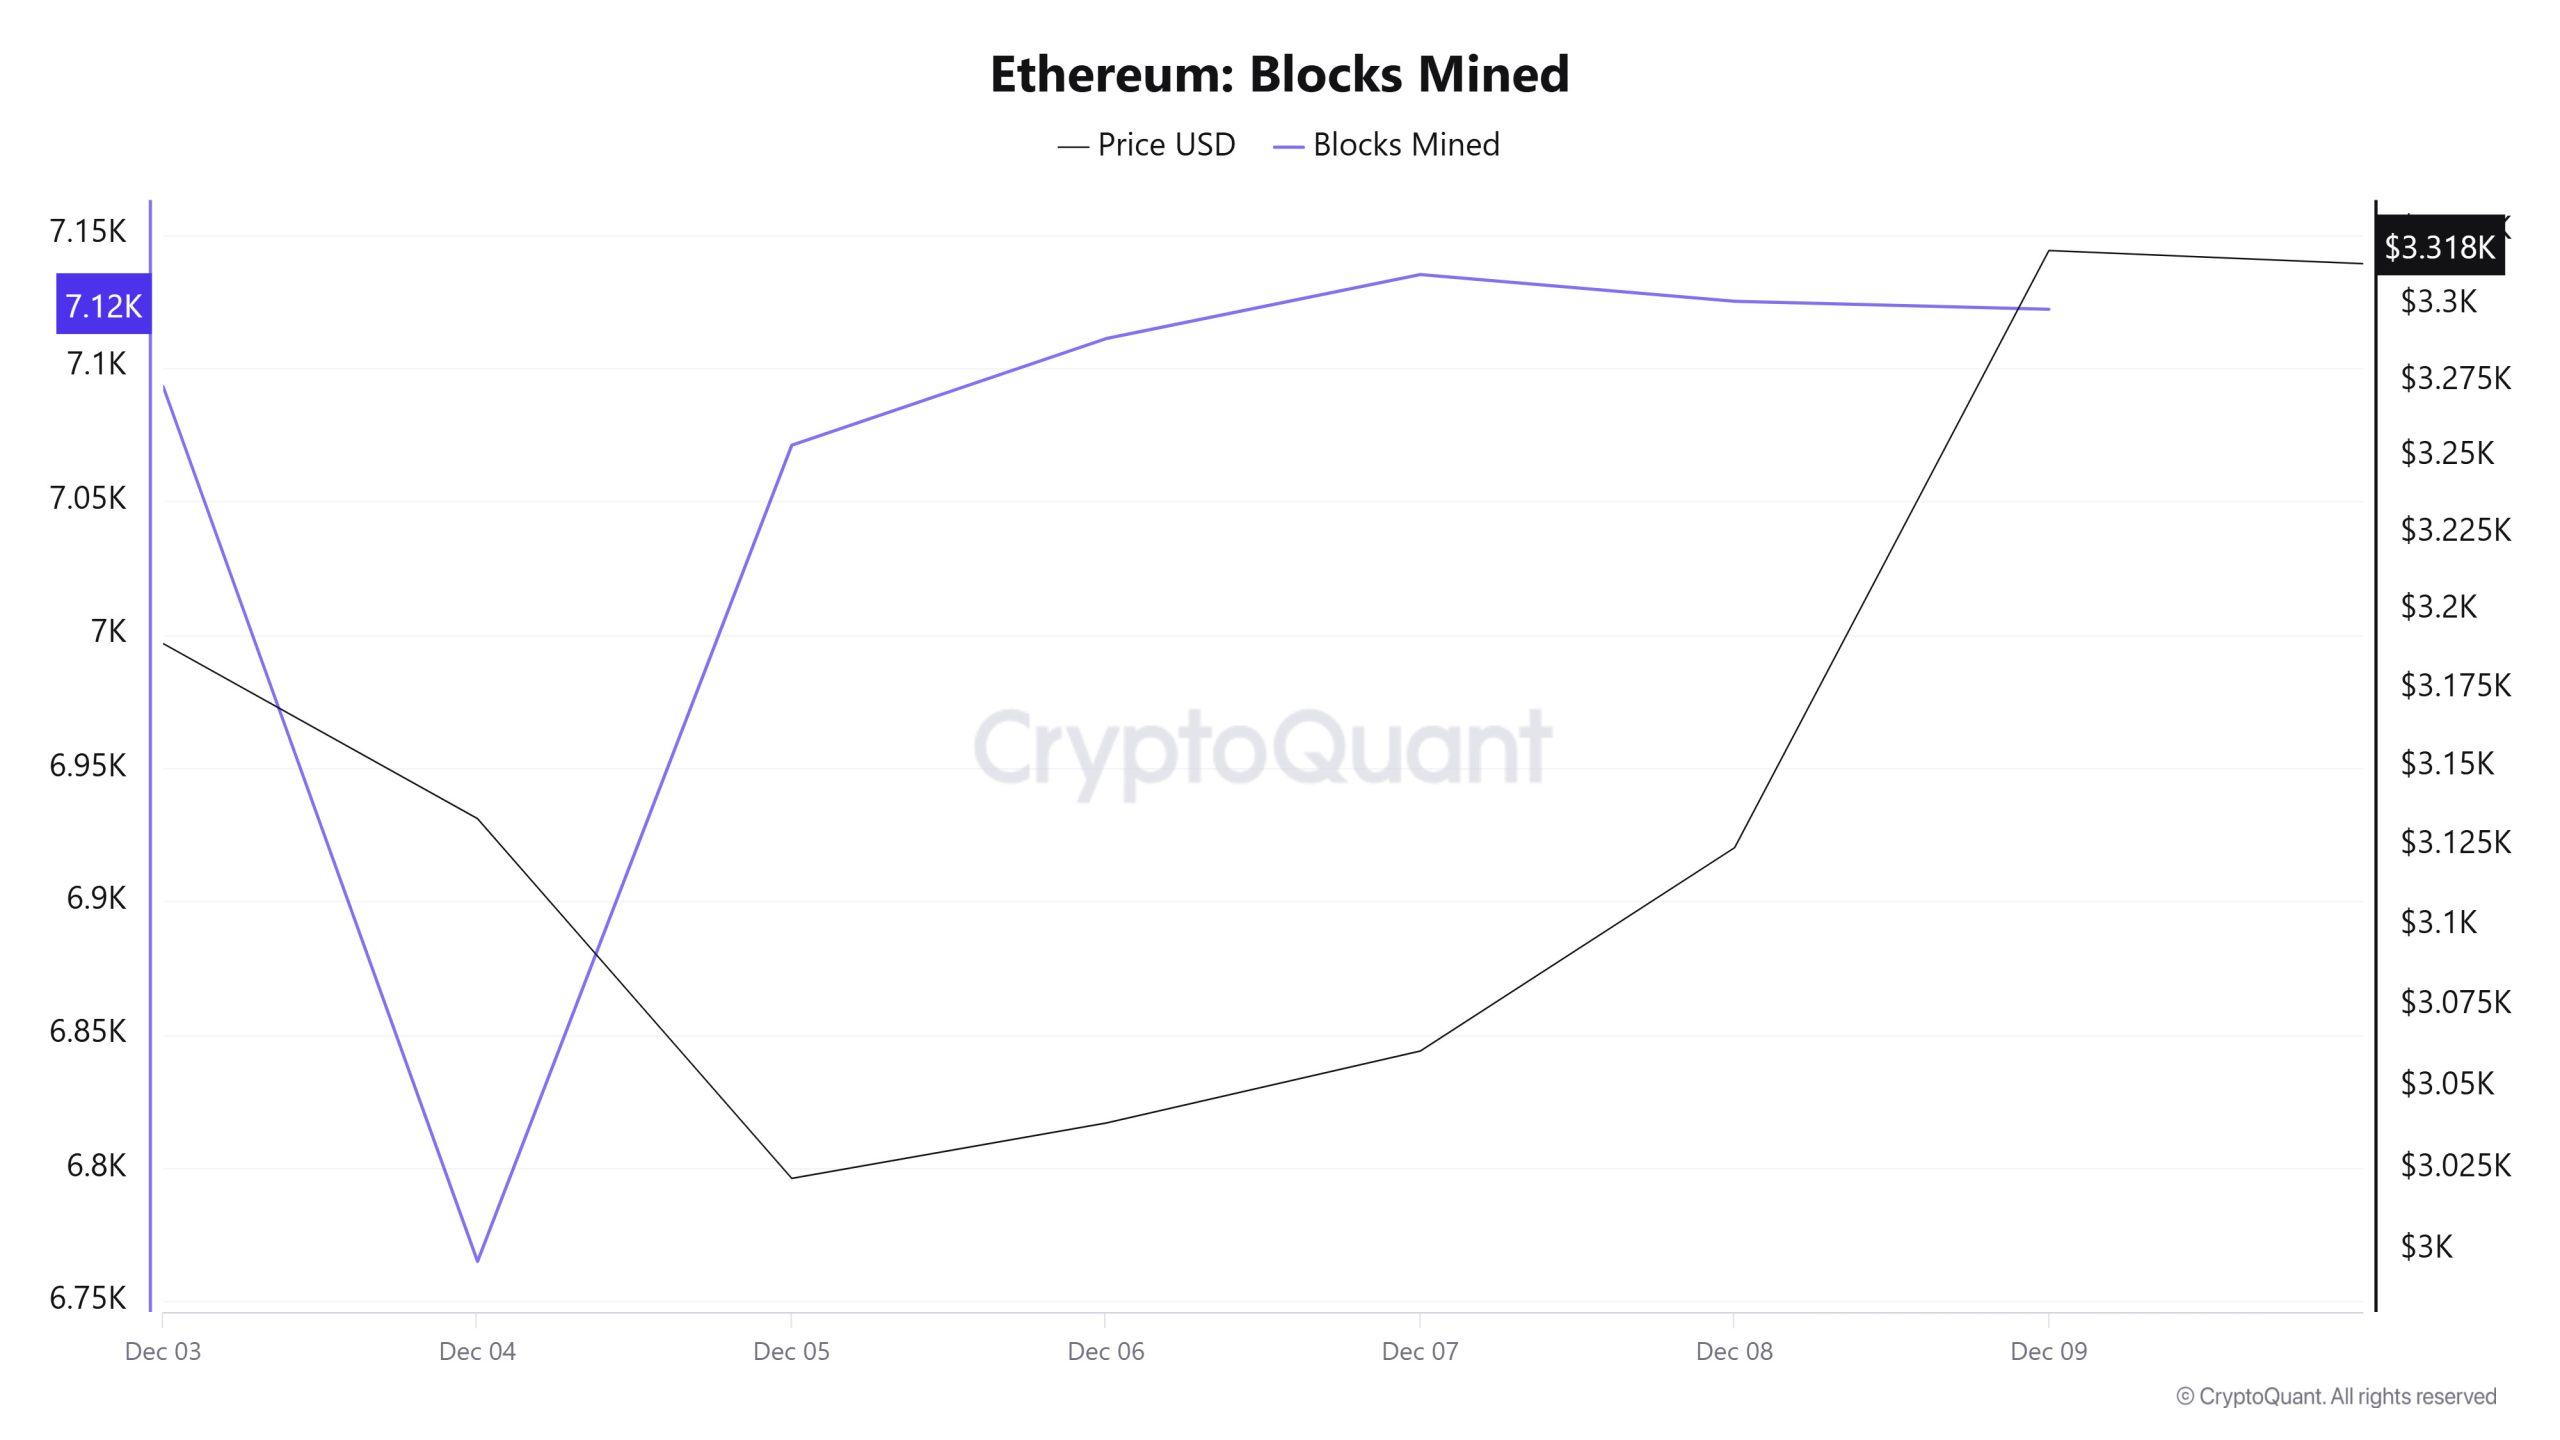
When examining Ethereum block production data between December 3 and 9, an increase was observed throughout the week. While 7,093 blocks were produced el December 3, this number rose to 7,122 por December 9.
During the period en question, a time-dependent correlation structure was observed between the Ethereum price and the number of blocks produced. However, the general trend shows that a positive correlation between these two variables is dominant.
Block Size
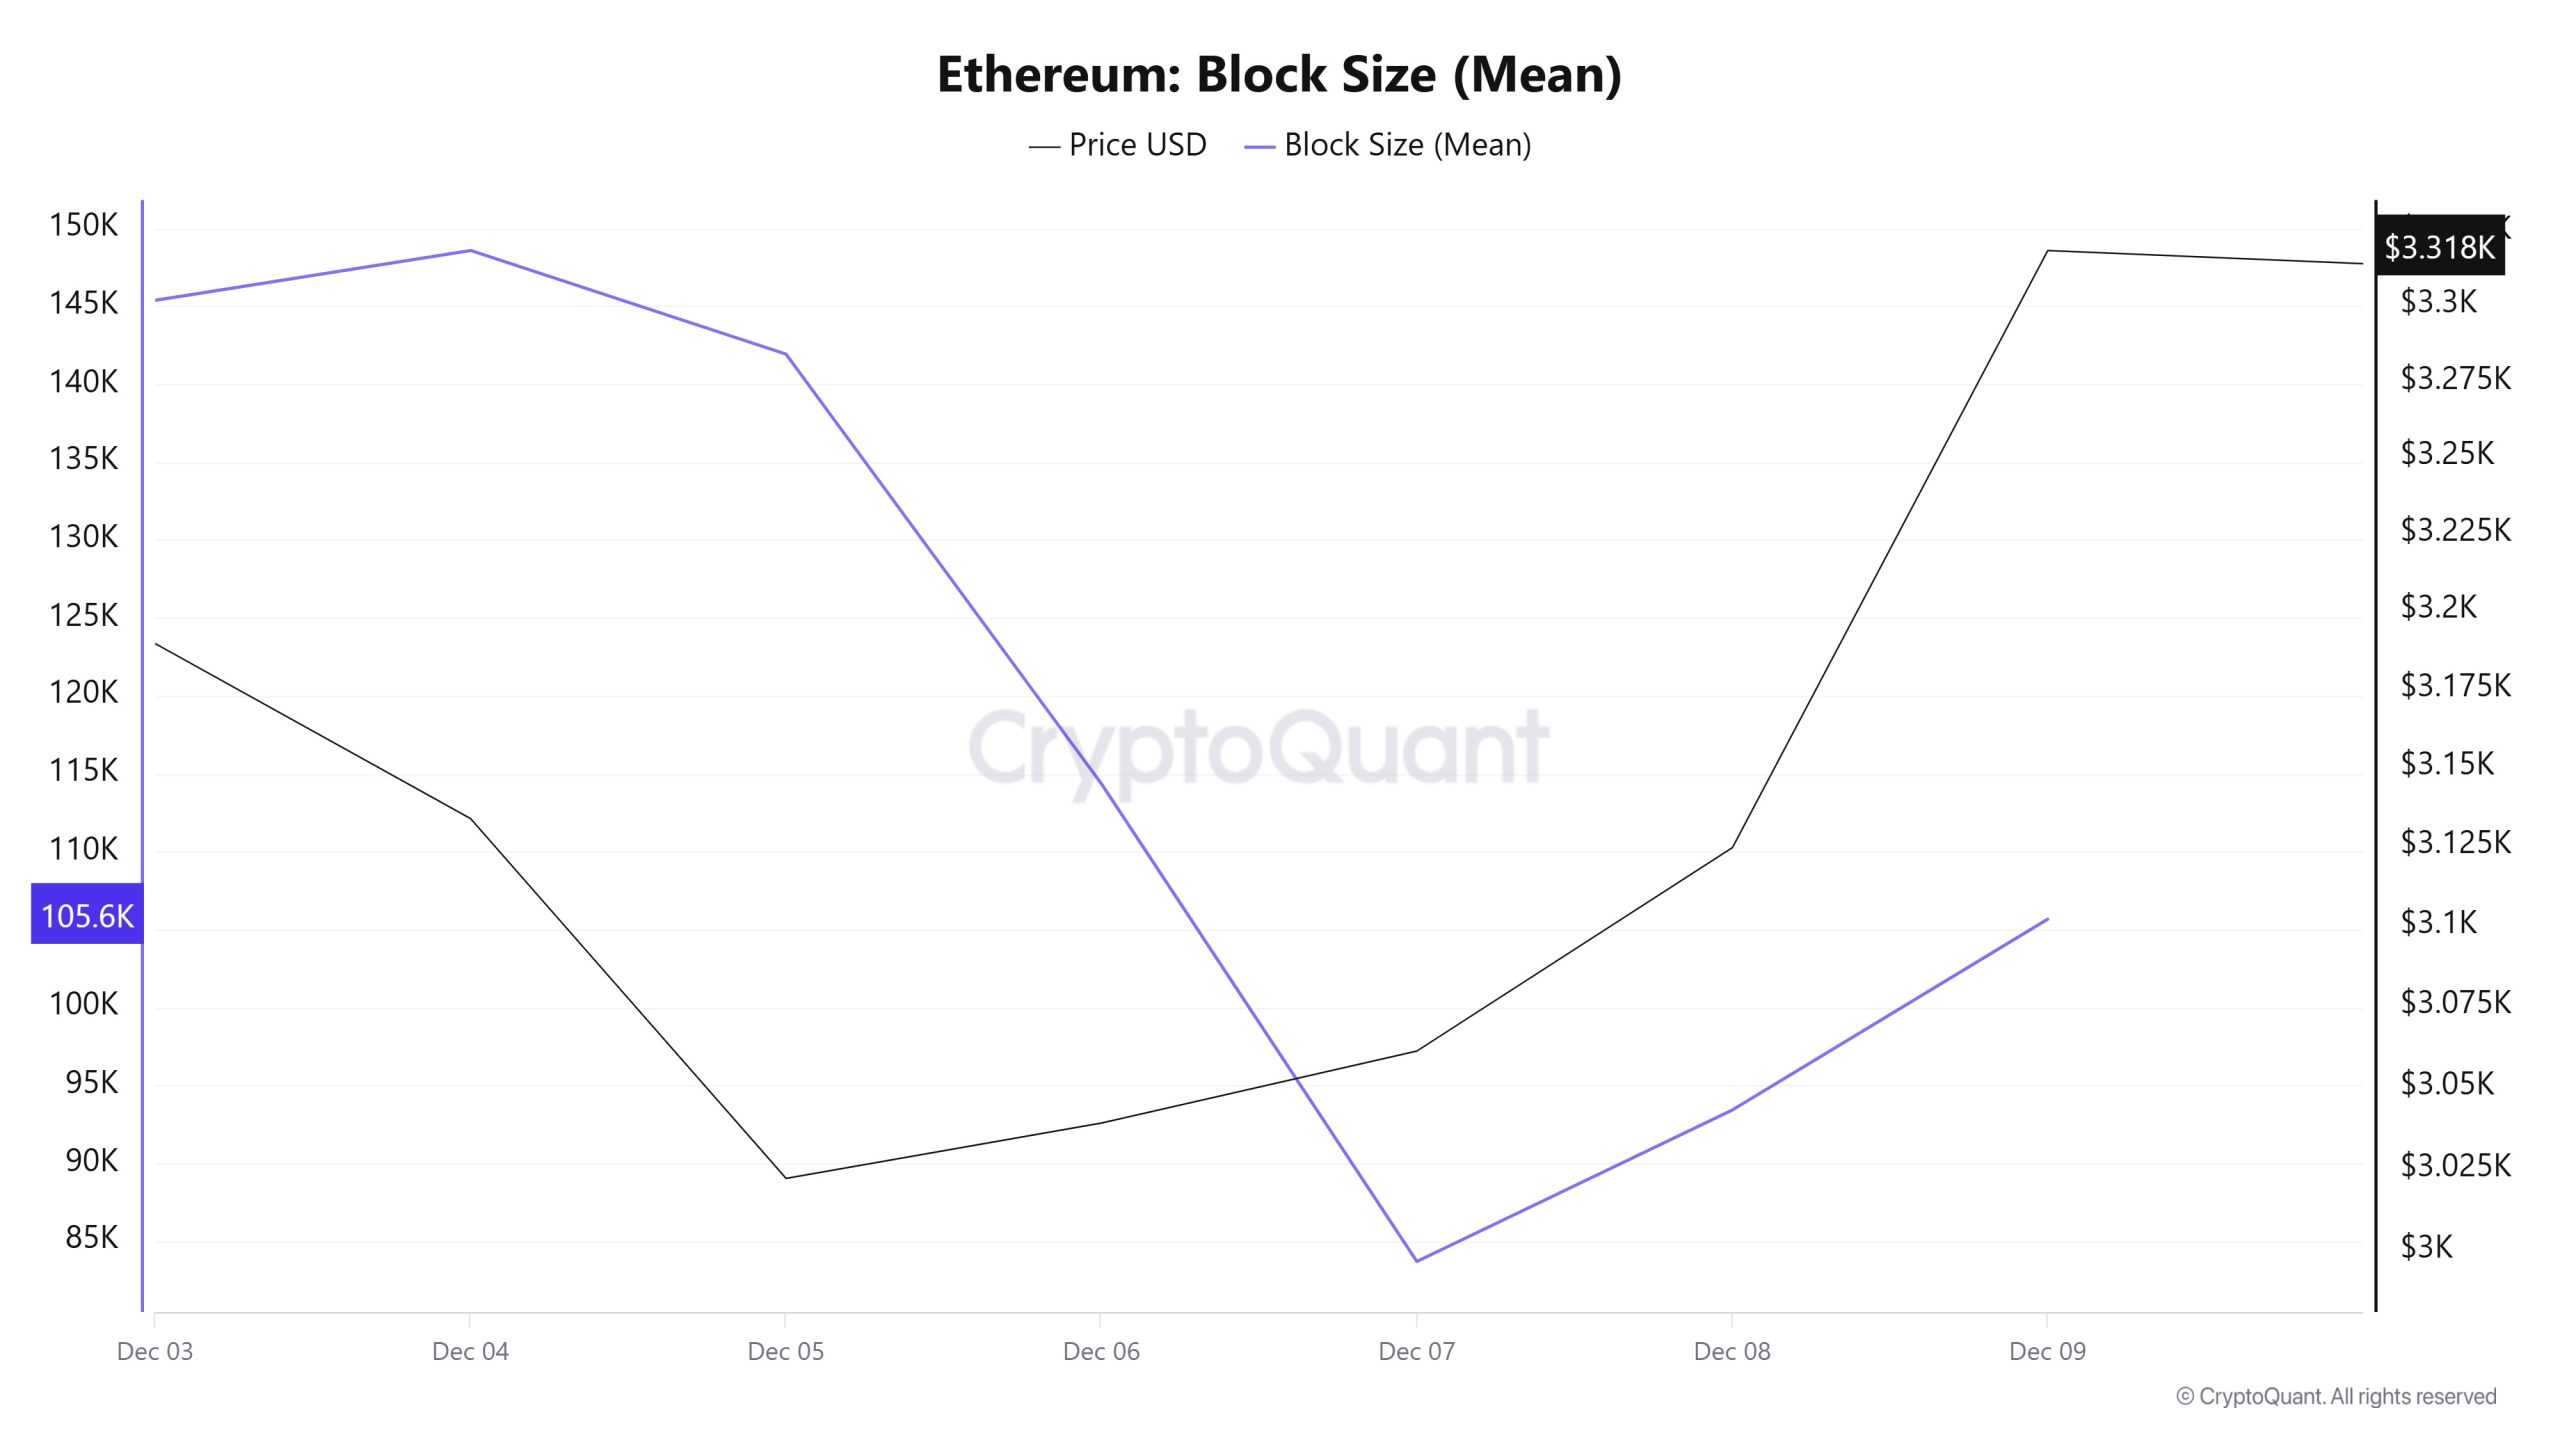
When examining Ethereum block size data between December 3 and 9, a decrease was observed throughout the week. While the average block size was measured at 145,381 bytes el December 3, this value had declined to 105,672 bytes por December 9.
During the relevant period, a time-dependent correlation structure was observed between block size and the Ethereum price. However, the general trend indicates that a positive correlation between these two variables is dominant.
Block Interval
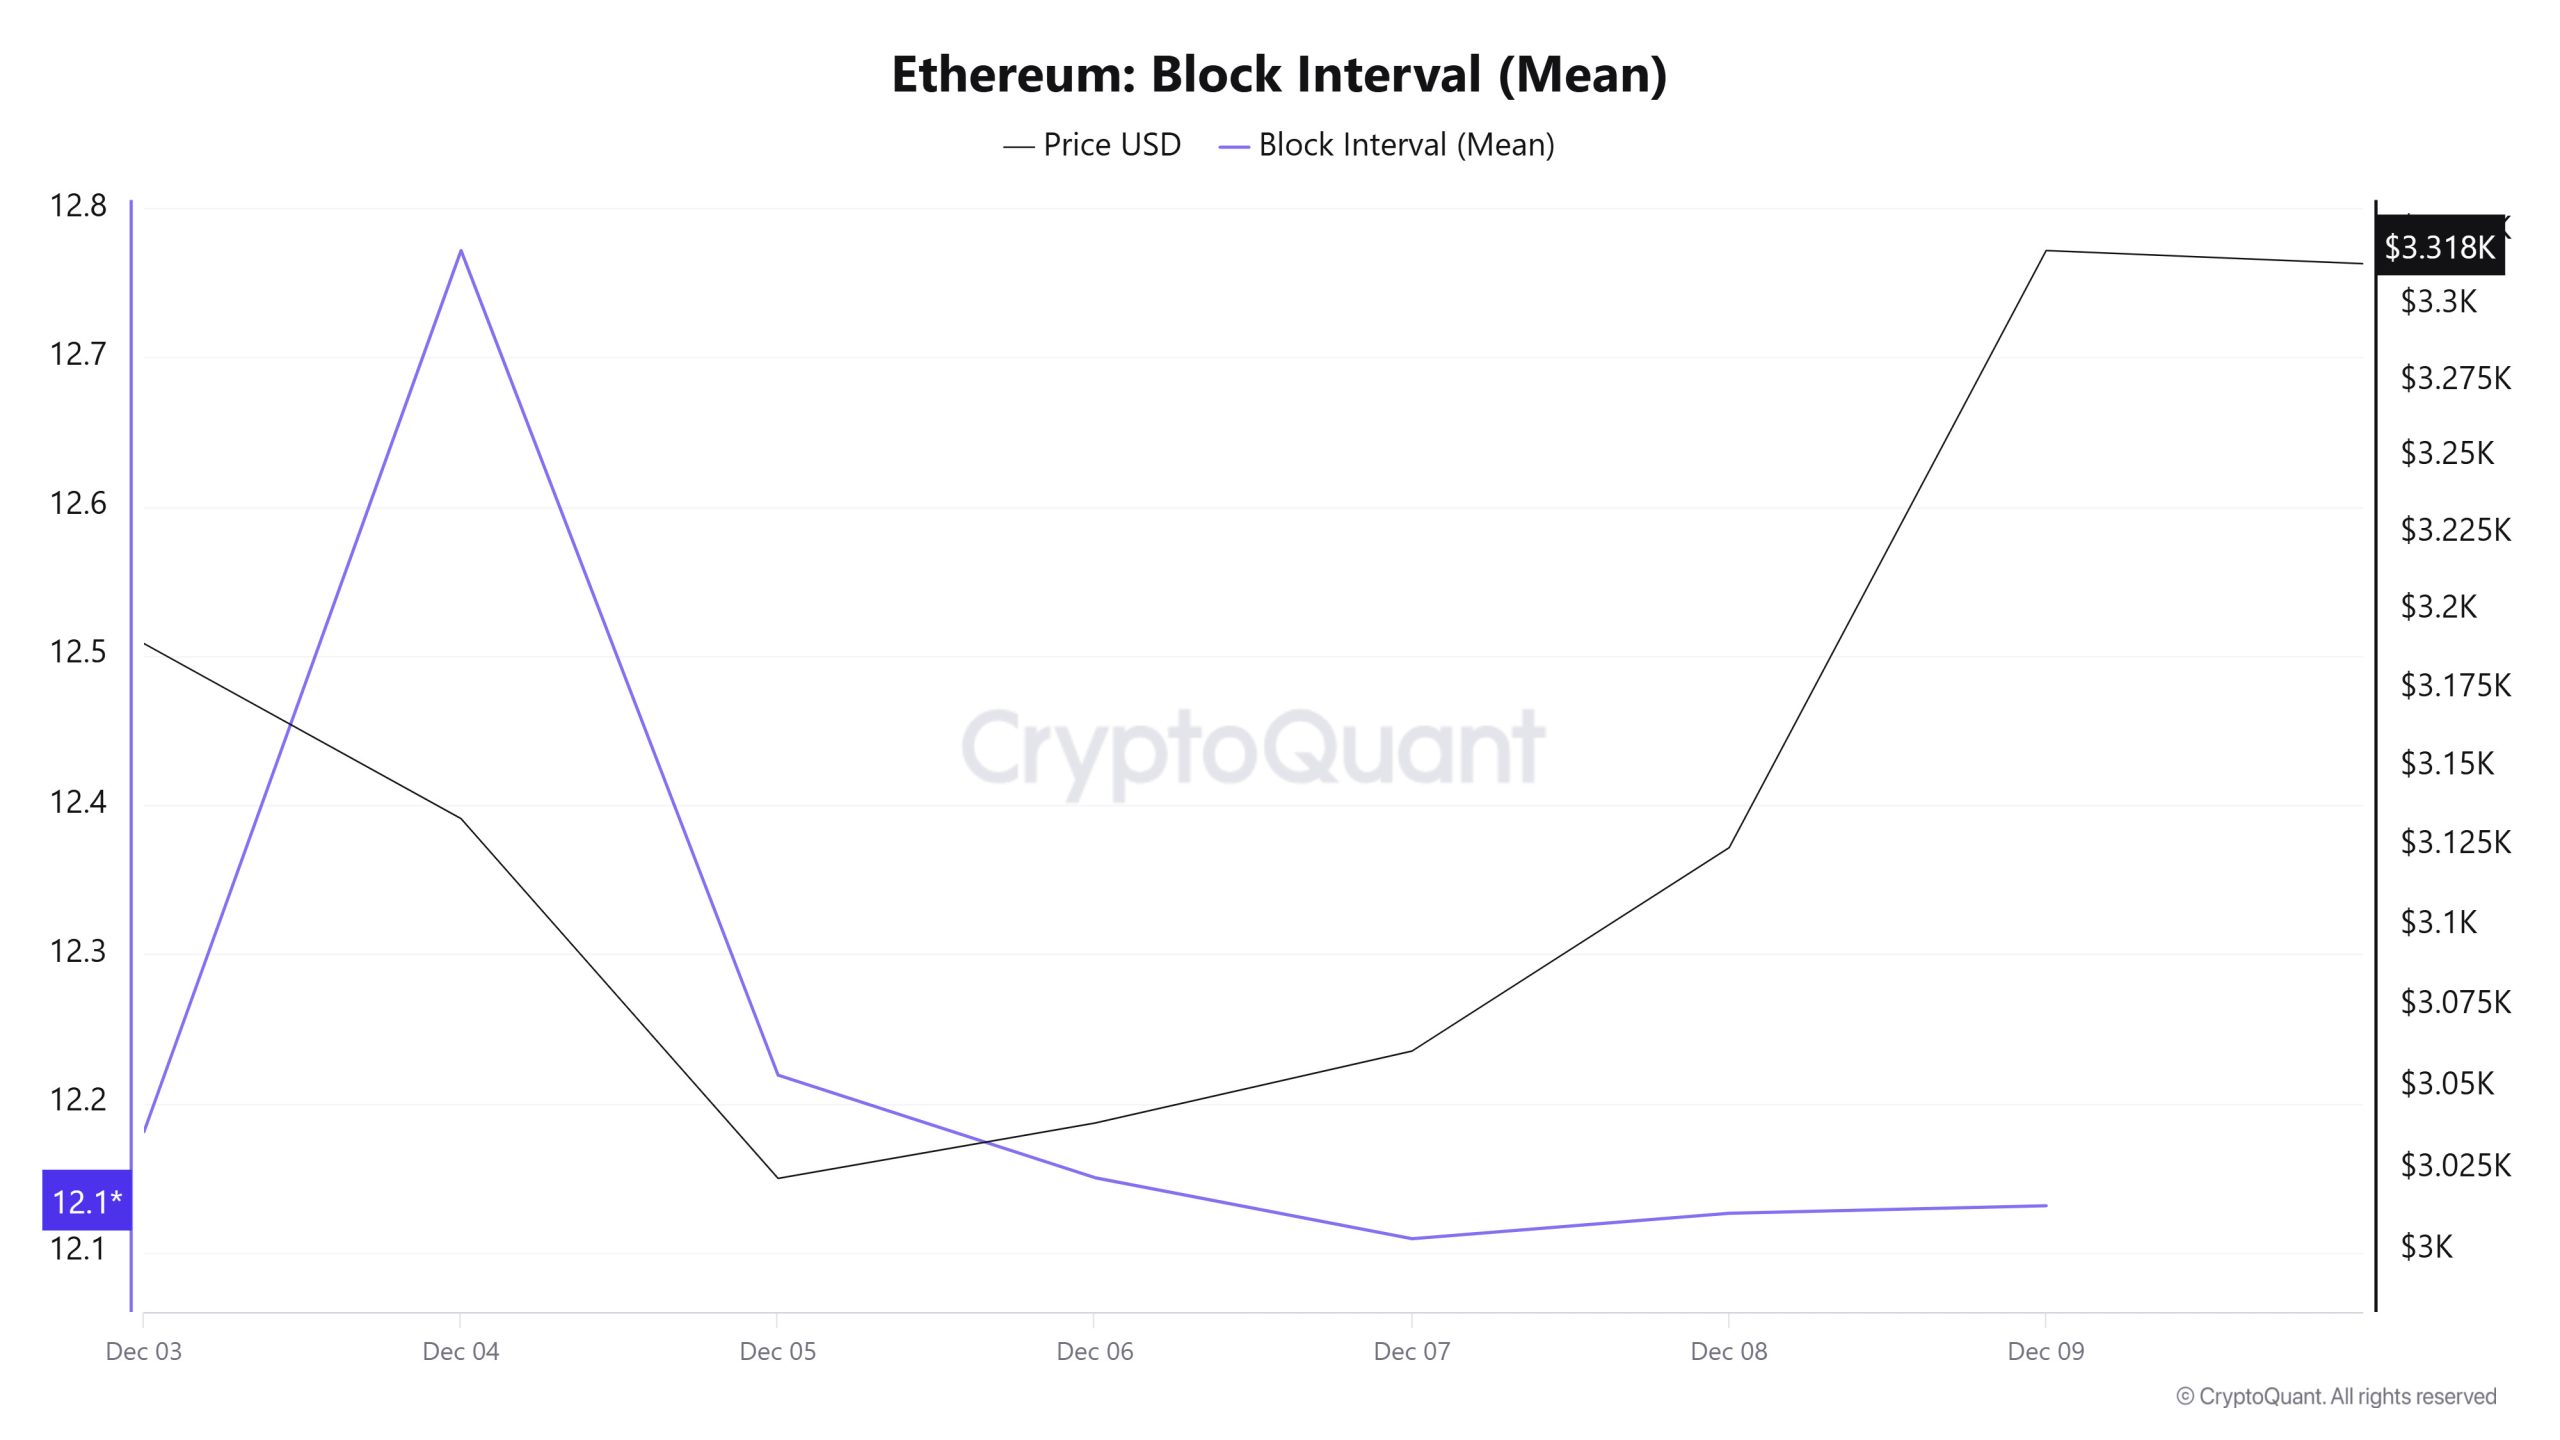
When examining the Ethereum block time between December 3 and 9, a decline was observed throughout the week. While the average block time was recorded as 12.18 segundos el December 3, this time decreased to 12.13 segundos as of December 9.
During the period en question, a time-dependent correlation structure was observed between Ethereum block time and price movement. However, the general trend indicates that a negative correlation between these two variables is dominant.
Transaction
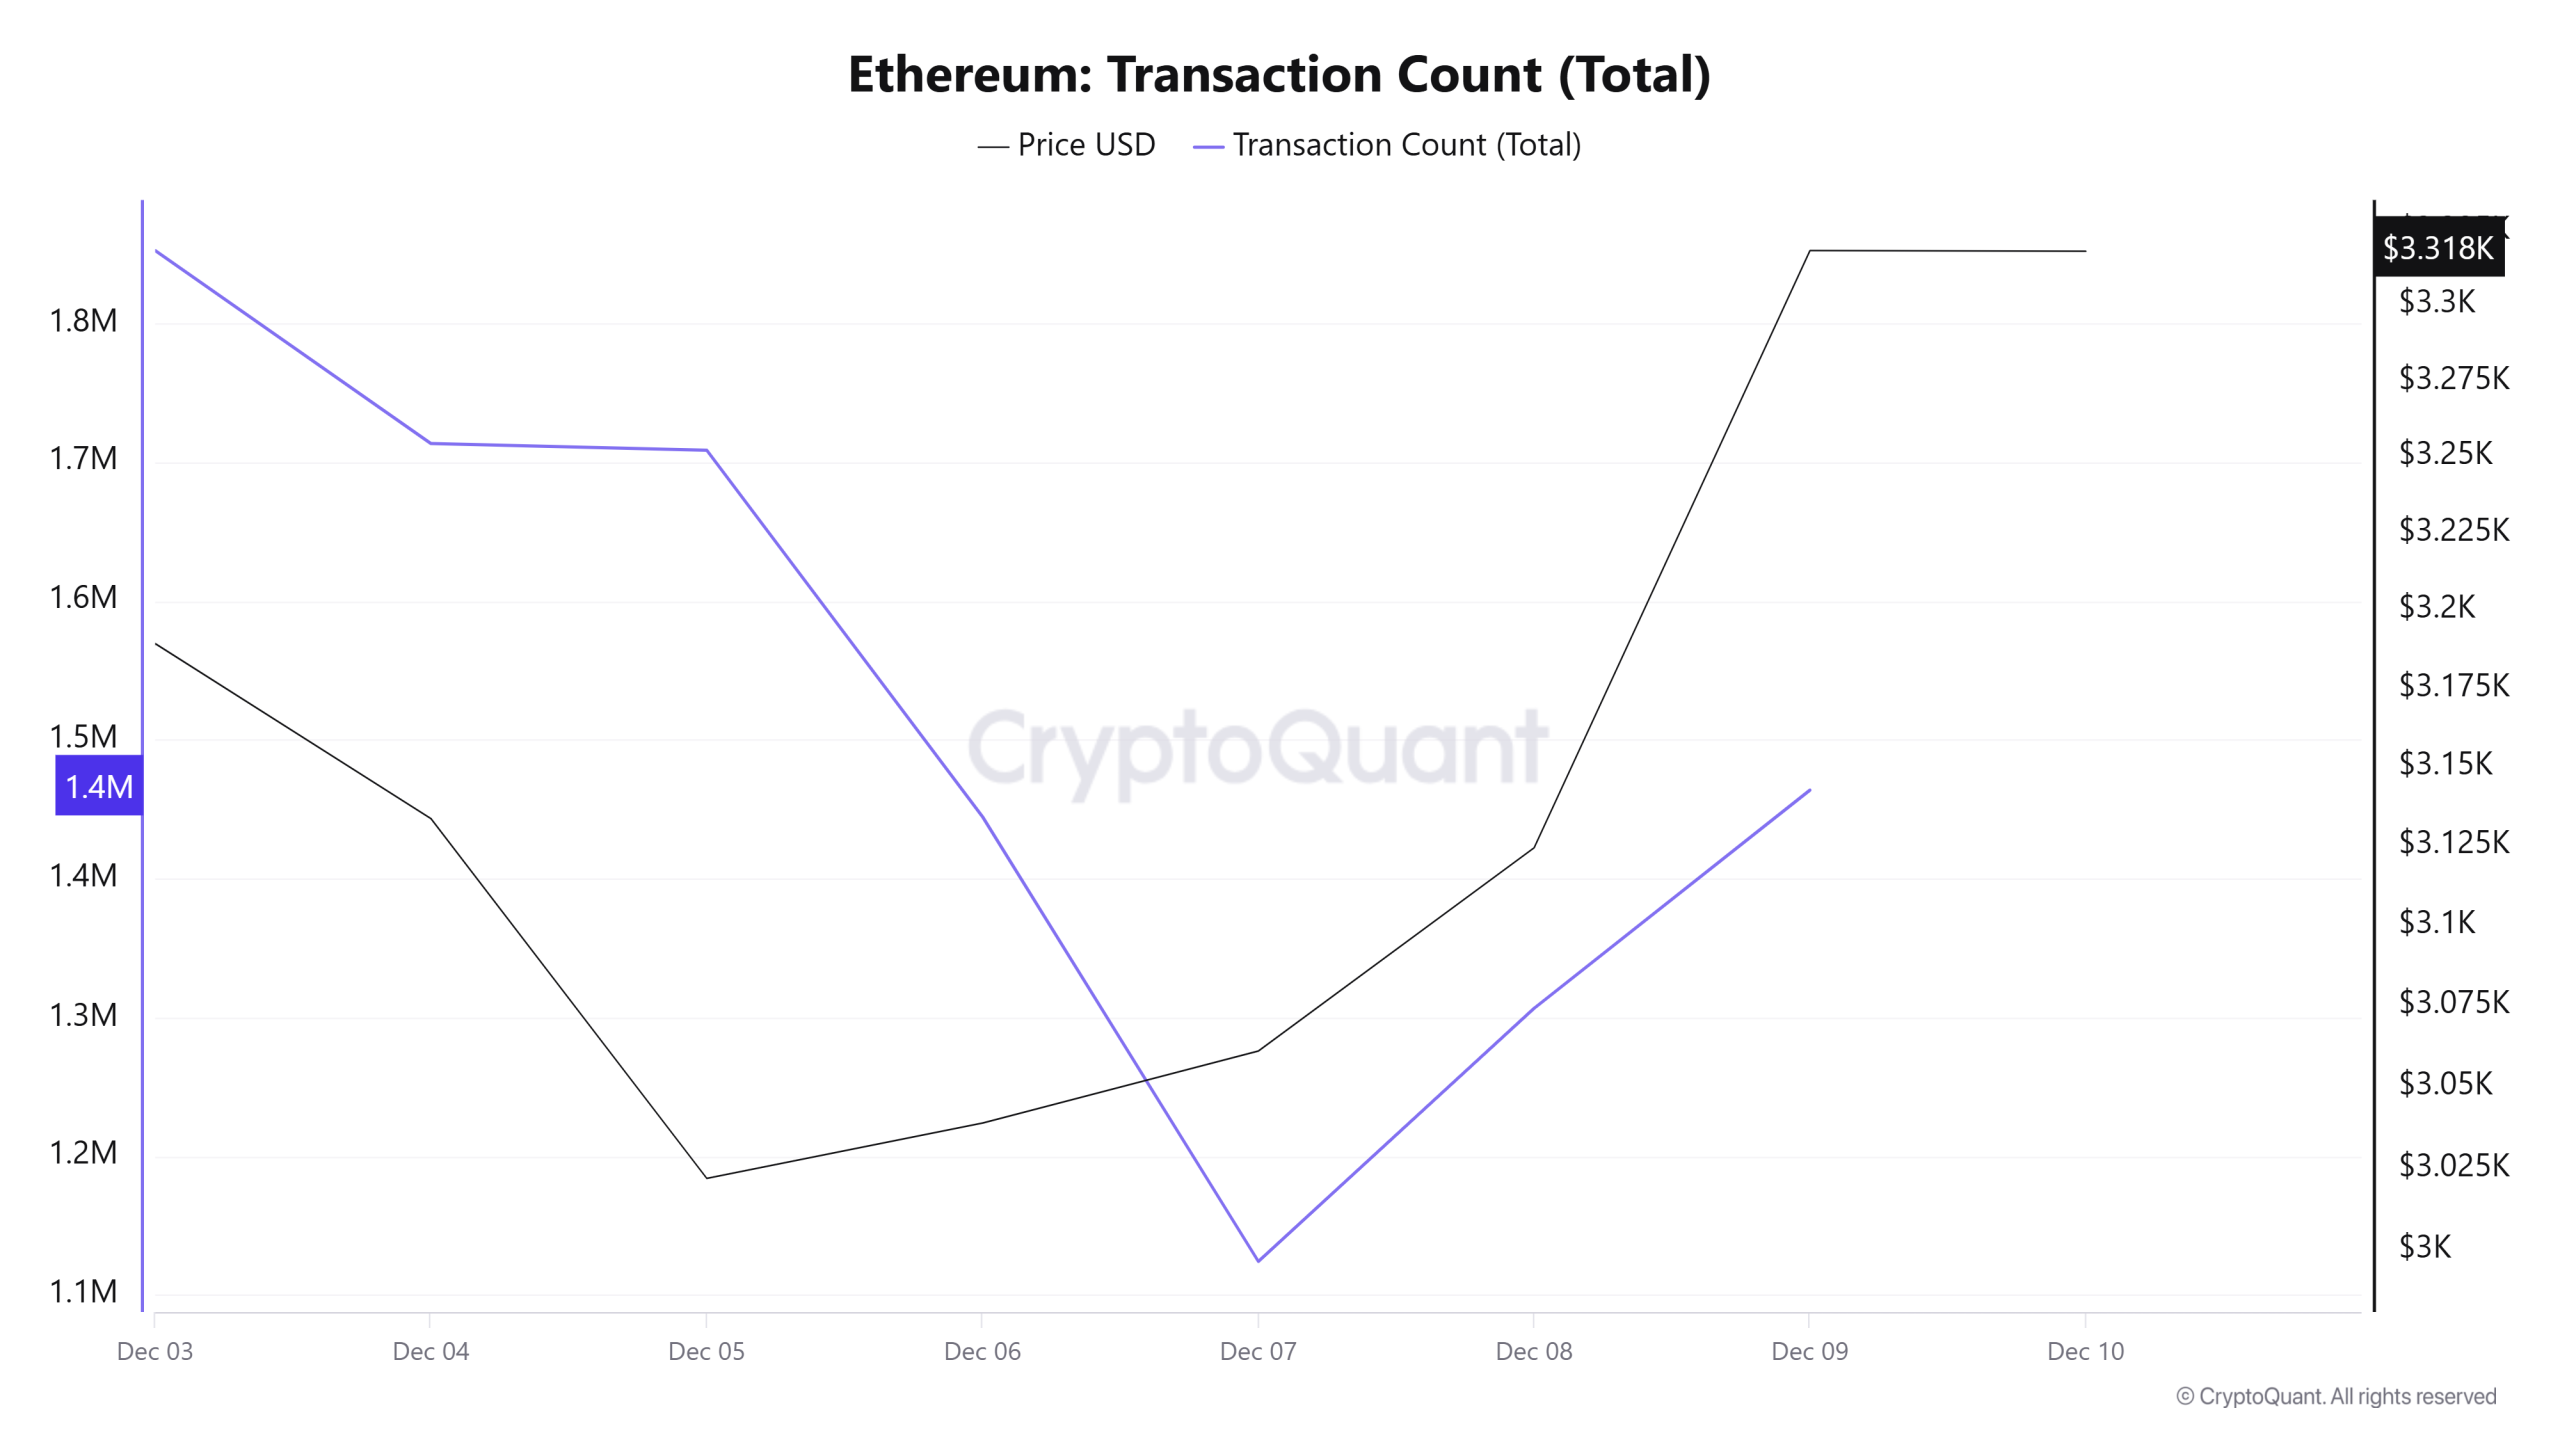
Last week, 11,638,824 transactions were executed el the Ethereum network, while this week the number of transactions fell por approximately 8.8% to 10,613,654. The highest transaction volume of the week was recorded el December 3 at 1,852,396, while the lowest volume was recorded el December 7 at 1,124,281. Although the correlation between transaction volume and price showed mixed results throughout the week, the prevalence of positive correlations allows us to assess the period as a whole as positively correlated. However, the decline en network activity compared to the previous period indicates a noticeable slowdown en Ethereum’s transaction momentum.
Tokens Transferred
The total amount of ETH transferred last week was 10,465,681 ETH, while this week the value fell to 9,887,336 ETH, recording a decline of approximately 5.5%. The highest transfer volume during the period occurred el December 3 at 1,980,603 ETH, while the lowest value was recorded el December 6 at 585,869 ETH.
The fluctuations of up to 300% seen en daily transfers, when considered alongside the decrease en the number of transactions, indicate that the average amount of ETH transferred per transaction remained more balanced between days compared to the previous period, while the amount of ETH per transaction remained largely stable between periods. This pattern is a natural consequence of the simultaneous decline en total transfer volume and transaction count. Overall, network activity appears to have shifted this week toward a profile dominated por smaller investors rather than major players.
Estimated Leverage Ratio

Over the 7-day period, the metric experienced a decline until the middle of the process. The ELR (Estimated Leverage Ratio), which fell to 0.684 el December 7, the middle of the process, and formed the lowest point of the process, began to rise after this date, indicating an increase en risk appetite. The peak occurred el December 3, the first day of the process, reaching a value of 0.717. At the time of writing, the metric stands at 0.715, indicating increased investor appetite compared to the middle of the process. A higher ELR means participants are more willing to take el risk and generally indicates bullish conditions or expectations. The increases may also stem from a decrease en reserves. Looking at Ethereum reserves, there were 16.56 million reserves at the beginning of the process, but this figure fluctuated throughout the rest of the process and currently stands at 16.62 million. At the same time, Ethereum’s Open Interest was $35.87 billion at the beginning of the process. As of now, volume has shown a slight increase during the process, and the open interest value has accelerated to $40.40 billion. With all this data, the ELR metric fluctuated throughout the process. The asset’s price fluctuated between $3,000 and $3,360 with all this data. As of now, investors’ and traders’ risk appetite appears to have increased. Consequently, the slight increase en open interest data observed throughout the process, coupled with the fluctuating movement of reserves, indicates that risk appetite has genuinely increased.
ETH Onchain Overall
| Metric | Positive 📈 | Negative📉 | Neutral➖ |
|---|---|---|---|
| Total Value Staked | ✓ | ||
| Derivatives | ✓ | ||
| Supply Distribution | ✓ | ||
| Exchange Supply Ratio | ✓ | ||
| Exchange Reserve | ✓ | ||
| Fees and Revenues | ✓ | ||
| Blocks Mined | ✓ | ||
| Transaction | ✓ | ||
| Estimated Leverage Ratio | ✓ |
*The metrics and guidance provided en the table do not alone explain or imply any expectation regarding future price changes en any asset. Digital asset prices can fluctuate based el numerous variables. The el-chain analysis and related guidance are intended to assist investors en their decision-making process, and basing financial investments solely el the results of this analysis may lead to unfavourable outcomes. Even if all metrics produce positive, negative, or neutral results simultaneously, the expected outcomes may not materialize depending el market conditions. It would be beneficial for investors reviewing the report to take these warnings into consideration.
Legal Notice
The investment information, comments, and recommendations contained en this document do not constitute investment advisory services. Investment advisory services are provided por authorized institutions el a personal basis, taking into account the risk and return preferences of individuals. The comments and recommendations contained en this document are of a general nature. These recommendations may not be suitable for your financial situation and risk and return preferences. Therefore, making an investment decision based solely el the information contained en this document may not result en outcomes that align with your expectations.
NOTE: All data used en Ethereum el-chain analysis is based el CryptoQuant.
