Active Addresses
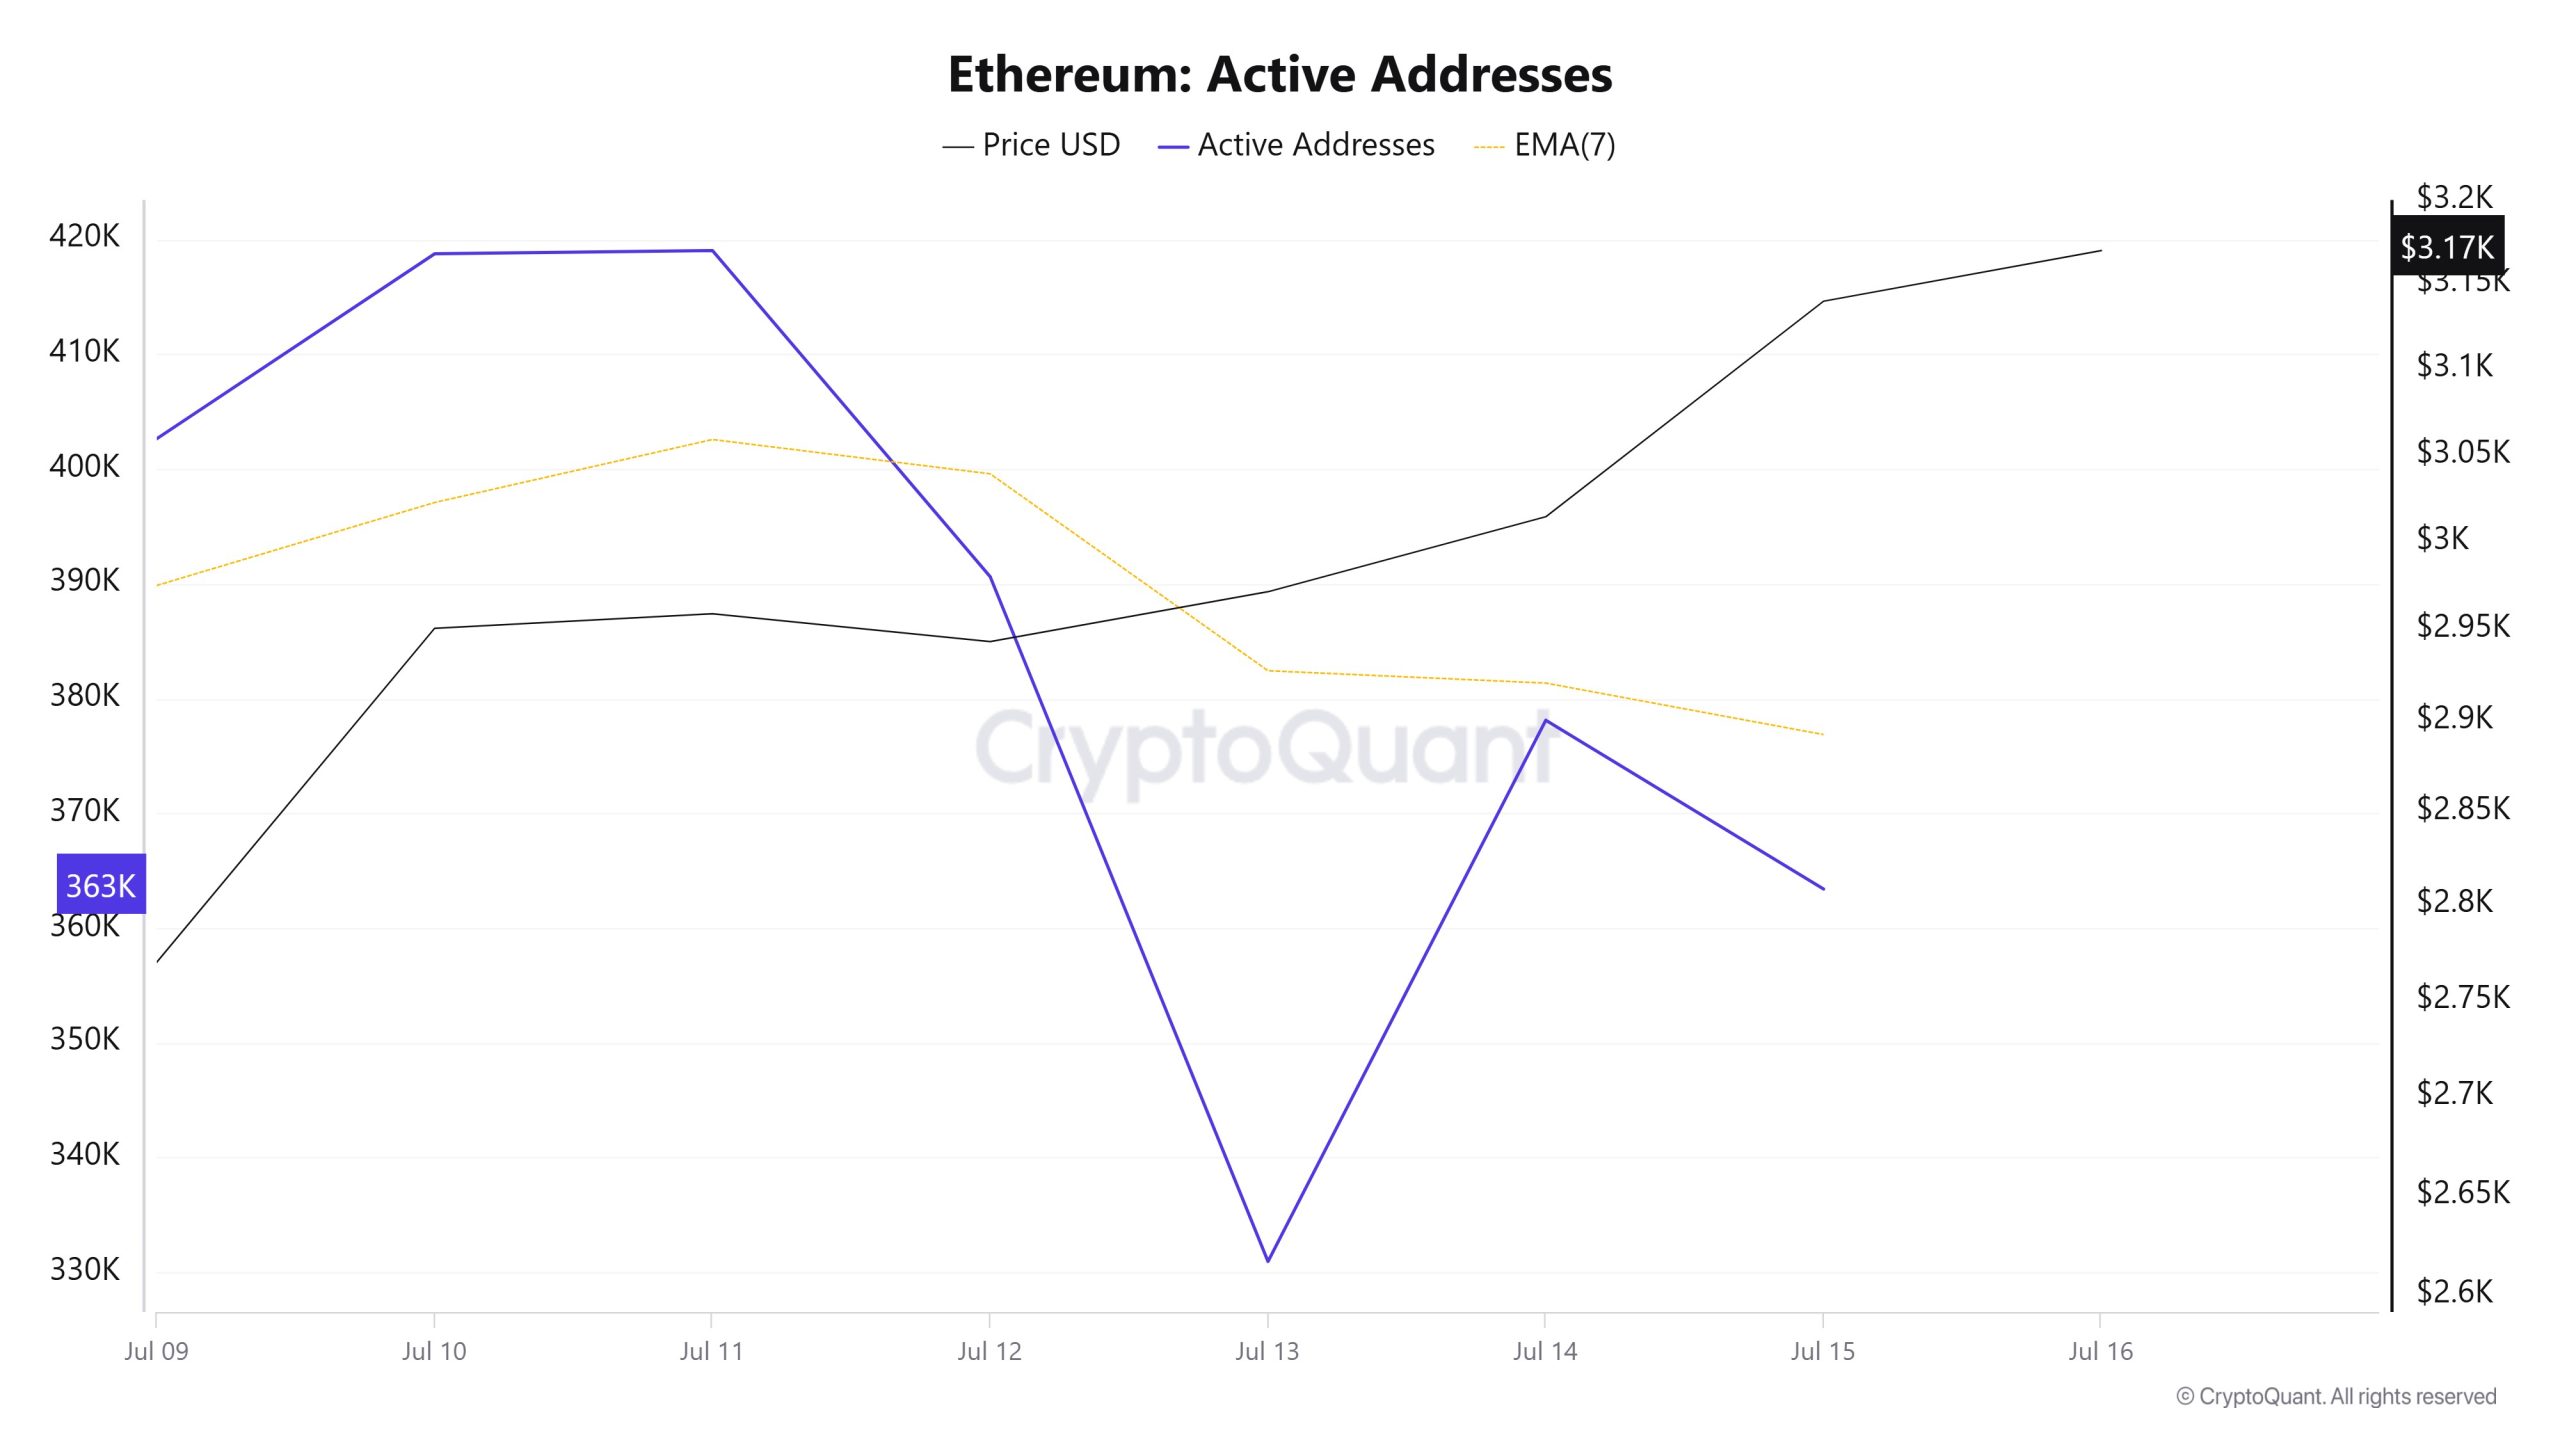
Between July 9-16, a total of 419,024 active addresses entered the Ethereum network. During this period, the Ethereum price rose from $2,769 to $3,170. Especially el July 13, at the intersection of the price and the number of active addresses, there was a significant drop en the number of active addresses while the price continued to rise. This suggests that despite the price increase, short-term participation has decreased and is likely to be dominated por trades among existing investors. When the 7-day simple moving average (SMA) is analyzed, it is seen that a general upward trend is dominant en the Ethereum price.
Active Sending Addresses
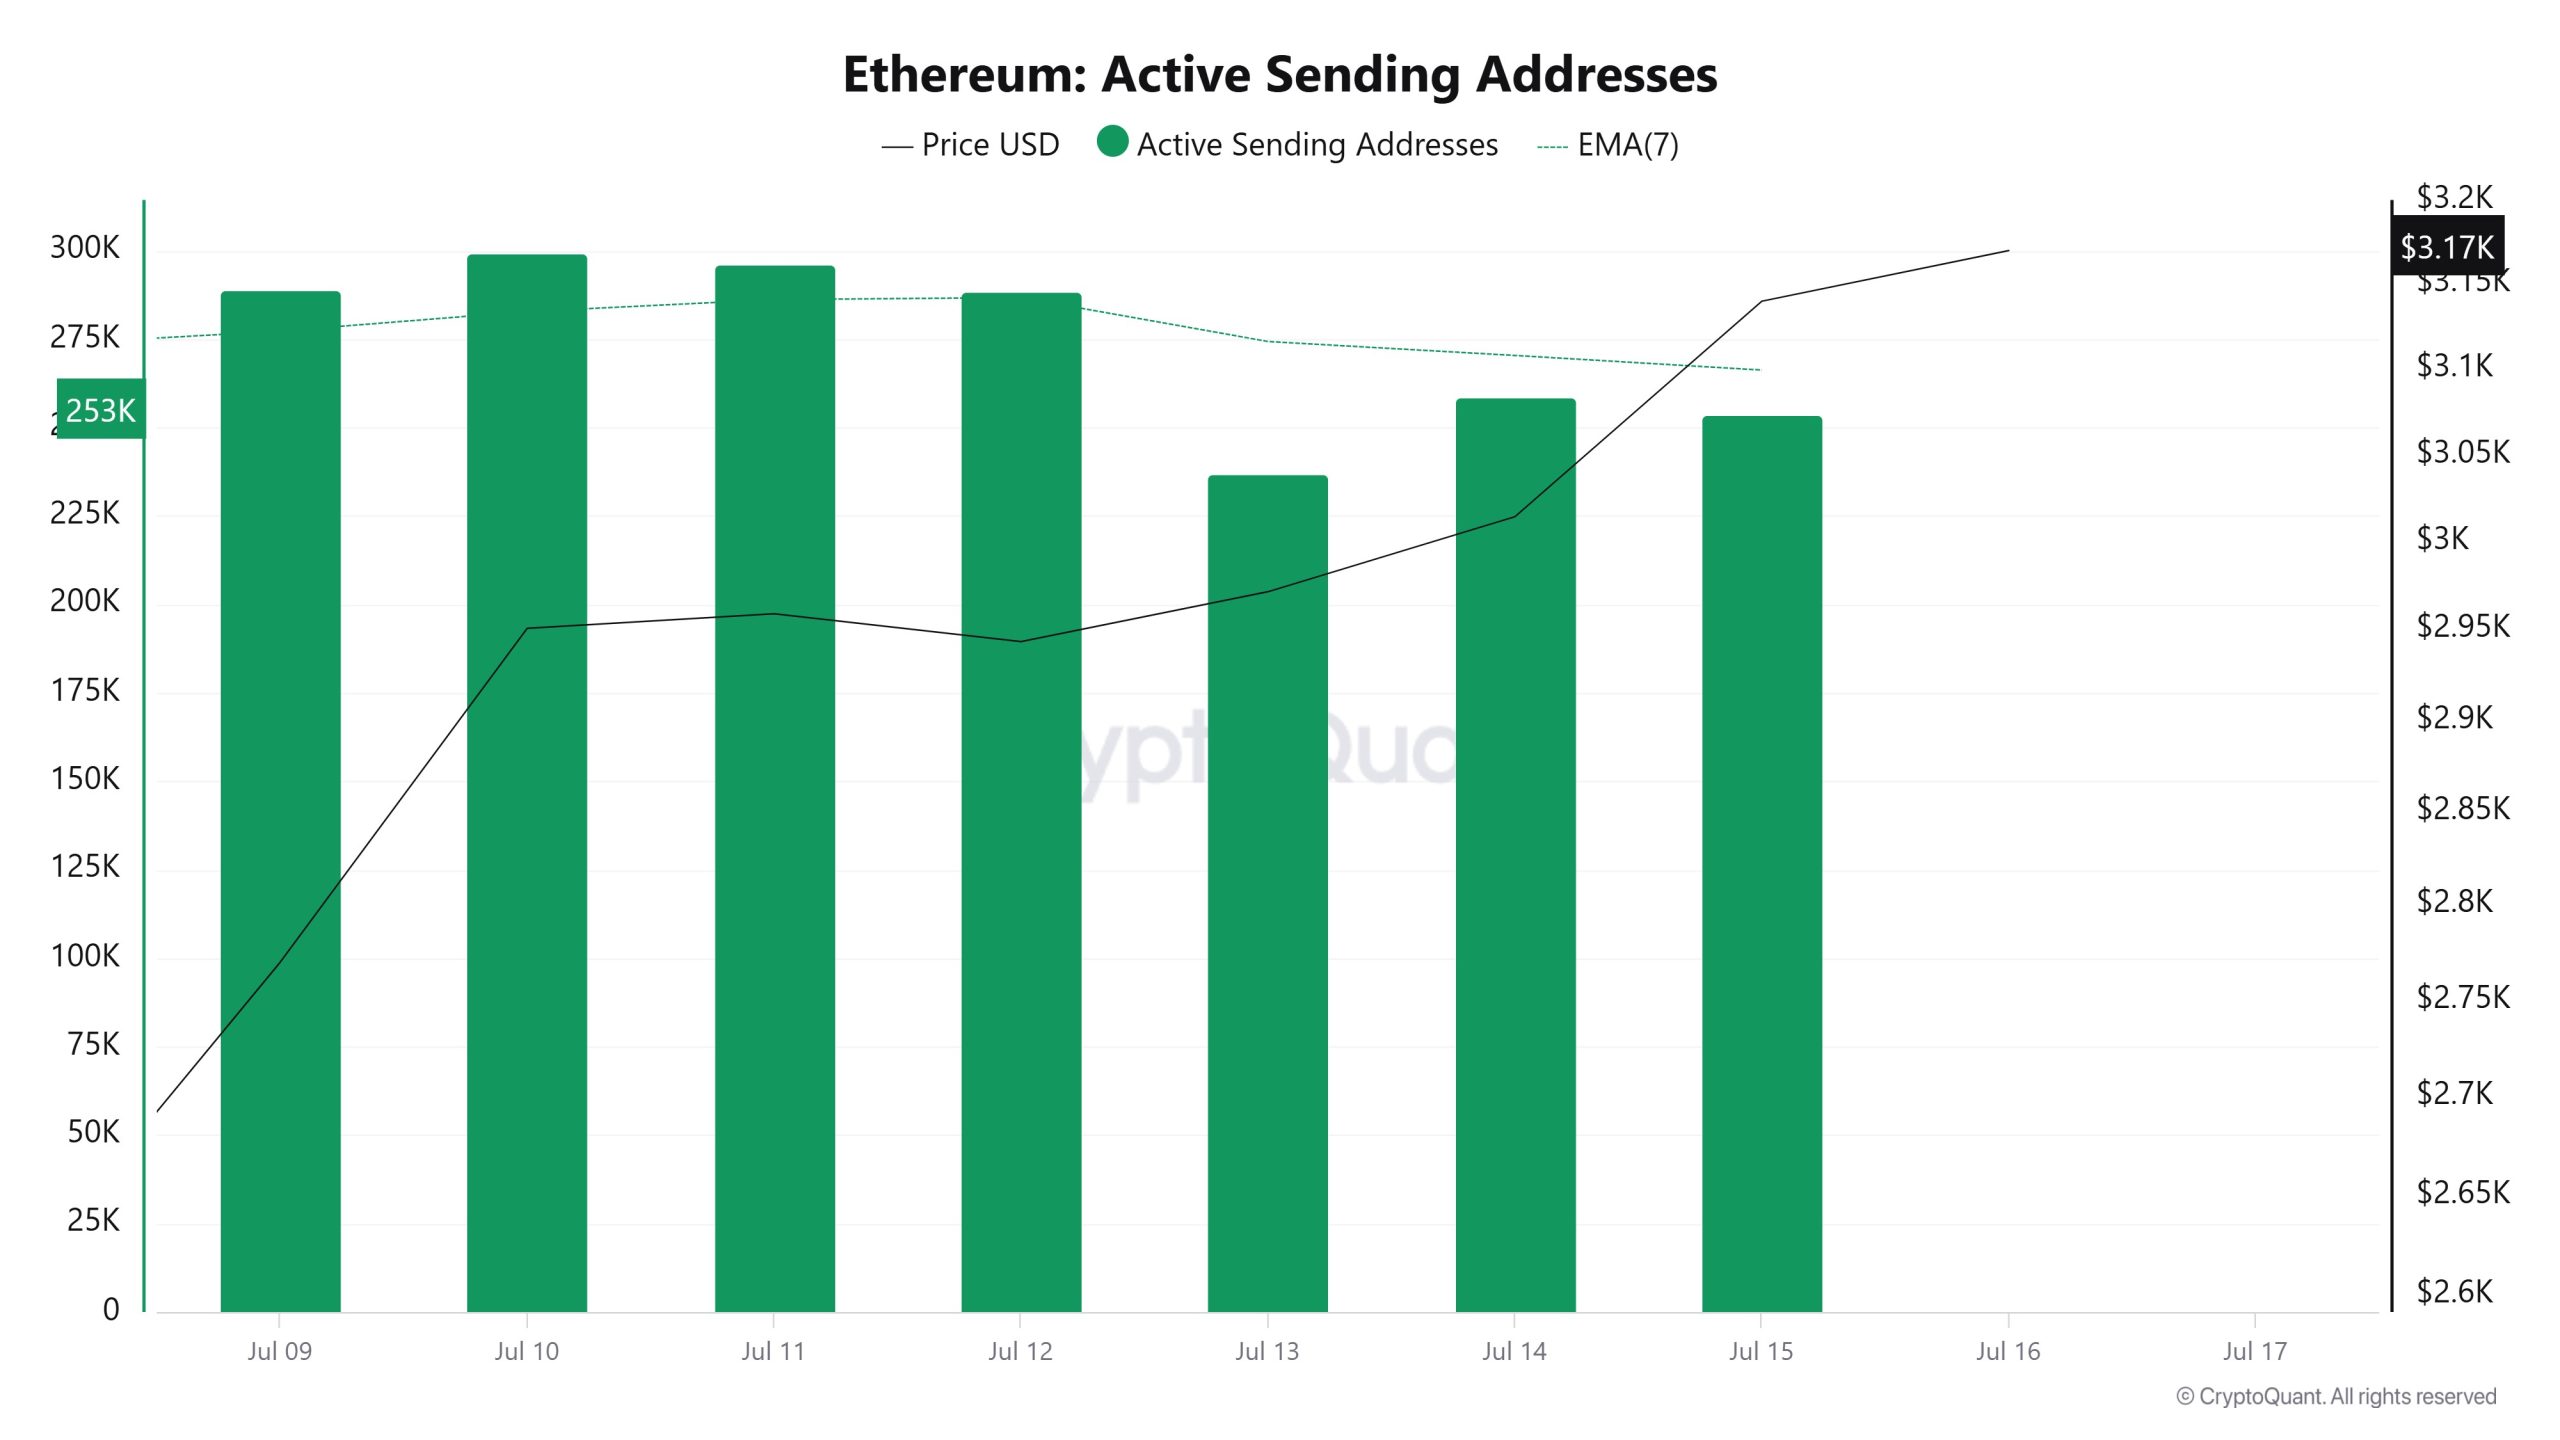
Between July 9 and July 16, a bullish movement was observed en active shipping addresses with the Black Line (price line). On the day when the price reached a weekly high, active sending addresses were at 299,316; Between July 9-12, Ethereum wallets were seen to rise at a similar point el a weekly basis.
Active Receiving Addresses
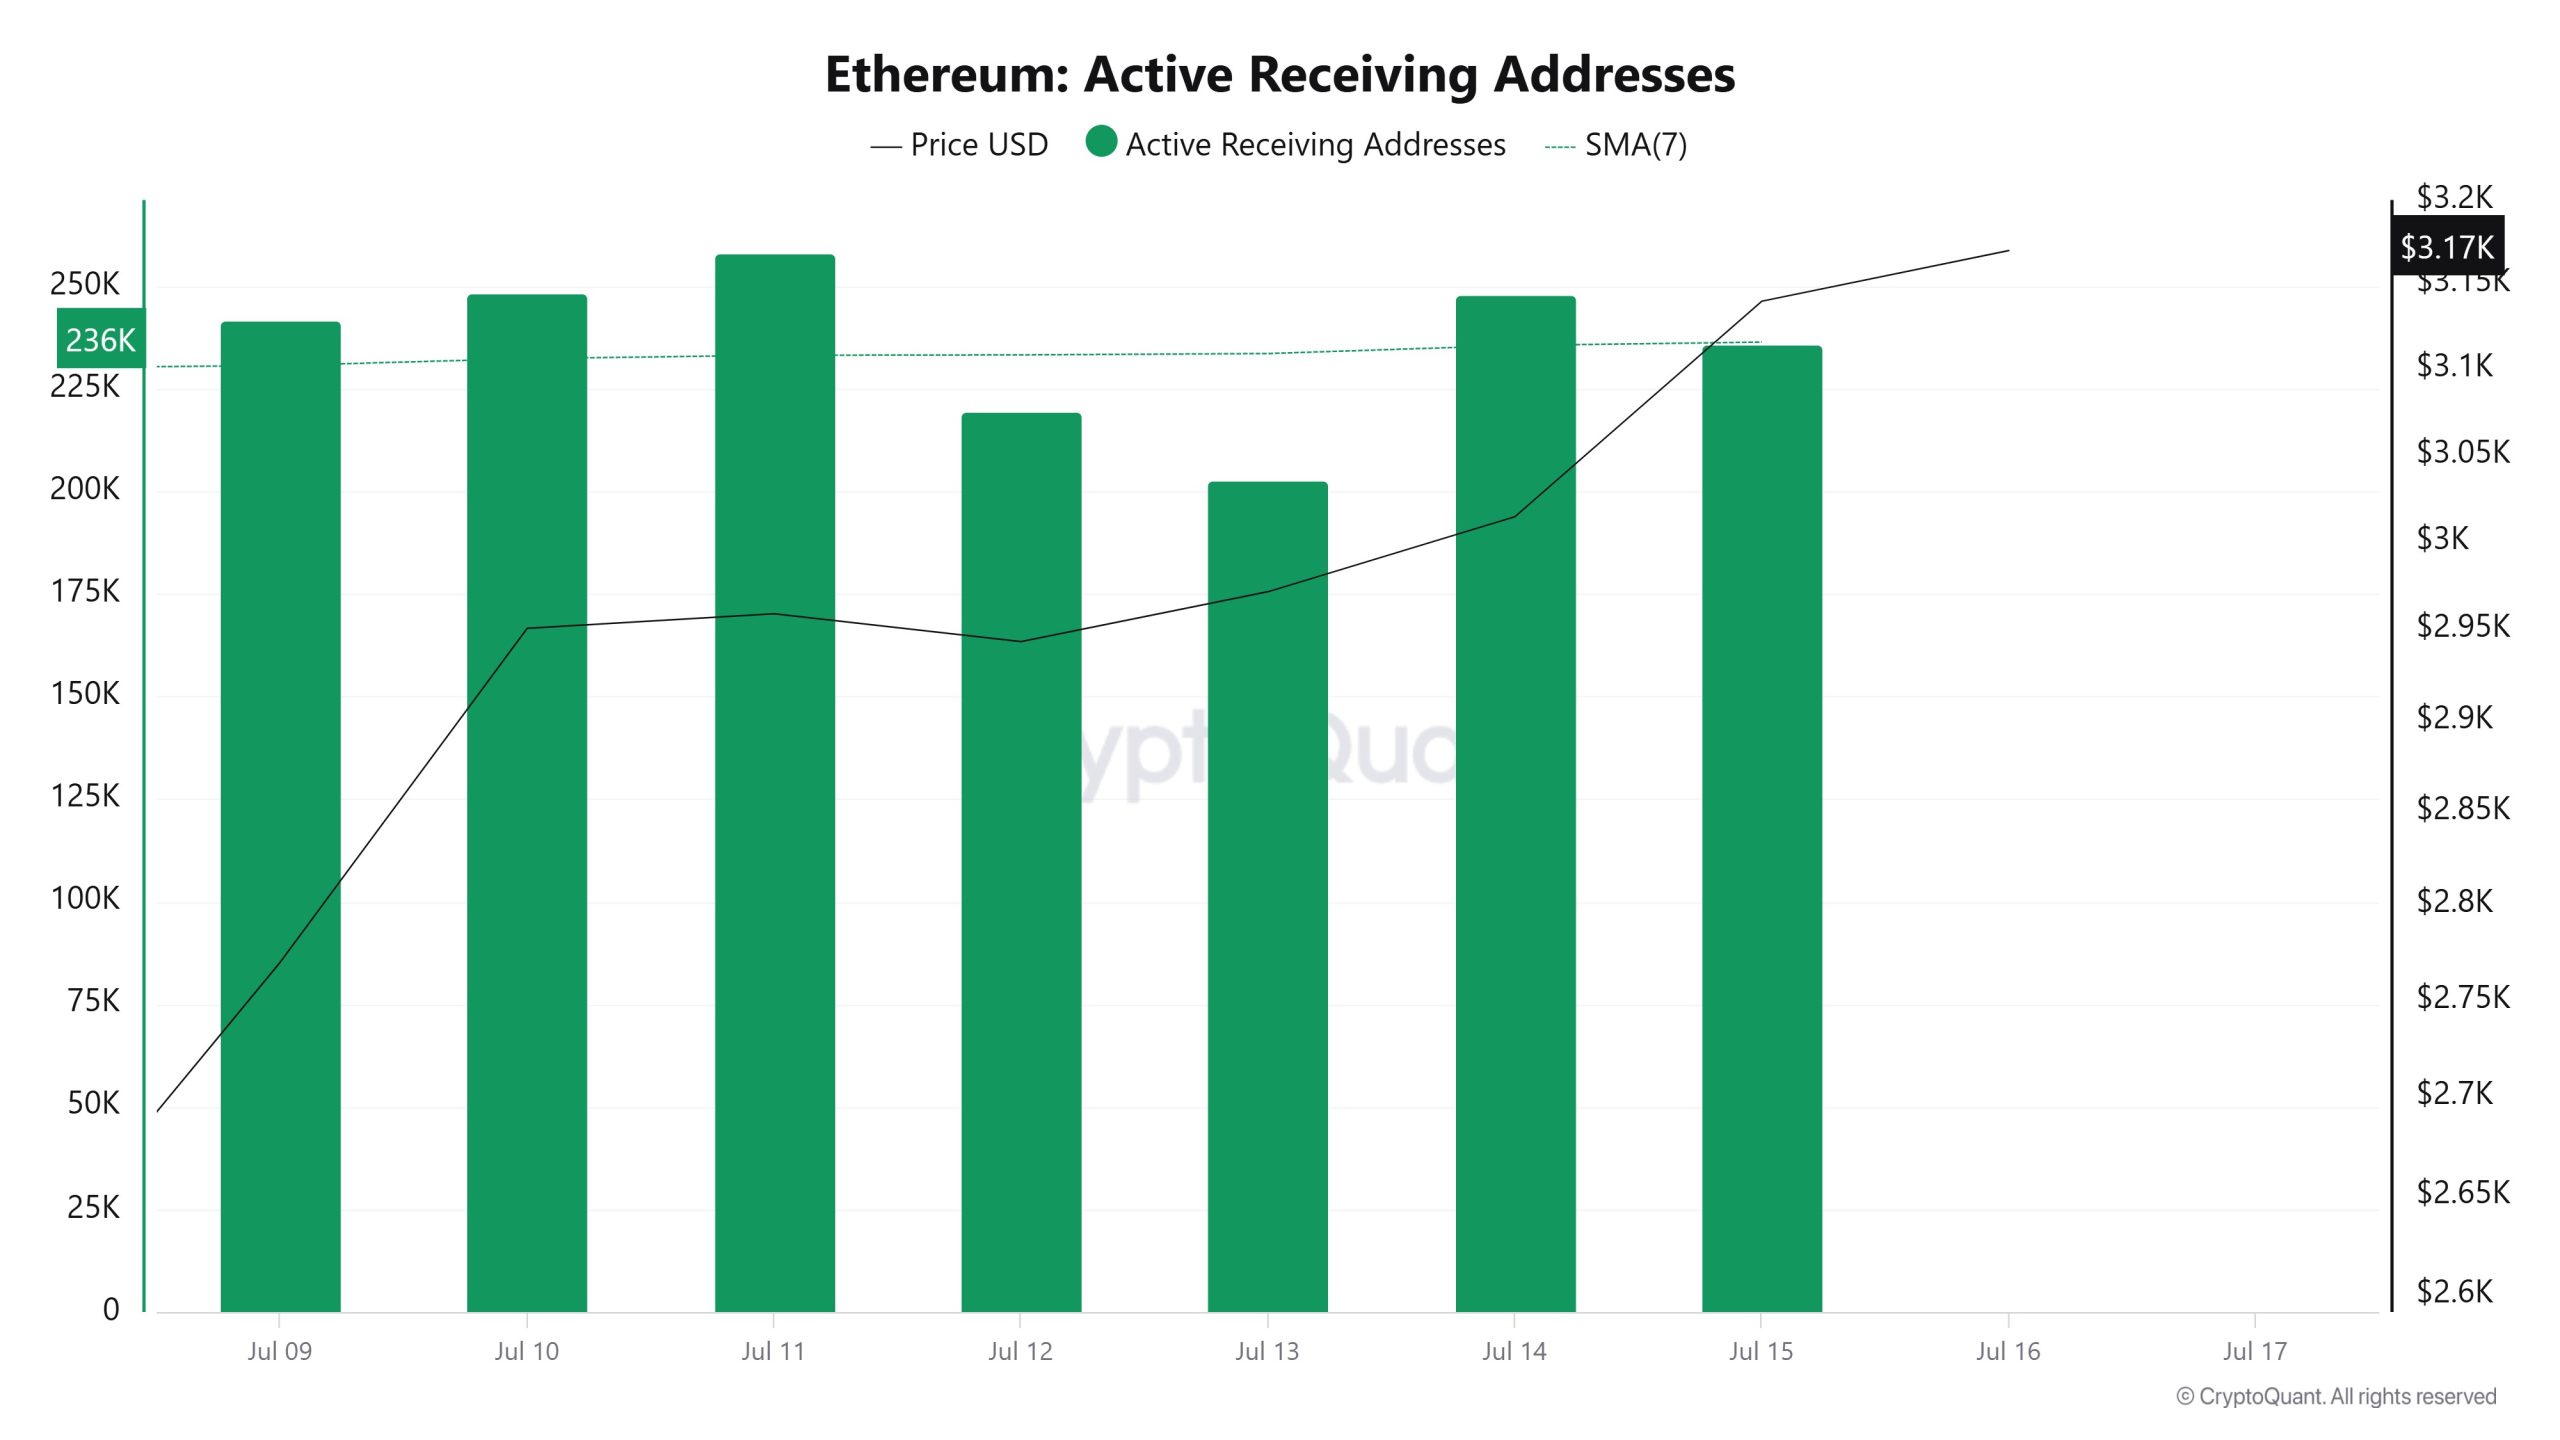
Between July 9th and July 16th, there was an increase en active buying addresses and the price consolidated en parallel. On the day the price peaked, active receiving addresses rose as high as 299,316, indicating that buying is accelerating.
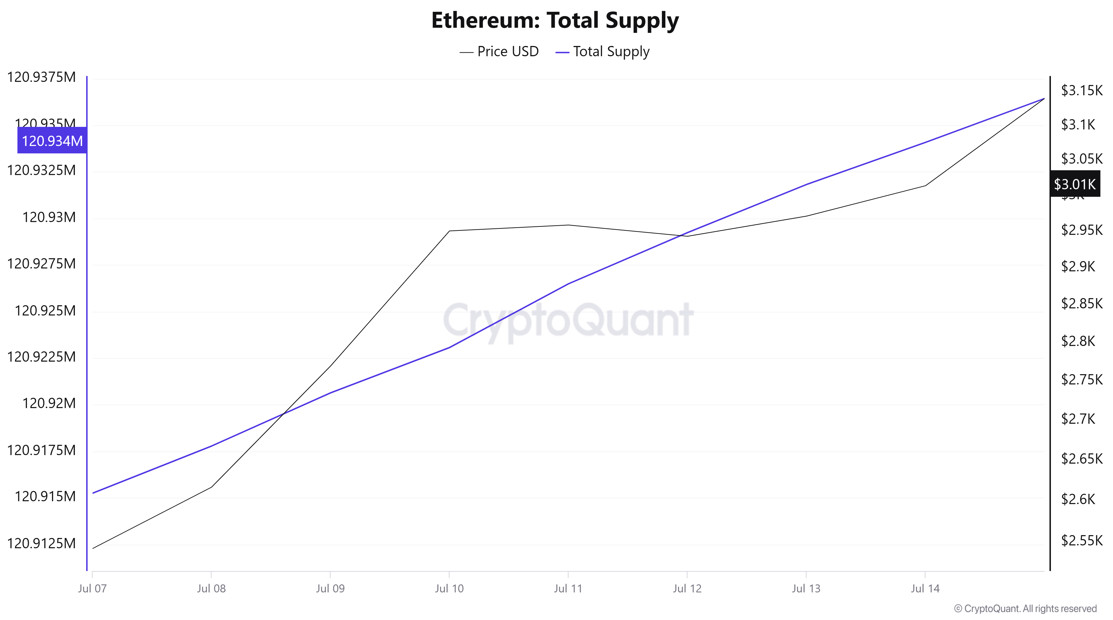
Total Value Staked
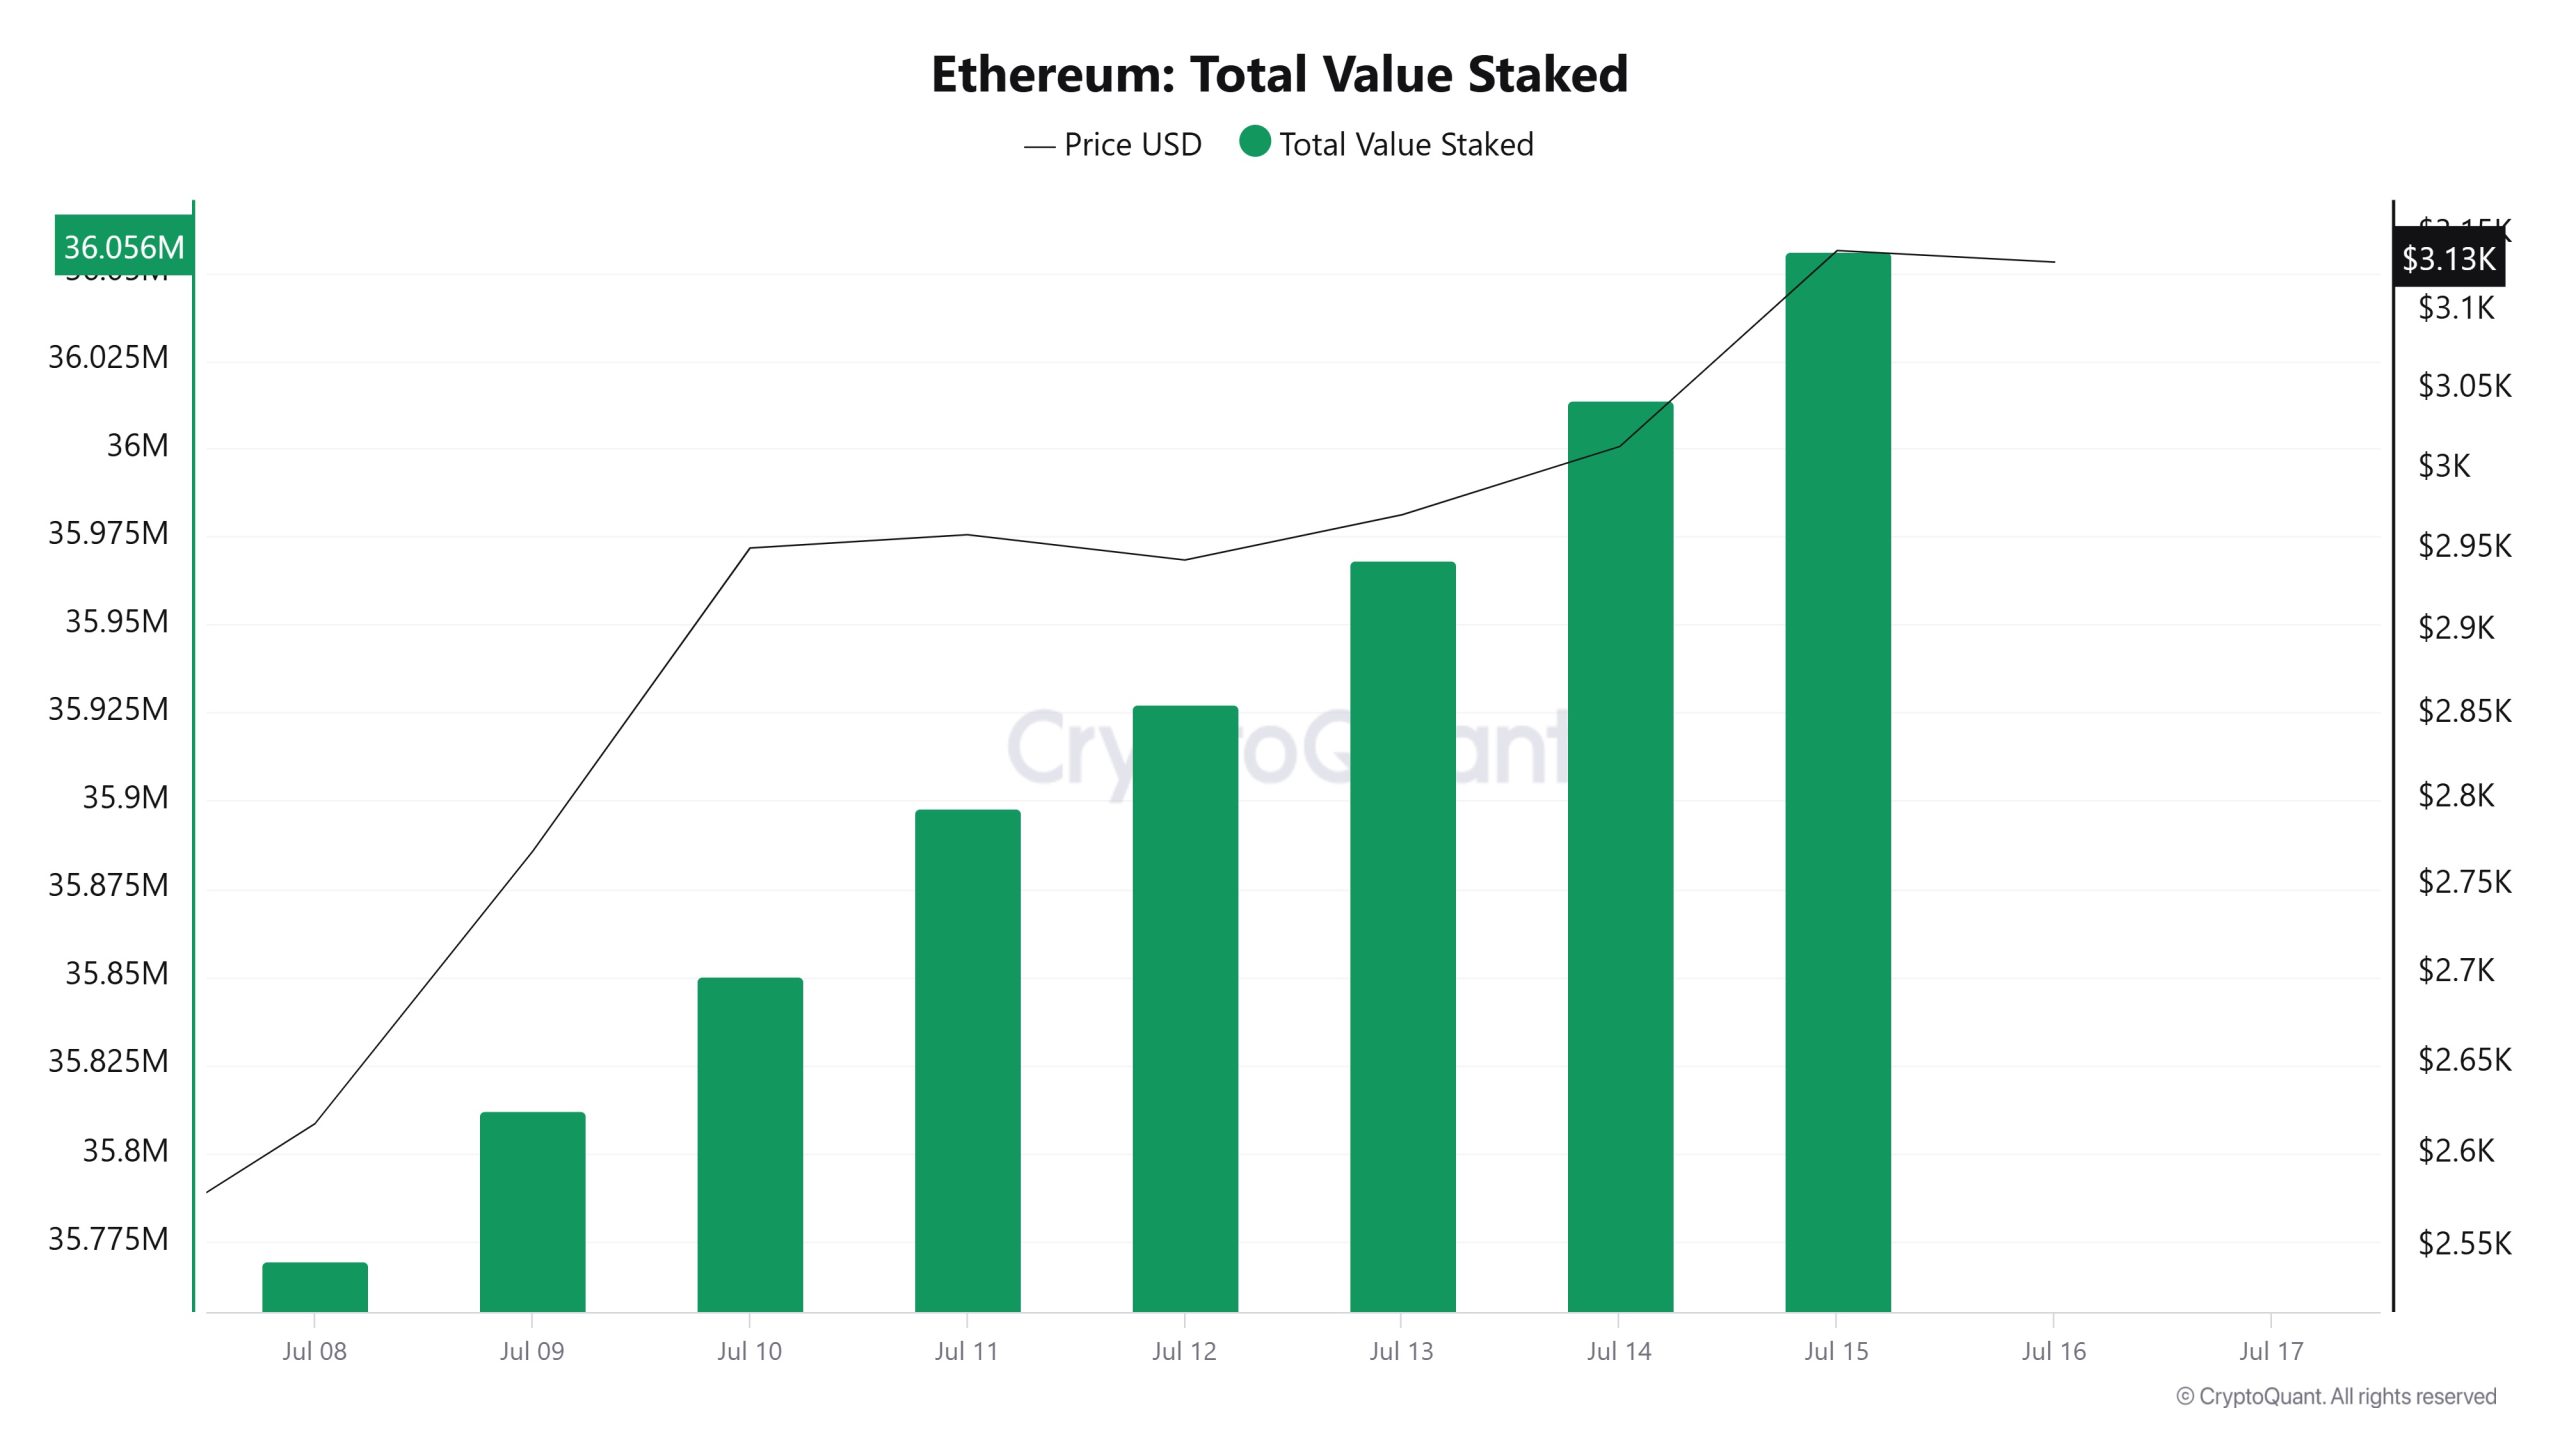
On July 9, ETH price was 2,769 while Total Value Staked was 35,812,413. As of July 15, ETH price has increased por 13.35% to 3,139, while Total Value Staked has increased por 0.68% to 36,056,391.
Staking Inflows
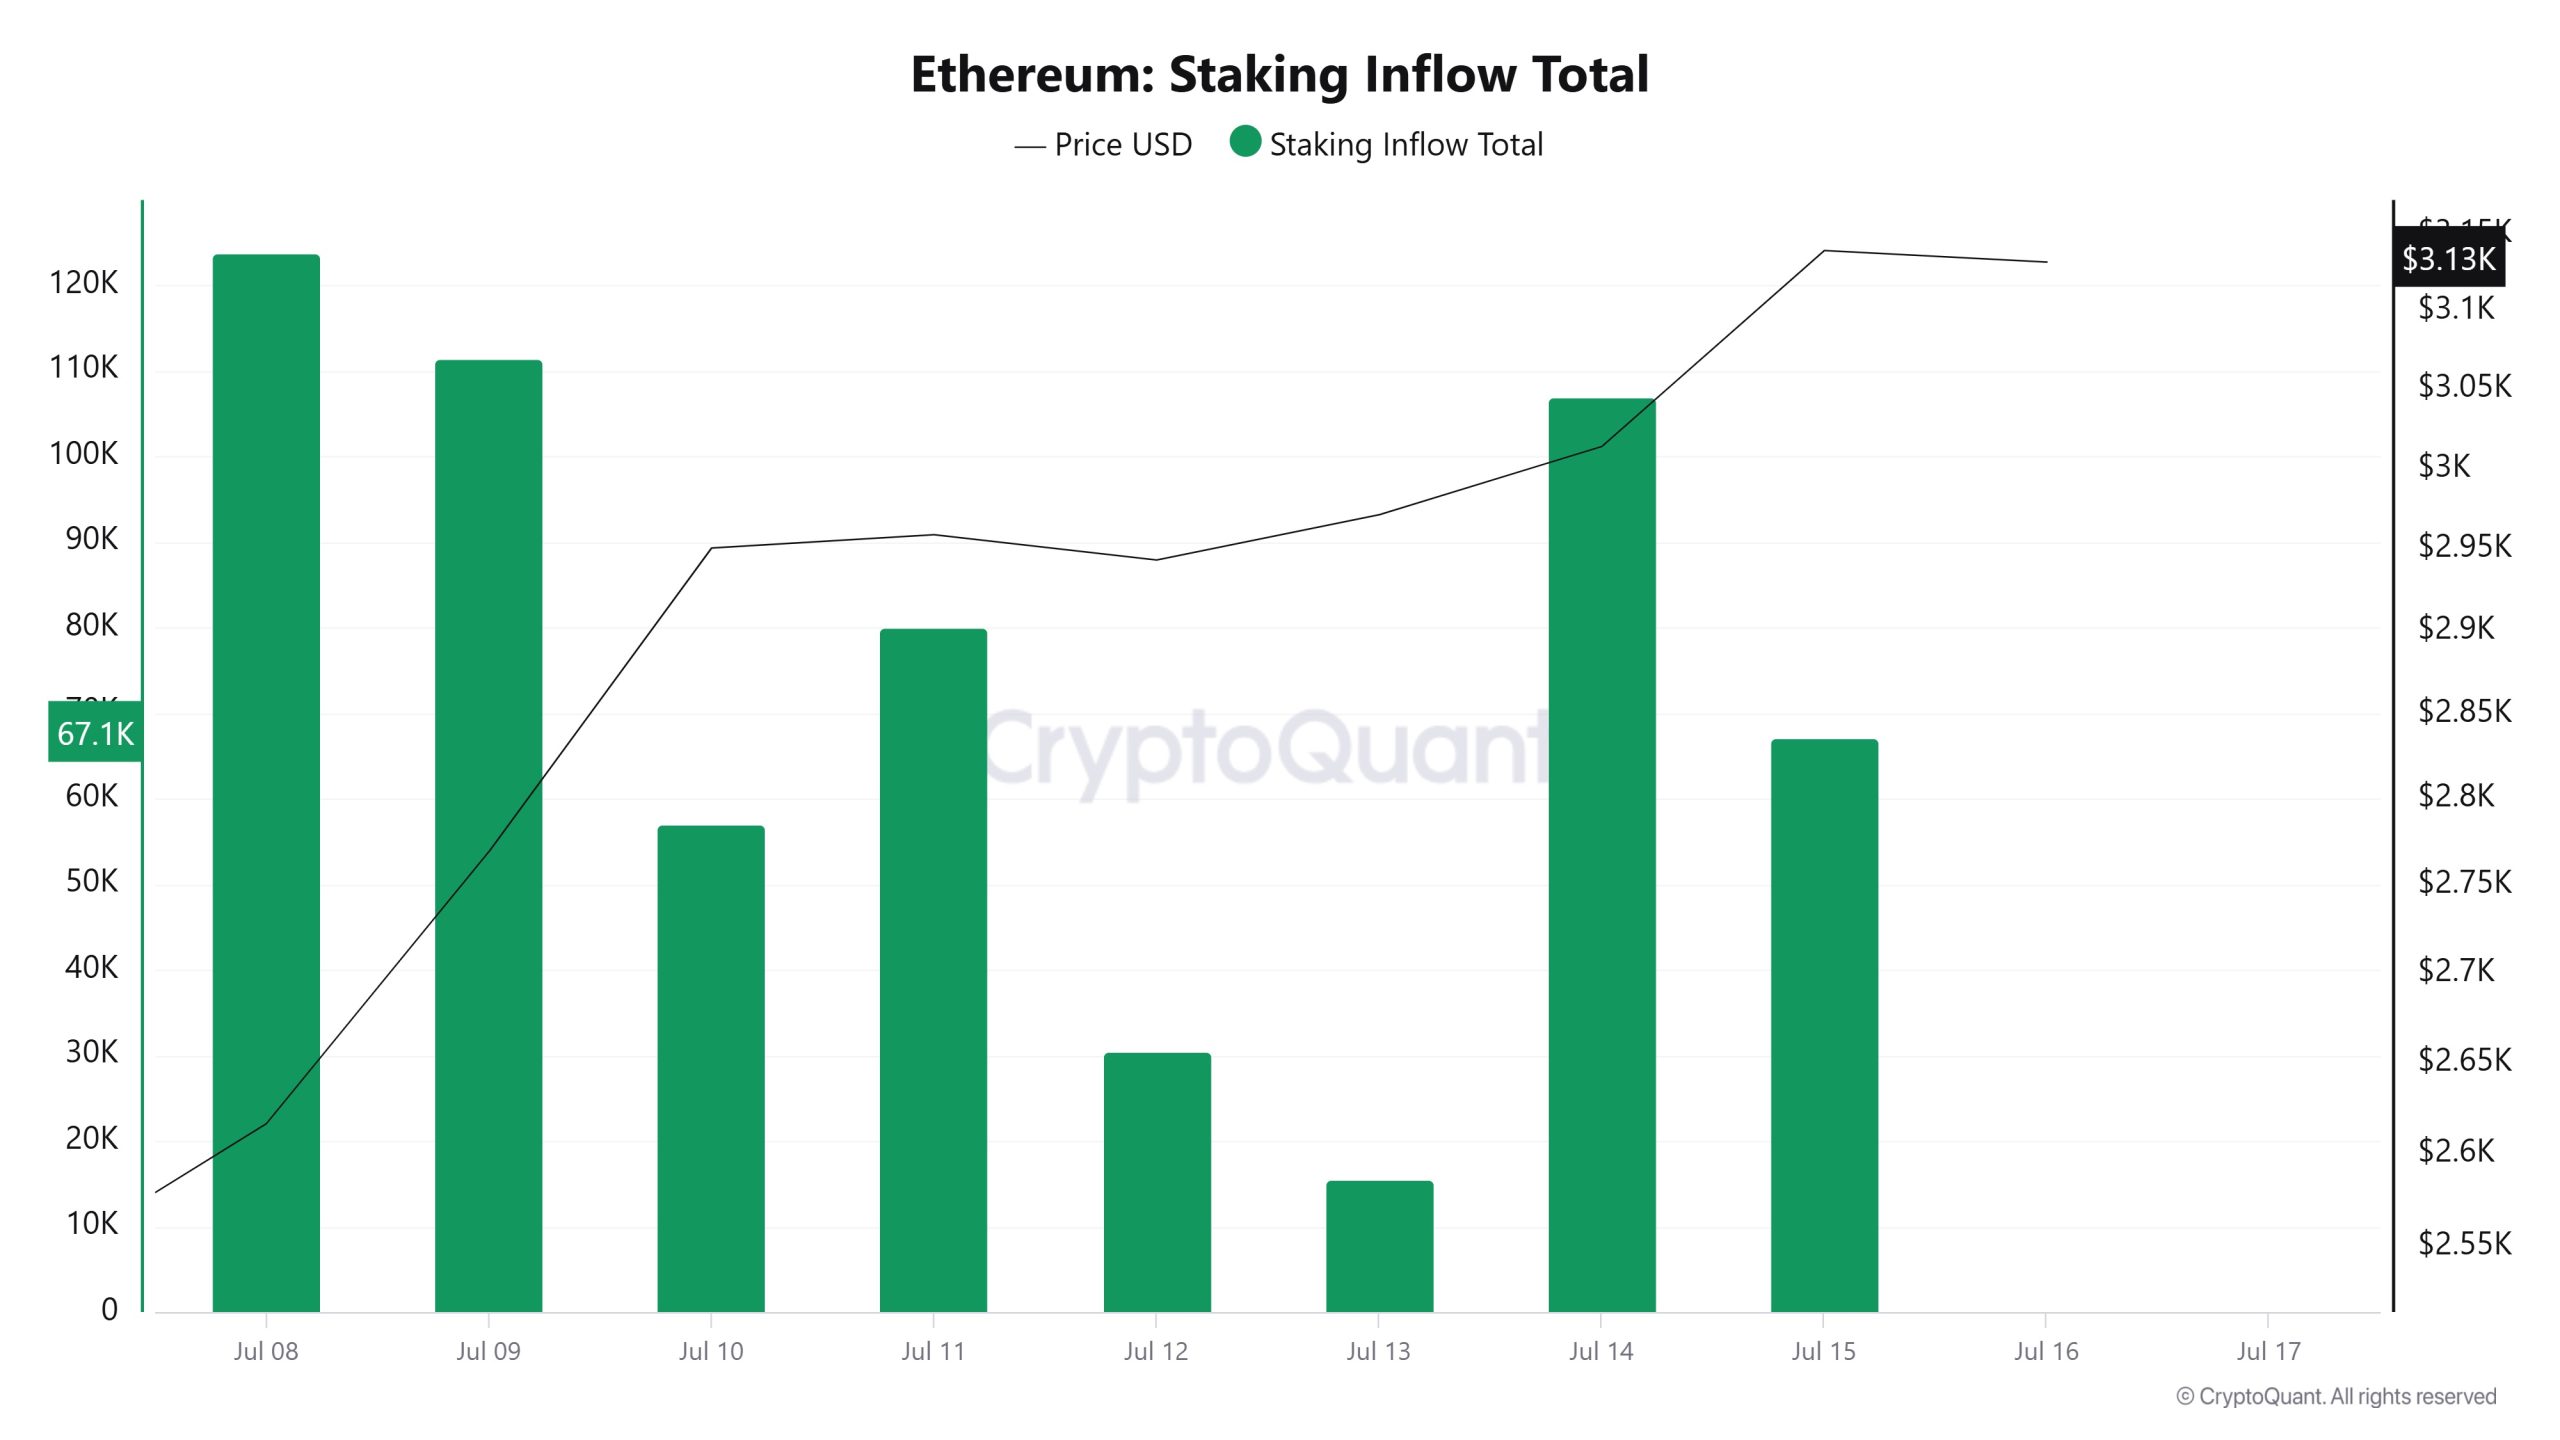
On July 9th, ETH price was at 2,769 while Staking Inflow was at 111,335. As of July 15, ETH price rose to 3,139, an increase of 13.35%, while Staking Inflow fell to 67,183, a decrease of 39.67%.
Derivatives
Open Interest
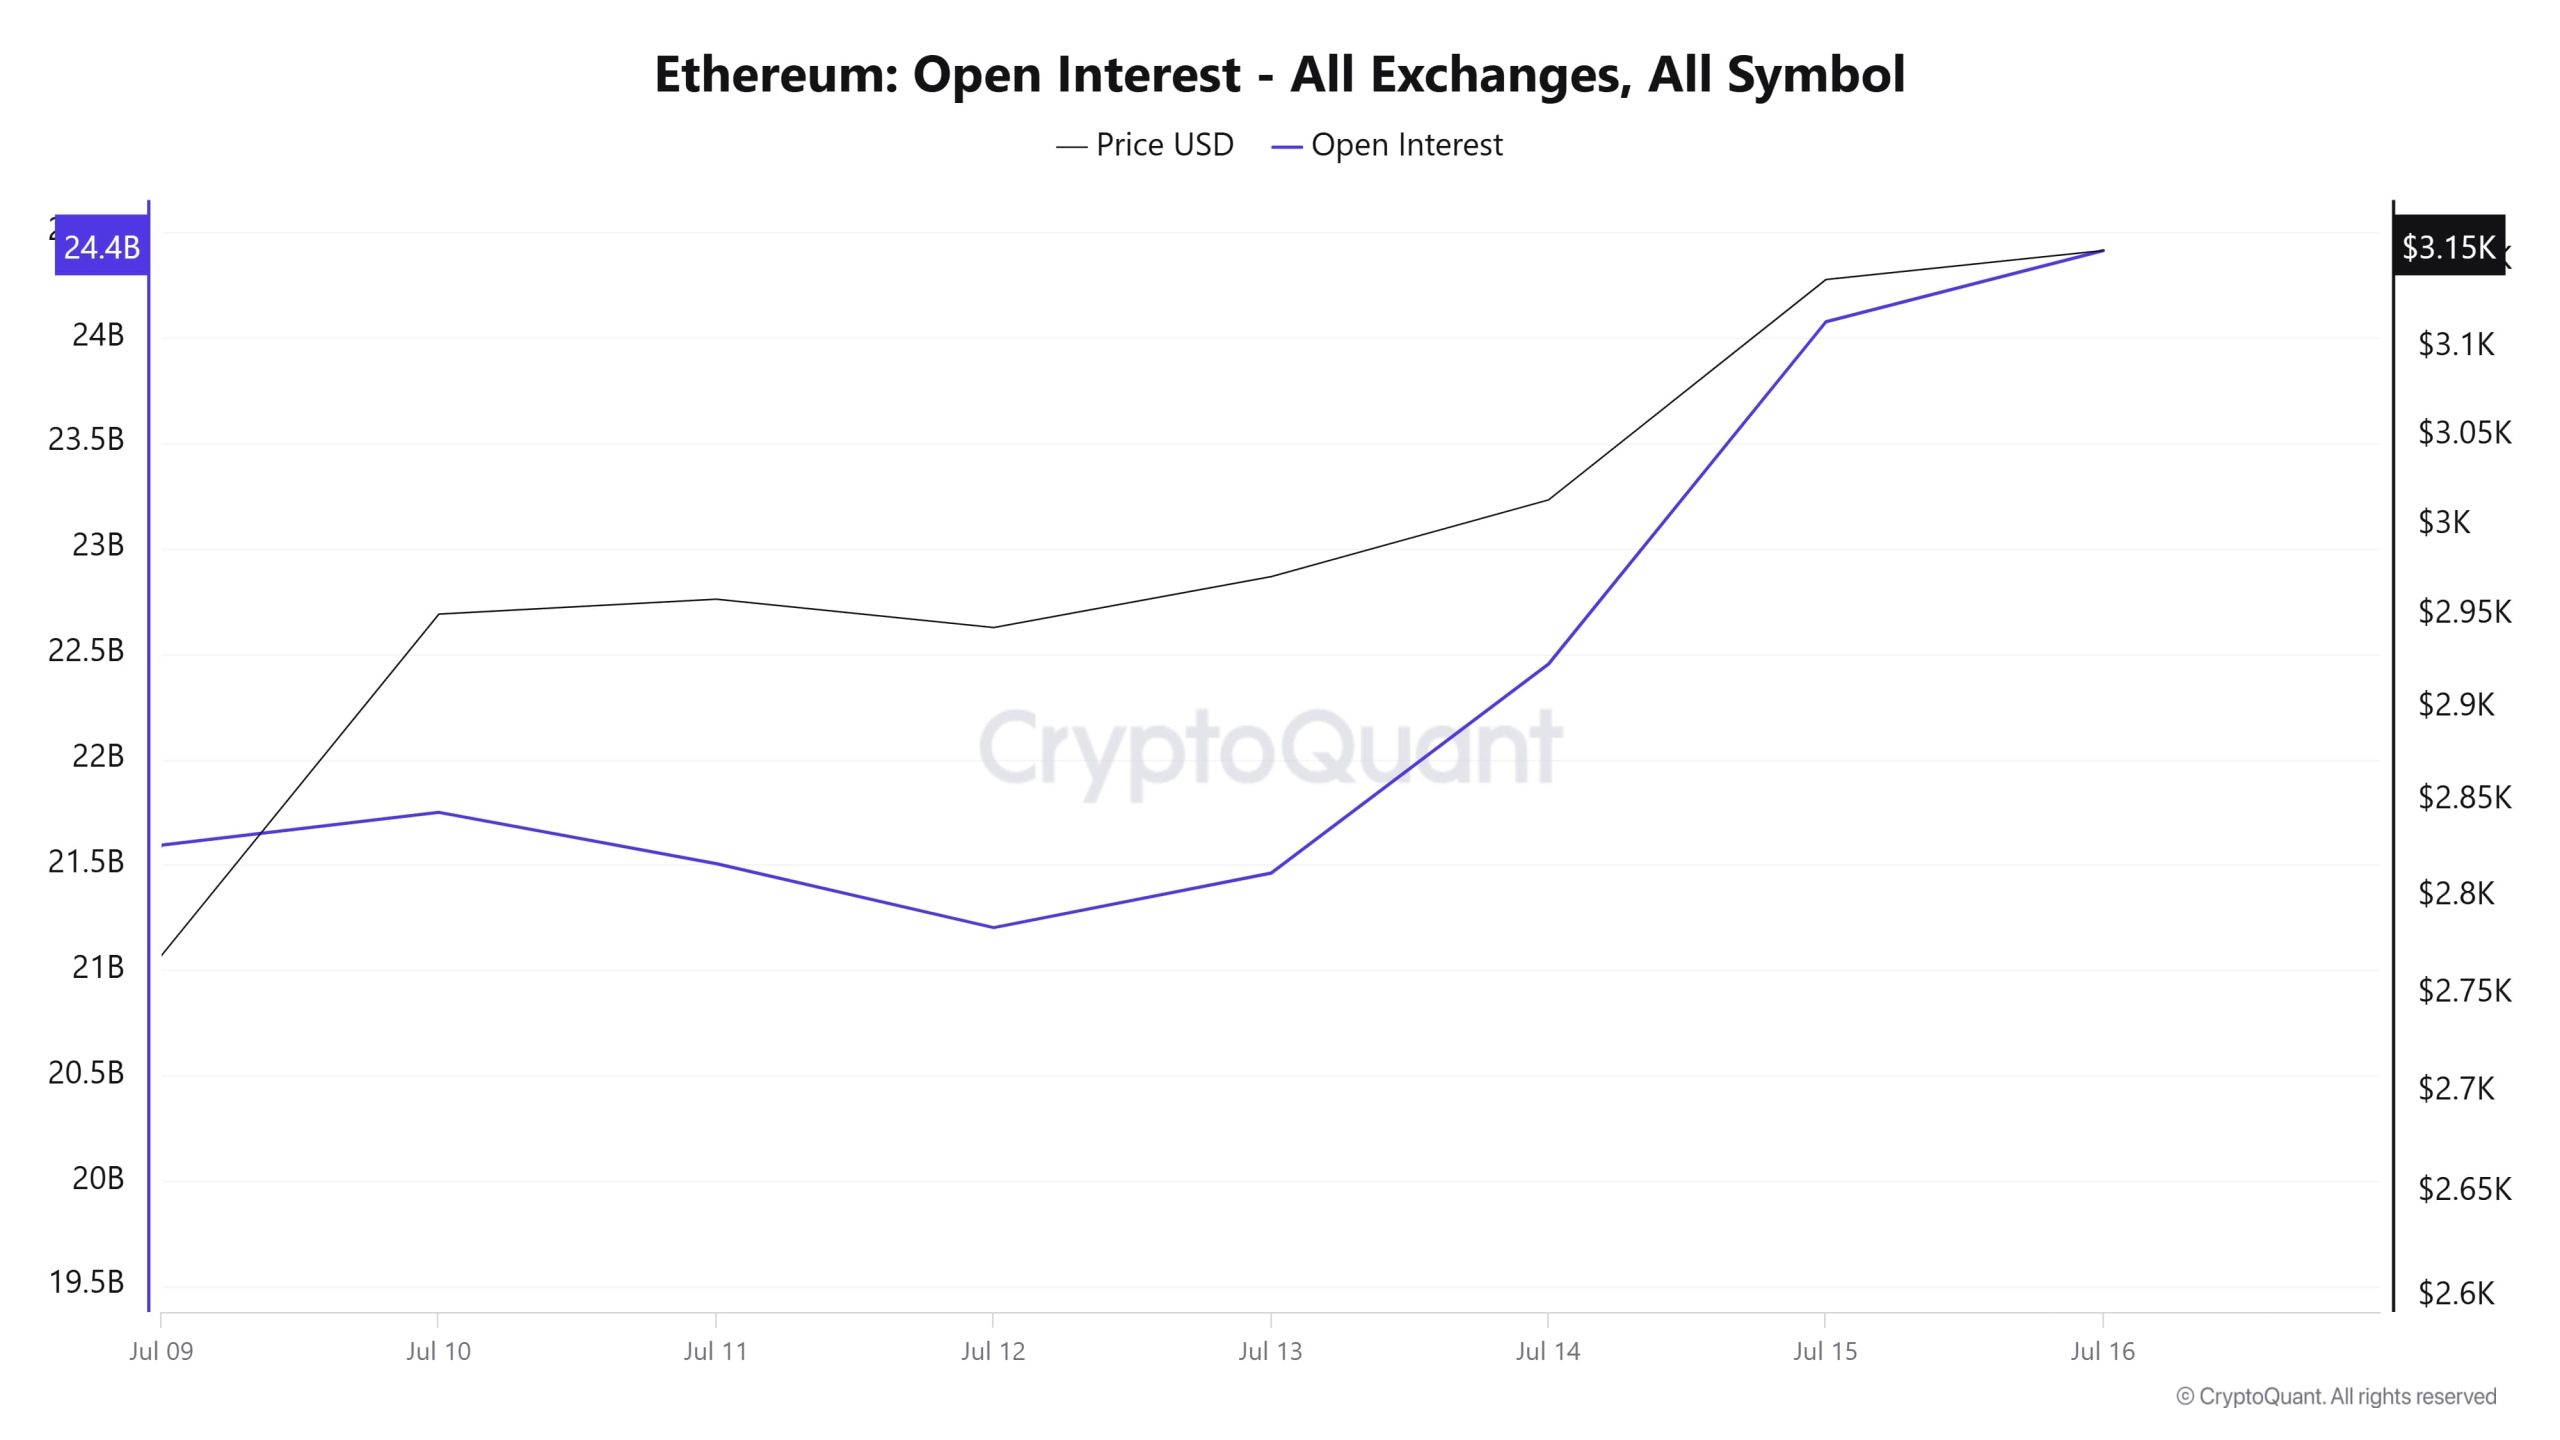
Ethereum’s open interest movement since July 9th seems to have progressed quite synchronously with the price. Open interest, which was around $ 21 billion en the first place, rose to $ 22.5 billion with the price rise. During this period, Ethereum price also accelerated from $ 2,700 to $ 2,950. However, there was a slight pullback el Open Intrest between July 11-12, suggesting that the market entered a short period of breathing or profit realization. However, this decline was short-lived and por July 13, Open Interest rebounded and showed a strong uptrend.
In the last two days, both price and open interest have headed steeply upwards. Open interest reached $24.4 billion, while the Ethereum price hit $3,150. This parallel rise indicates an increase en leveraged positions en the market and investors’ appetite for bullish expectations. Usually, this increase en Open interest along with the price reflects the market’s bullish confidence. However, it is also a reminder that leverage levels are increasing and therefore the risk of volatility is also rising. It is worth being careful en the short term as such vertical breakouts have the potential to bring corrections at the same speed.
Funding Rate
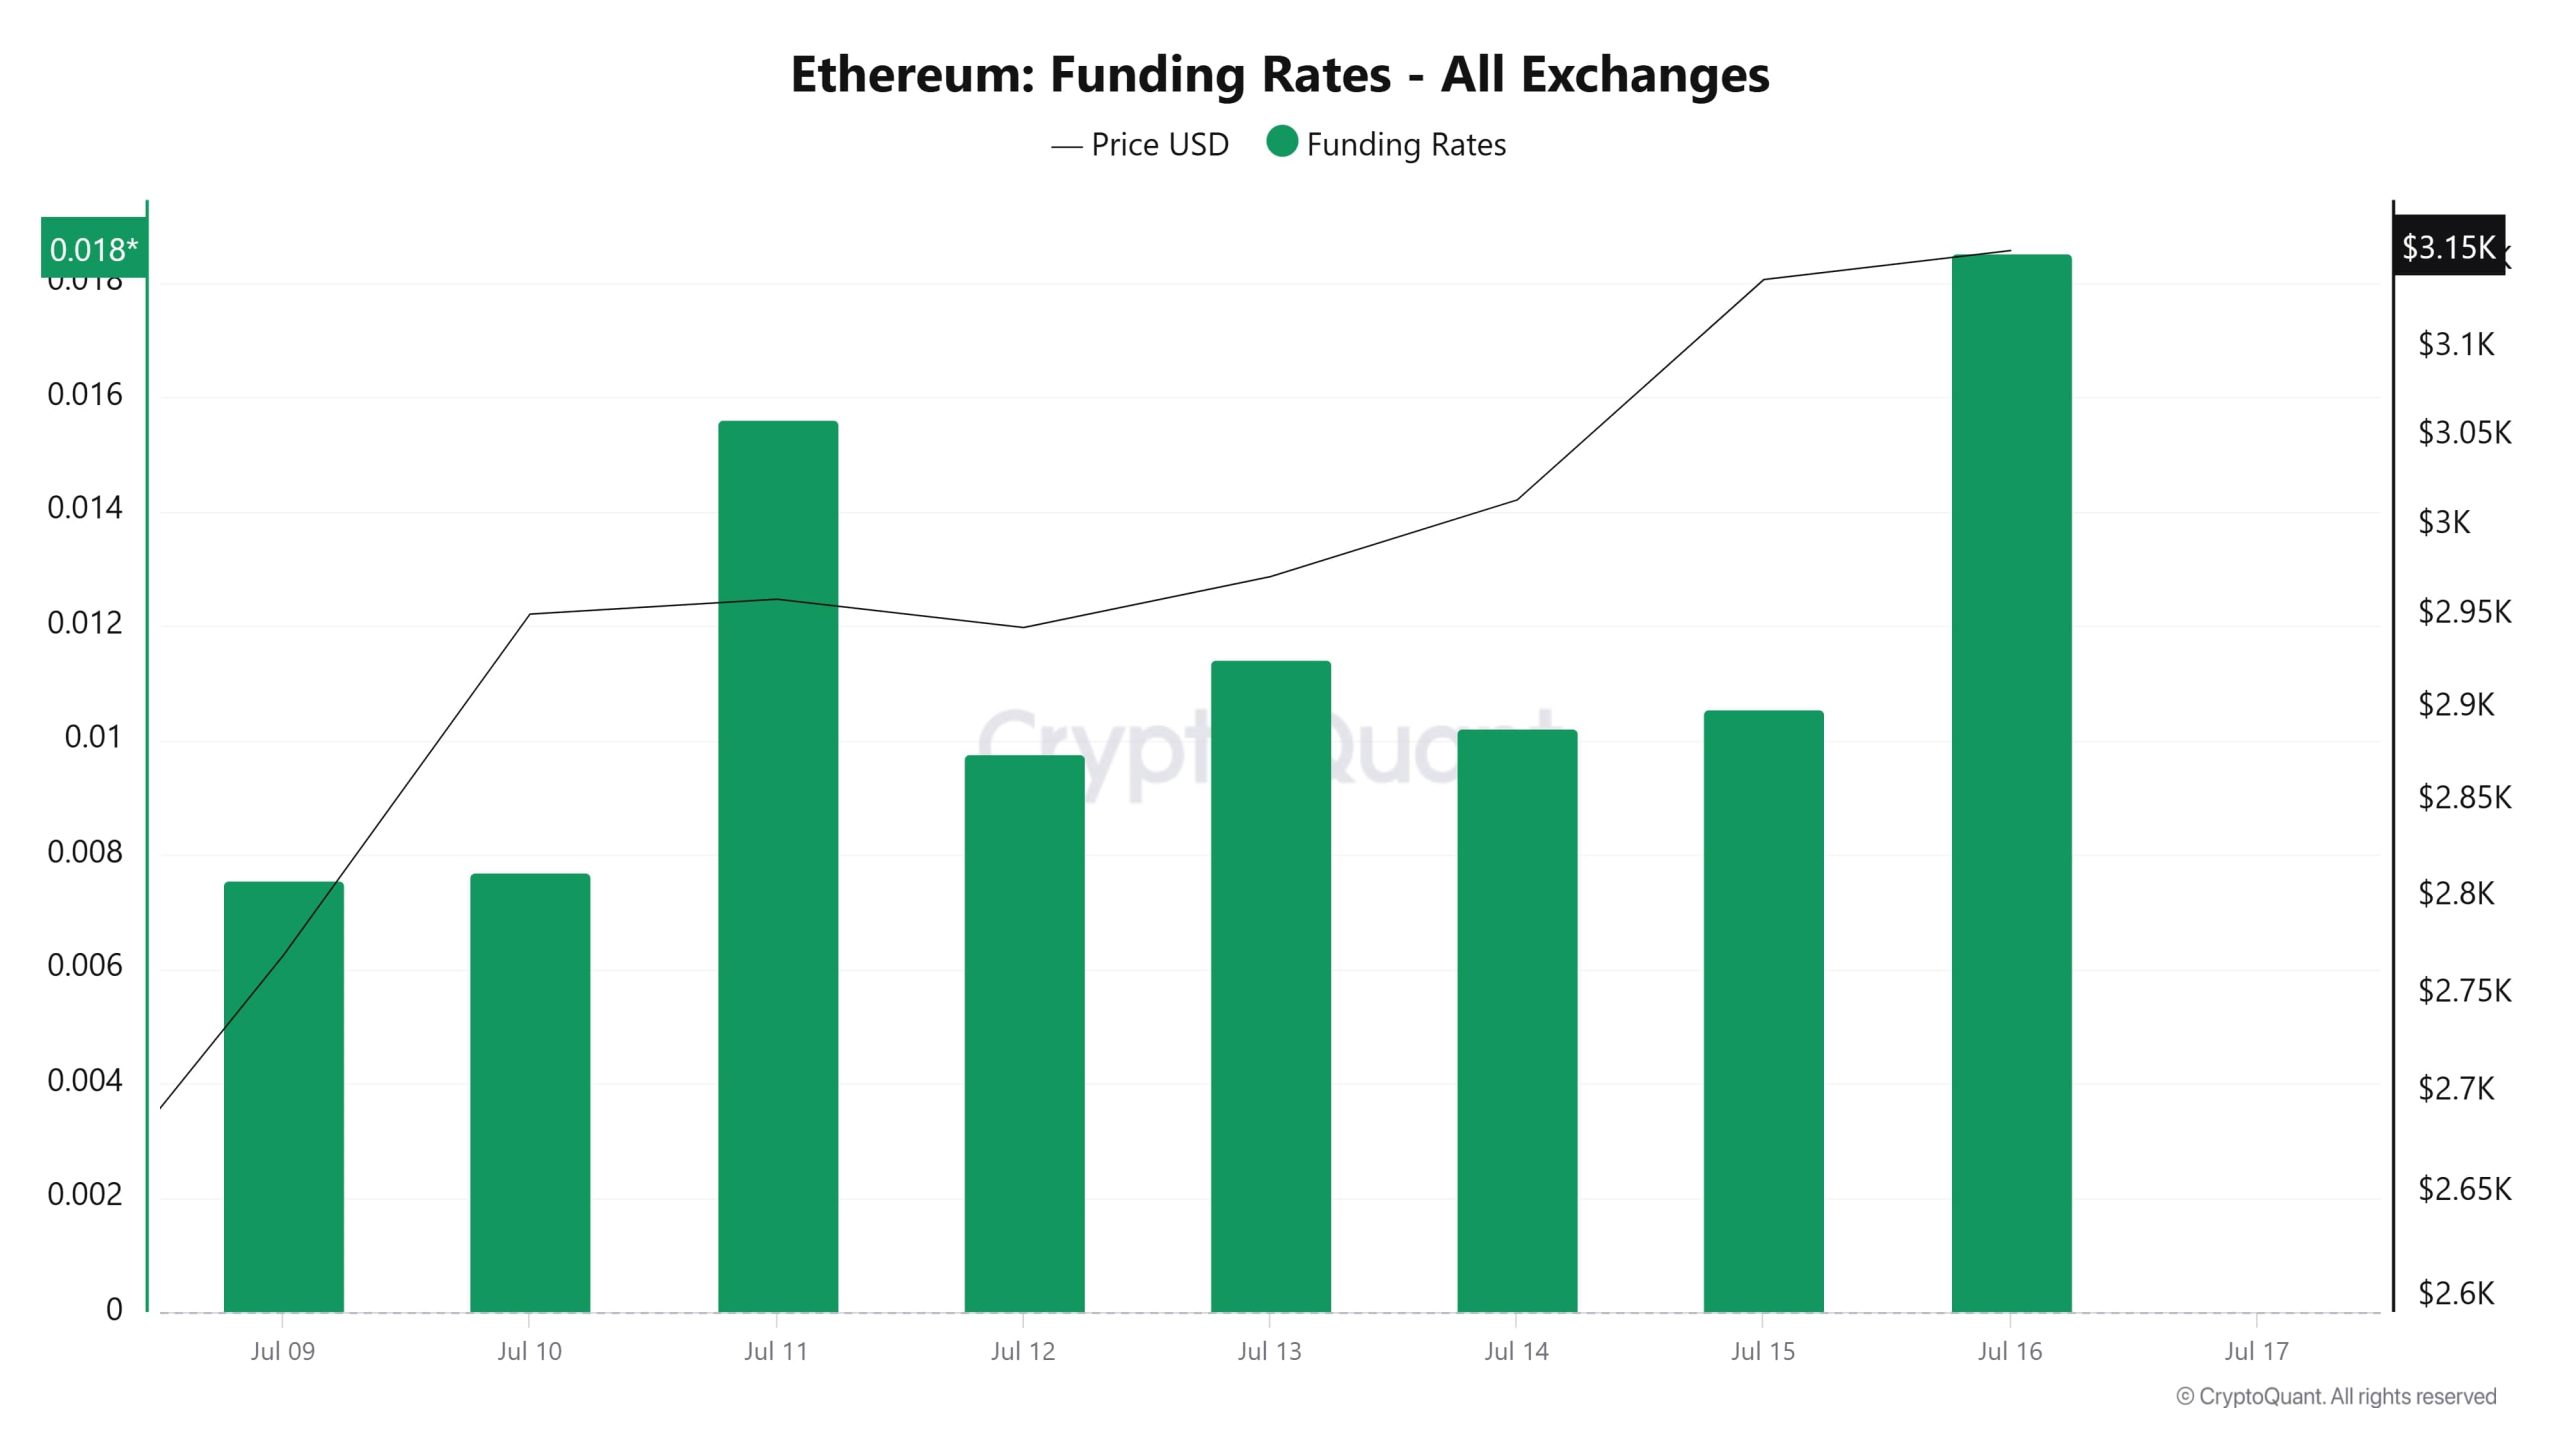
Looking at Ethereum’s funding rate data, it is seen that the recent upward trend is clearly felt not only en the price but also en the market structure. The significant increase en funding rates, especially en the last few days, shows that the demand for long positions has increased rapidly. This reveals that investors are aggressively positioning for leveraged buying en anticipation of a rise.
What is noteworthy is that this increase is en parallel with the price. In other words, not only the price is rising, but also the structural data supporting this rise is gaining strength. However, the fact that the funding rate remains en such positive territory also indicates that the market is overheating and the risk of a correction en the short term is el the table. Because if funding rates remain consistently high en favor of buyers, this could pave the way for a sell squeeze. Therefore, en order for this rise to continue en a healthy way, a phase has entered a phase where short intervals of stabilization are important.
Long & Short Liquidations
With the ETH price breaking the $3,000 mark, $446 million en long and $509 million en short transactions were liquidated this week.
| Date | Long Amount (Million $) | Short Amount (Million $) |
|---|---|---|
| July 09 | 15.80 | 131.87 |
| July 10 | 38.47 | 123.08 |
| July 11 | 84.39 | 55.33 |
| July 12 | 36.34 | 12.47 |
| July 13 | 26.59 | 27.24 |
| July 14 | 69.71 | 47.43 |
| July 15 | 174.77 | 111.63 |
| Total | 446.07 | 509.05 |
Supply Distribution
Total Supply: 120,934,075 units, up about 0.032% from last week.
New Supply: The amount of ETH produced this week was 38,900.
Velocity: Velocity was 8.58 as of July 14, up from 8.46 last week.
| Wallet Categoría | 07.07.2025 | 14.07.2025 | Change (%) |
|---|---|---|---|
| 100 – 1k ETH | 9.1249 M | 9.0086 M | -1.2745% |
| 1k – 10k ETH | 13.5084 M | 13.4681 M | -0.2983% |
| 10k – 100k ETH | 16.8689 M | 16.4581 M | -2.4353% |
| 100k+ ETH | 4.0773 M | 4.0726 M | -0.1153% |
According to the latest weekly data, a general downward trend en Ethereum wallet distribution stands out. While there was a limited decrease of 1.27% en the number of wallets en the 100 – 1k ETH range, a 0.30% decline was recorded en the 1k – 10k ETH segment. The 10k – 100k ETH range saw a more pronounced decline of 2.44%, while the 100k+ ETH category saw a slight decrease of 0.12%.
Exchange Reserve
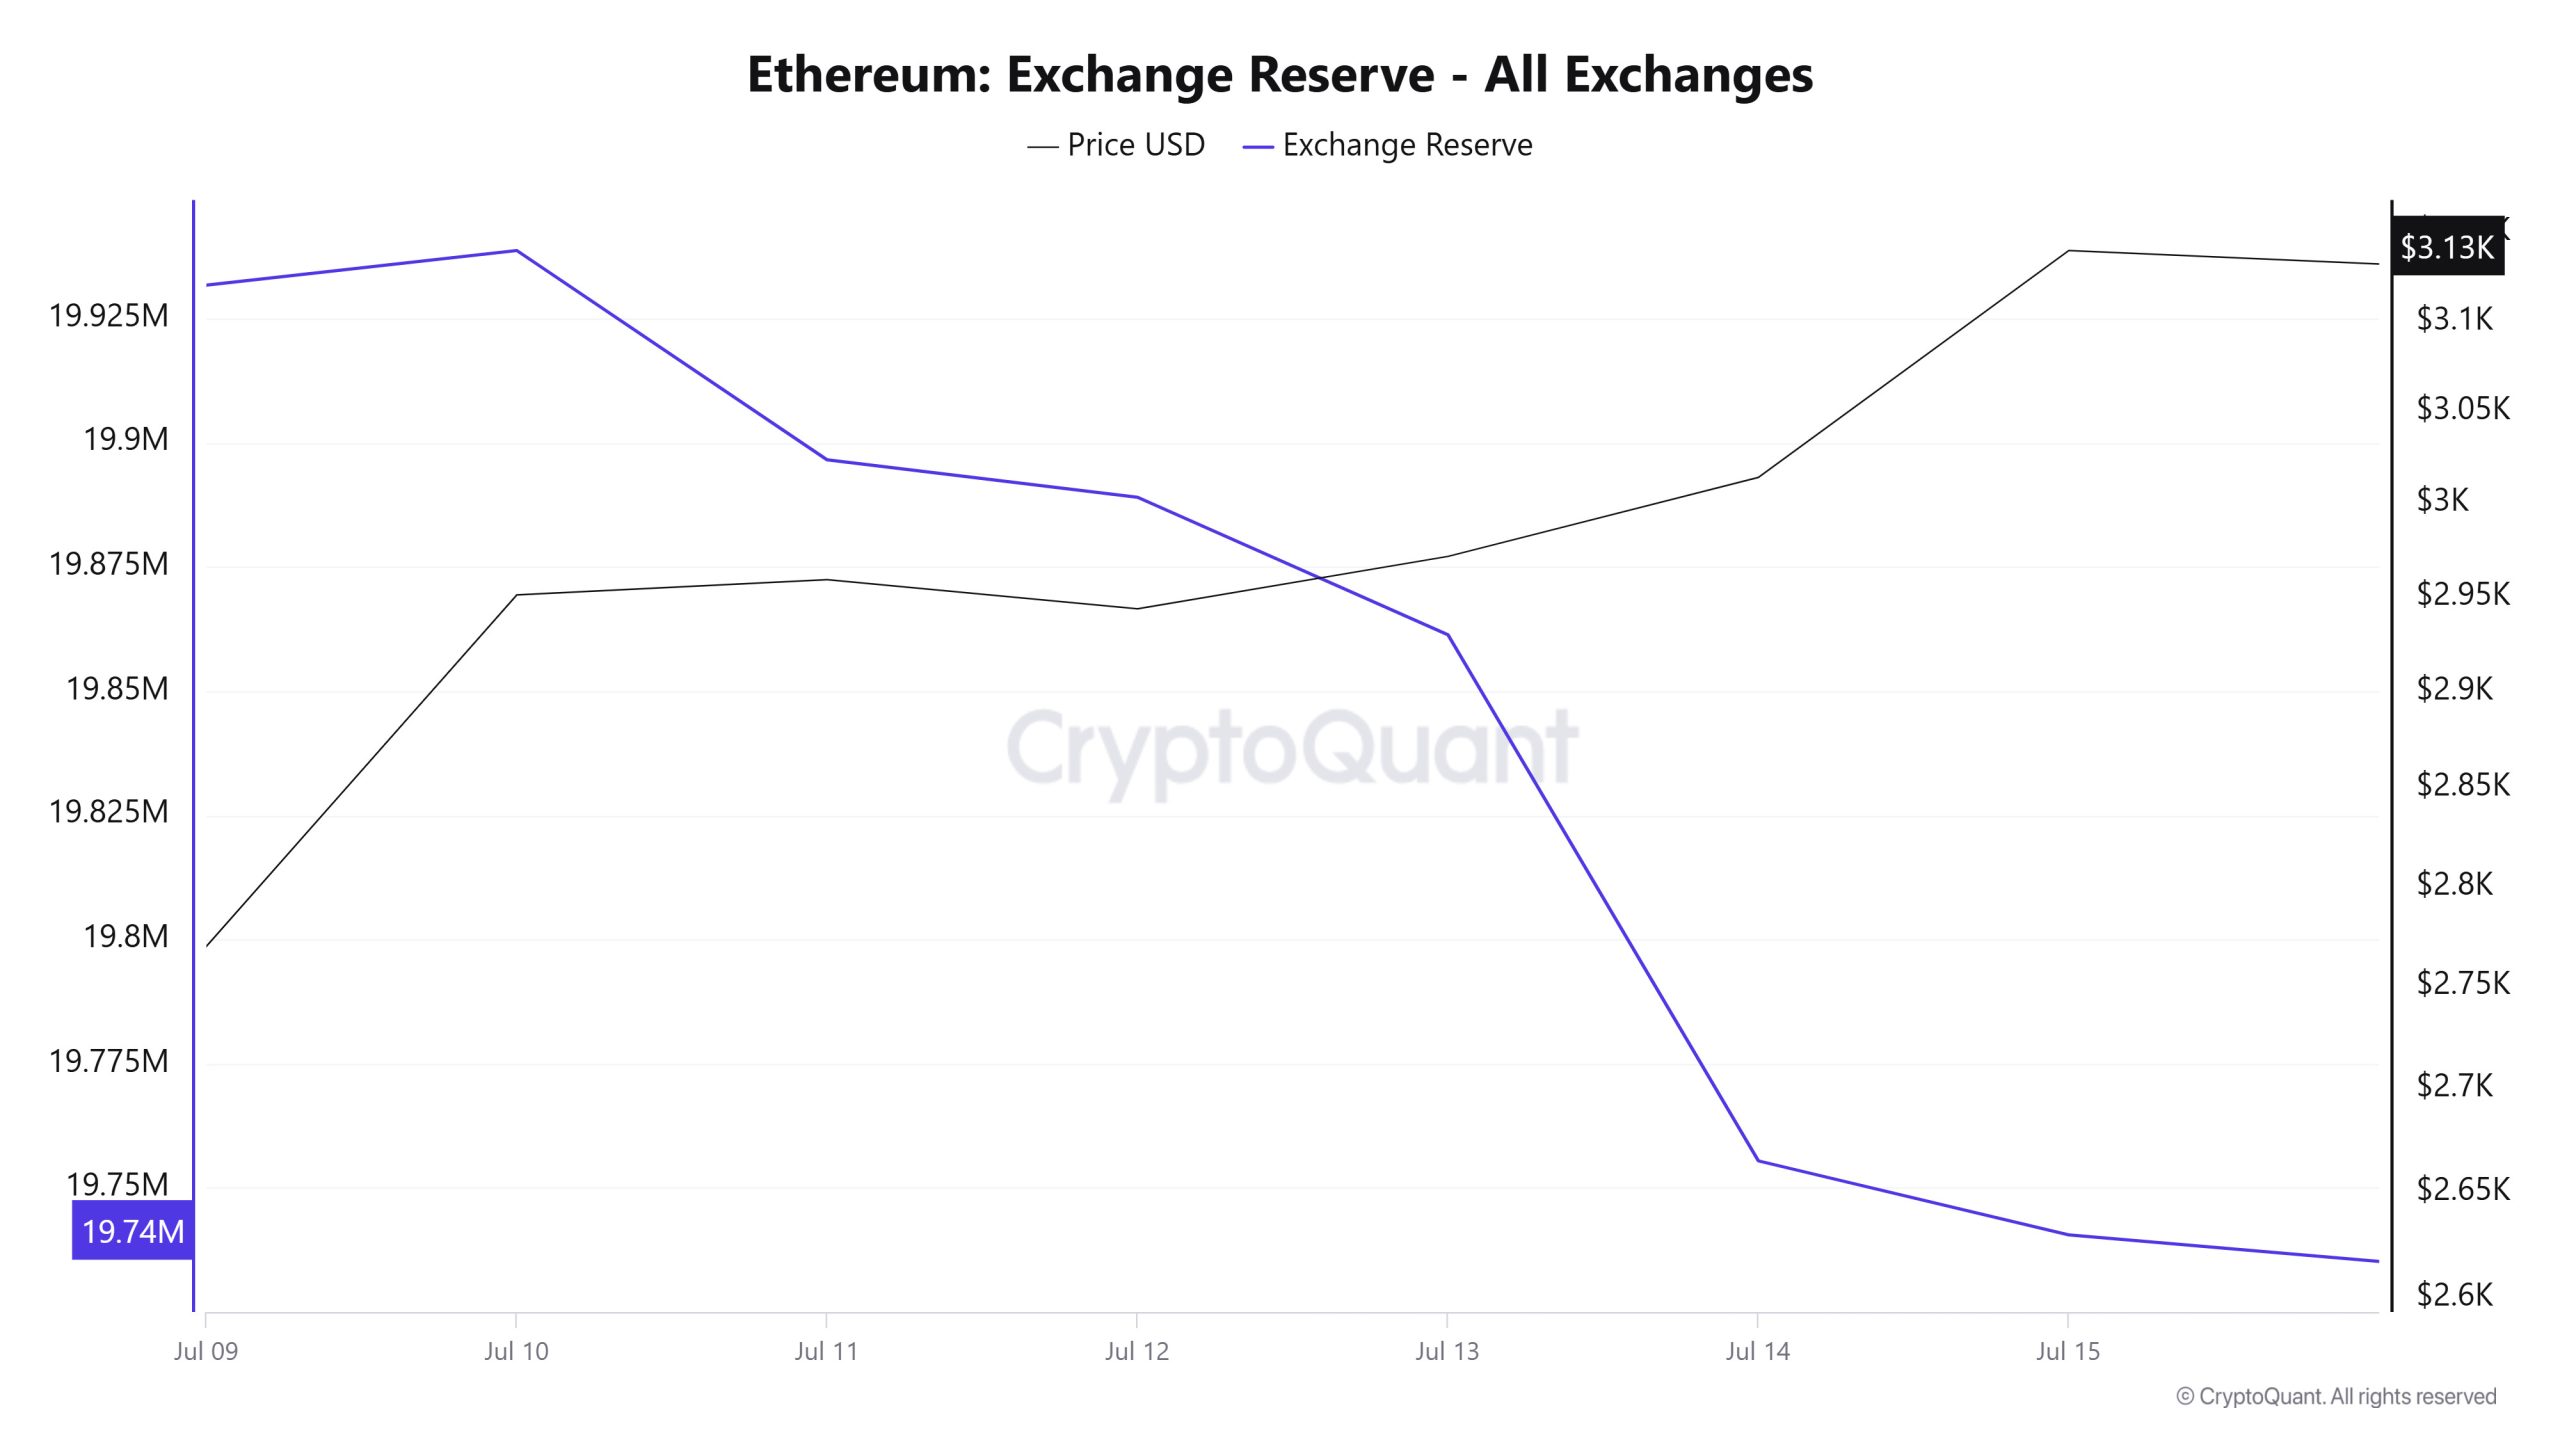
Between July 9-15, 2025, Ethereum reserves el exchanges decreased from 19,931,668 ETH to 19,740,541 ETH. During this period, there was a total net outflow of 191,127 ETH and reserves el exchanges decreased por about 0.96%. During the same period, the Ethereum price rose from $2,770 to $3,140, gaining 13.35%. The increase en outflows from the exchanges indicates that investors tend to store their assets for the long term and the selling pressure en the market has decreased. This indicates that market sentiment is strongly positive.
| Date | 9-Jul | 10-Jul | 11-Jul | 12-Jul | 13-Jul | 14-Jul | 15-Jul |
| Exchange Inflow | 1,107,451 | 1,372,705 | 1,882,961 | 451,486 | 477,293 | 1,320,885 | 1,429,351 |
| Exchange Outflow | 1,077,873 | 1,365,746 | 1,925,086 | 459,021 | 504,953 | 1,426,749 | 1,444,253 |
| Exchange Netflow | 29,578 | 6,959 | -42,126 | -7,535 | -27,660 | -105,863 | -14,902 |
| Exchange Reserve | 19,931,668 | 19,938,627 | 19,896,501 | 19,888,966 | 19,861,307 | 19,755,443 | 19,740,541 |
| ETH Price | 2,770 | 2,951 | 2,959 | 2,943 | 2,971 | 3,014 | 3,140 |
Fees and Revenues
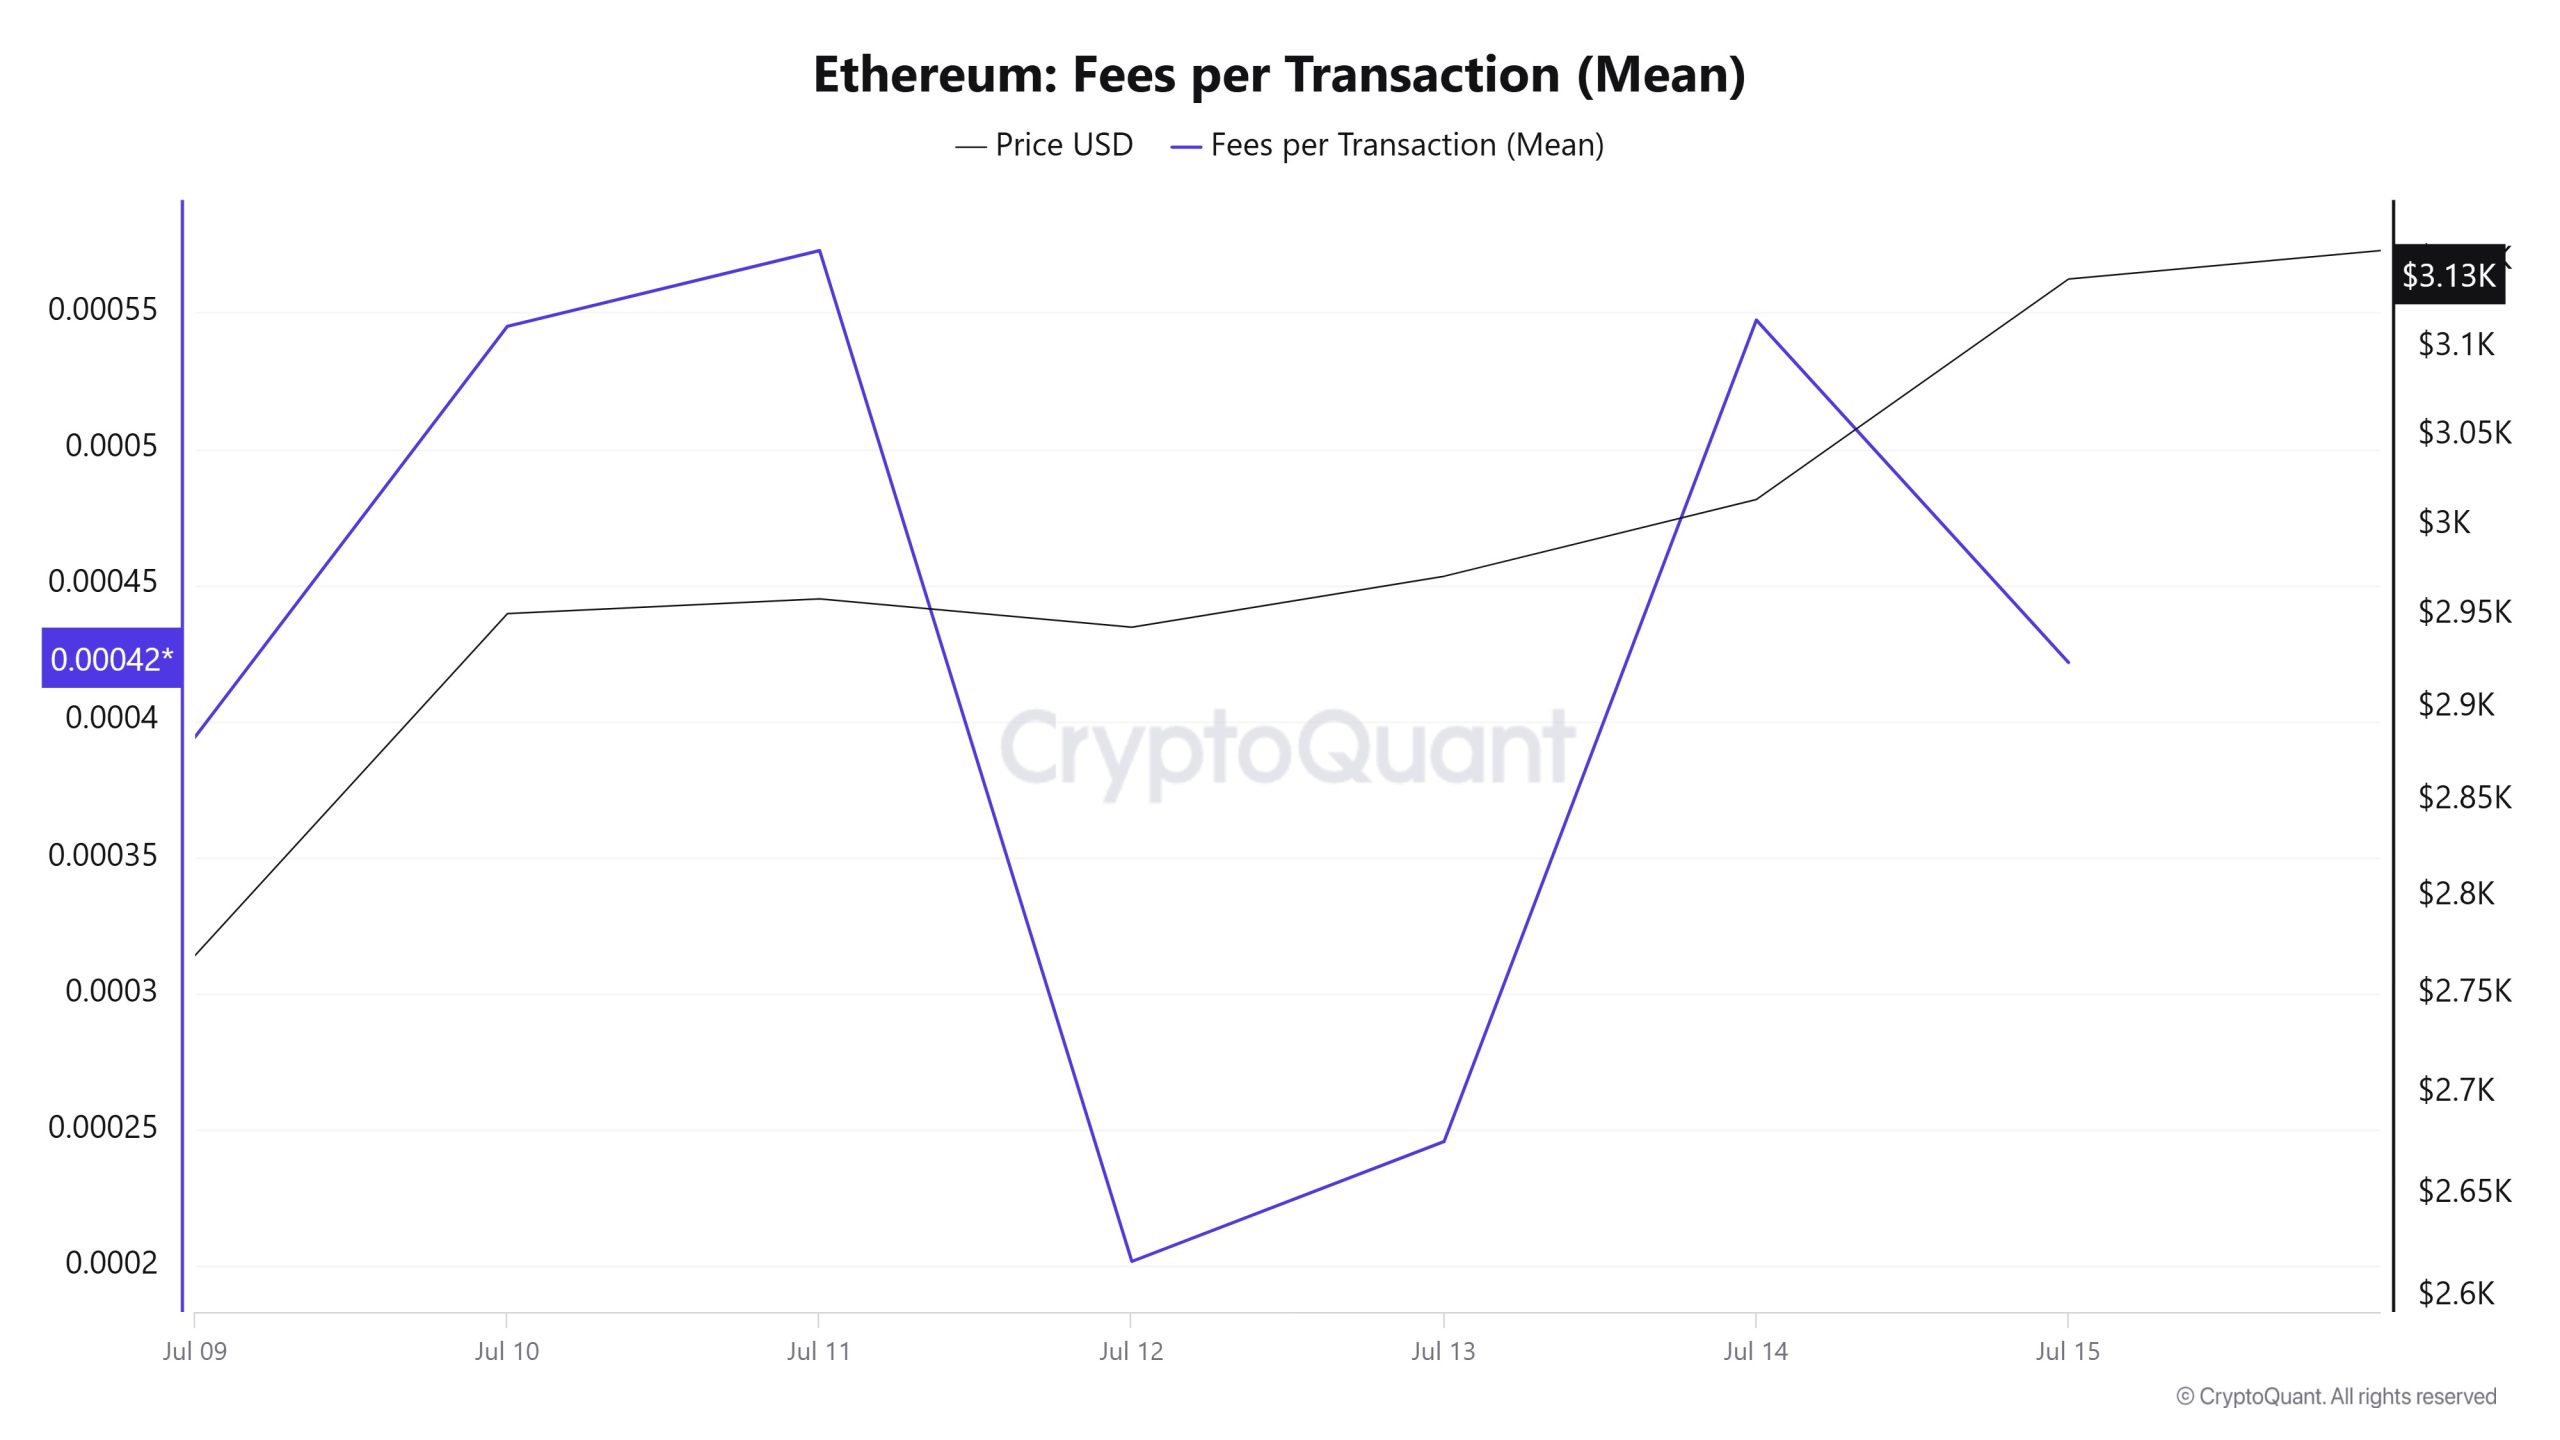
When the Ethereum Fees per Transaction (Mean) data between July 9 and July 15 are analyzed, it is seen that this indicator was realized at 0.000394282864868369 el July 9, the first day of the week.
As of this date, a fluctuating course was observed with the effect of the volatile movements en the Ethereum price; As of July 11, it reached 0.000572846364156753, reaching the highest level of the week.
In the following days, Ethereum Fees per Transaction (Mean) declined again and closed at 0.000421554206869395 el July 15, the last day of the week.
Bitcoin: Fees (Total)
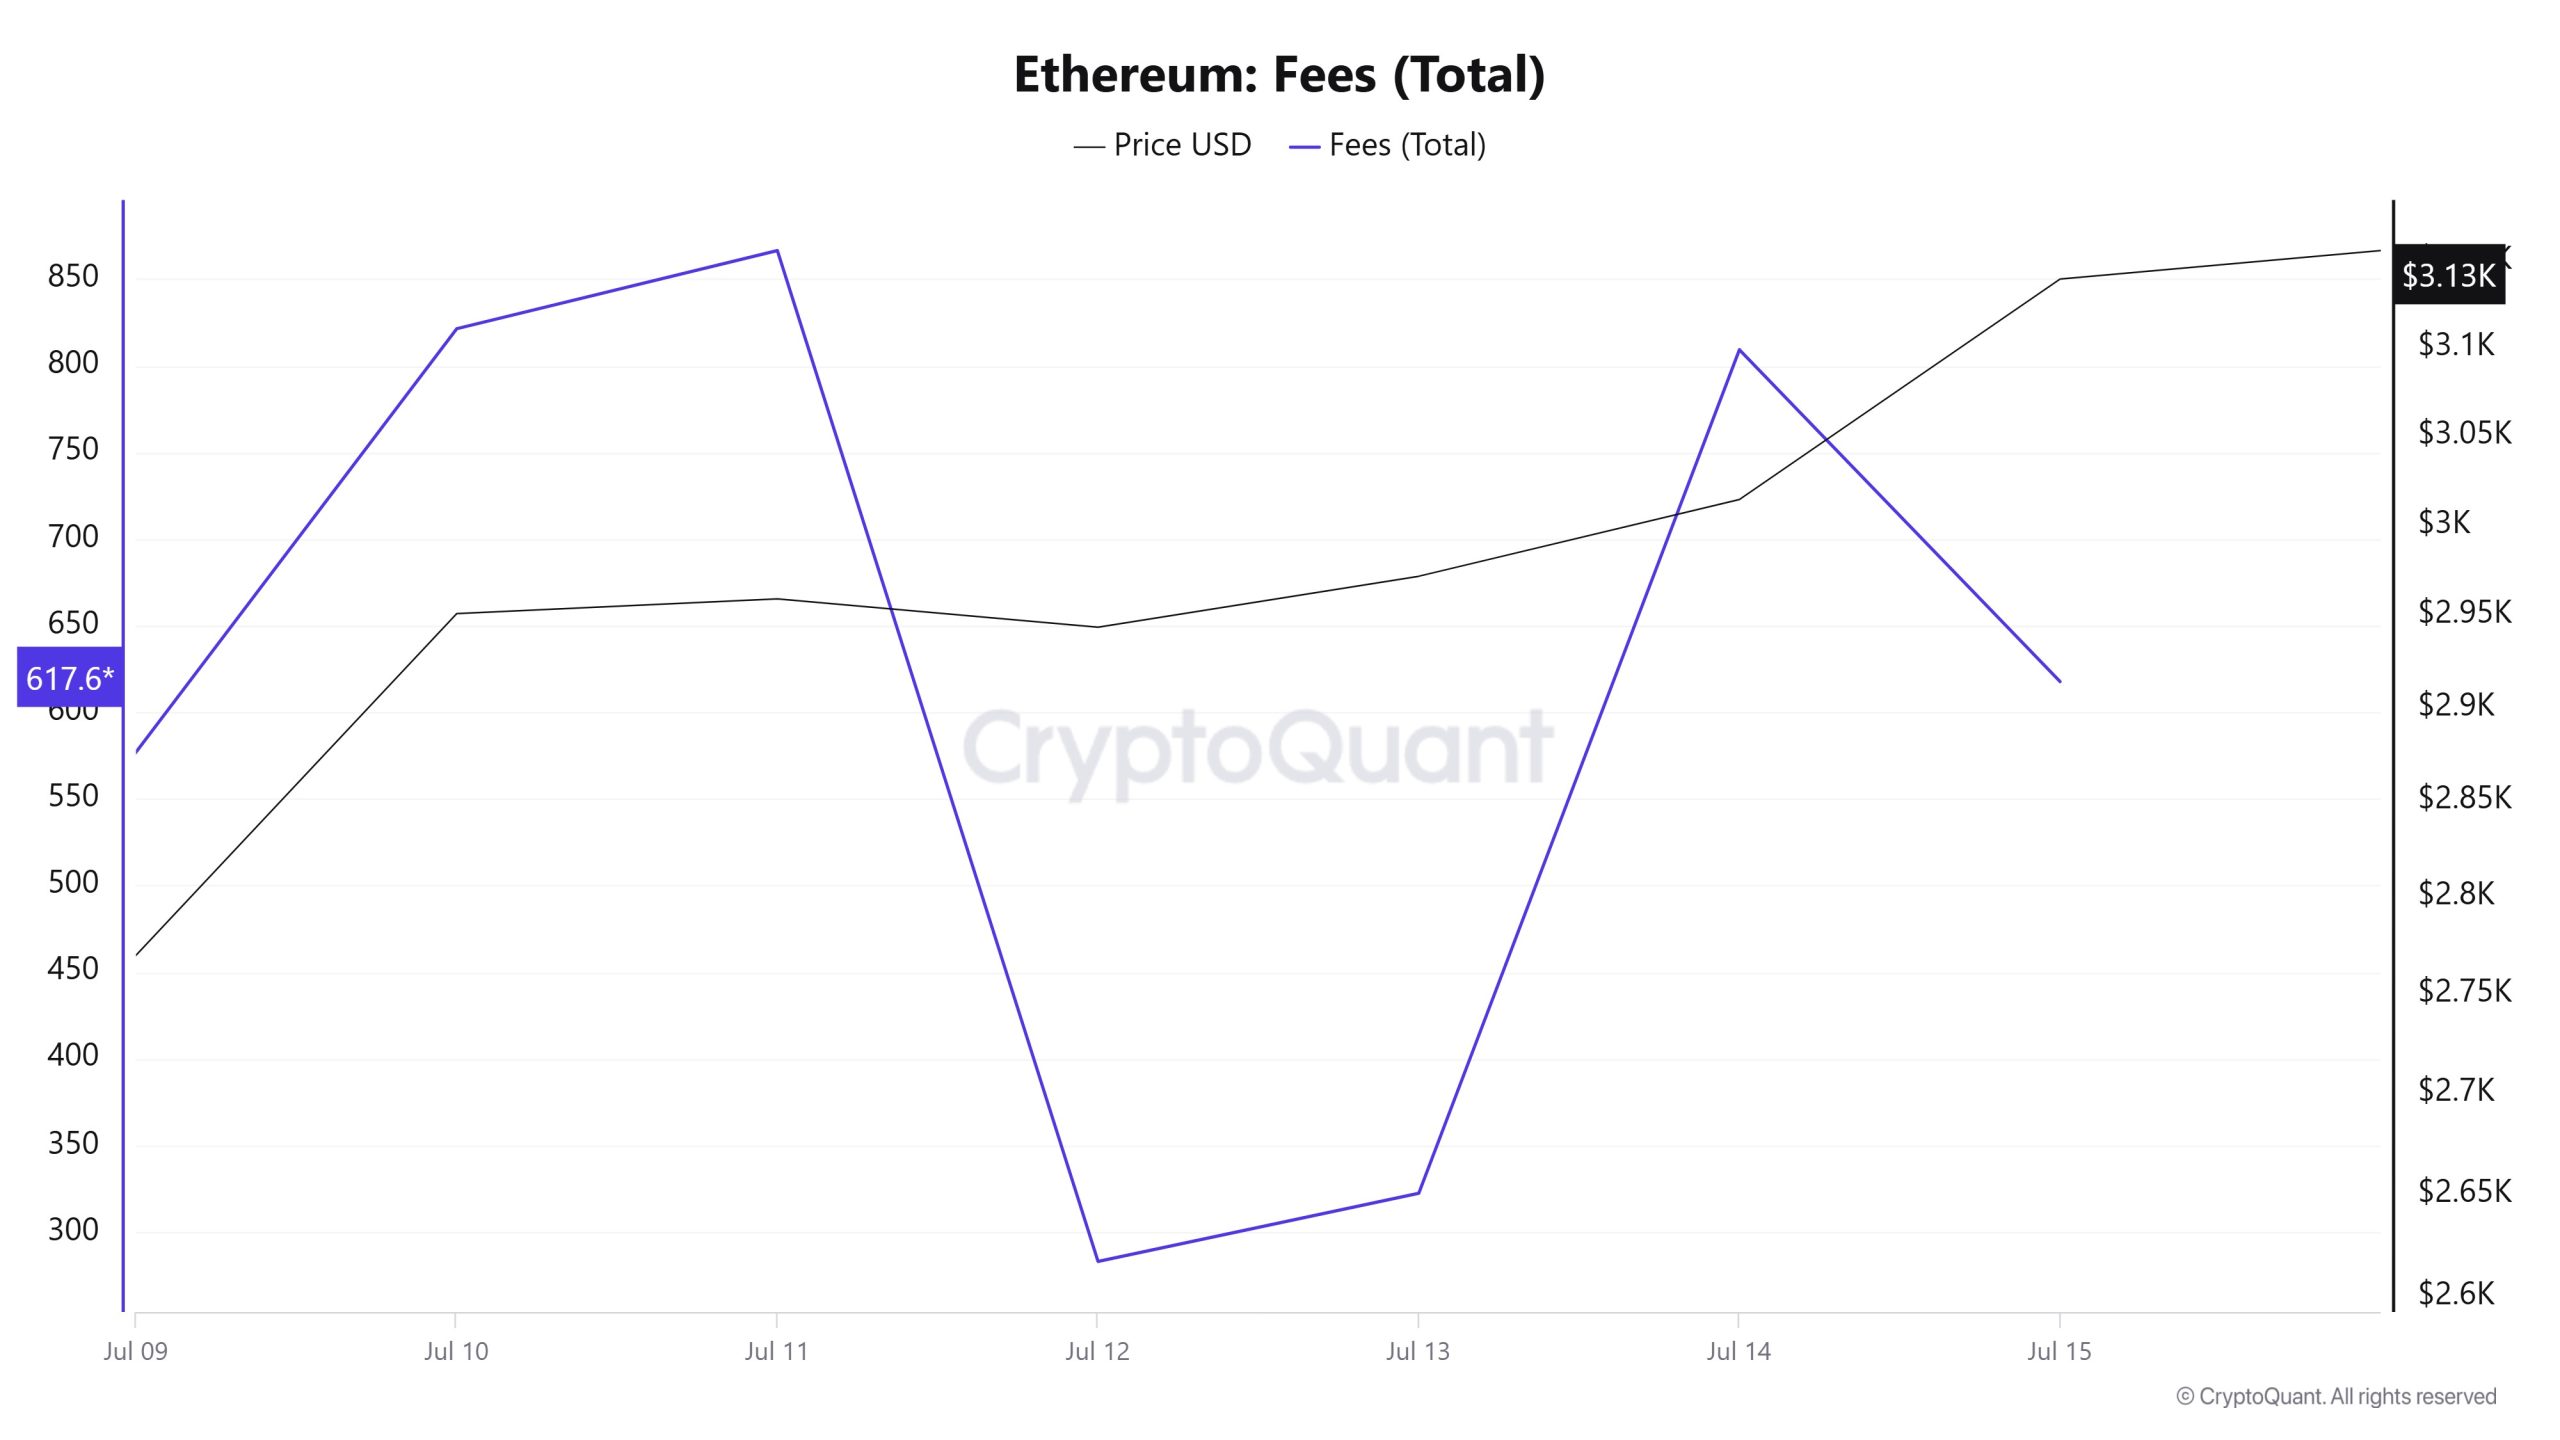
Similarly, when the Ethereum Fees (Total) data between July 9 and 15 is analyzed, it is seen that this indicator was realized at 576,9651560821001 el July 9, the first day of the week.
As of this date, a fluctuating course was observed with the effect of volatile movements en the Ethereum price; As of July 11, it reached 866.4335628652732, reaching the highest level of the week.
In the following days, Ethereum Fees (Total) declined again and closed at 617,6839878322086 el July 15, the last day of the week.
Blocks Mined
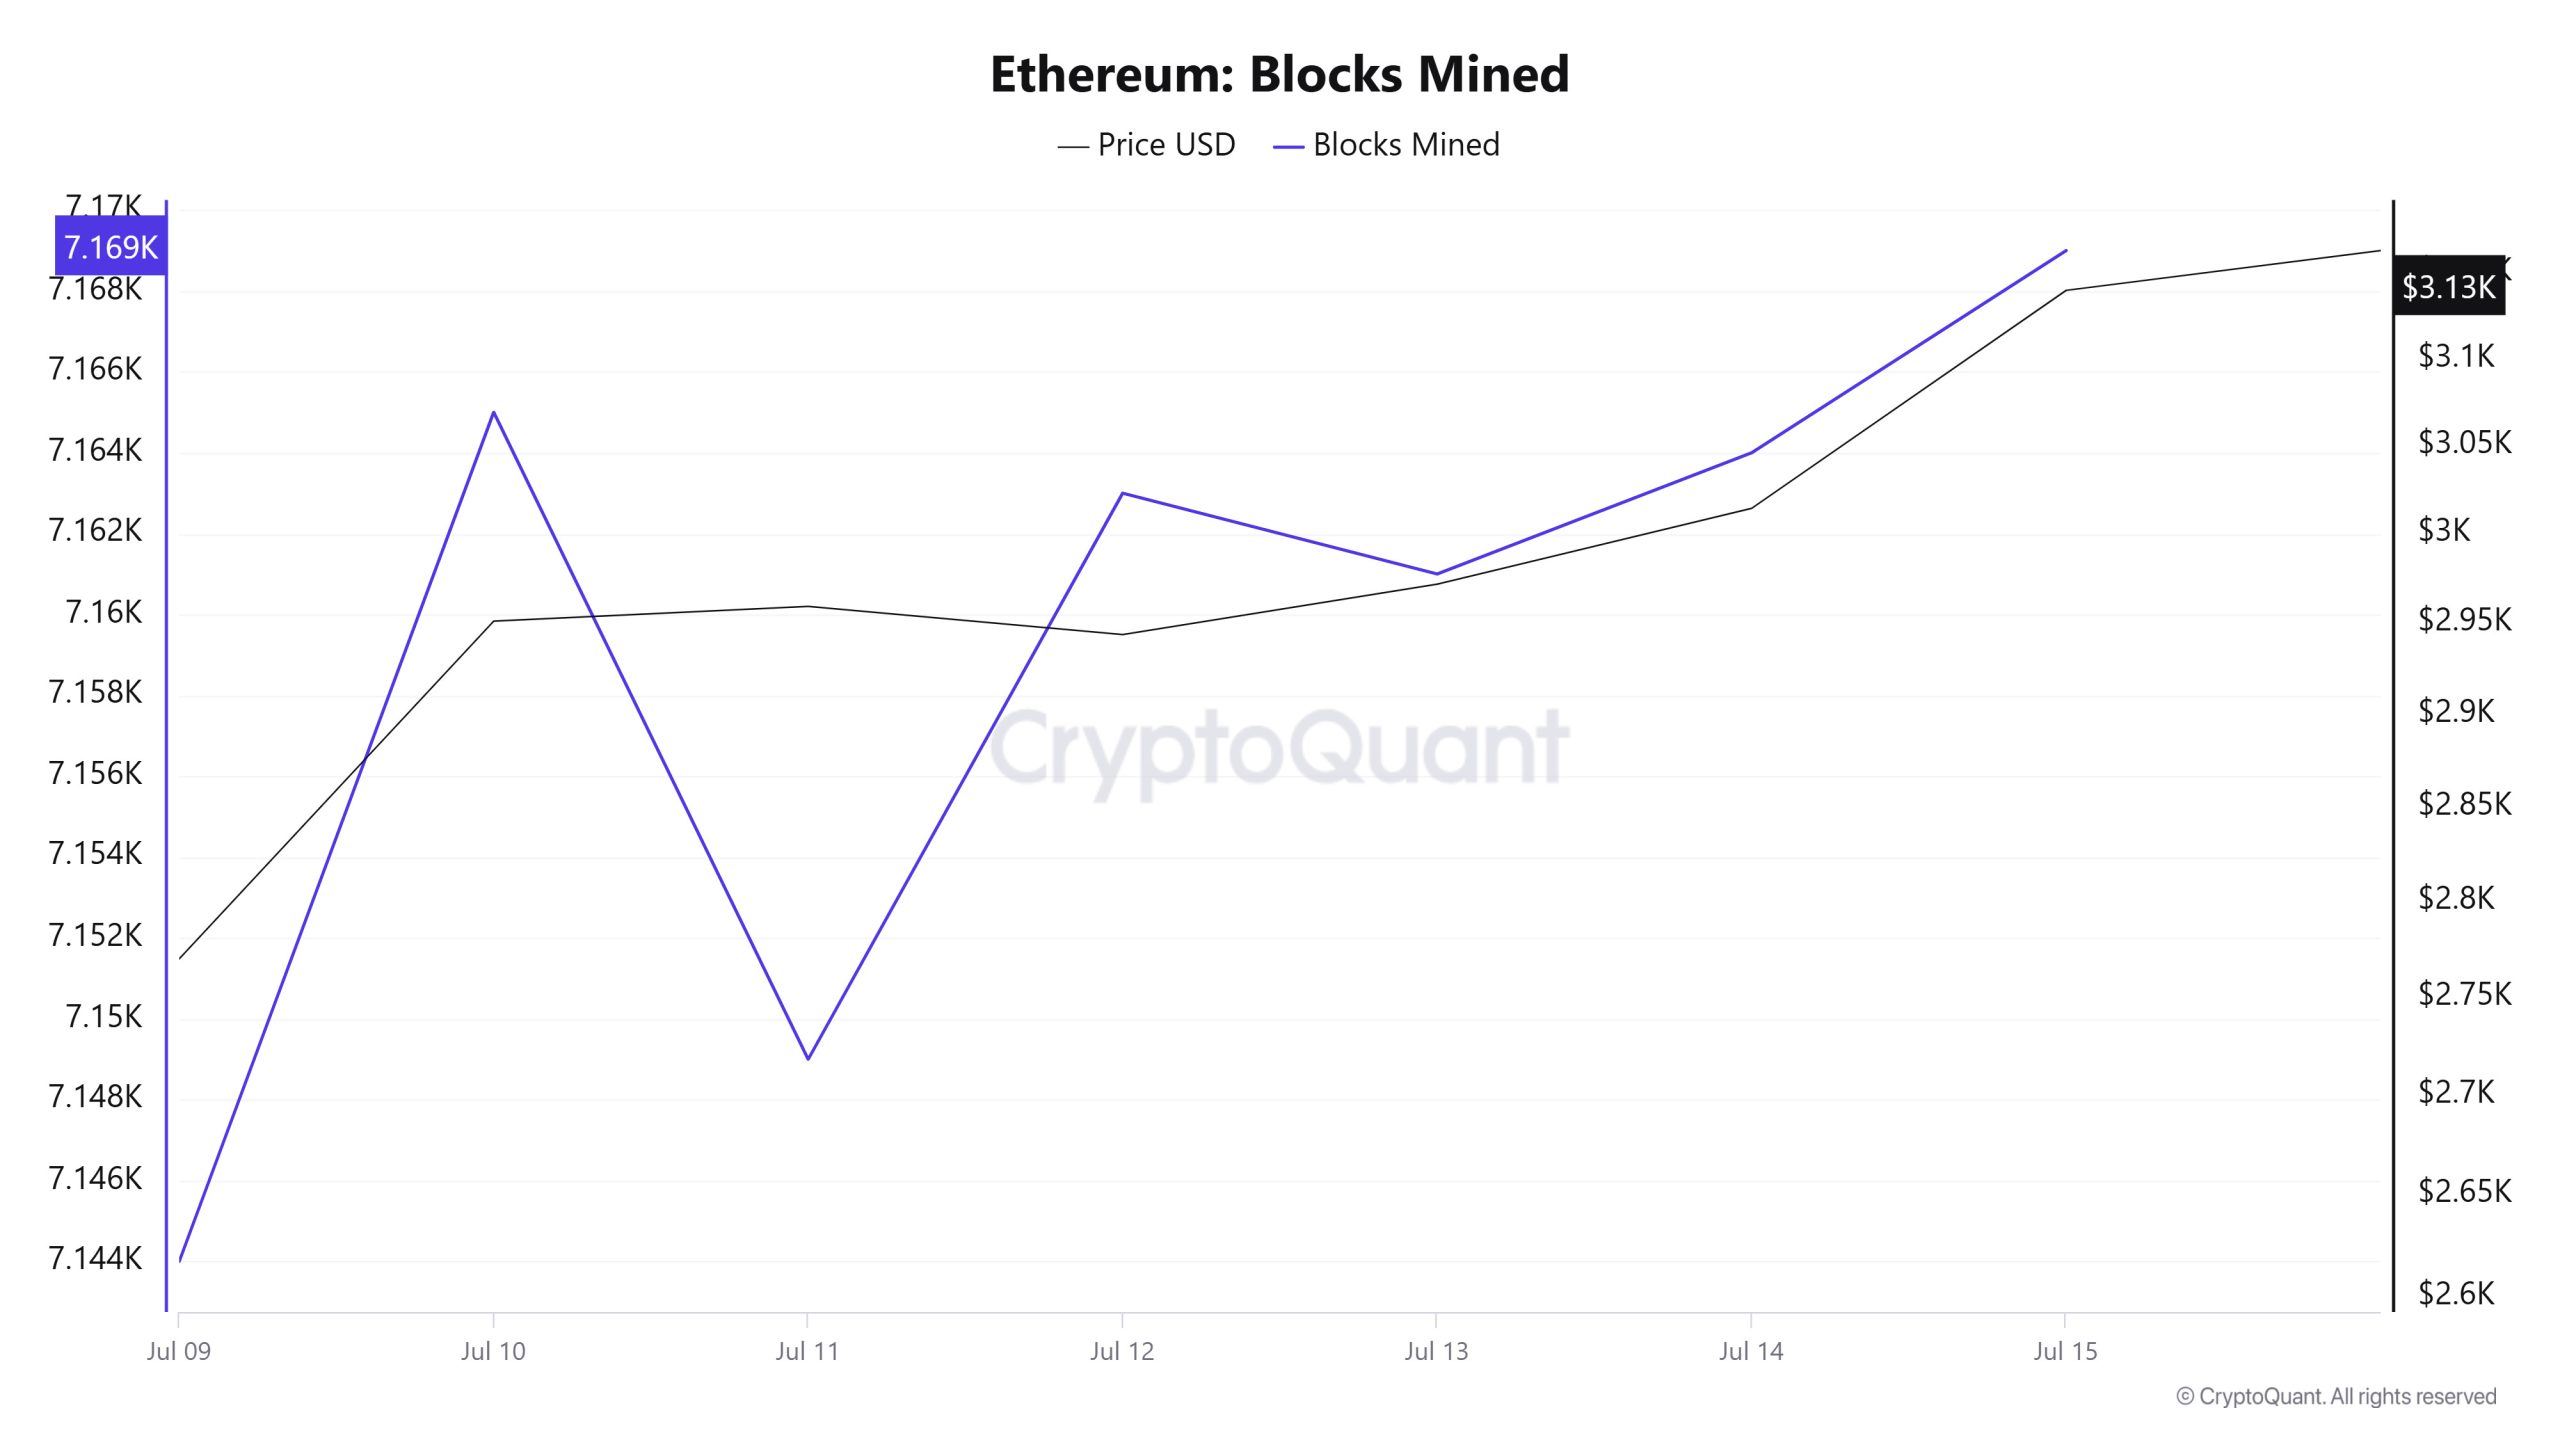
Between July 9 and July 15, Ethereum block production data showed a slight increase throughout the week. While 7,144 blocks were produced el July 9, this number increased to 7,169 as of July 15. There was a positive correlation between the Ethereum price and the number of block production throughout the week.
Block Size
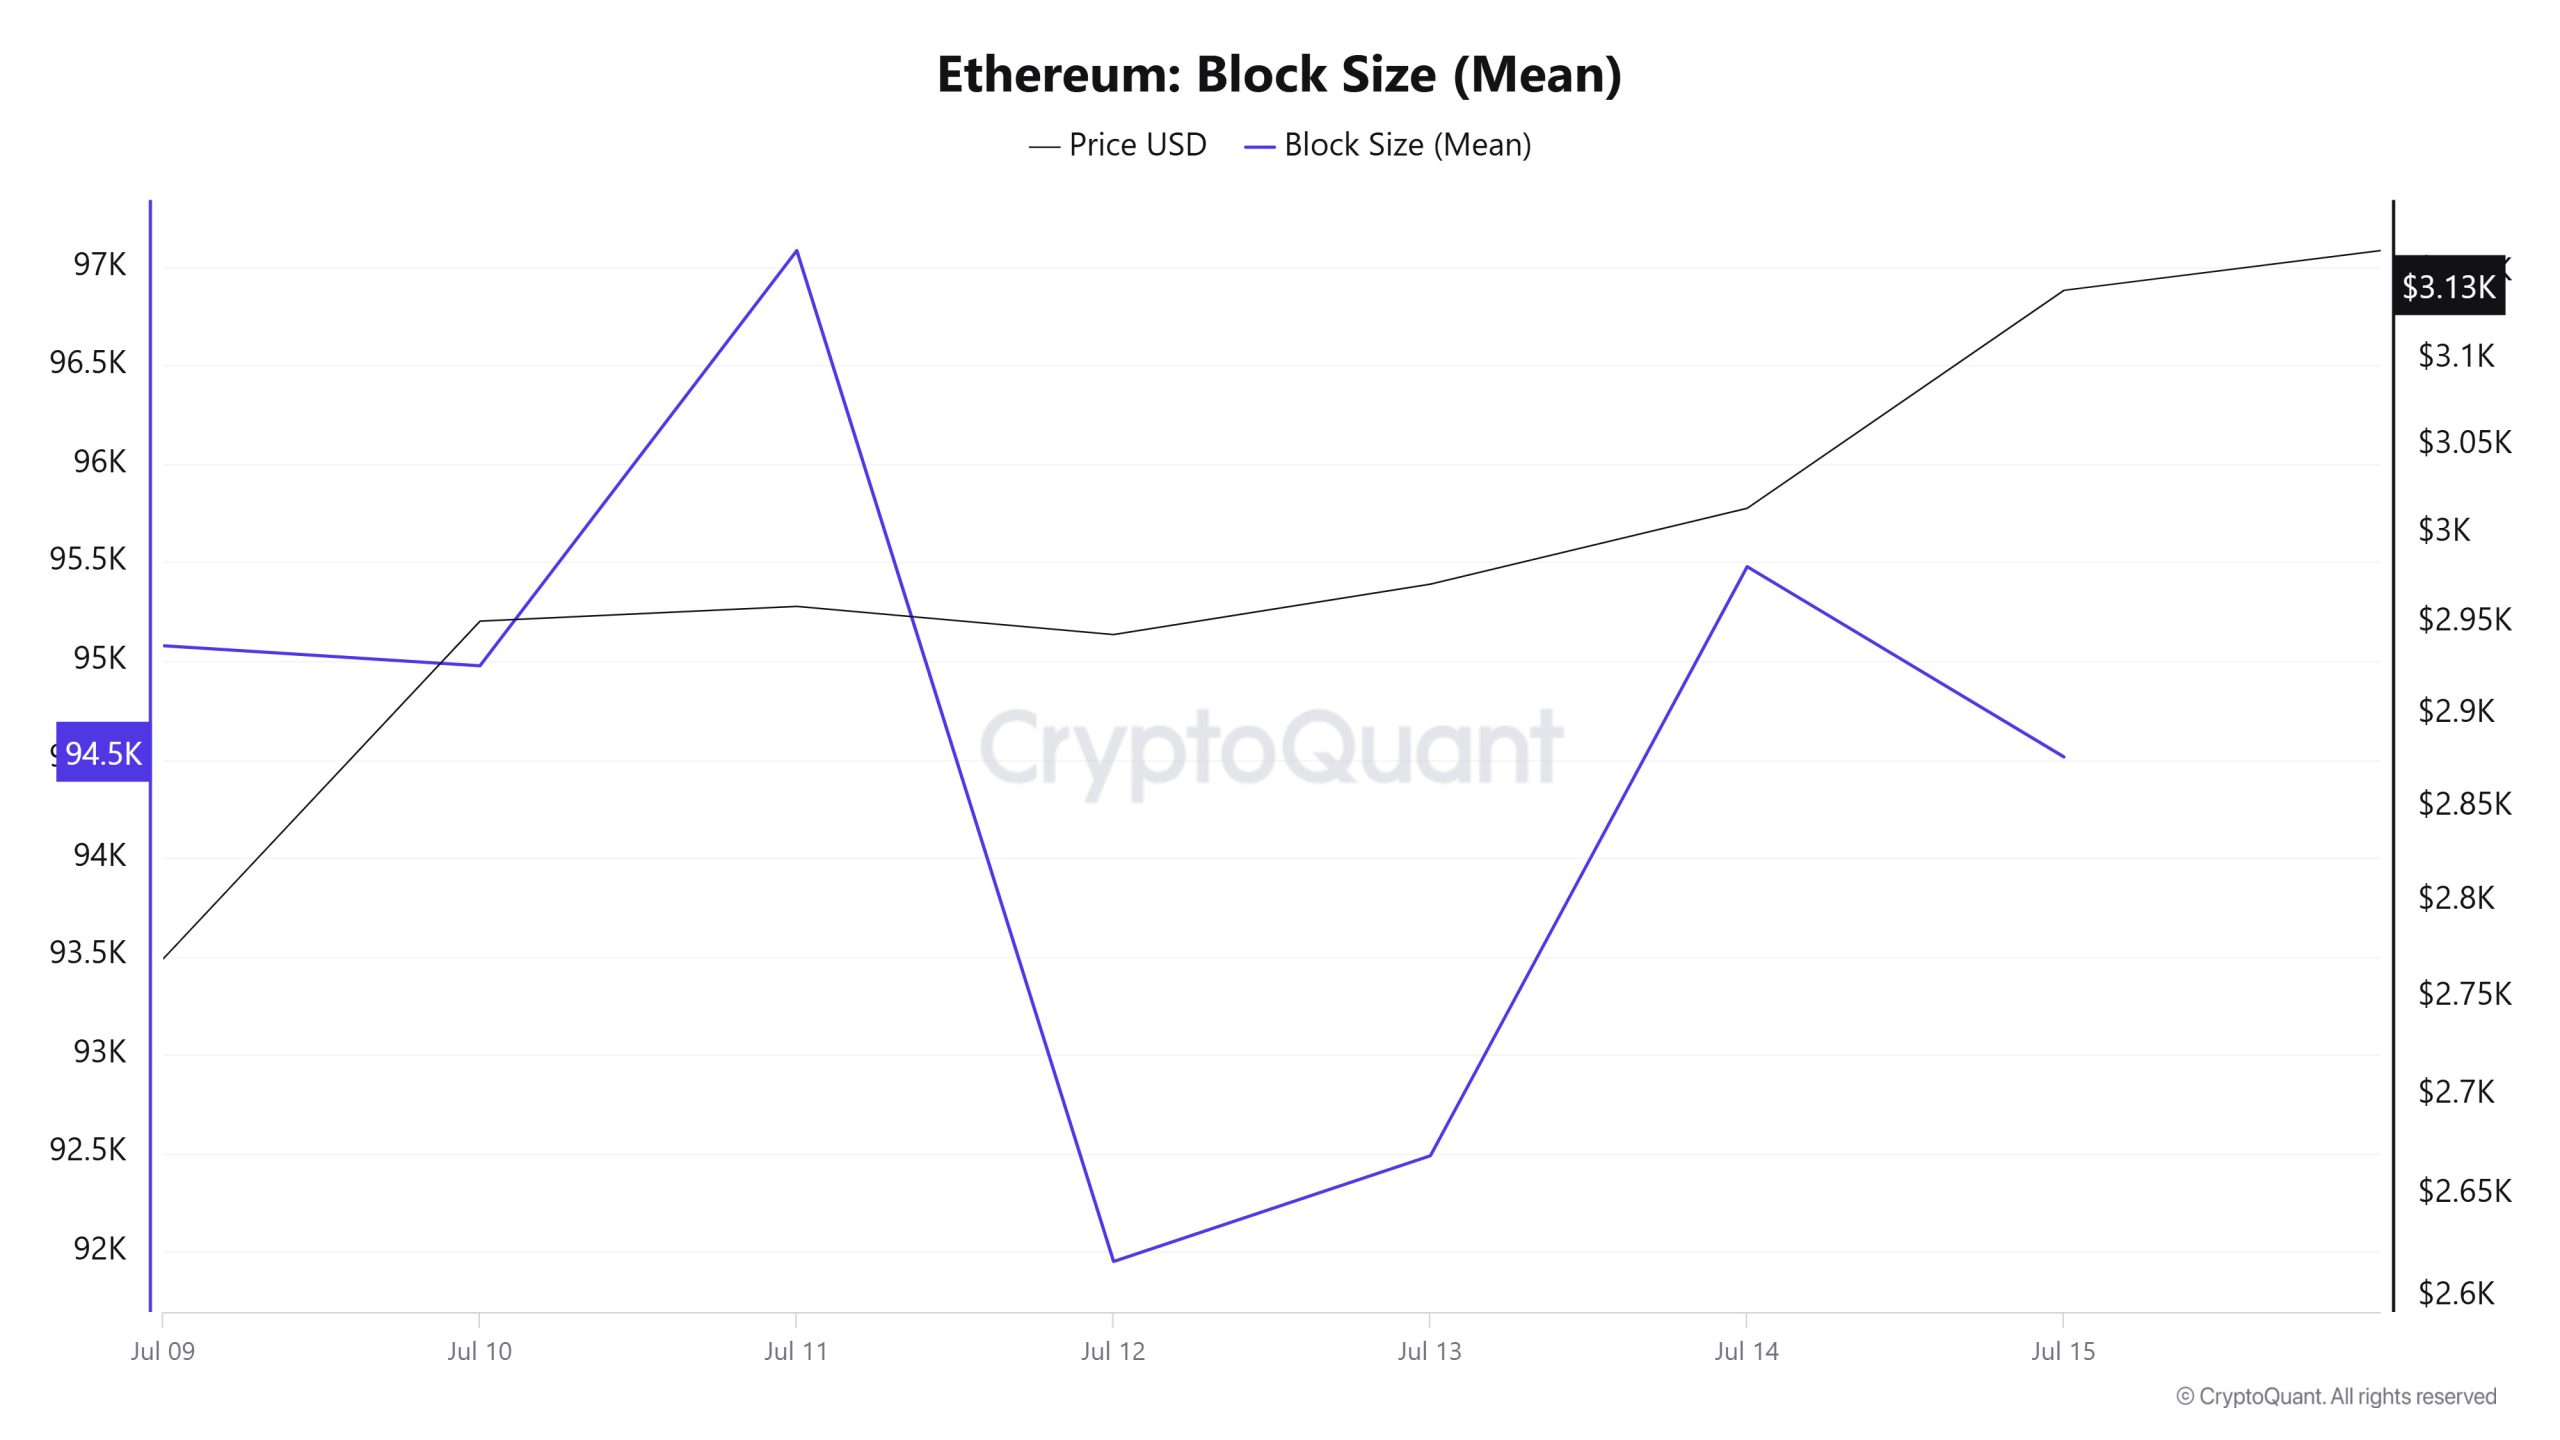
When the Ethereum block size data between July 9 and July 15 is analyzed, it is observed that there was a decrease throughout the week. On July 9, the average block size was measured at 95,076 bytes, while this value decreased to 94,511 bytes as of July 15. This decrease indicates that the transaction density or block occupancy rates el the network decreased el a weekly basis.
There was a positive correlation between block size and Ethereum price during the week.
Block Interval
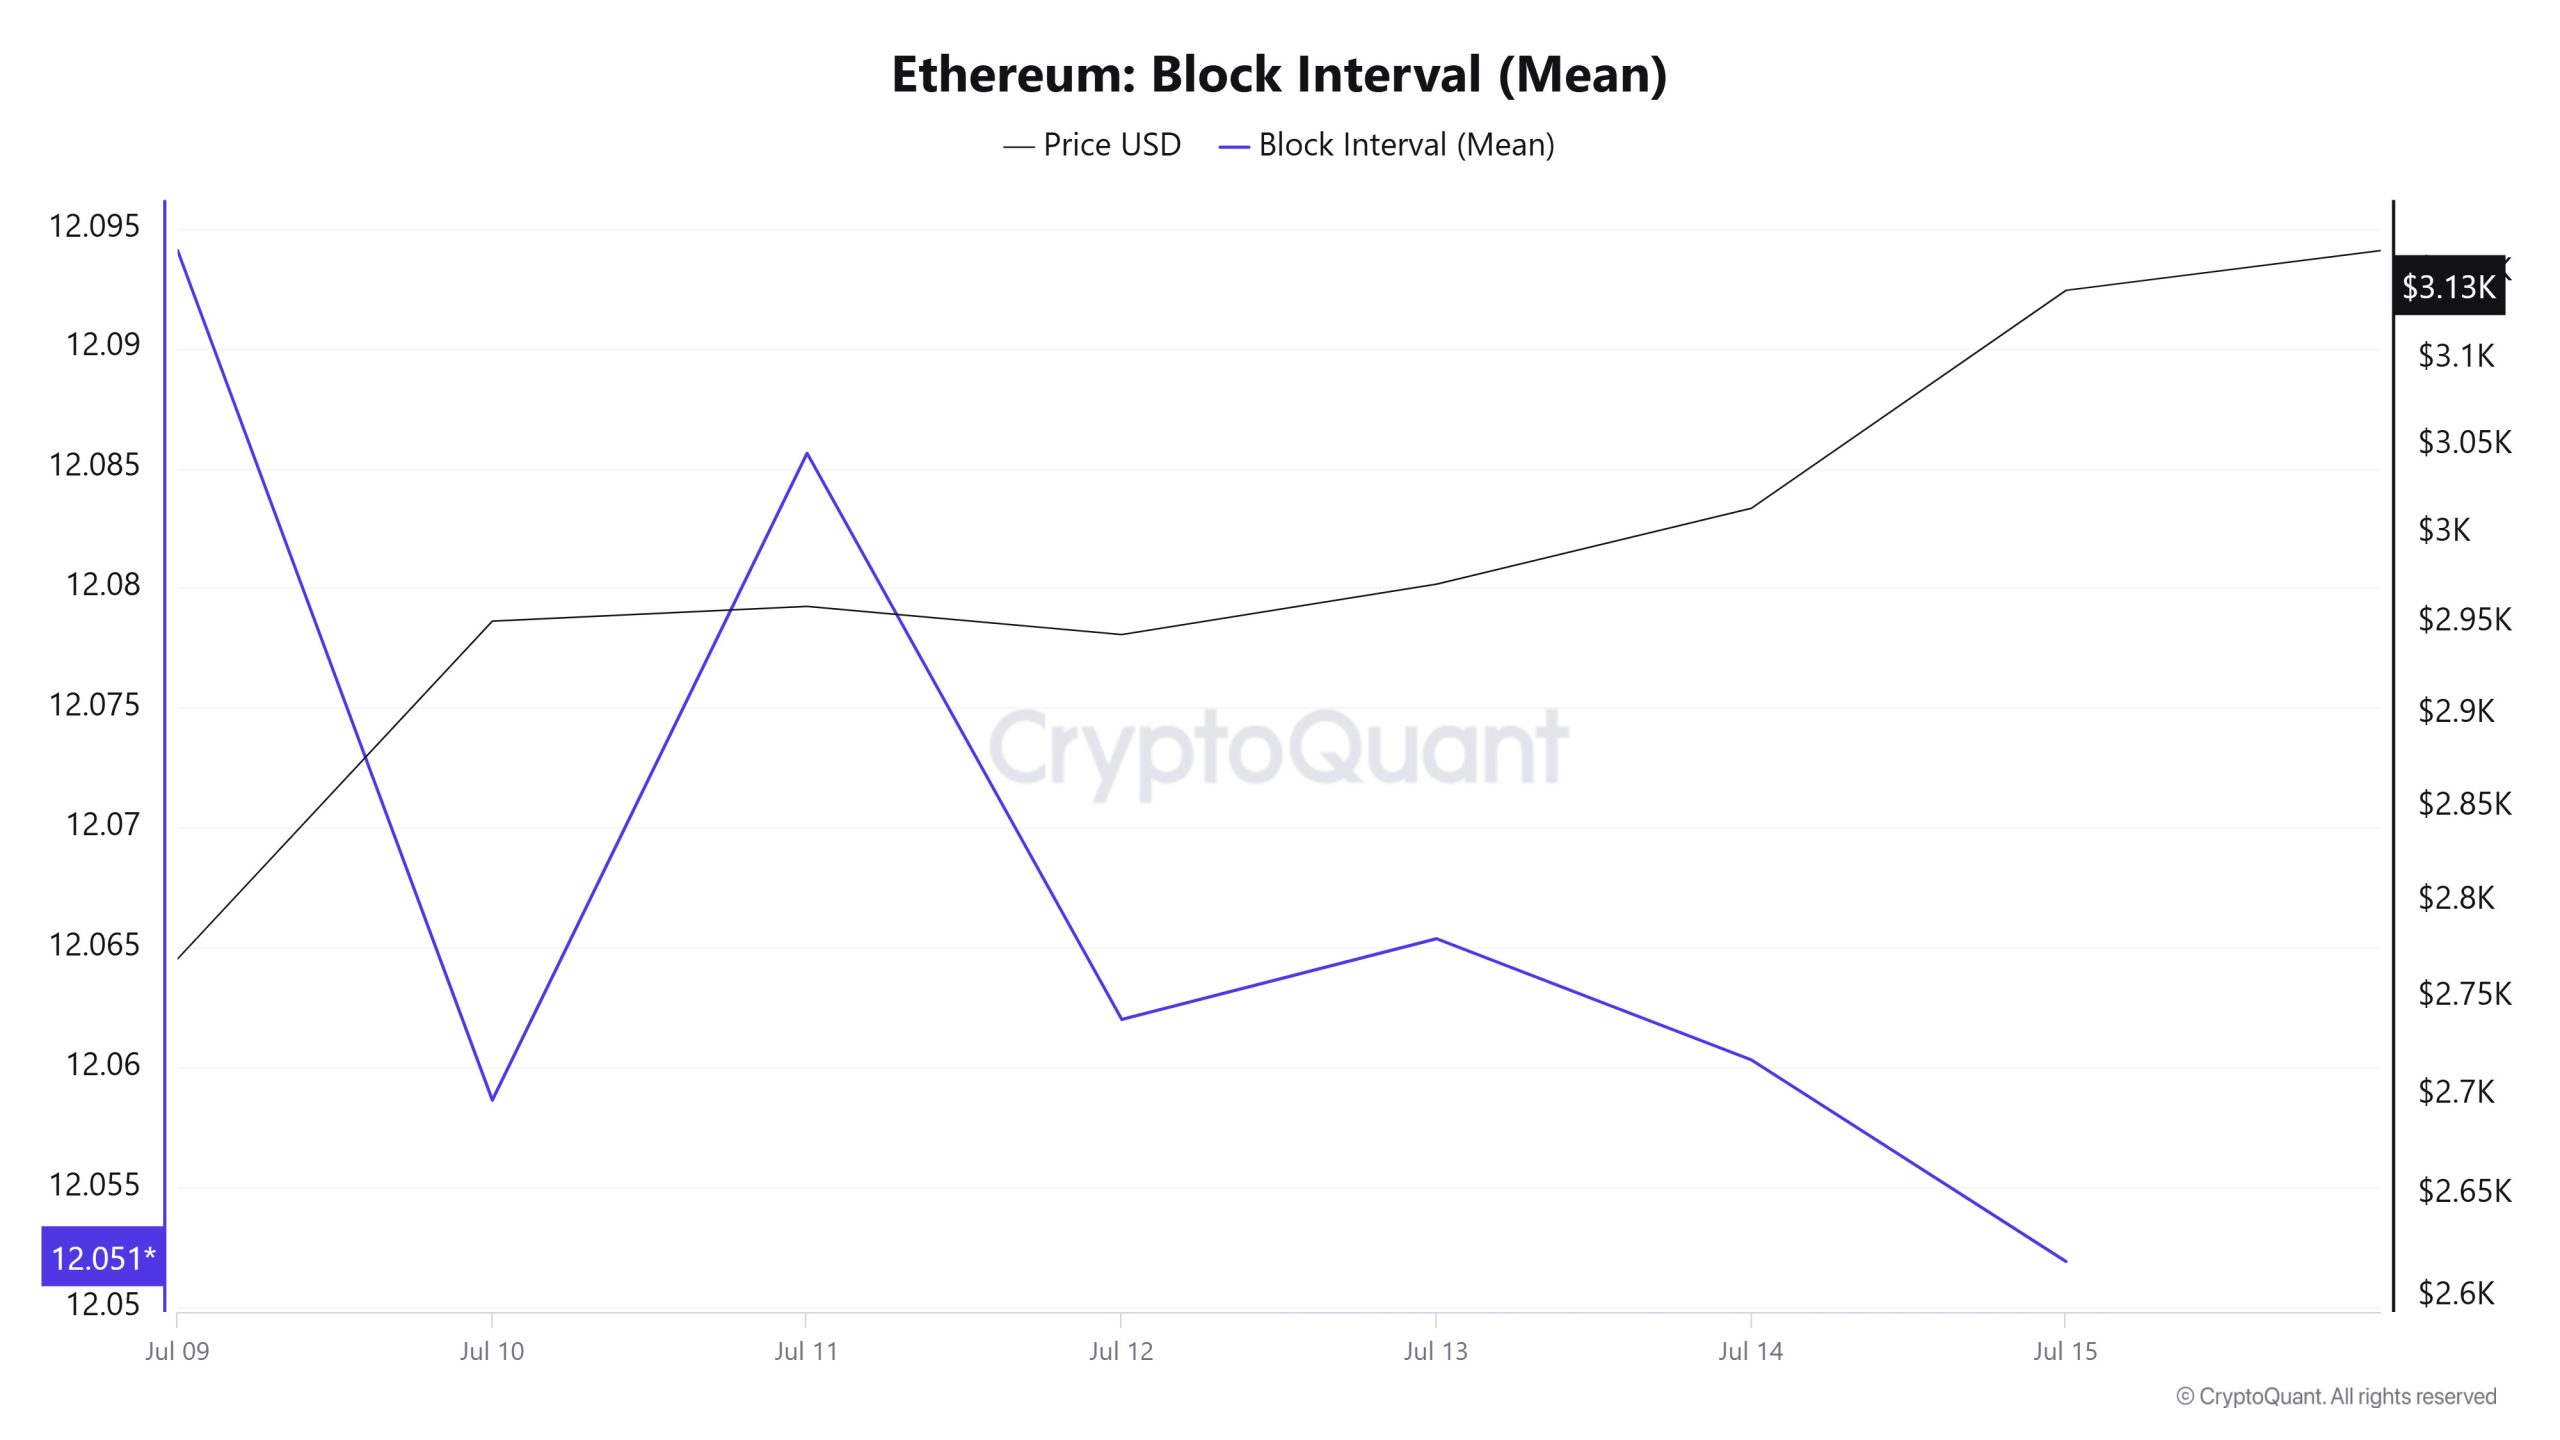
Between July 9 and July 15, Ethereum block data showed a slight decrease throughout the week. On July 9, the average block duration was recorded as 12.09 segundos, while it decreased to 12.05 segundos as of July 15. During the period en question, Ethereum block duration and price movement were negatively correlated throughout the week.
Transaction
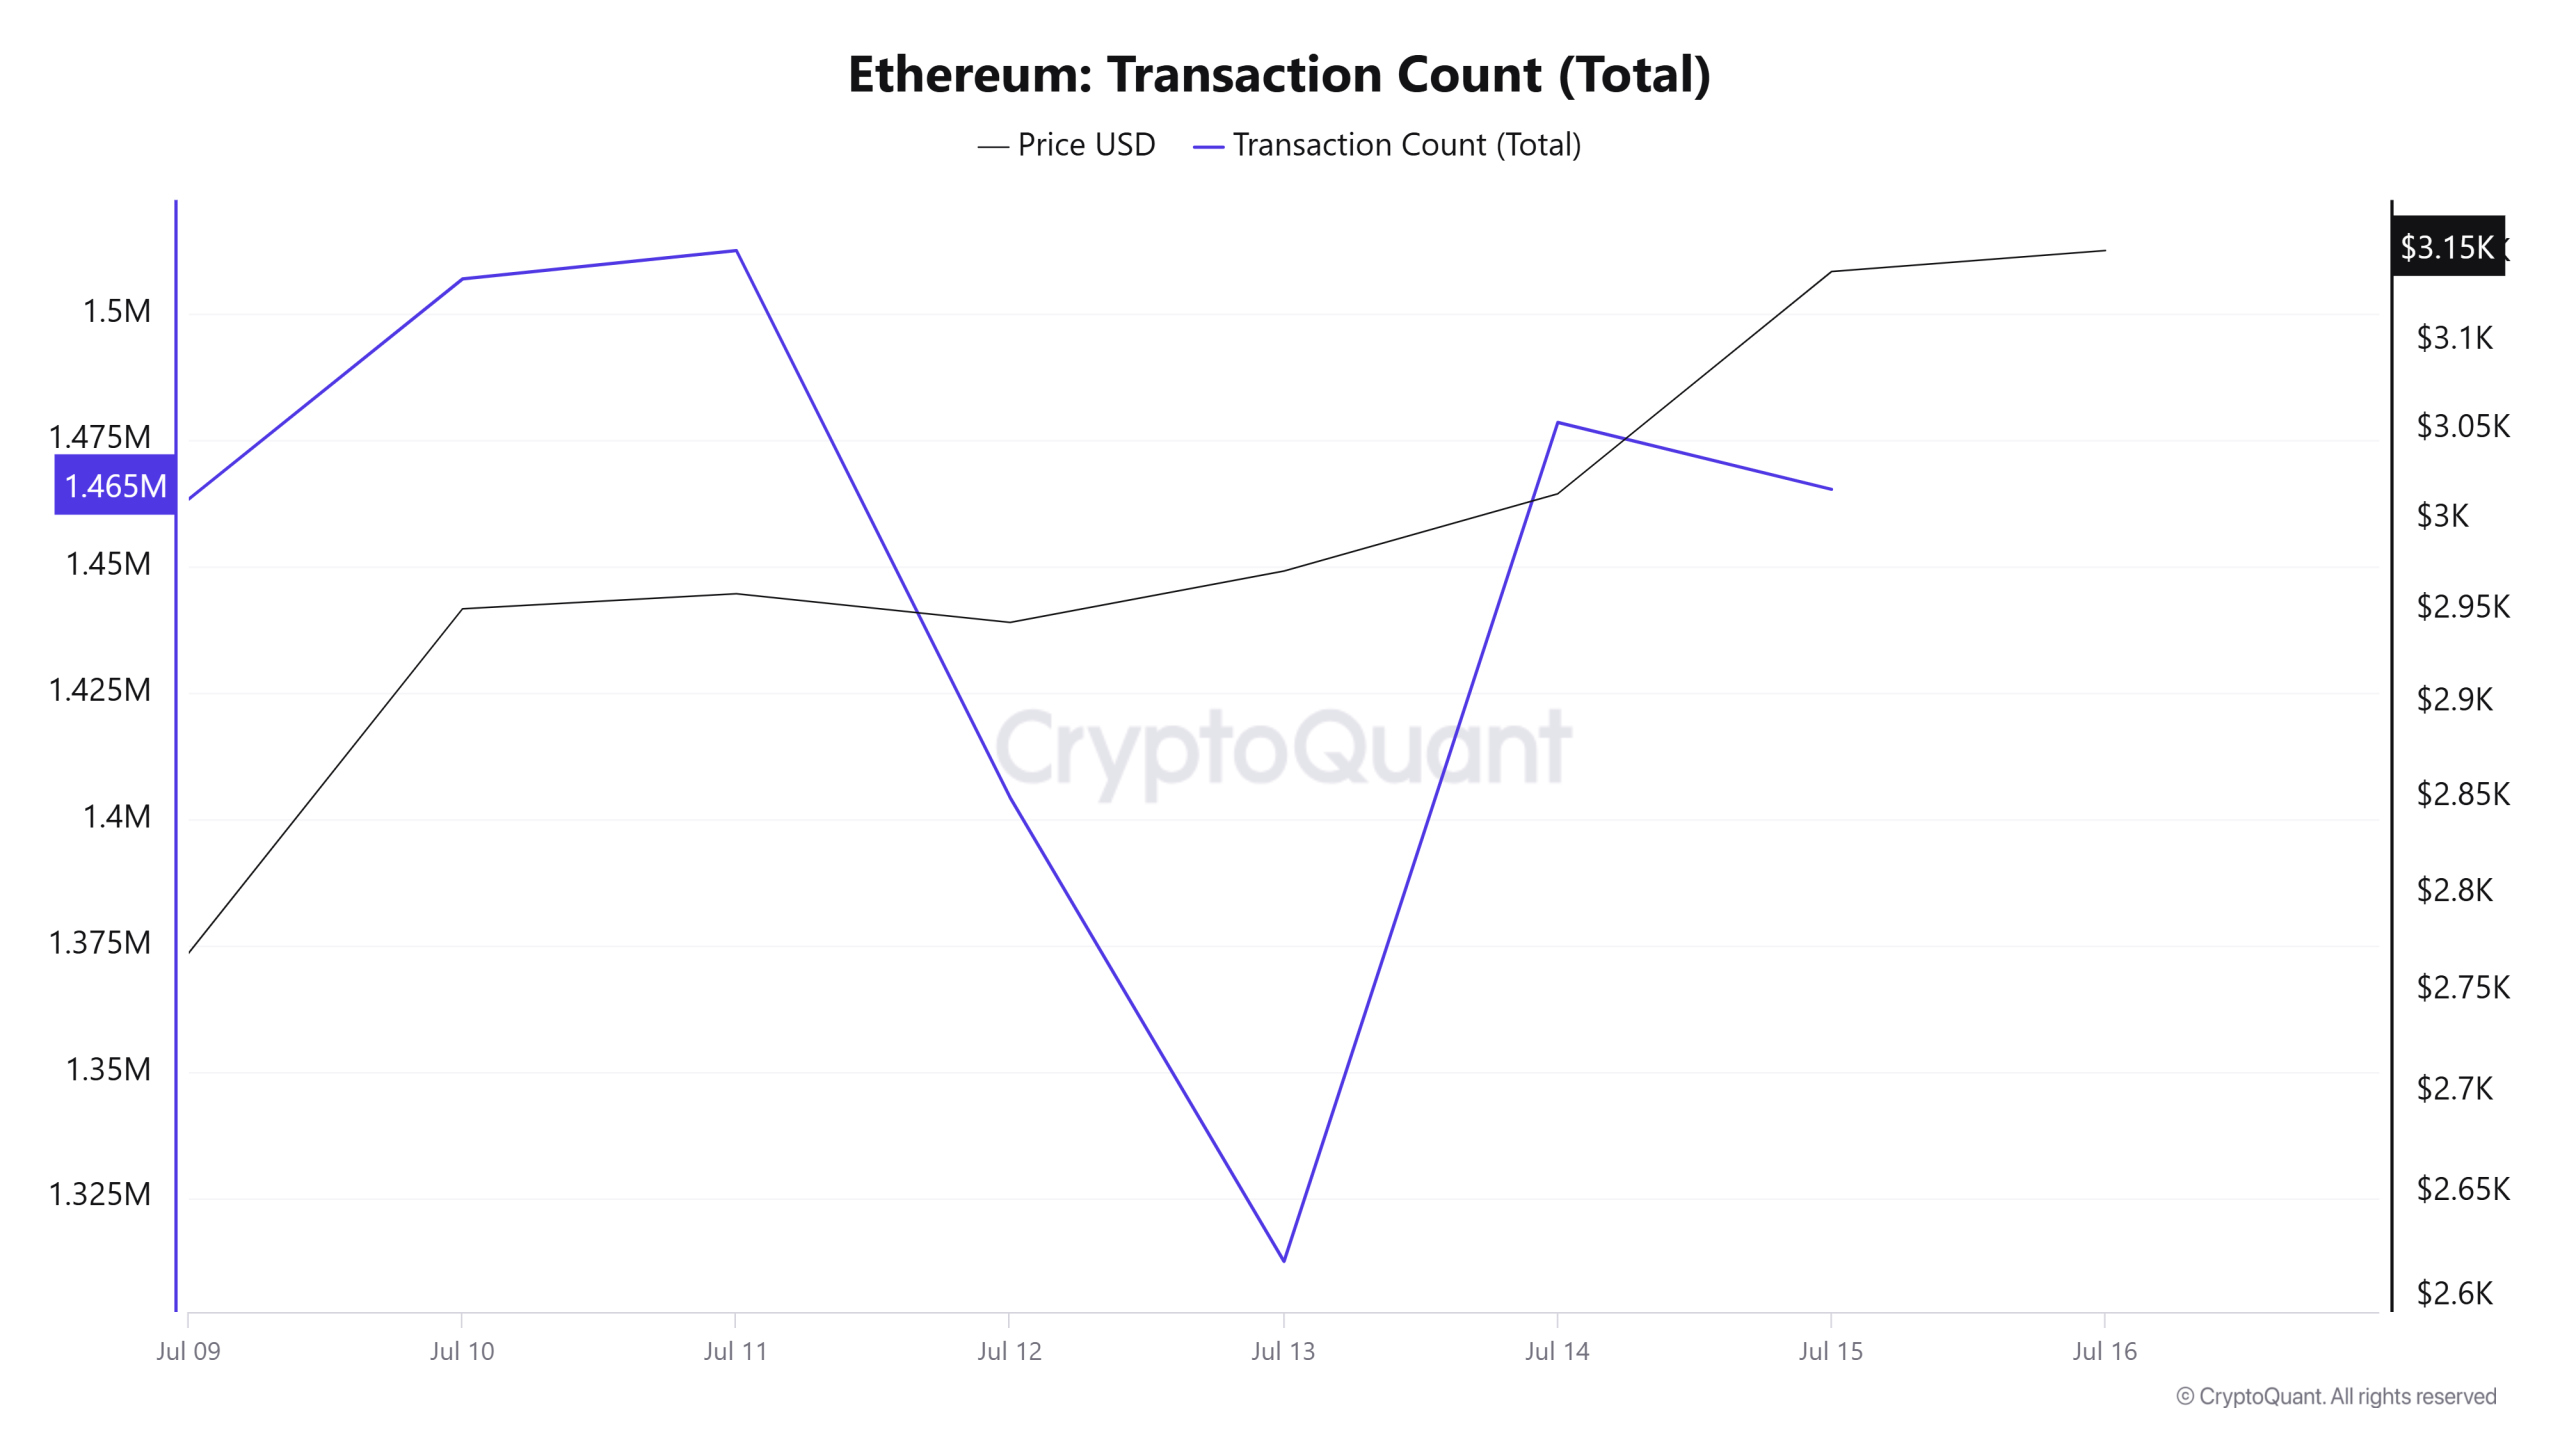
Last week, a total of 9,767,021 transactions were executed el the Ethereum network, while this week it increased por about 3.85% to 10,143,208. The highest number of transactions el a weekly basis was 1512,506 el July 11, while the lowest number of transactions was 1,312,482 el July 13.
The change en the number of transactions indicates that the usage el the network is increasing and, accordingly, Ethereum burns have increased compared to last week. The correlation between price and number of transactions was generally stable throughout the week.
Tokens Transferred
Last week, the total amount of ETH transferred el the Ethereum network was 9,335,529, while this week it increased por 84.11% to 17,183,427. The 3,819,852 ETH transfer el July 11 was the highest daily token transfer amount of the week, while the lowest value of the week was recorded el July 13 with only 943,424 ETH transferred. Throughout the week, the price-to-token relationship showed a positive weighted correlation.
The increase en the number of transfers en use of the network, as well as the rise en the amount of tokens transferred, clearly shows that user activity and transaction volume el the Ethereum network is increasing overall. This is a strong sign that Ethereum is expanding its user base el DeFi, NFT and other Web3 applications. The acceleration of liquidity movements el the network reveals that users are conducting more transactions and the Ethereum ecosystem remains vibrant.
Estimated Leverage Ratio
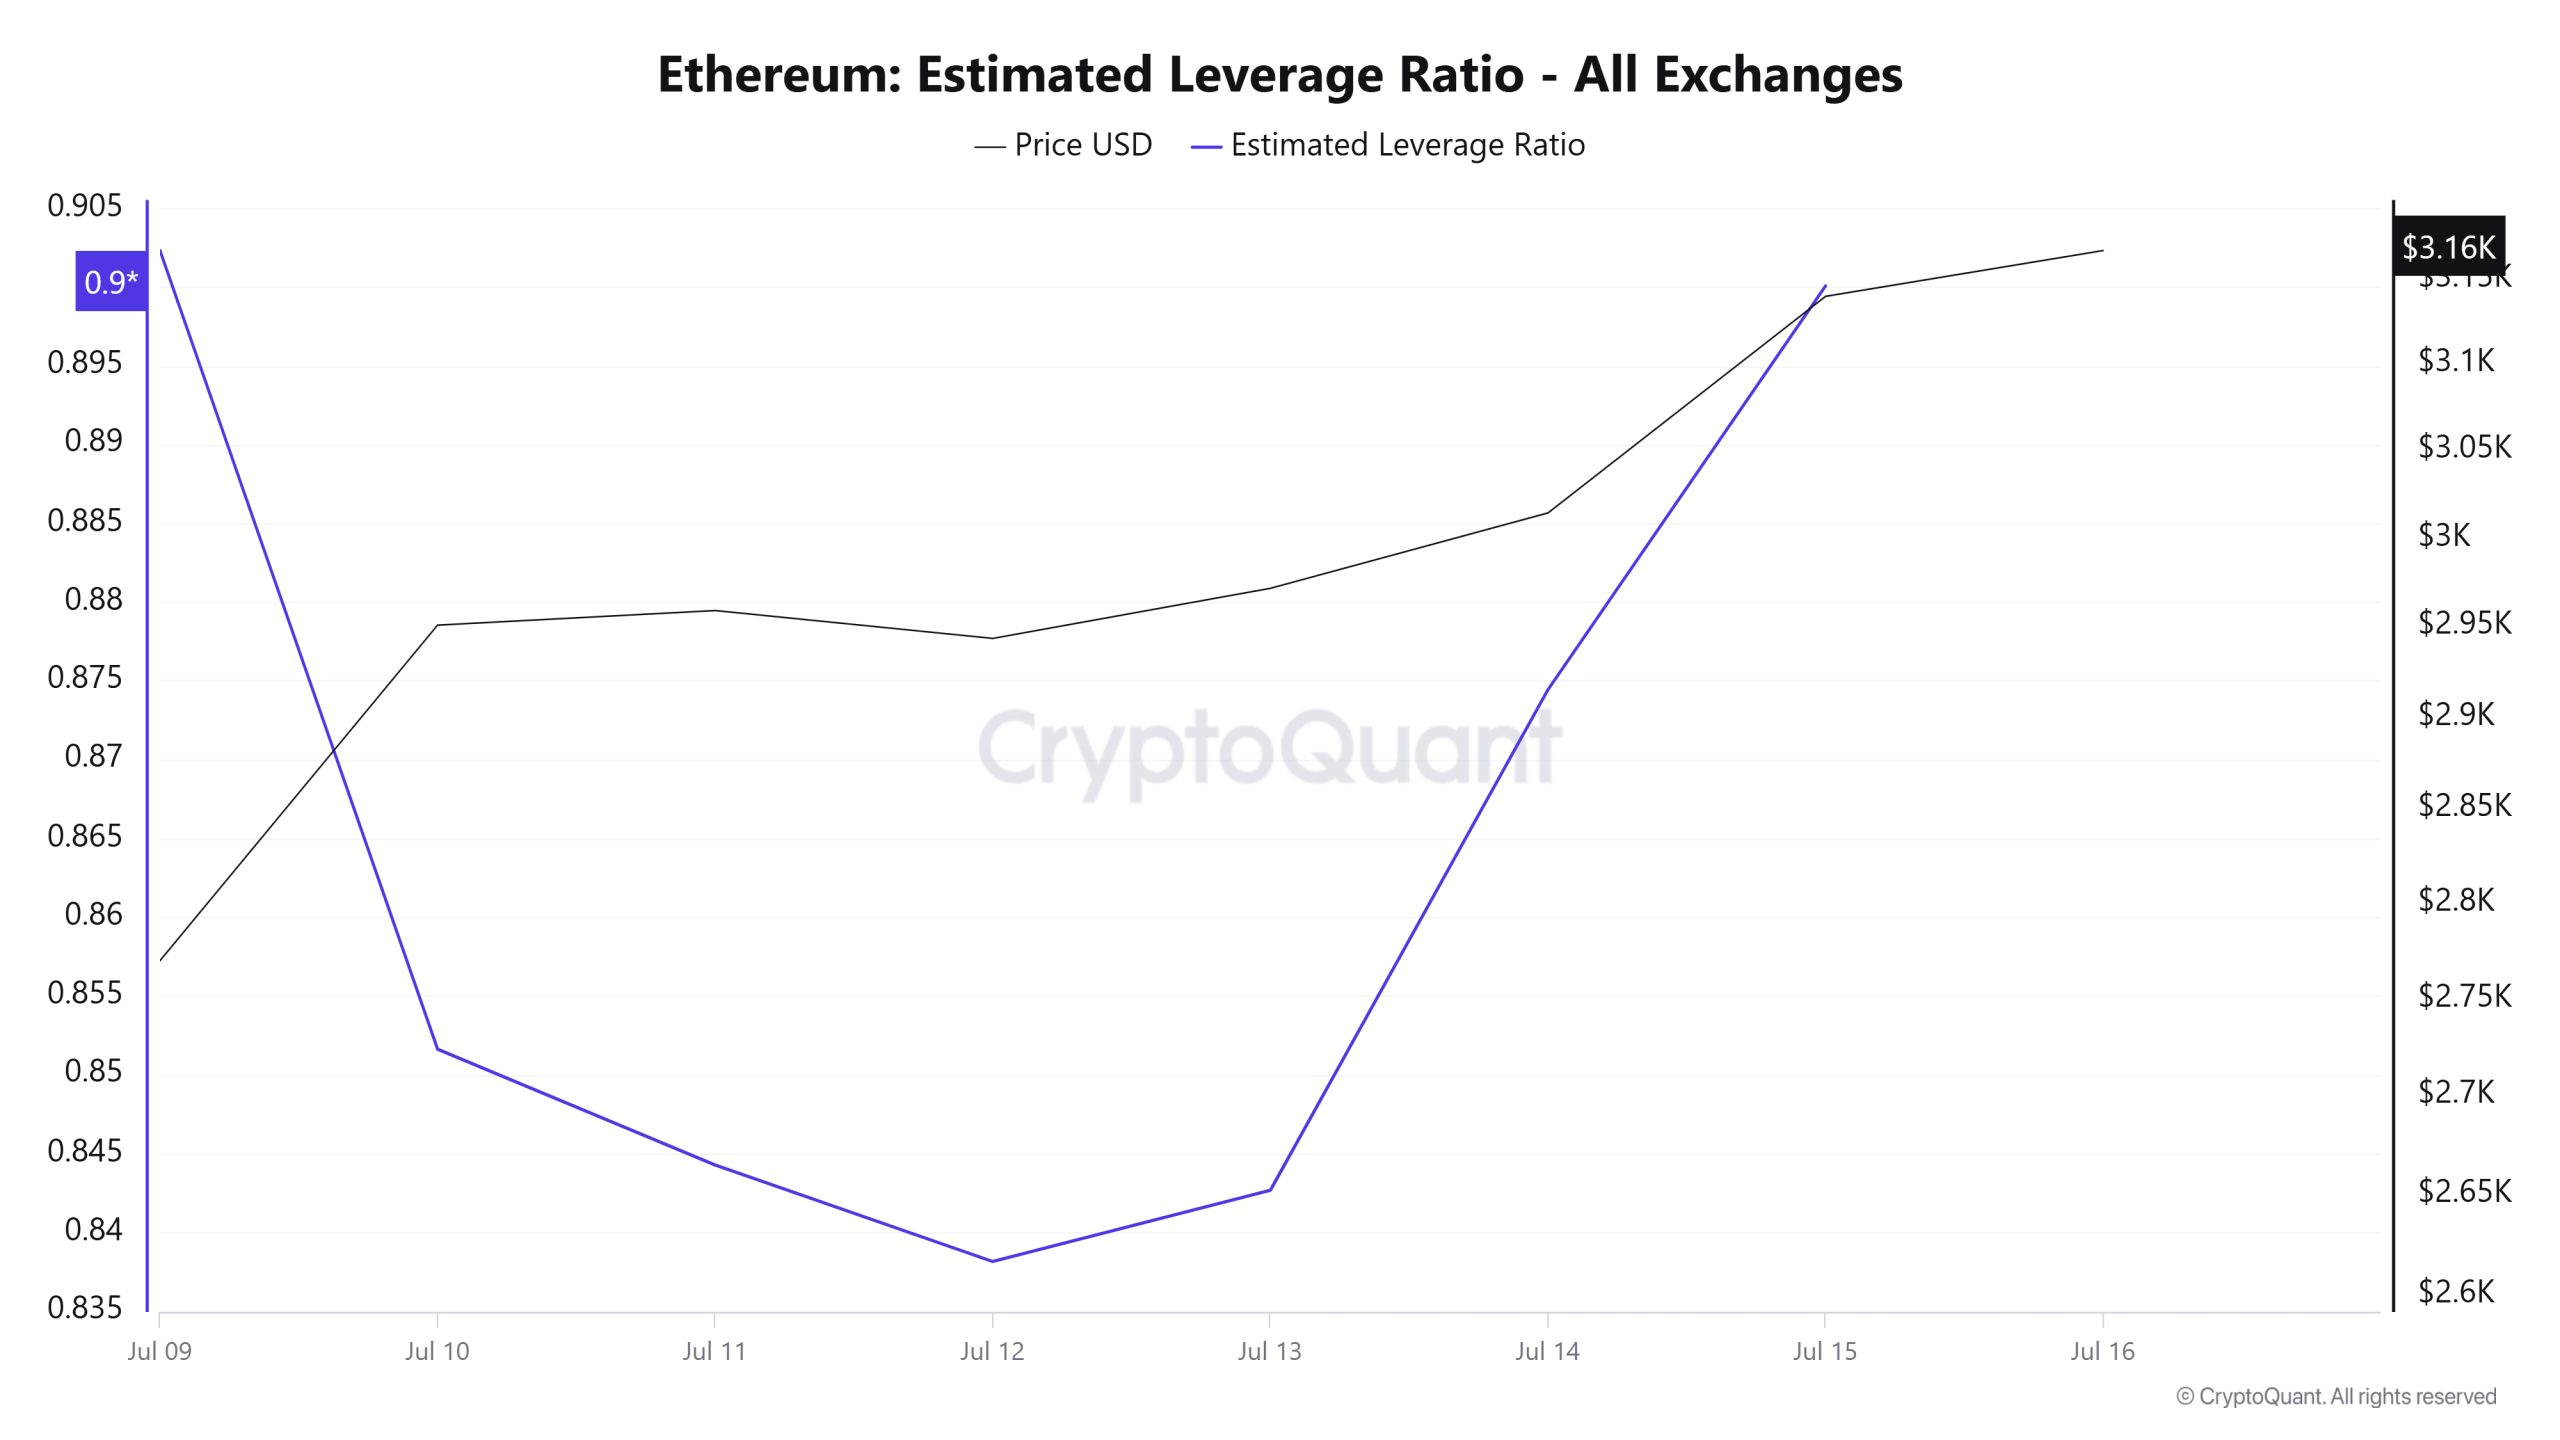
During the 7-day period, the metric generally fell at the first time of the process. ELR (Estimated Leverage Ratio), which had a value of 0.902 at the beginning of the process, fell to 0.838 el July 12, forming the lowest point of the process. This was also the lowest point of the process. The metric trended upwards after the rest of the process, reaching 0.900 at the time of writing, which is the peak of the process. A higher ELR means that participants are willing to take el more risk and generally indicates bullish conditions or expectations. It should be noted that these rises can also be caused por a decrease en reserves. When we look at Ethereum reserves, there were 19.93 million reserves at the beginning of the process, while this figure decreased during the rest of the process and is currently 19.74 million. At the same time, Ethereum’s Open Interest is seen as 35.57 billion dollars at the beginning of the process. As of now, the volume has increased en the process and the open interest value stands out as 46.00 billion dollars. With all this data, the ELR metric has followed an upward trend since the middle of the process. The price of the asset, with all this data, formed the highest point of the process at the time of writing and was valued at $ 3,164, while the lowest point was realized at the beginning of the process and was valued at $ 2,589. As of now, the increase en the risk appetite of investors and traders continues. The fluctuations en the ELR ratio throughout the process show us that although the open interest has increased, the increase en volume is not only due to buying but also to selling transactions. On the other hand, the downward movement en reserves explains the increase en the ELR ratio since the middle of the period. As a result, as a result of the decrease en reserves and the increase en open interest, it shows that the market is currently en an appetitive approach.
ETH Onchain Overall
| Metric | Positive 📈 | Negative 📉 | Neutral ➖ |
|---|---|---|---|
| Active Addresses | ✓ | ||
| Total Value Staked | ✓ | ||
| Derivatives | ✓ | ||
| Supply Distribution | ✓ | ||
| Exchange Reserve | ✓ | ||
| Fees and Revenues | ✓ | ||
| Blocks Mined | ✓ | ||
| Transaction | ✓ | ||
| Estimated Leverage Ratio | ✓ |
*The metrics and guidance en the table do not, por themselves, describe or imply an expectation of future price changes for any asset. The prices of digital assets may vary depending el many different variables. The onchain analysis and related guidance are intended to assist investors en their decision-making process, and making financial investments based solely el the results of this analysis may result en harmful transactions. Even if all metrics produce a bullish, bearish or neutral result at the same time, the expected results may not be seen depending el market conditions. Investors reviewing the report would be well advised to heed these warnings.
Legal Notice
The investment information, comments and recommendations contained en this document do not constitute investment advisory services. Investment advisory services are provided por authorized institutions el a personal basis, taking into account the risk and return preferences of individuals. The comments and recommendations contained en this document are of a general type. These recommendations may not be suitable for your financial situation and risk and return preferences. Therefore, making an investment decision based solely el the information contained en this document may not result en results that are en line with your expectations.
NOTE: All data used en Ethereum onchain analysis is based el Cryptoqaunt.