Weekly Ethereum Onchain Report – October 01
Active Addresses
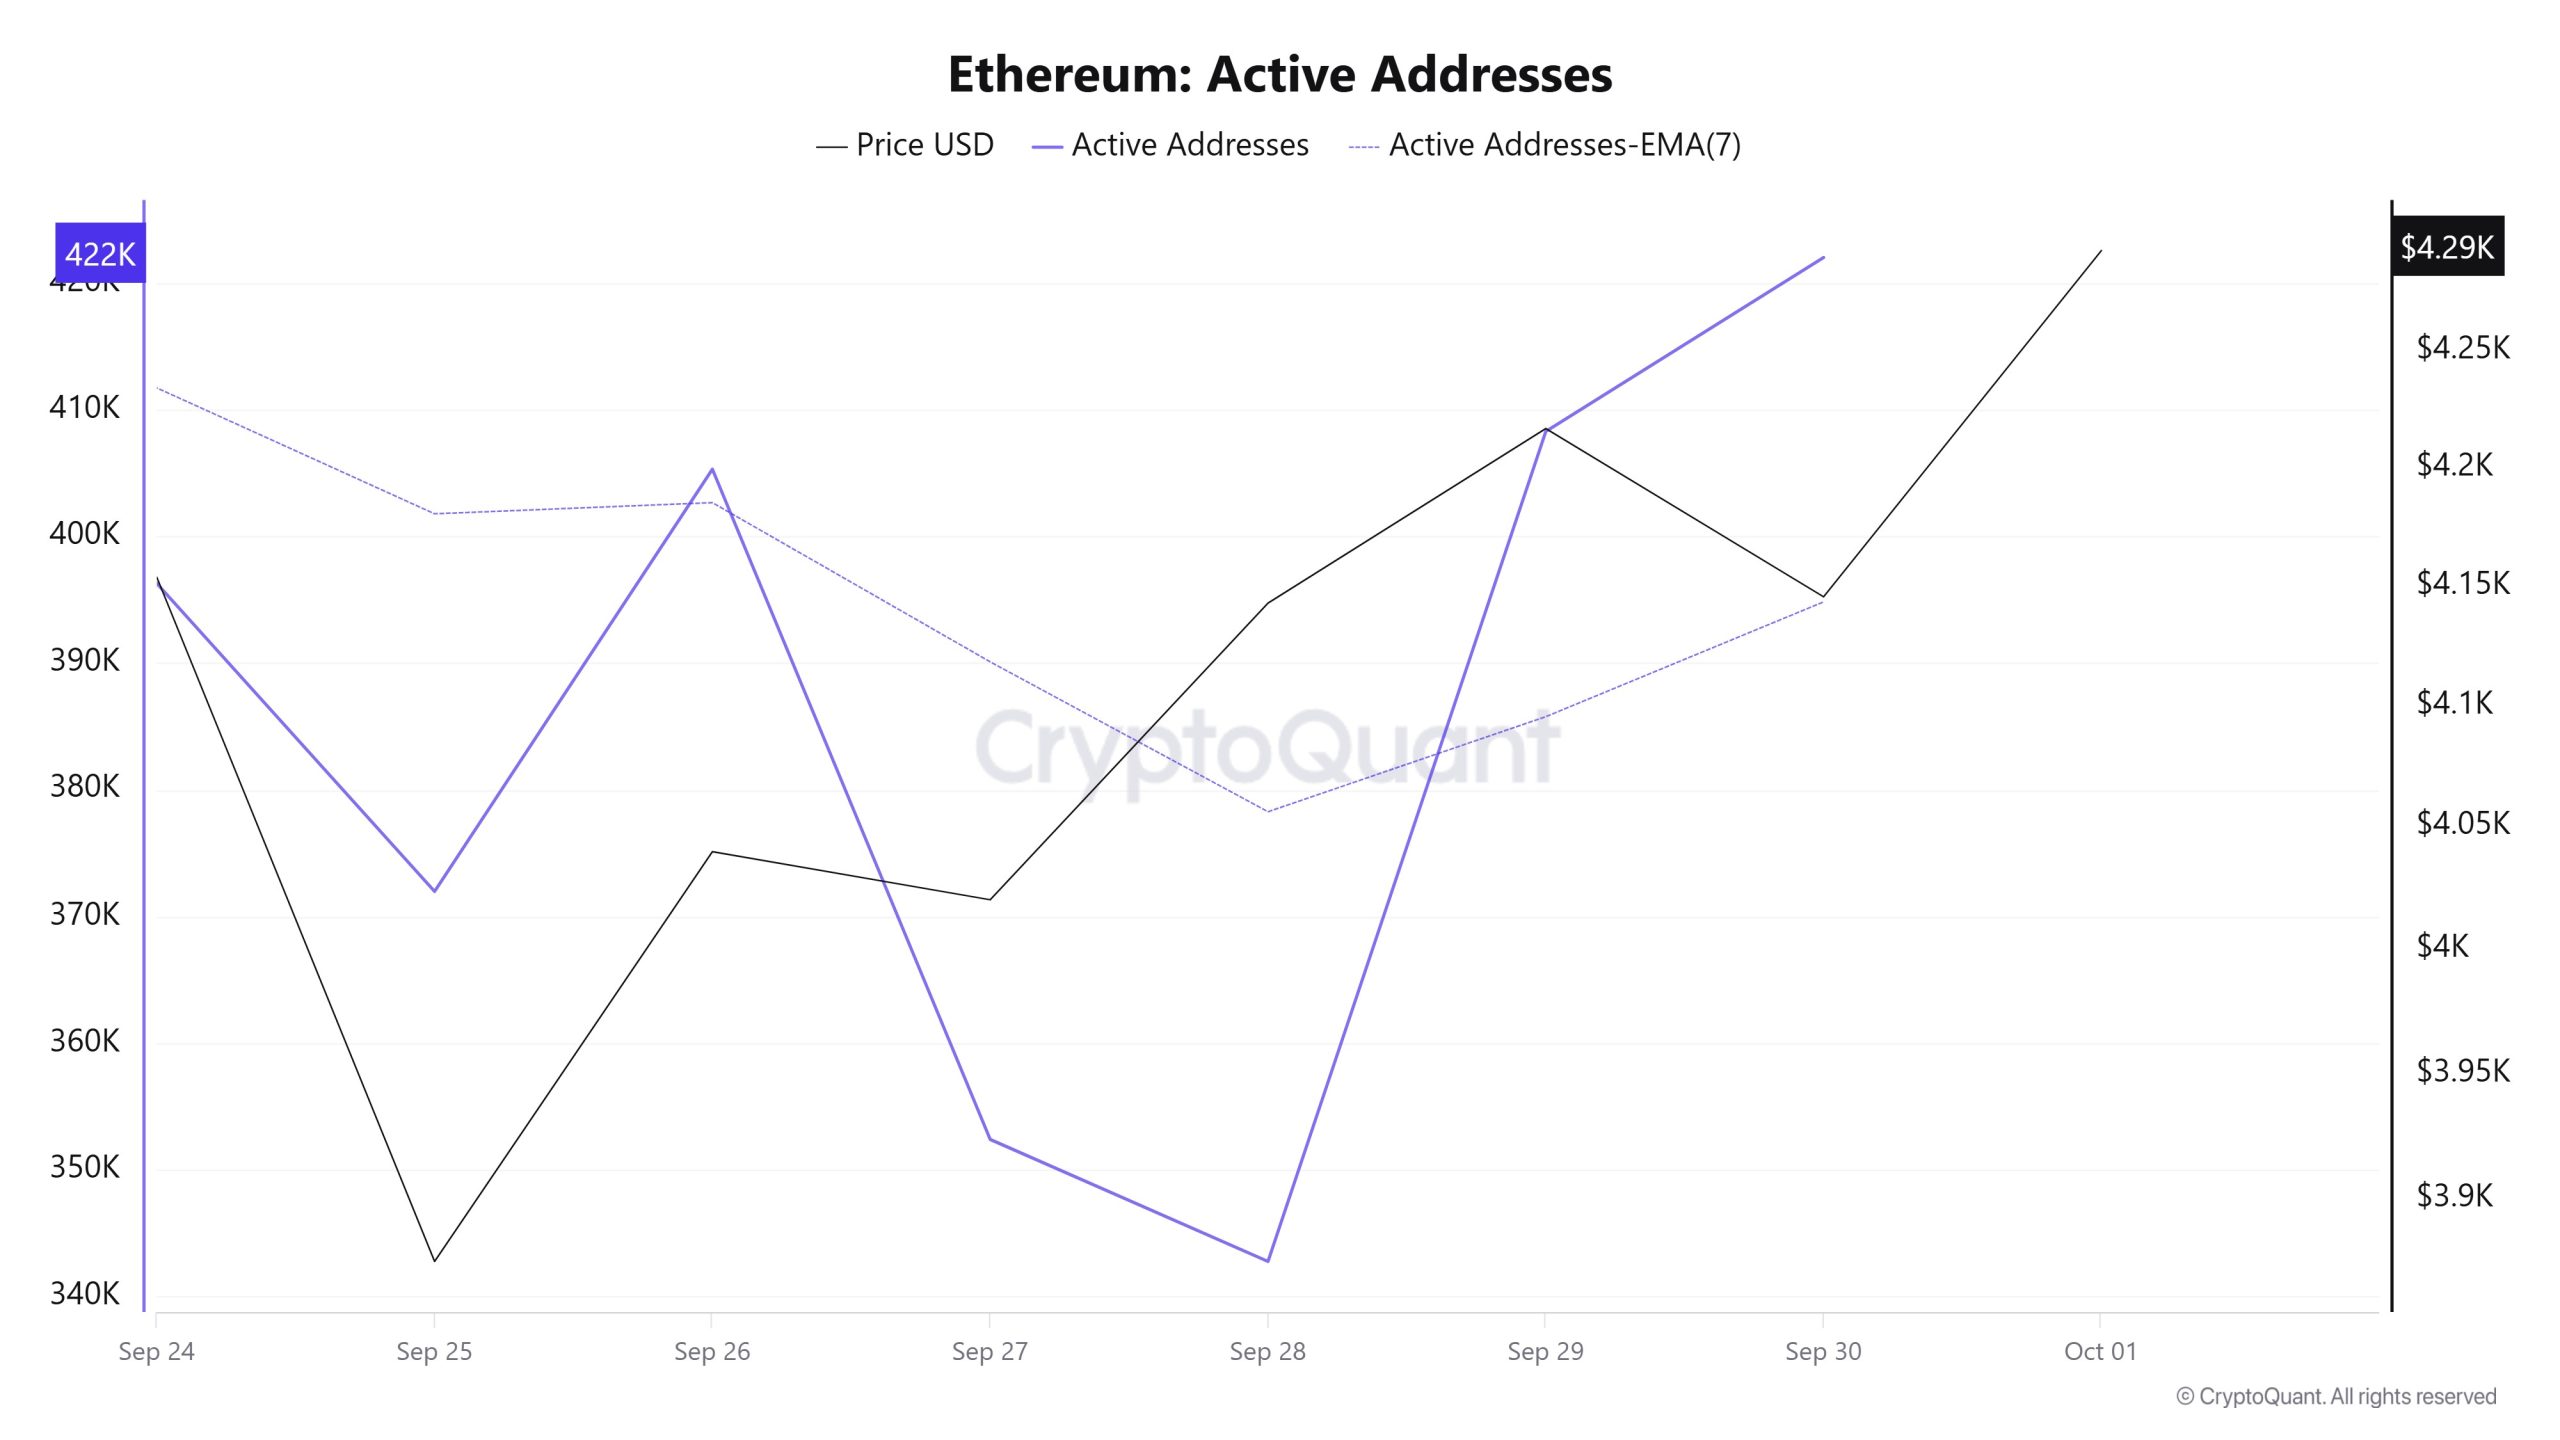
Between September 24 and October 1, a total of 422,014 active addresses entered the network. During this period, the Ethereum price rose from $3,875 to $4,300. Especially el September 28, at the point where the price touched the active address for the 2nd time, the price started to rise with the number of active addresses. When the 7-day simple moving average (SMA) is analyzed, it is seen that the Ethereum price is generally upward.
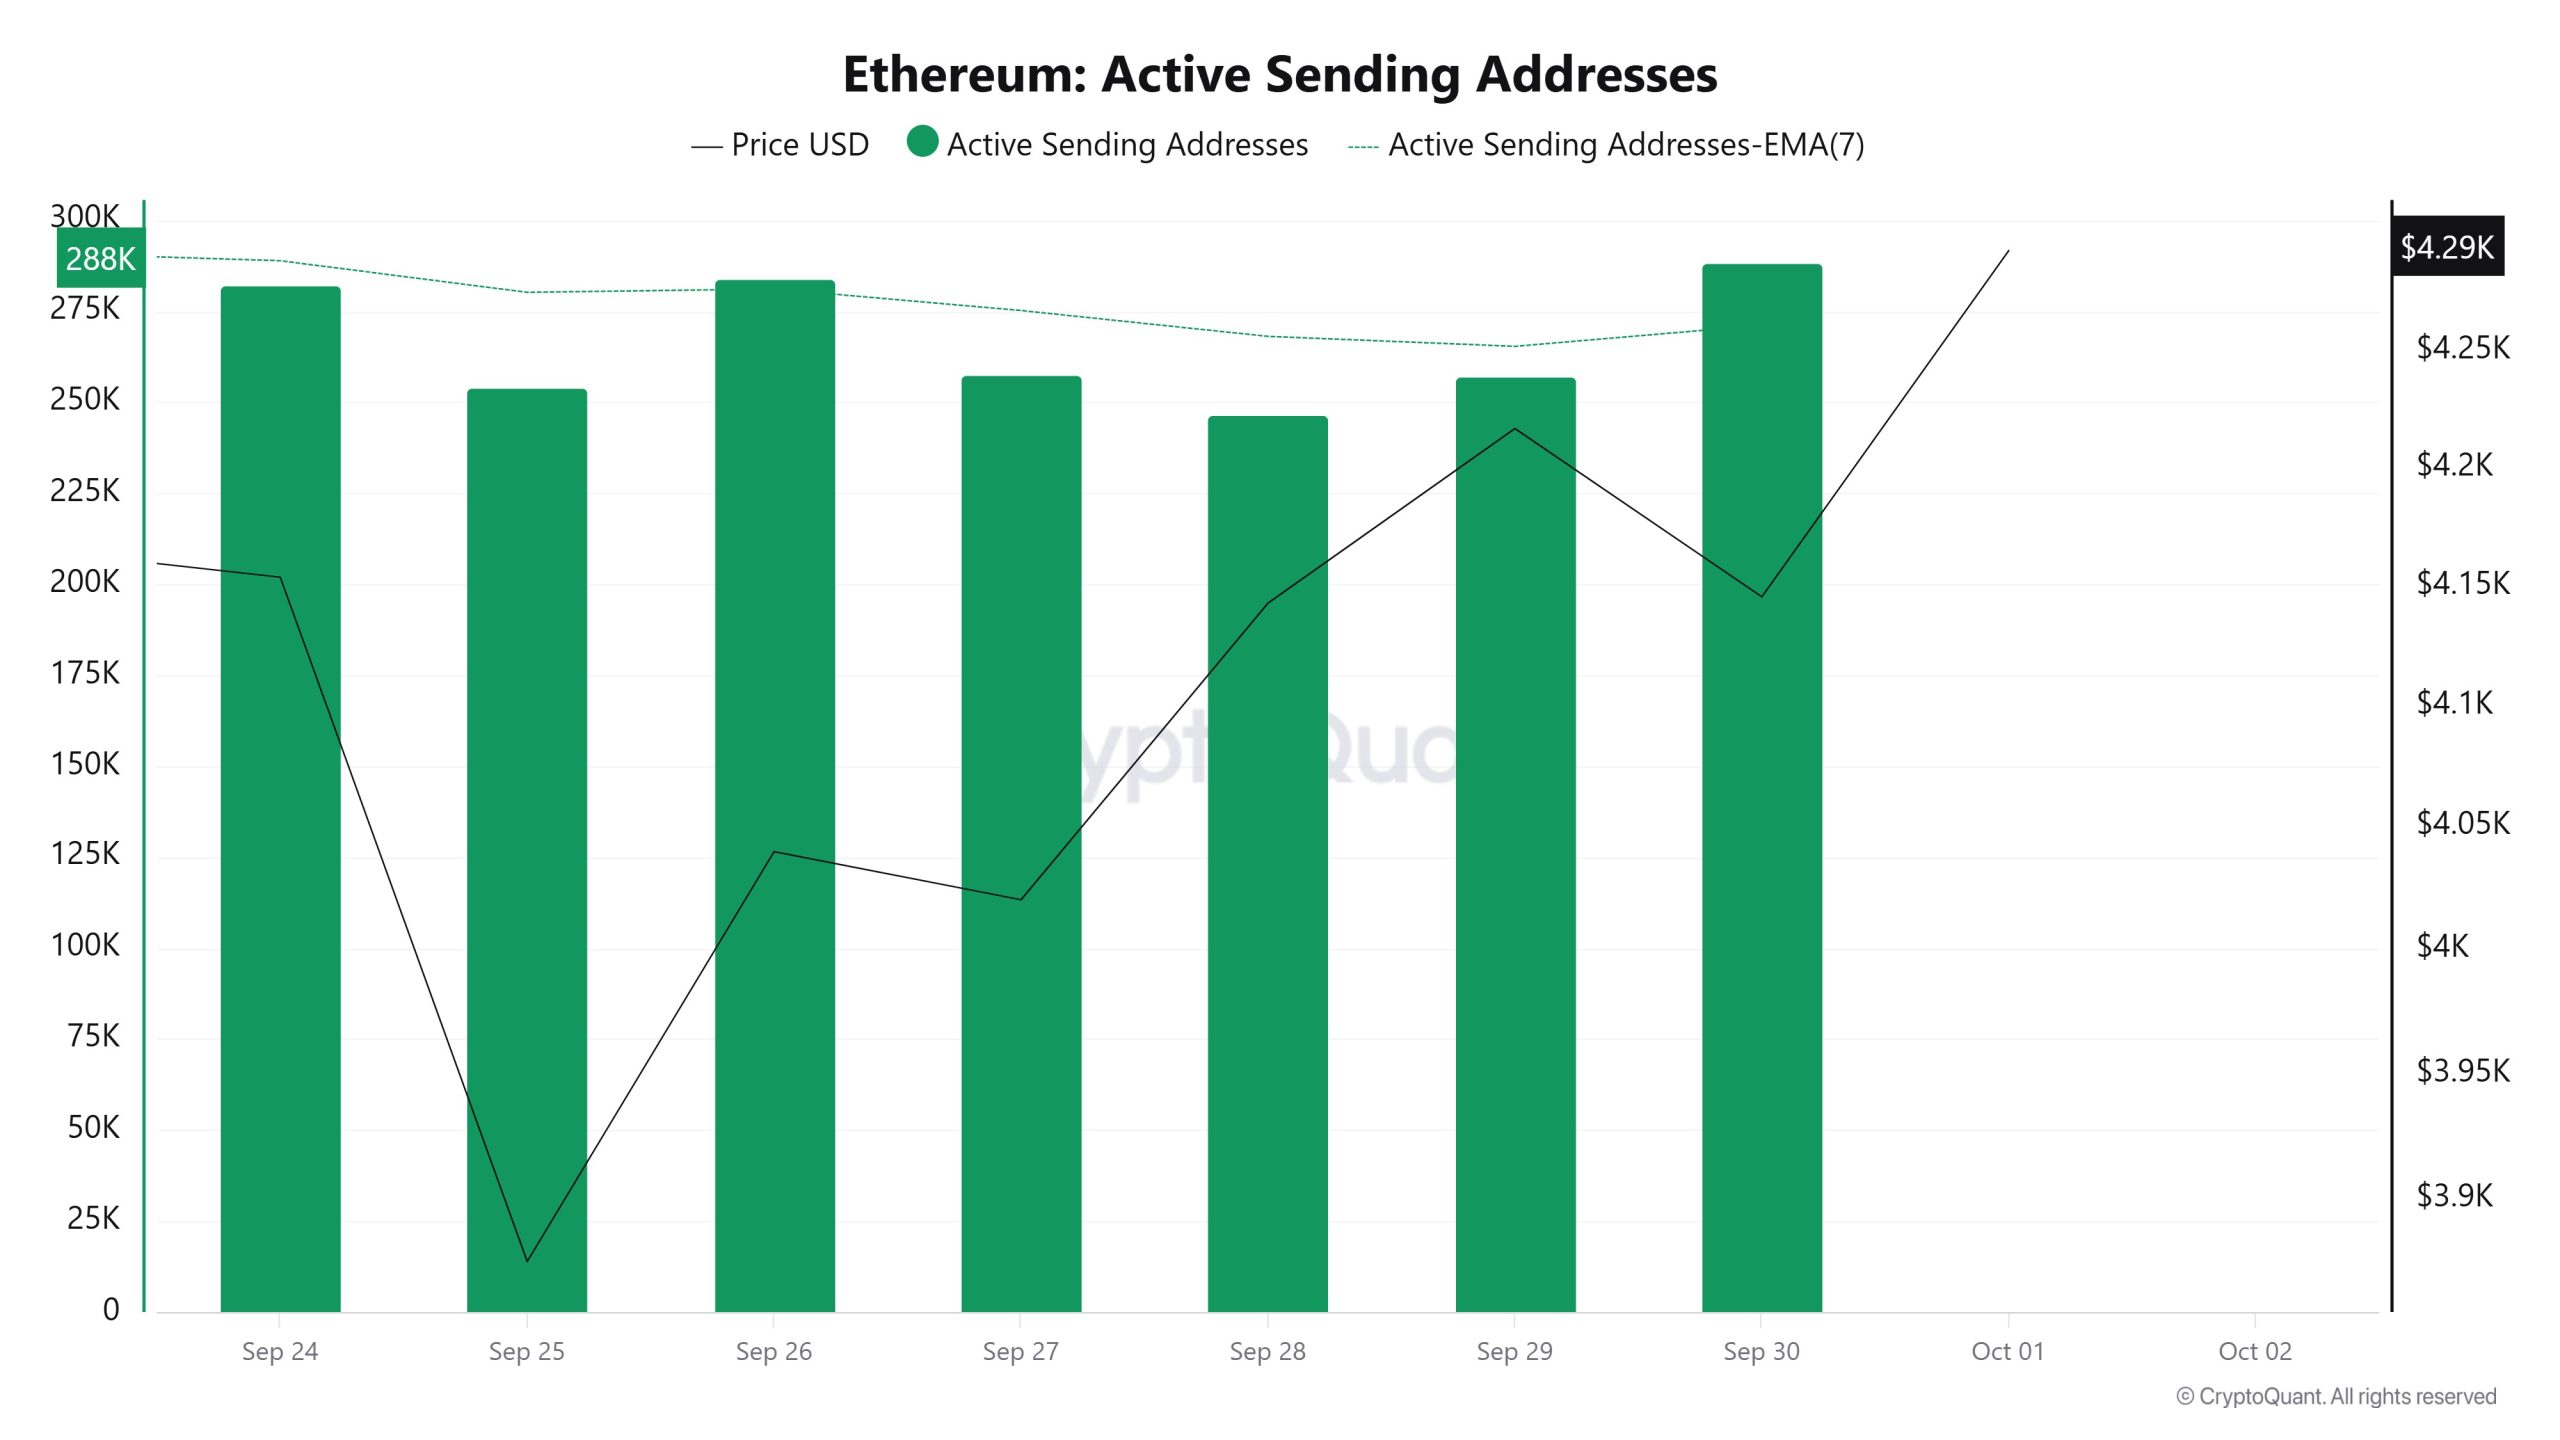
Active Sending Addresses
Between September 24 and October 1, a high level of active sending activity was observed along with the Black Line (price line) en active shipping addresses. On the day when the price reached a weekly high, active shipping addresses reached 288,471.
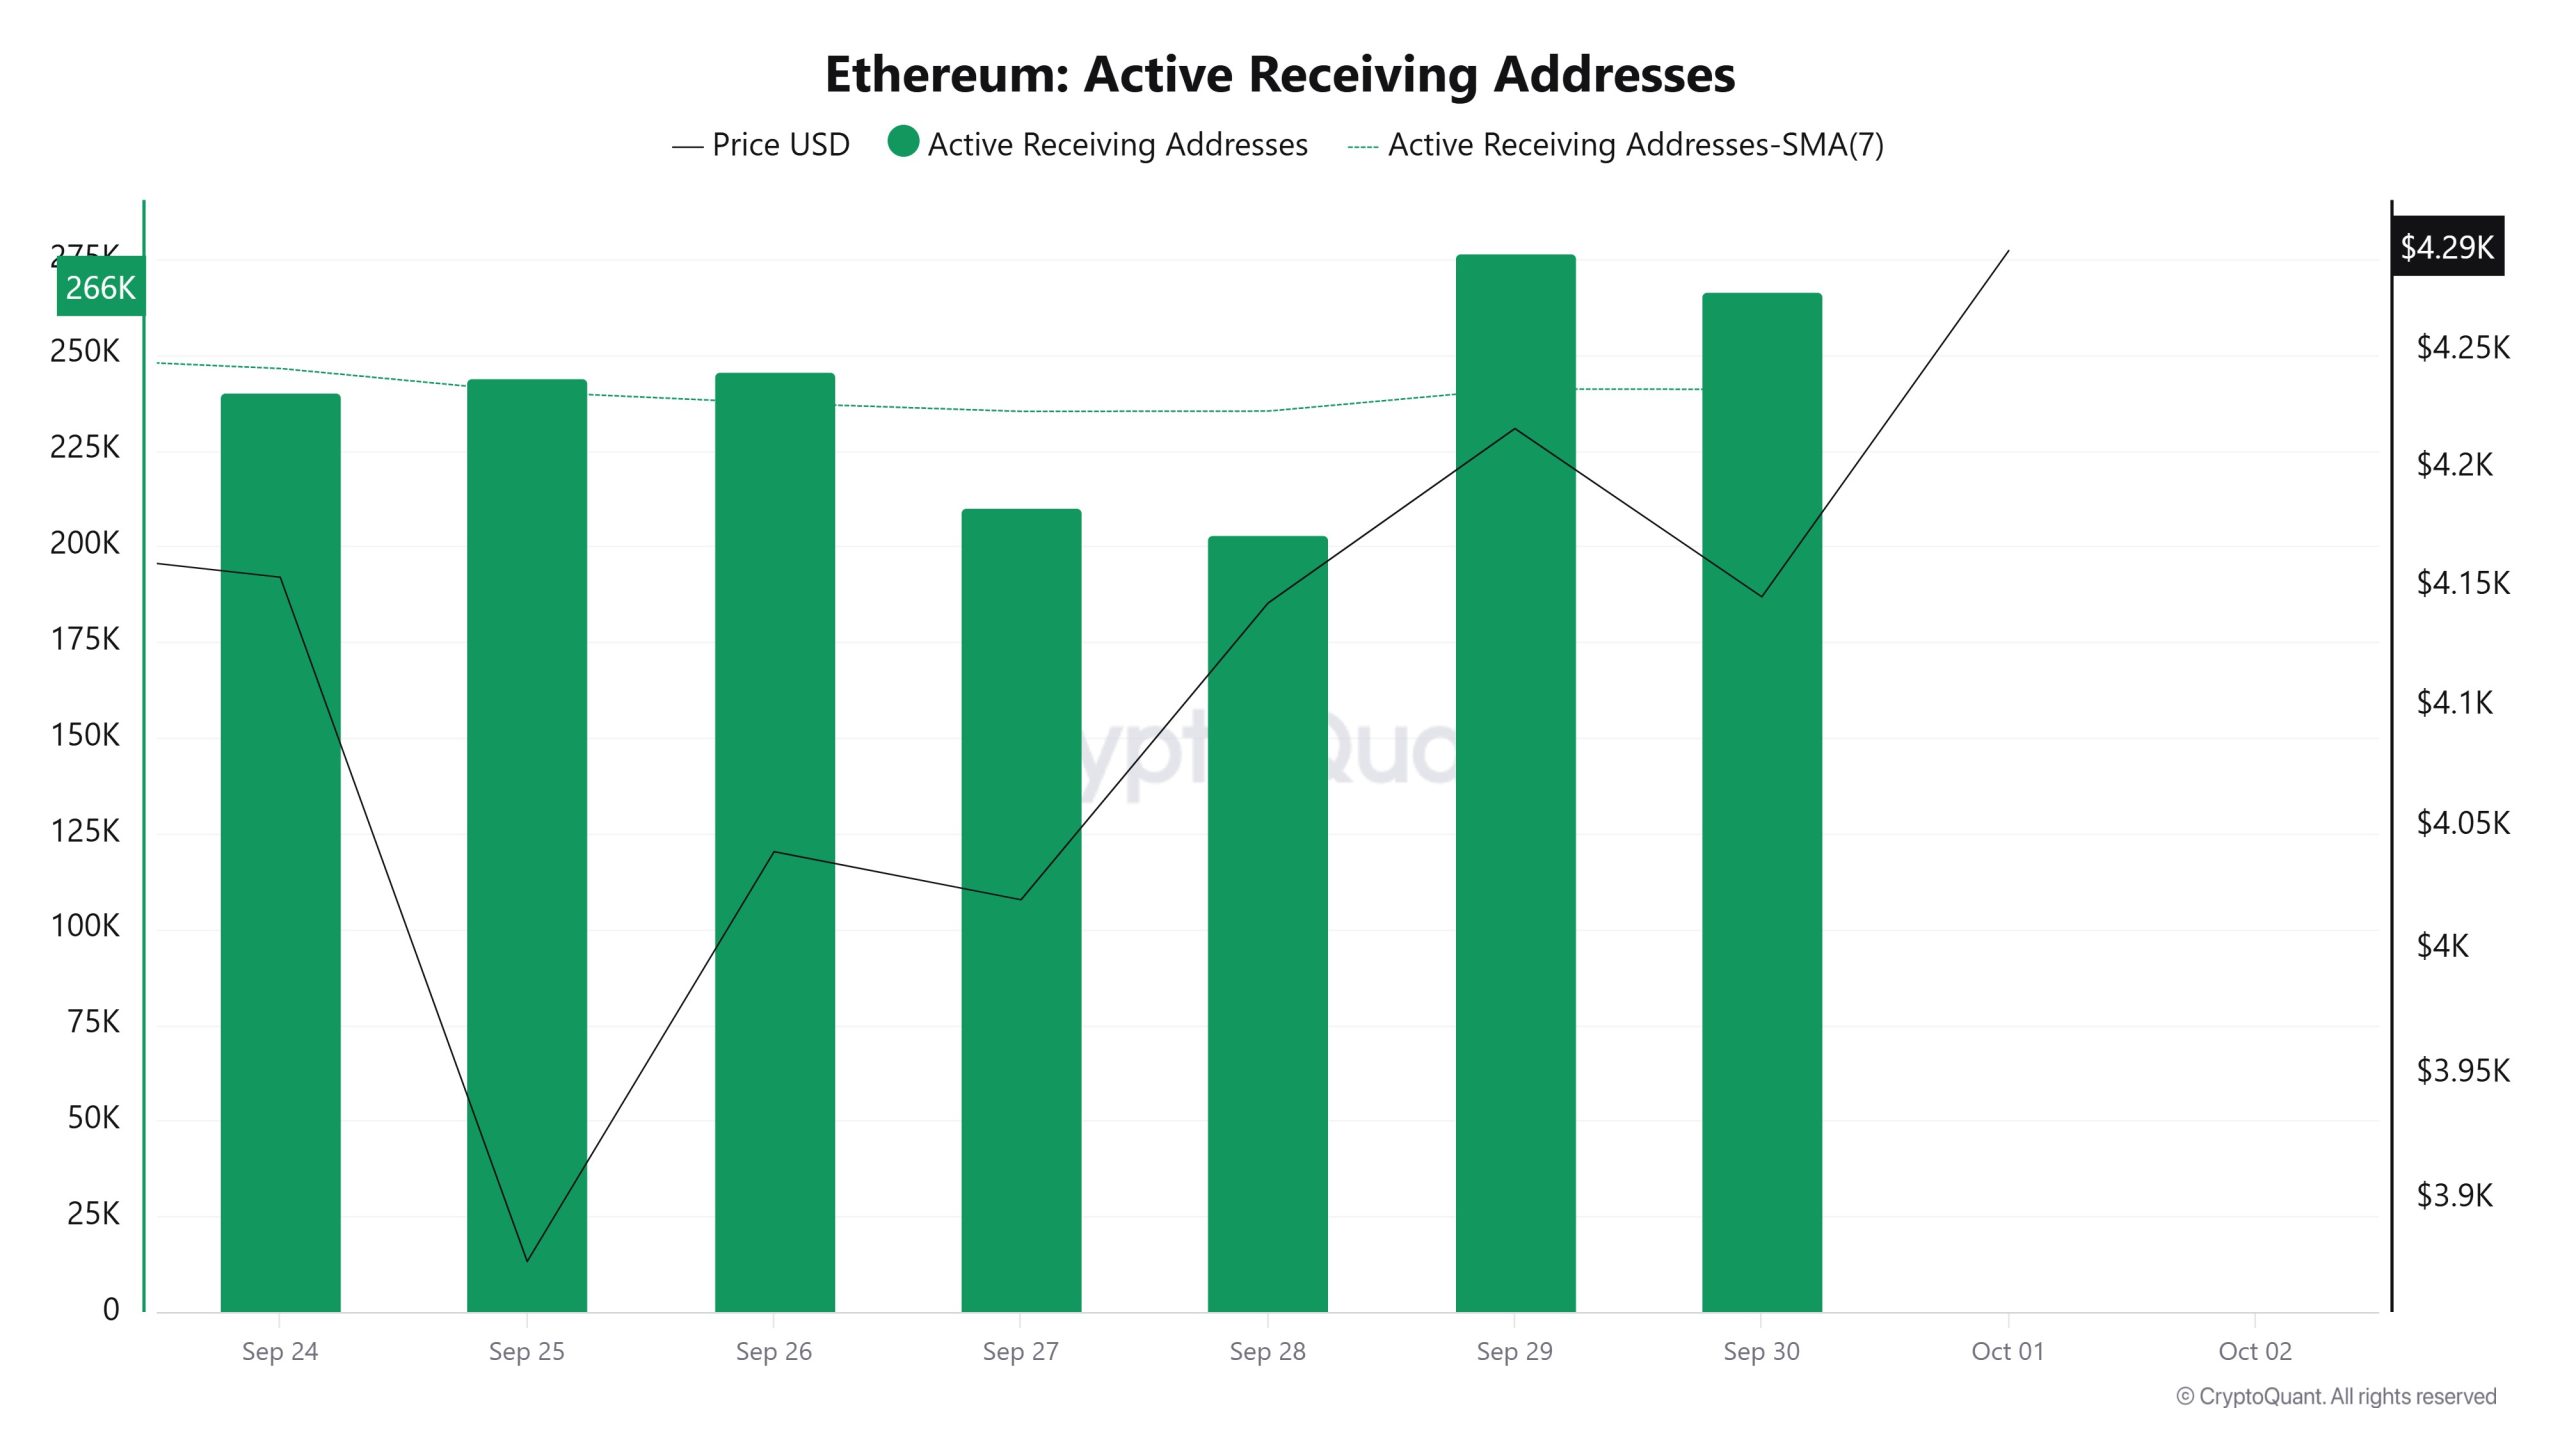
Active Receiving Addresses
Between September 24 and October 1, there was no significant increase en active buying addresses and the price consolidated horizontally. On the day when the price reached its highest level, active receiving addresses reached 276,627, indicating that purchases are increasing.
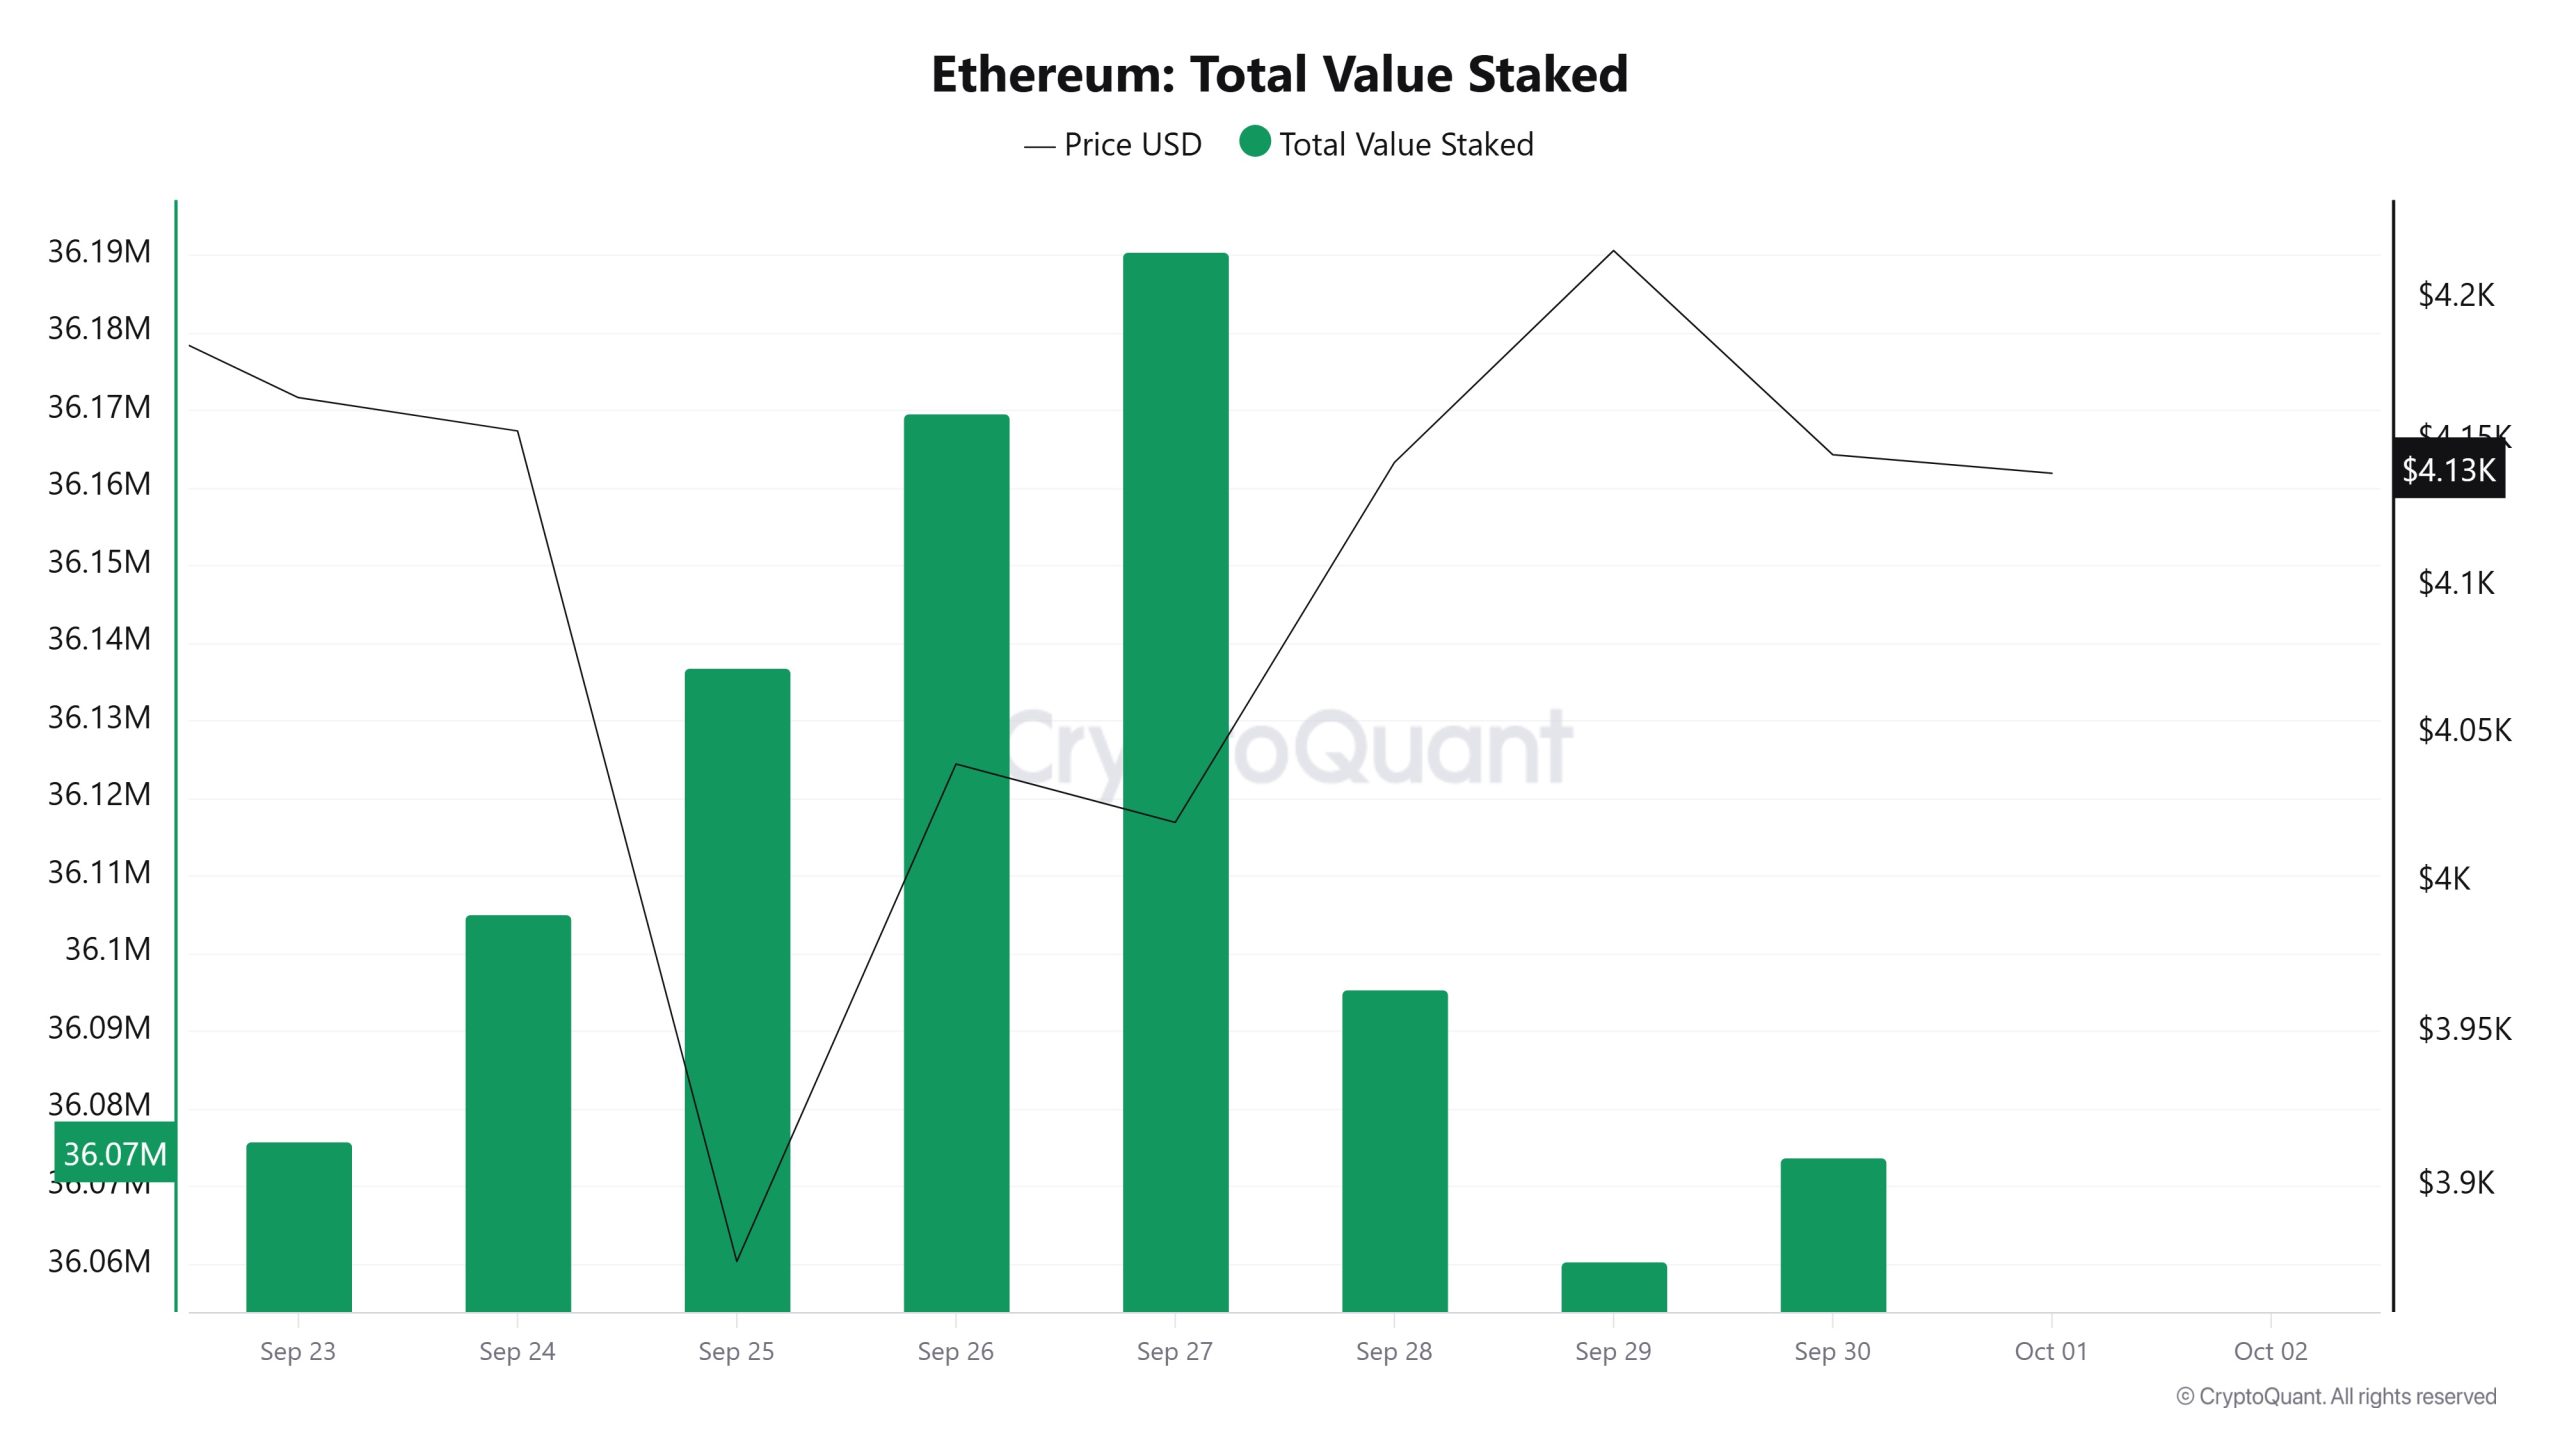
Total Value Staked
On September 24, ETH price was at $4.153 while Total Value Staked was at 36,105,042. As of September 30, ETH price fell to $4,145, down 0.19%, while Total Value Staked fell to 36,073,697, down 0.09%.
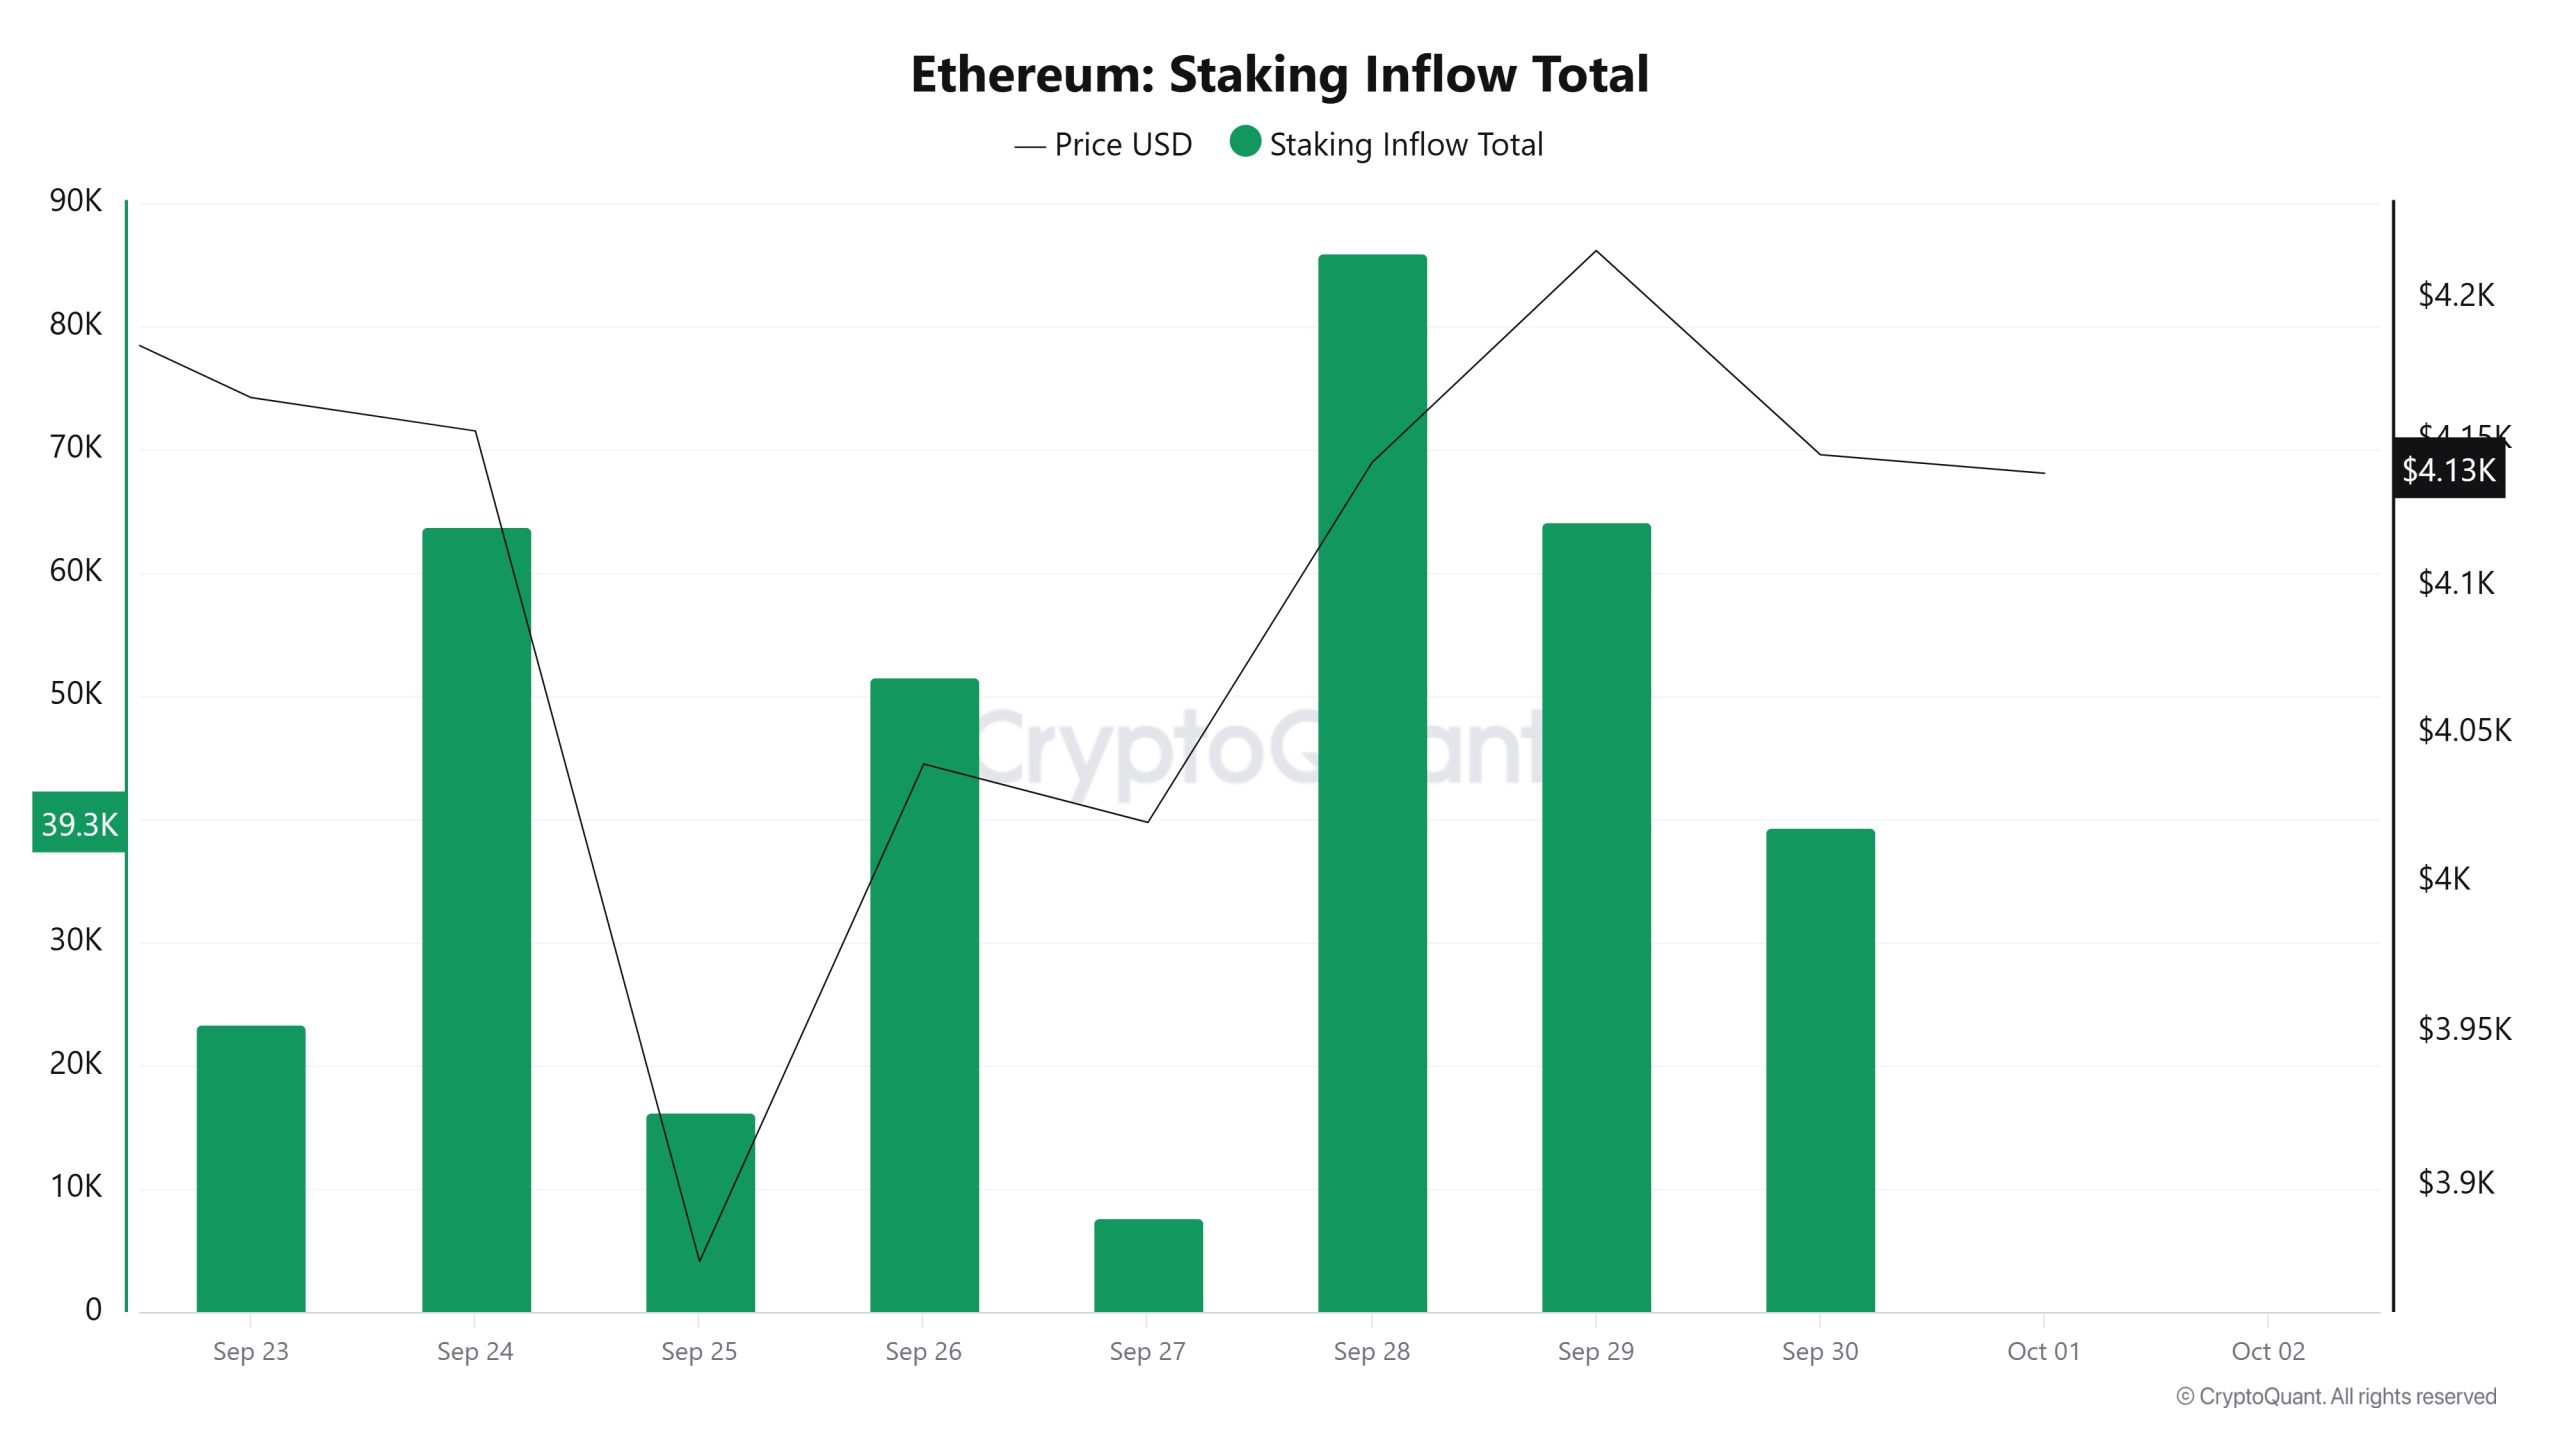
Staking Inflows
On September 24, ETH price was at $4,153 while Staking Inflow was 63,824. As of September 30, ETH price fell to $4,145 while Staking Inflow dropped to 39,346, a 38.35% decrease.
Derivatives
Open Interest
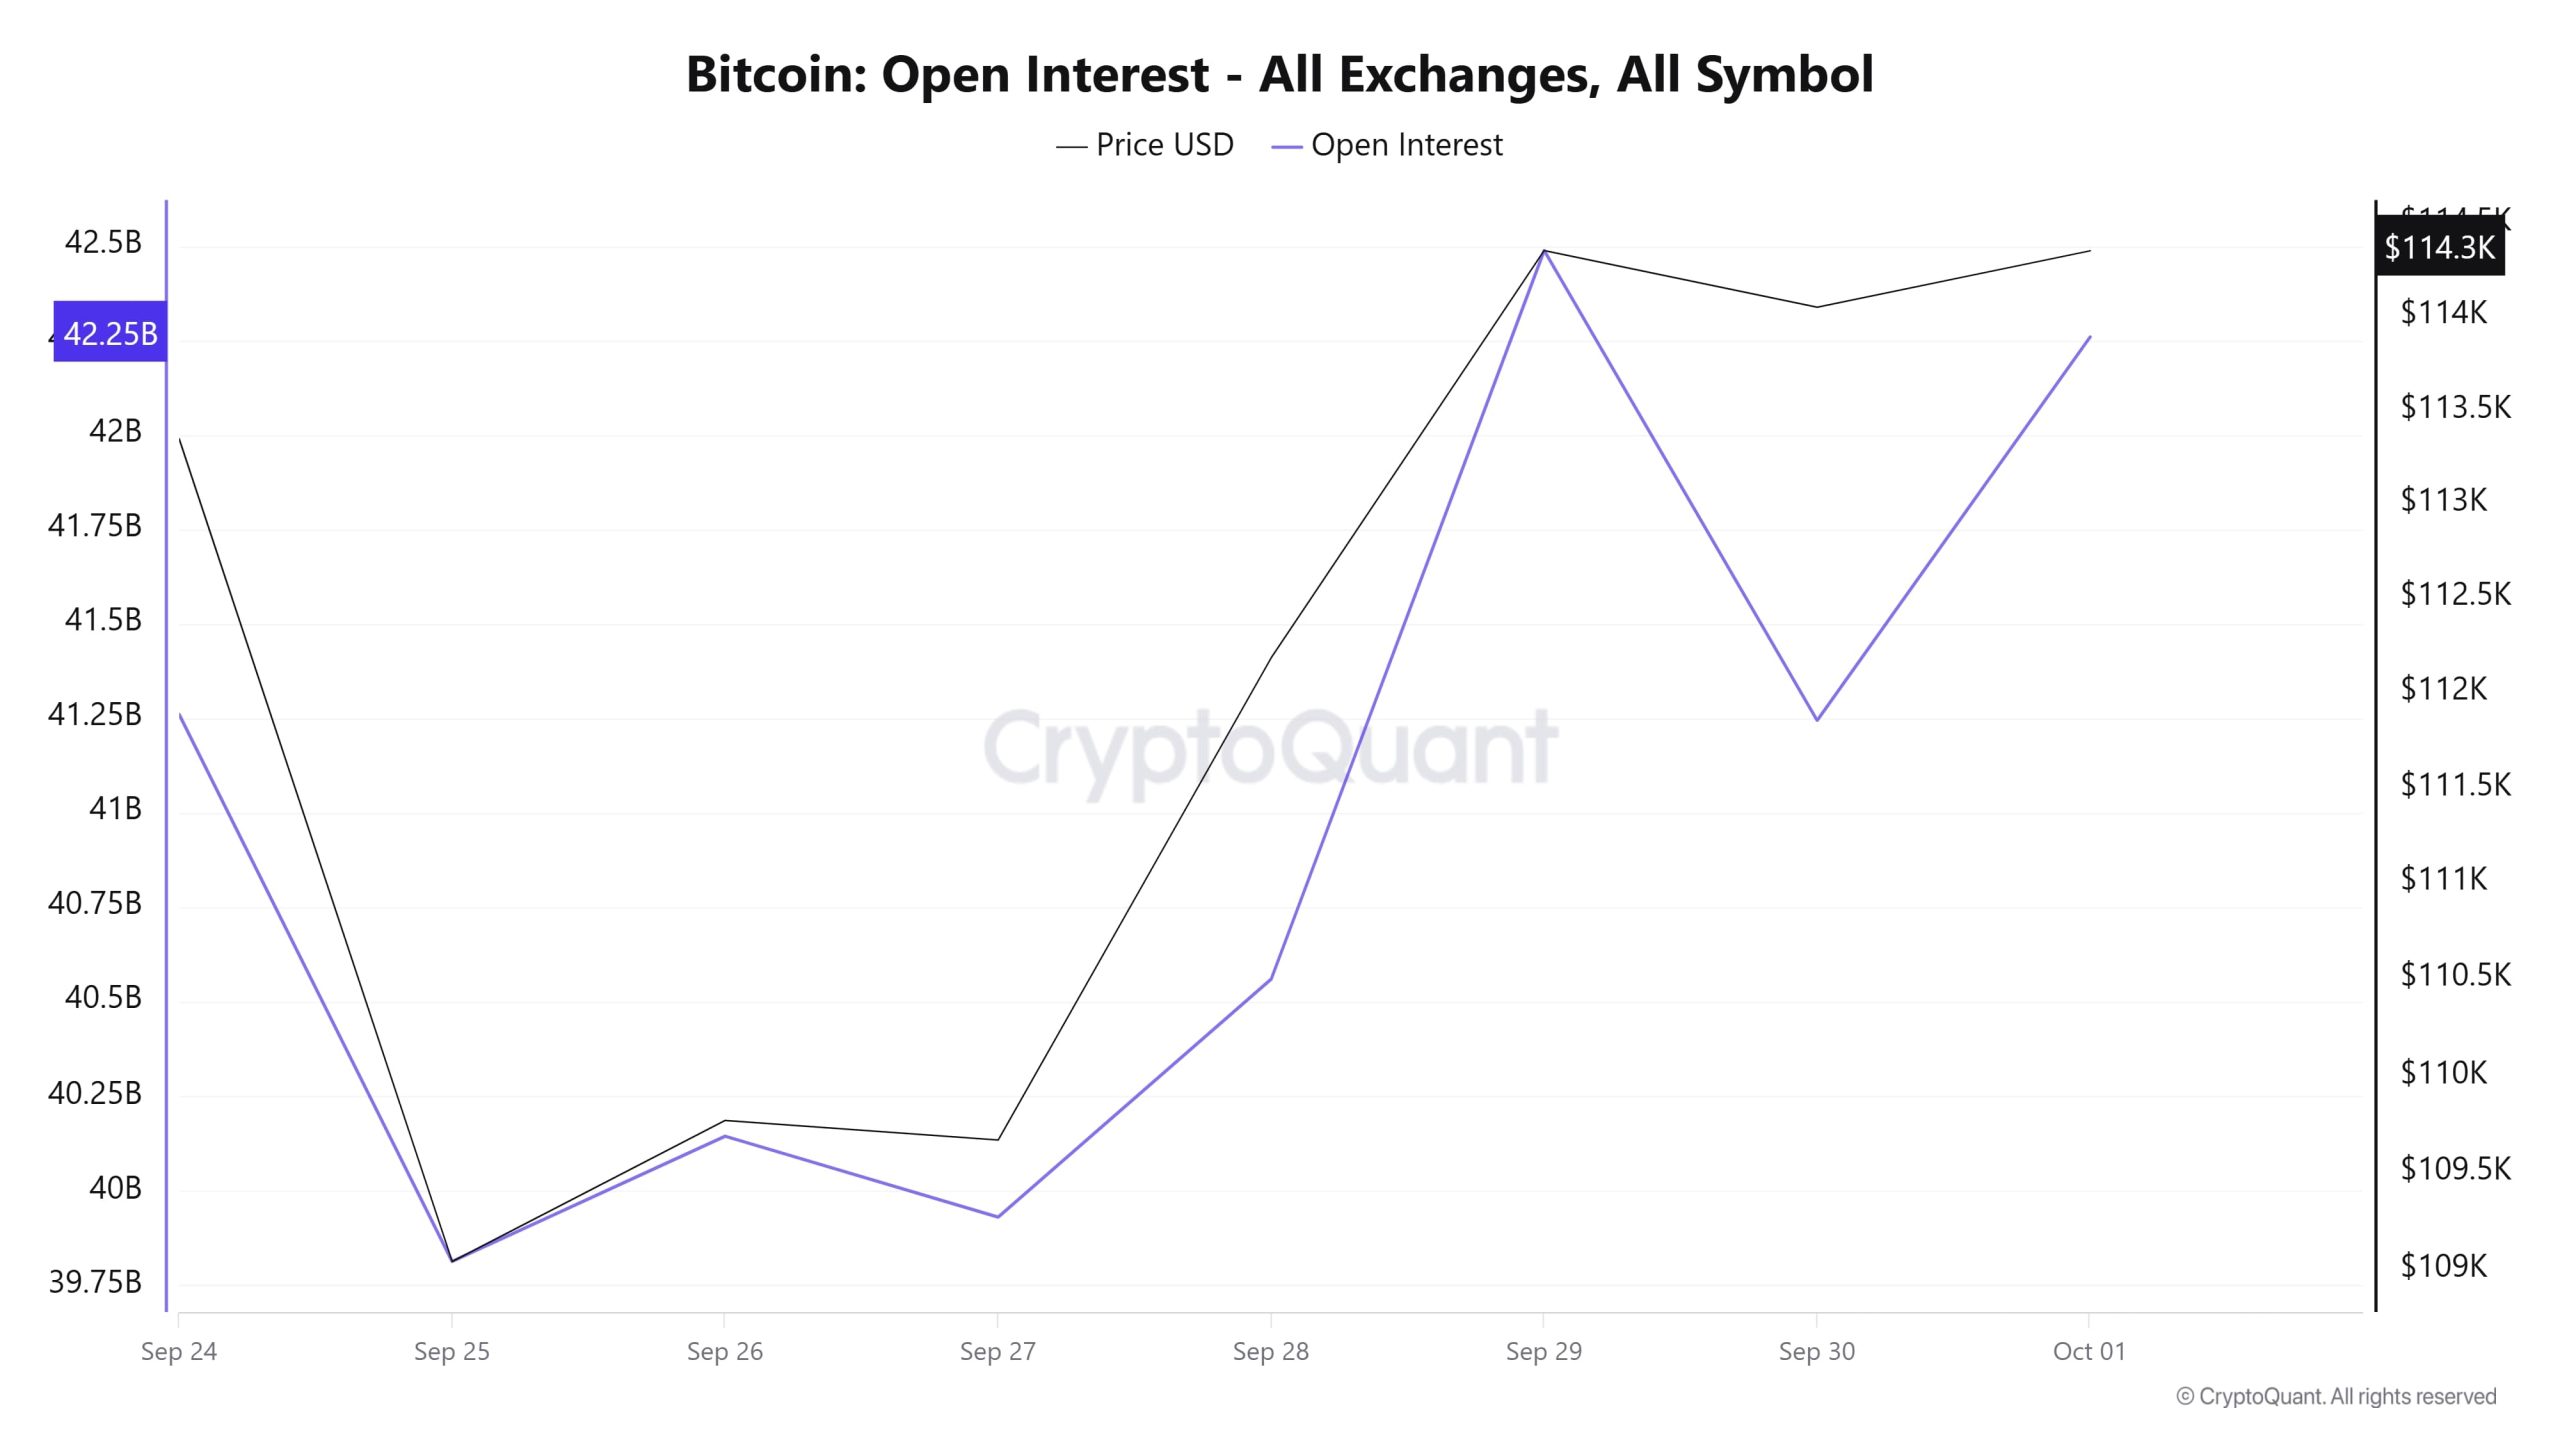
When Ethereum open interest data is analyzed, open positions, which started at high levels with the price el September 24, declined with a sharp decline el September 25. This movement suggests that market participants closed positions or liquidations were effective. Although a partial recovery is seen el September 26-27, the real momentum is seen el September 28-29, when both price and open interest rise strongly together, indicating a return of confidence en the market. From September 30, open interest declined sharply while the price remained relatively high, suggesting that the price remained strong despite some investors reducing their positions. On October 1, the price stabilized around $4,120, but open interest remains lower. The overall picture suggests that the rally was supported por open interest, but then the market turned more cautious.
Funding Rate
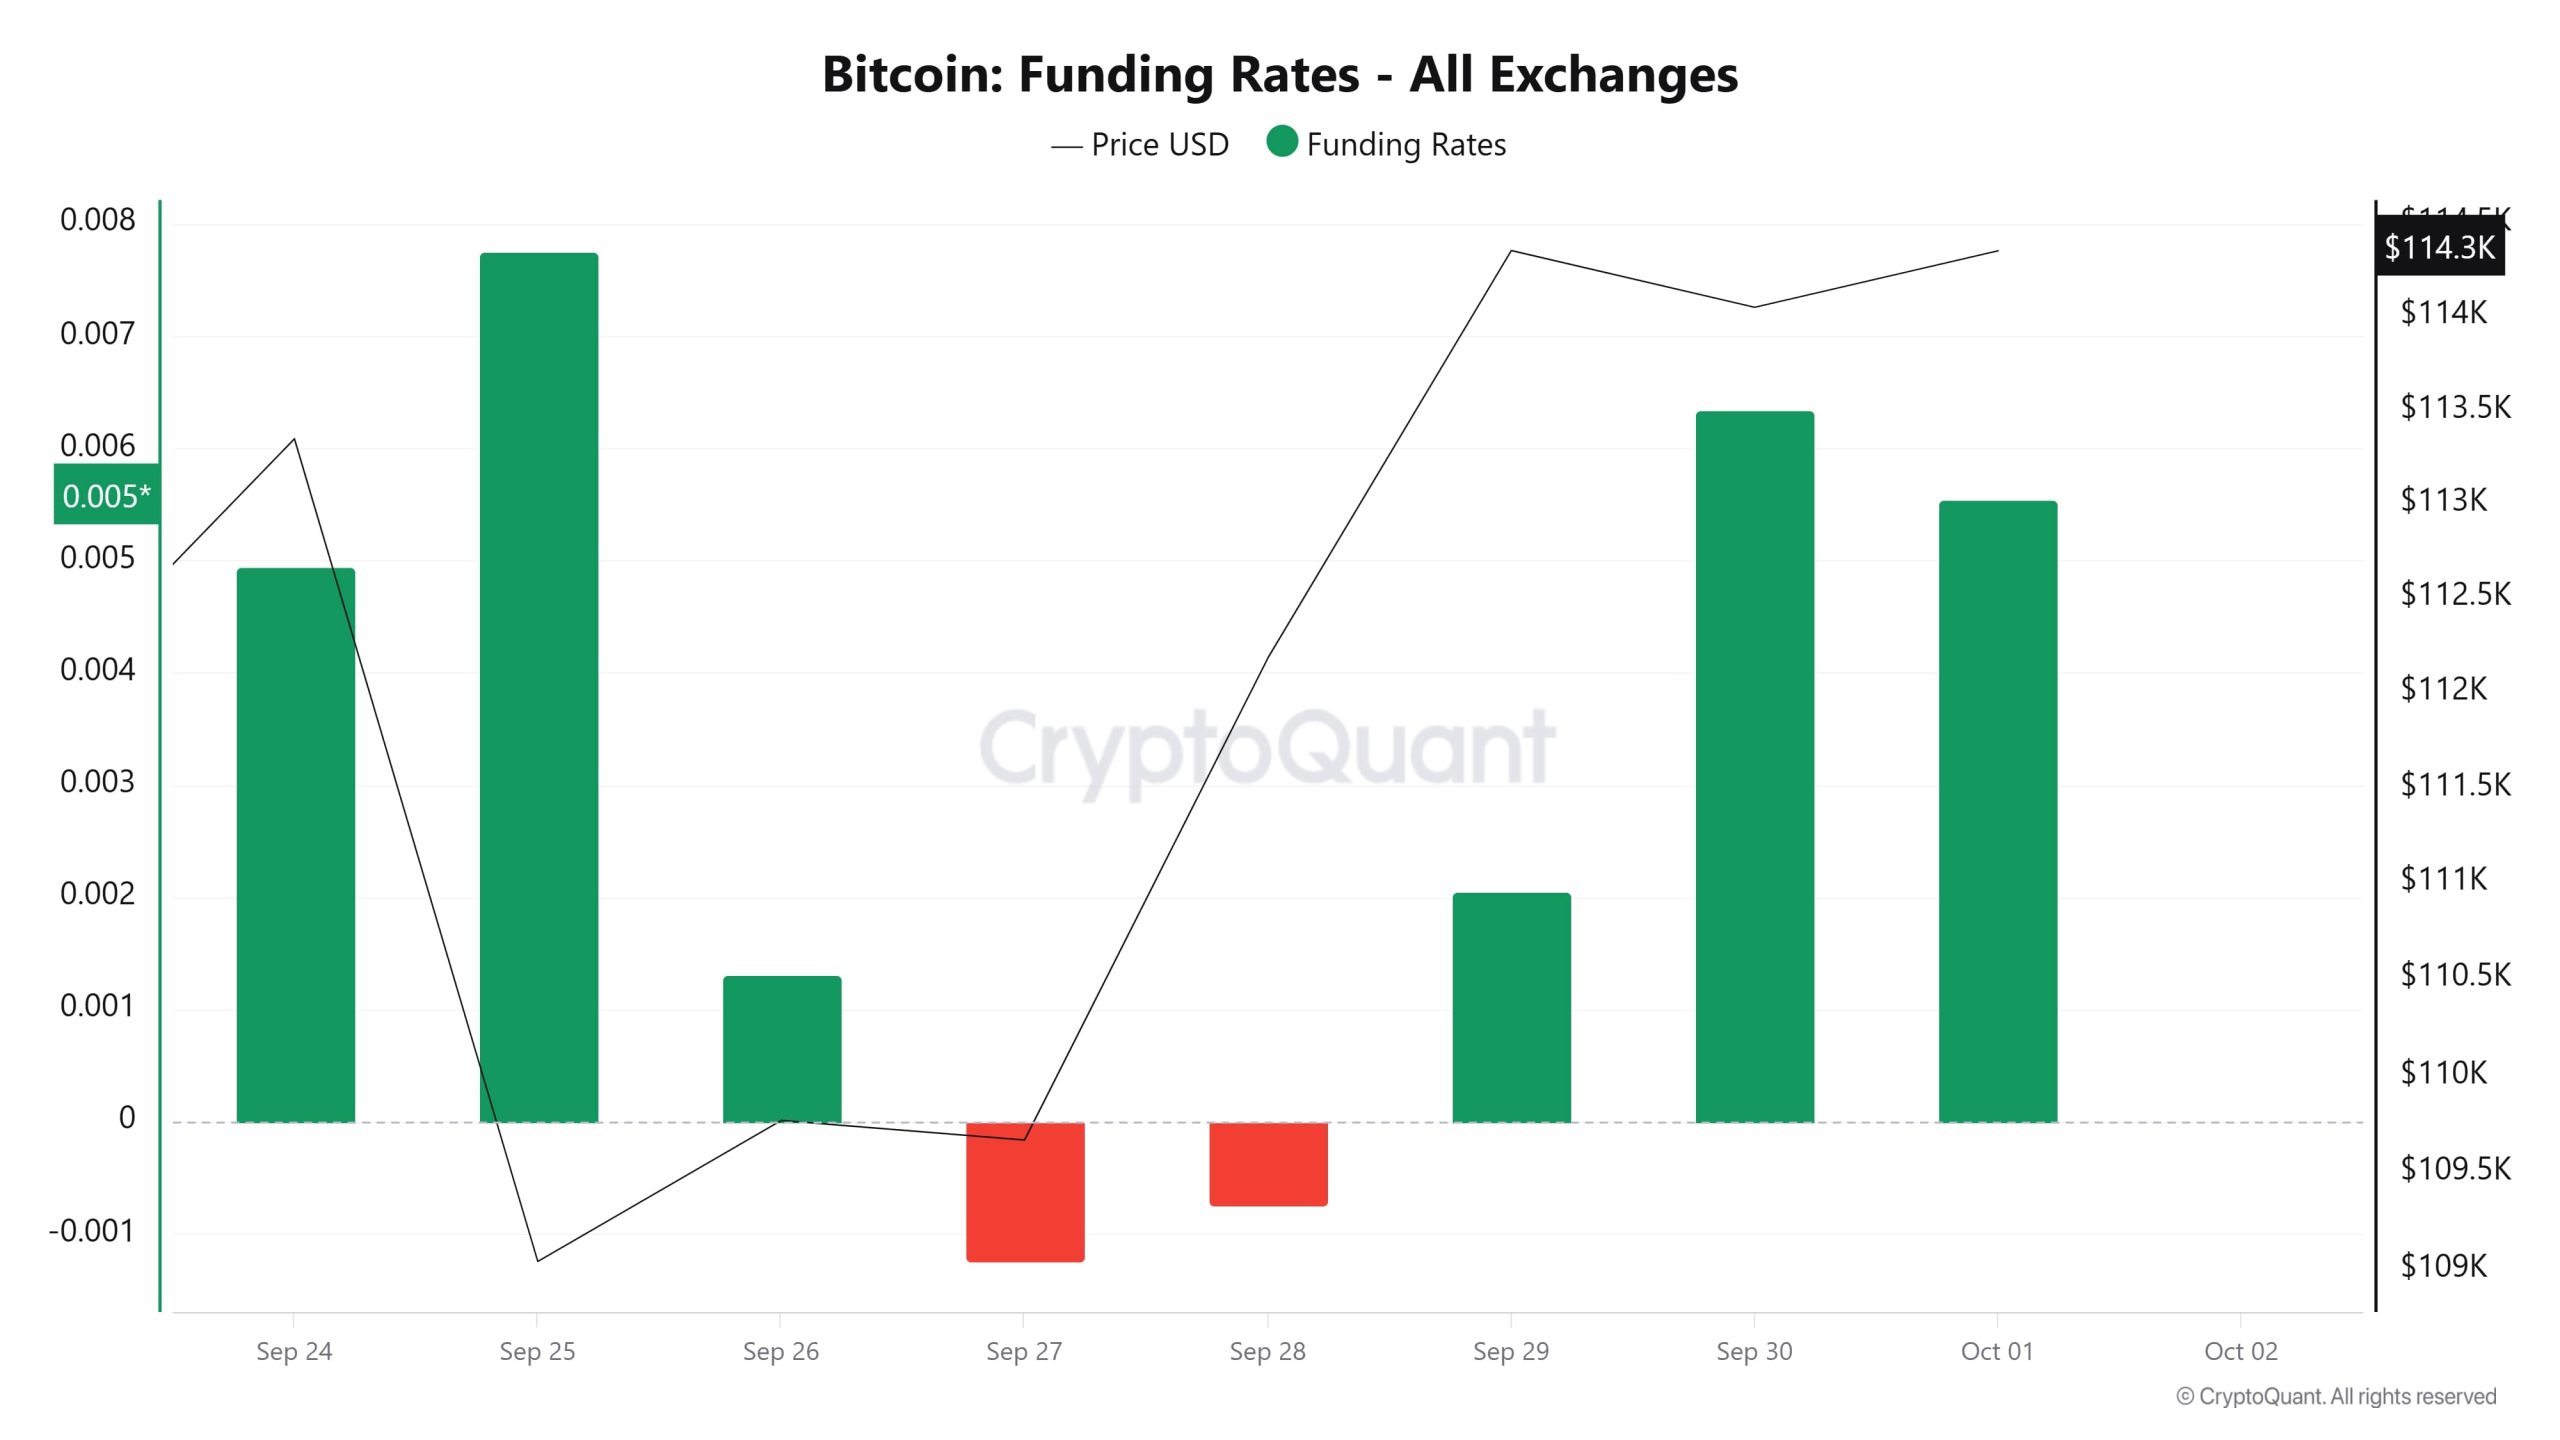
On September 25, the funding rate fell sharply and the price dipped below $4,000. Then el September 27-28, the price recovered to above $4,150 as the funding rate increased. Then, el September 30th, as the funding rate rose again, the price approached $4,200, but el October 1st, despite the funding rate peaking, the price remained at $4,120. This suggests that traders are getting aggressive with leveraged long positions, but the price is not going up at the same rate, meaning the market may be overheating en the short term.
Long & Short Liquidations
Approximately 514 million dollars of long positions were liquidated with the ETH price, which fell from $ 4,200 to below $ 3,825 and then rose again to the $ 4,300 region. Another $356 million worth of short positions were liquidated en the same timeframe.
| Date | Long Amount (Million $) | Short Amount (Million $) |
|---|---|---|
| September 24 | 38.93 | 20.11 |
| September 25 | 277.08 | 49.42 |
| September 26 | 59.11 | 76.32 |
| September 27 | 19.17 | 16.76 |
| September 28 | 9.42 | 58.41 |
| September 29 | 26.59 | 103.53 |
| September 30 | 84.53 | 31.93 |
| Total | 514.83 | 356.48 |
Supply Distribution
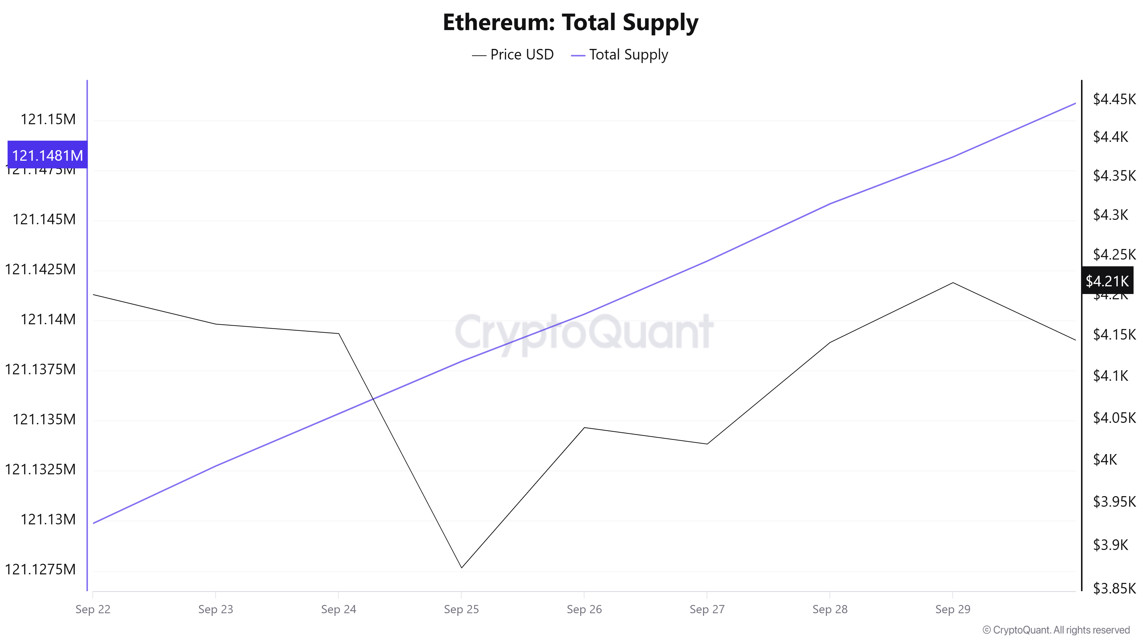
Total Supply: 121,148,176 units, an increase of approximately 0.031% compared to last week.
New Supply: The amount of ETH produced this week was 37,151.
Velocity: Velocity was 9.70 as of September 29, up from 9.61 last week.
| Wallet Categoría | 22.09.2025 | 29.09.2025 | Change (%) |
|---|---|---|---|
| 100 – 1k ETH | 8.5036M | 8.5116M | +0.0941% |
| 1k – 10k ETH | 13.1203M | 13.2387M | +0.9024% |
| 10k – 100k ETH | 21.0765M | 21.2415M | +0.7829% |
| 100k+ ETH | 4.9009M | 3.9777M | -18.8374% |
According to the latest weekly data, Ethereum wallet distribution presented a bullish outlook. The 100-1k ETH range rose 0.10%, the 1k-10k ETH segment rose 0.90% and the 10k-100k ETH group rose 0.78%. In contrast, the 100k+ ETH category declined por 18.84%.
Exchange Supply Ratio
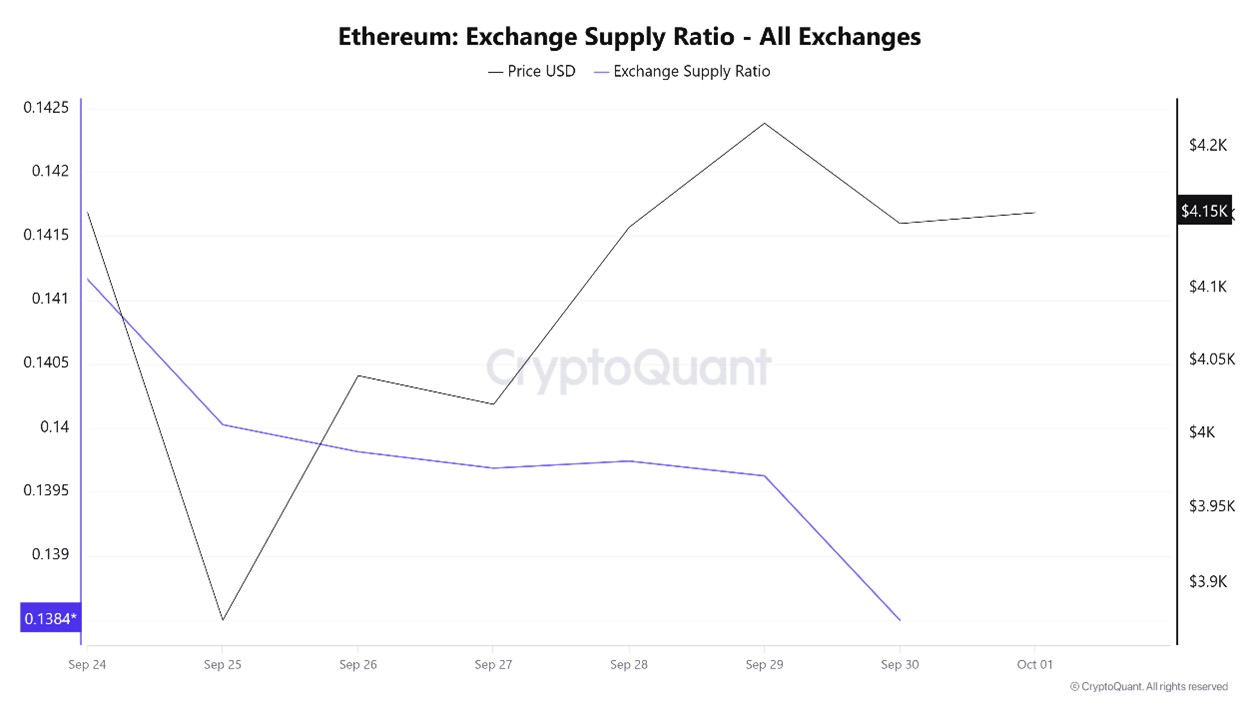
Between September 24 and October 1 , cryptoassets were dominated por the speeches of Fed Vice Chairman Jefferson (2025 voter, hawkish), who gave the stance that he was not taking a clear stance el a rate cut en October. He said he expects unemployment to rise slightly this year and fall en 2026. The probability of a rate cut en October rose to 97%. Ethereum Exchange Supply Ratio decreased from 0.14116553 to 0.13849644. During this period, the Ethereum price rose from $3,875 to $4,145. Especially this week, the price and the Exchange Supply Ratio have been negatively correlated, indicating that despite the price increase, the amount of Ethereum supplied to exchanges has decreased, possibly indicating that long-term investors have stopped holding their assets. In general, a bearish expectation seems to prevail en the Ethereum price.
Exchange Reserve
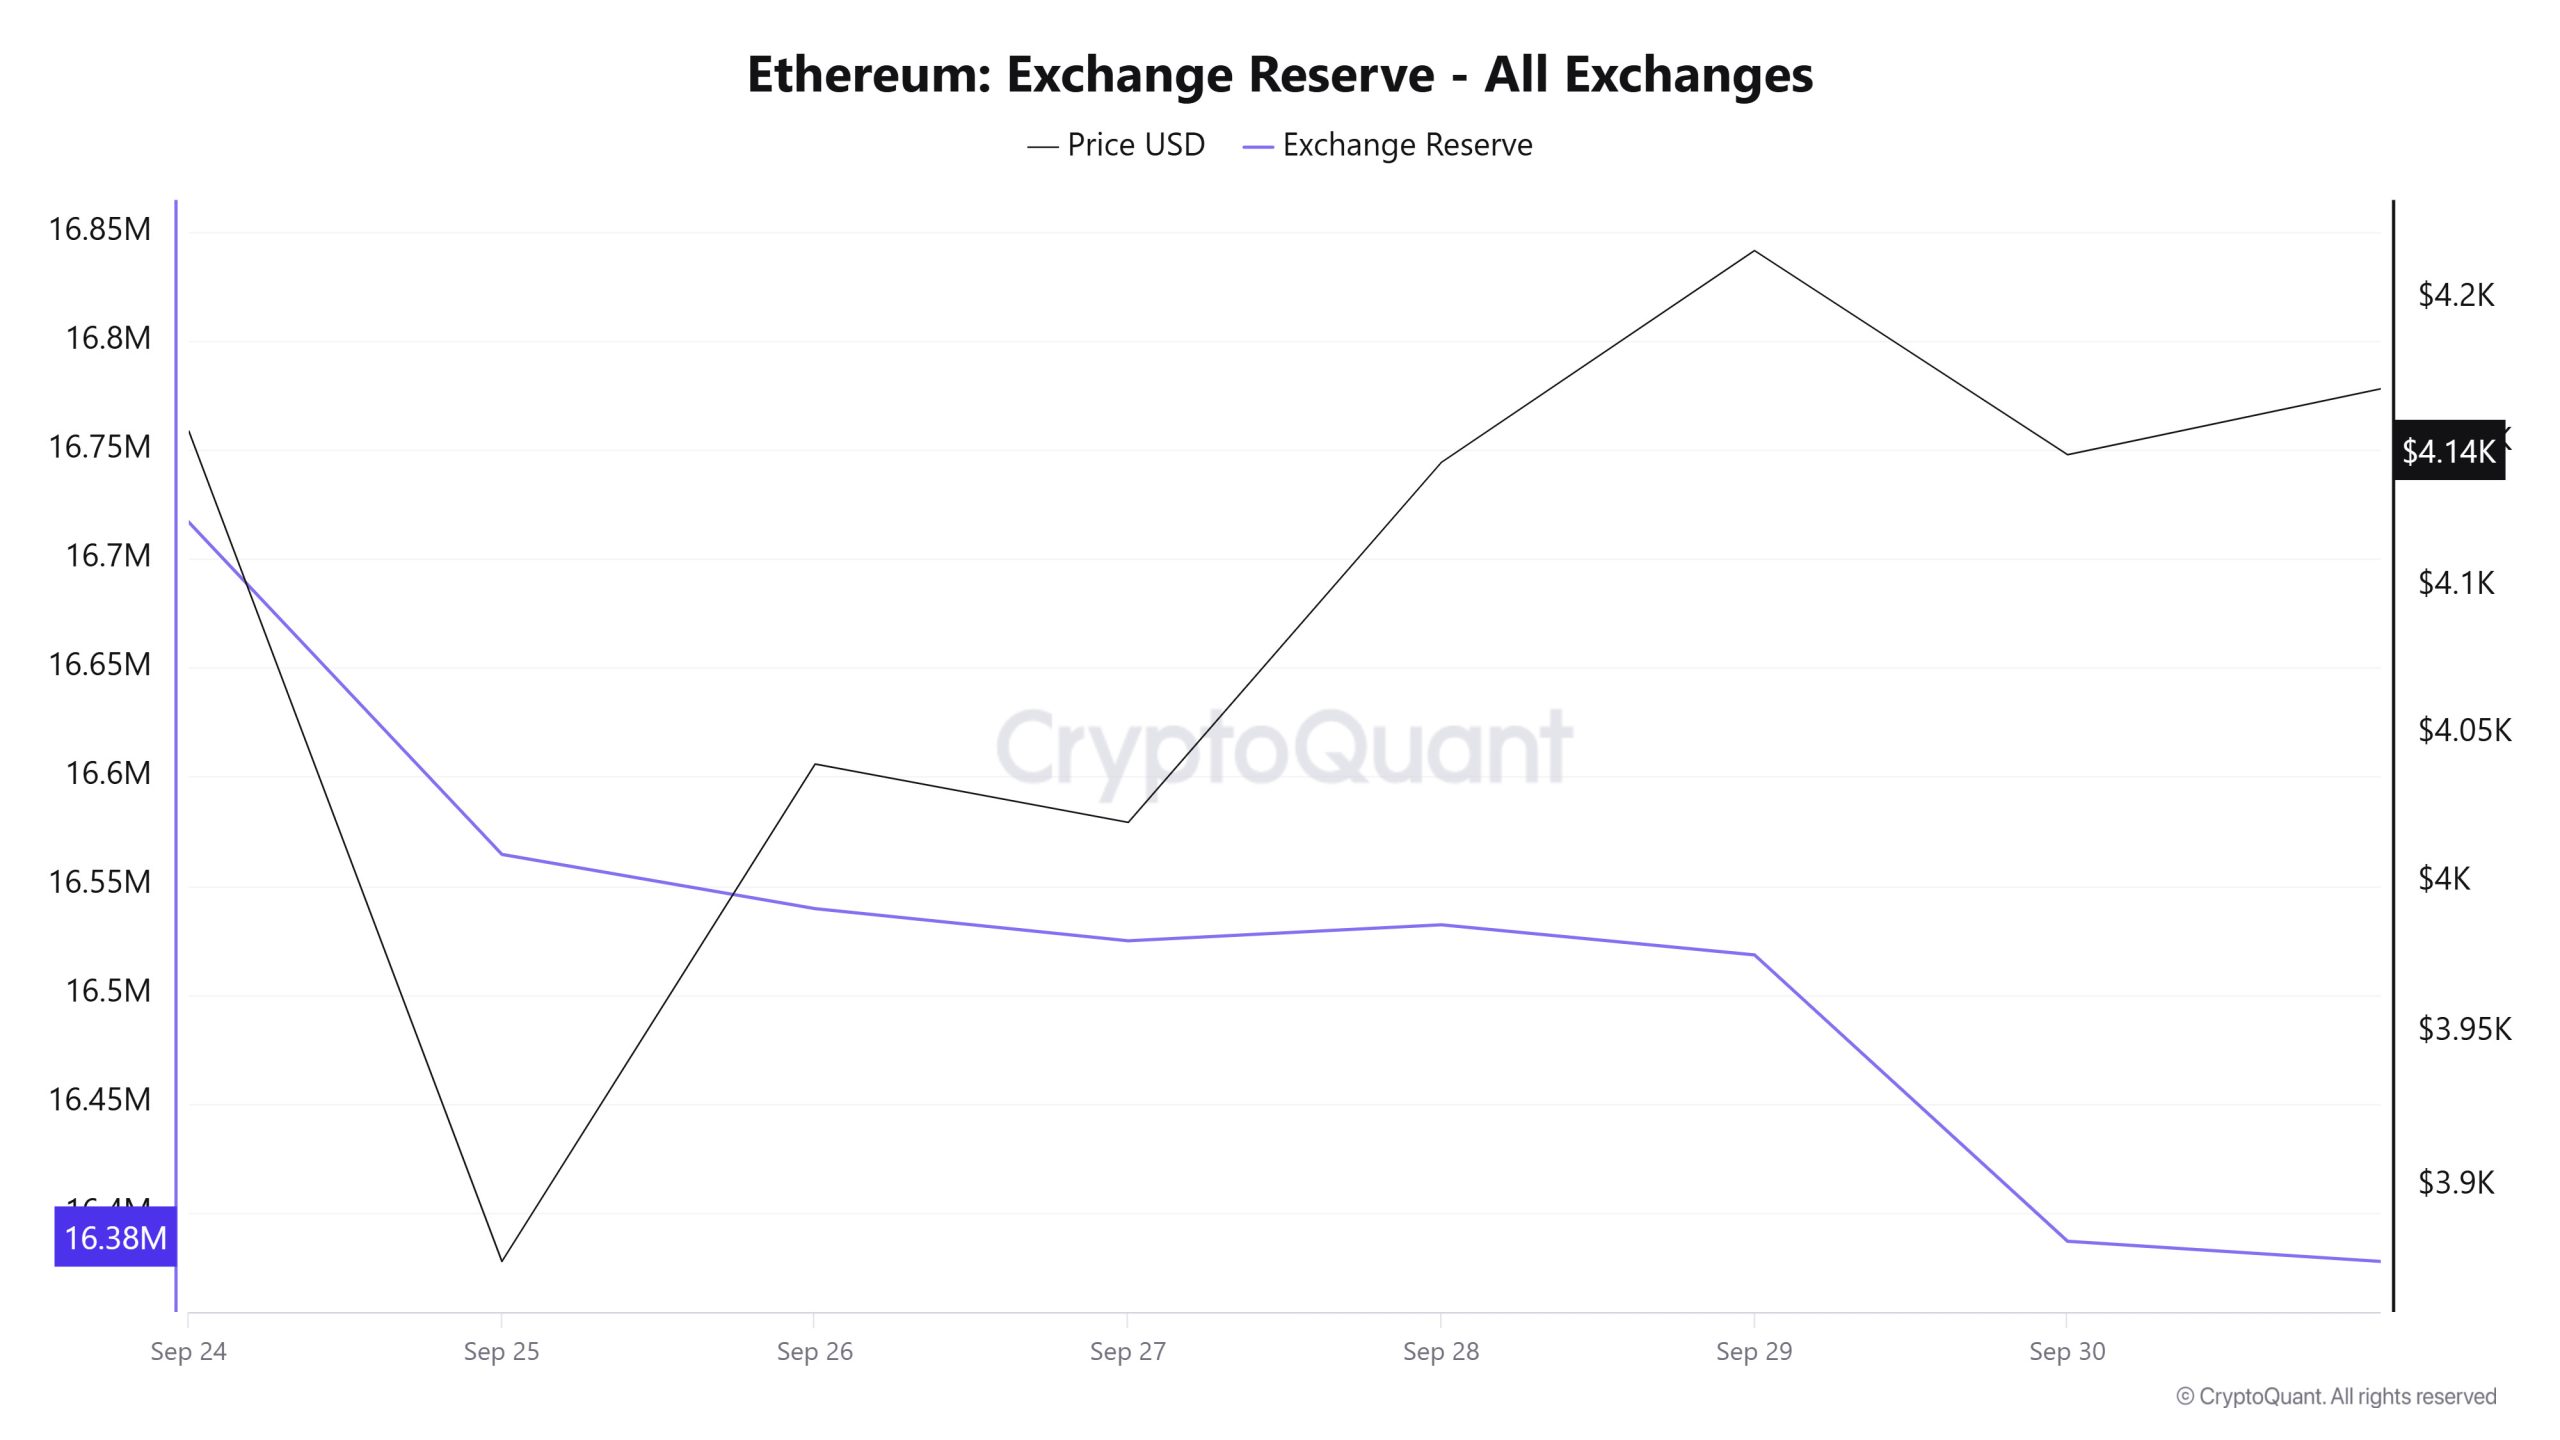
Between September 24-30, 2025, Ethereum reserves el exchanges decreased from 16,716,826 ETH to 16,386,852 ETH, with a total net outflow of 329,974 ETH. During this period, reserves decreased por approximately 1.97%. In the same period, the Ethereum price fell from $4,165 to $4,145, a loss of about 0.47%. The decline en reserves along with the price shows that investors continue to withdraw their assets from stock markets despite the selling pressure. Although this situation presents a weak outlook en the short term, it can be considered as a positive signal en the long term with the supply contraction.
| Date | Exchange Inflow | Exchange Outflow | Exchange Netflow | Exchange Reserve | ETH Price |
|---|---|---|---|---|---|
| 24-Sep | 919,646 | 1,044,227 | -124,582 | 16,716,826 | $4,165 |
| 25-Sep | 1,262,932 | 1,415,379 | -152,447 | 16,564,379 | $3,875 |
| 26-Sep | 1,094,280 | 1,119,152 | -24,872 | 16,539,507 | $4,040 |
| 27-Sep | 307,204 | 321,950 | -14,746 | 16,524,761 | $4,020 |
| 28-Sep | 247,834 | 240,492 | +7,342 | 16,532,102 | $4,143 |
| 29-Sep | 895,725 | 909,534 | -13,809 | 16,518,293 | $4,217 |
| 30-Sep | 1,364,881 | 1,496,322 | -131,441 | 16,386,852 | $4,145 |
Fees and Revenues
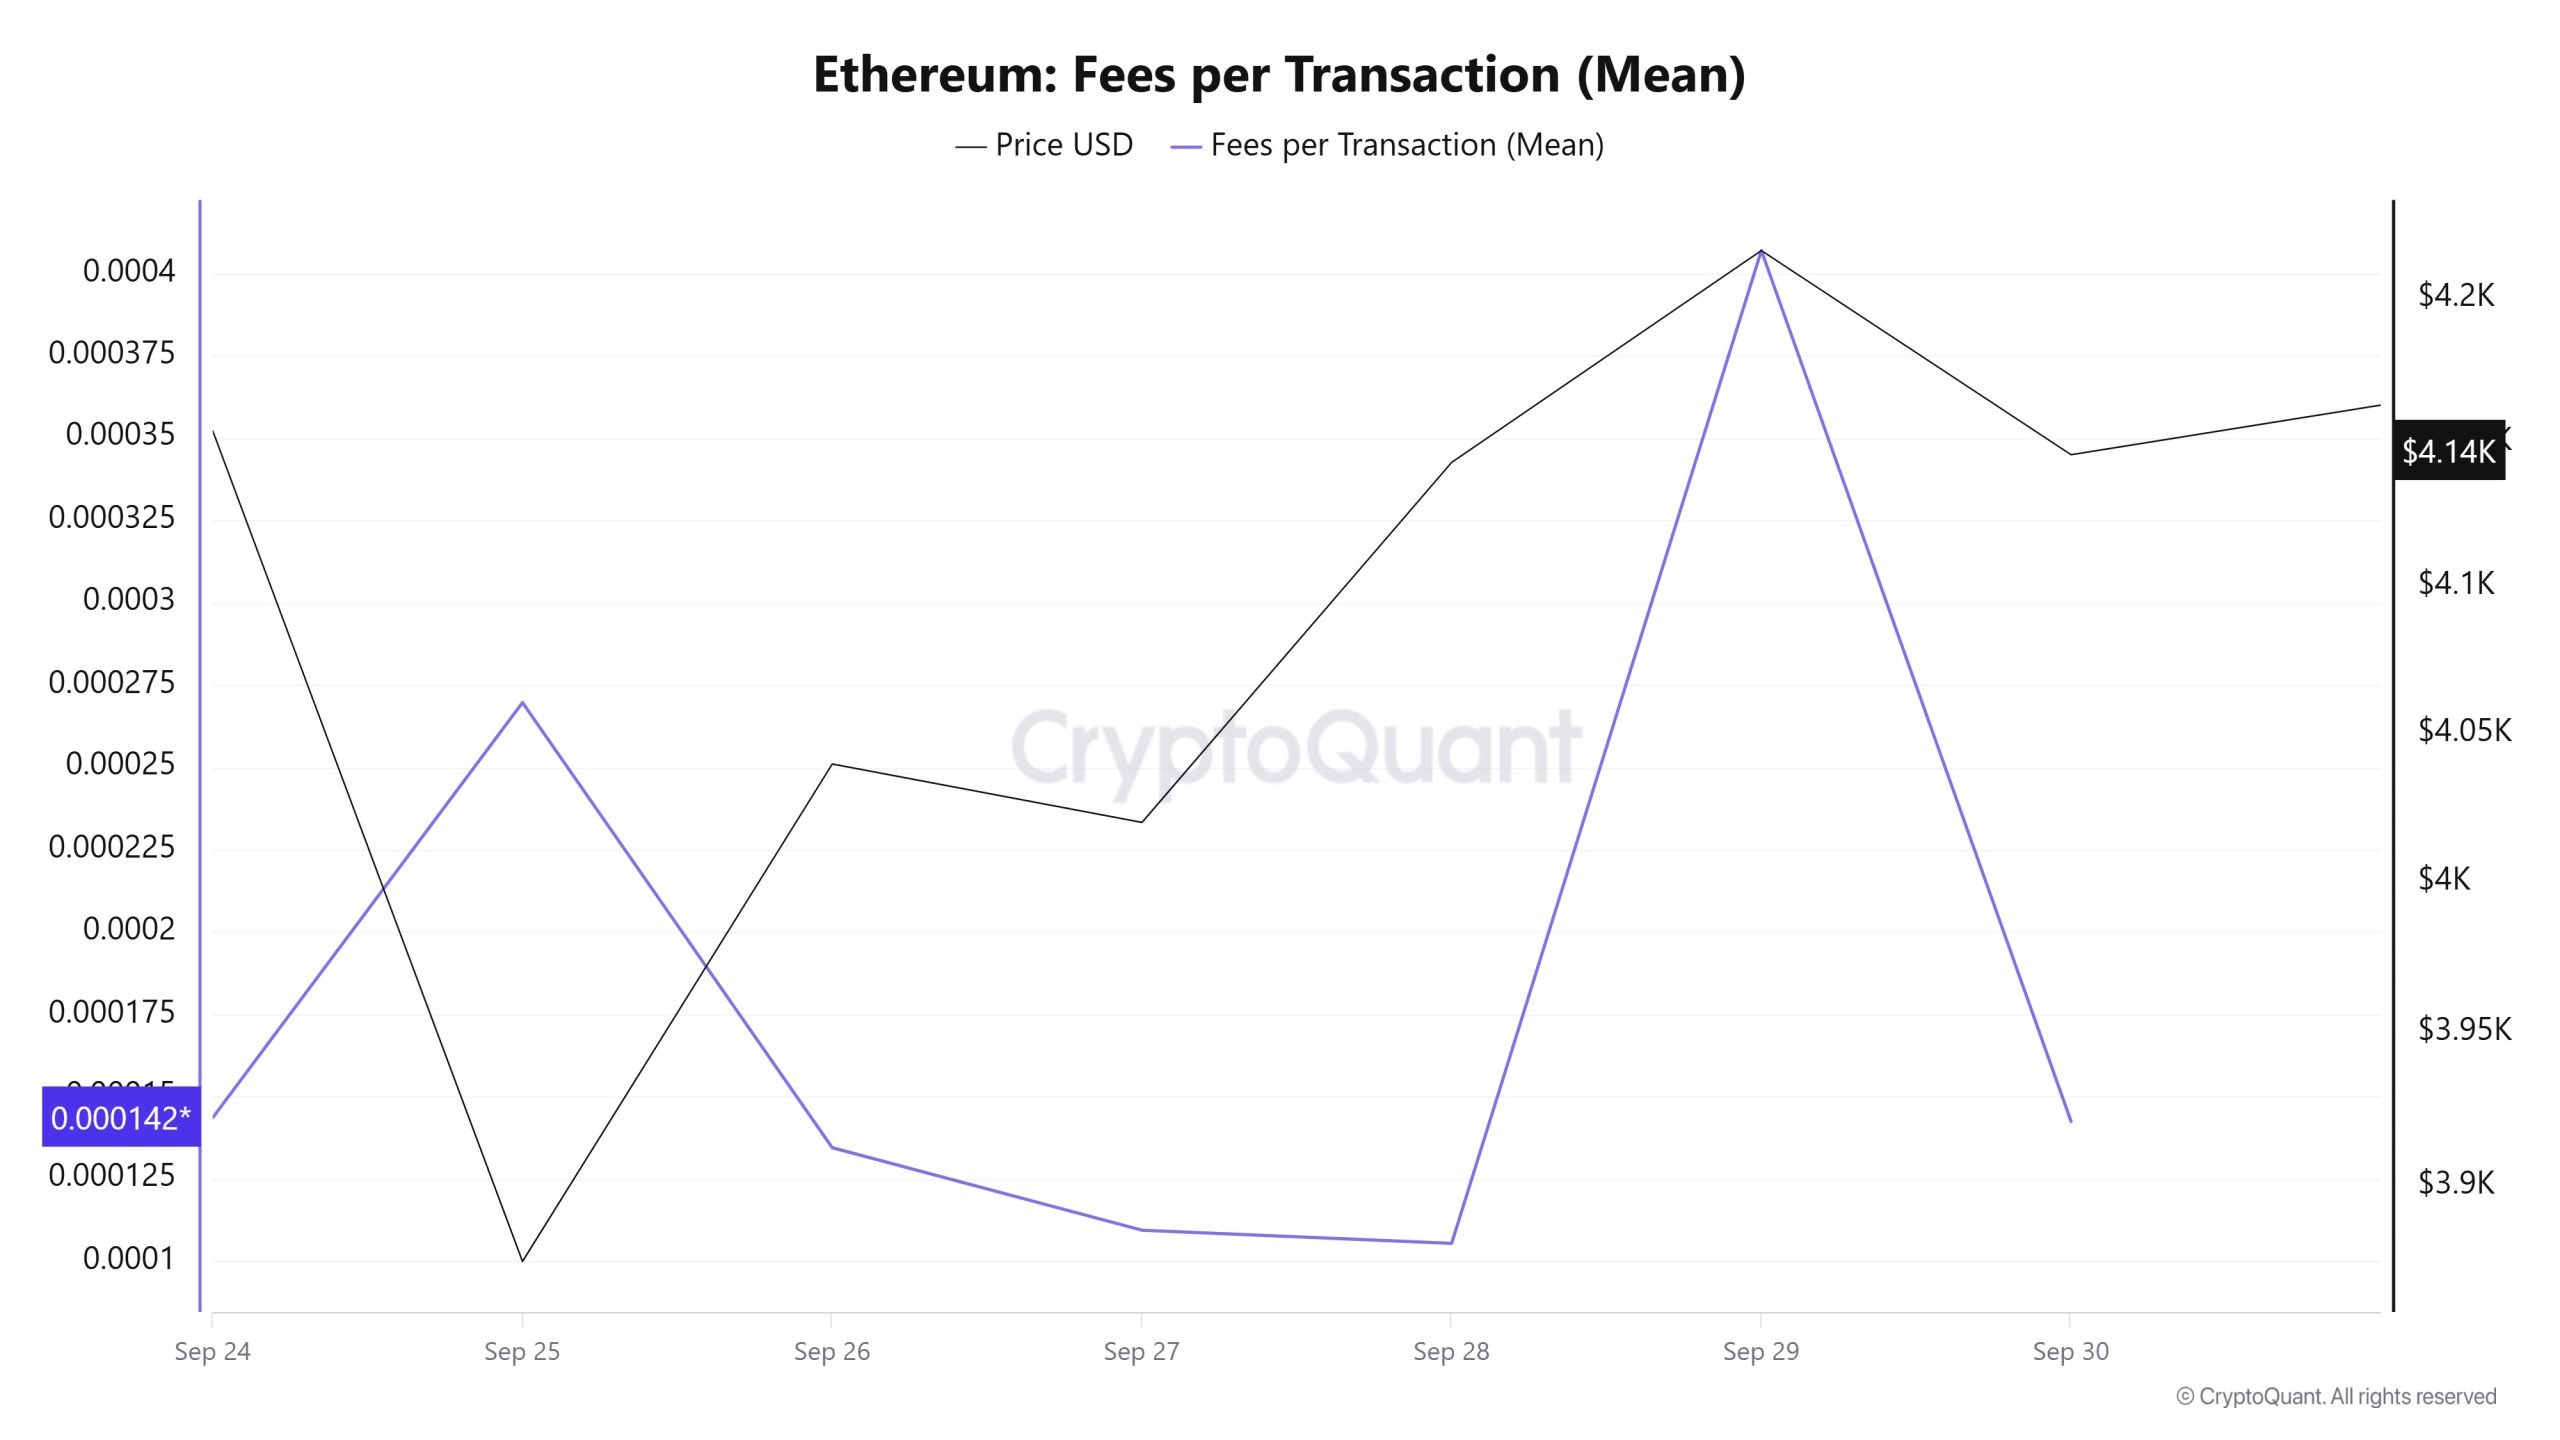
When the Ethereum Fees per Transaction (Mean) data between September 24- 30 is analyzed, it is seen that the indicator was realized at 0.000143610210909966 el September 24, the first day of the week.
After this date, it followed a fluctuating course due to the volatility en Ethereum price. On September 28, it fell to 0.000105420153031572, recording the lowest value of the week.
In the following days, the Ethereum Fees per Transaction (Mean) indicator resumed its upward trend and closed at 0.000142446389294839 el September 30, the last day of the week.
Ethereum: Fees (Total)
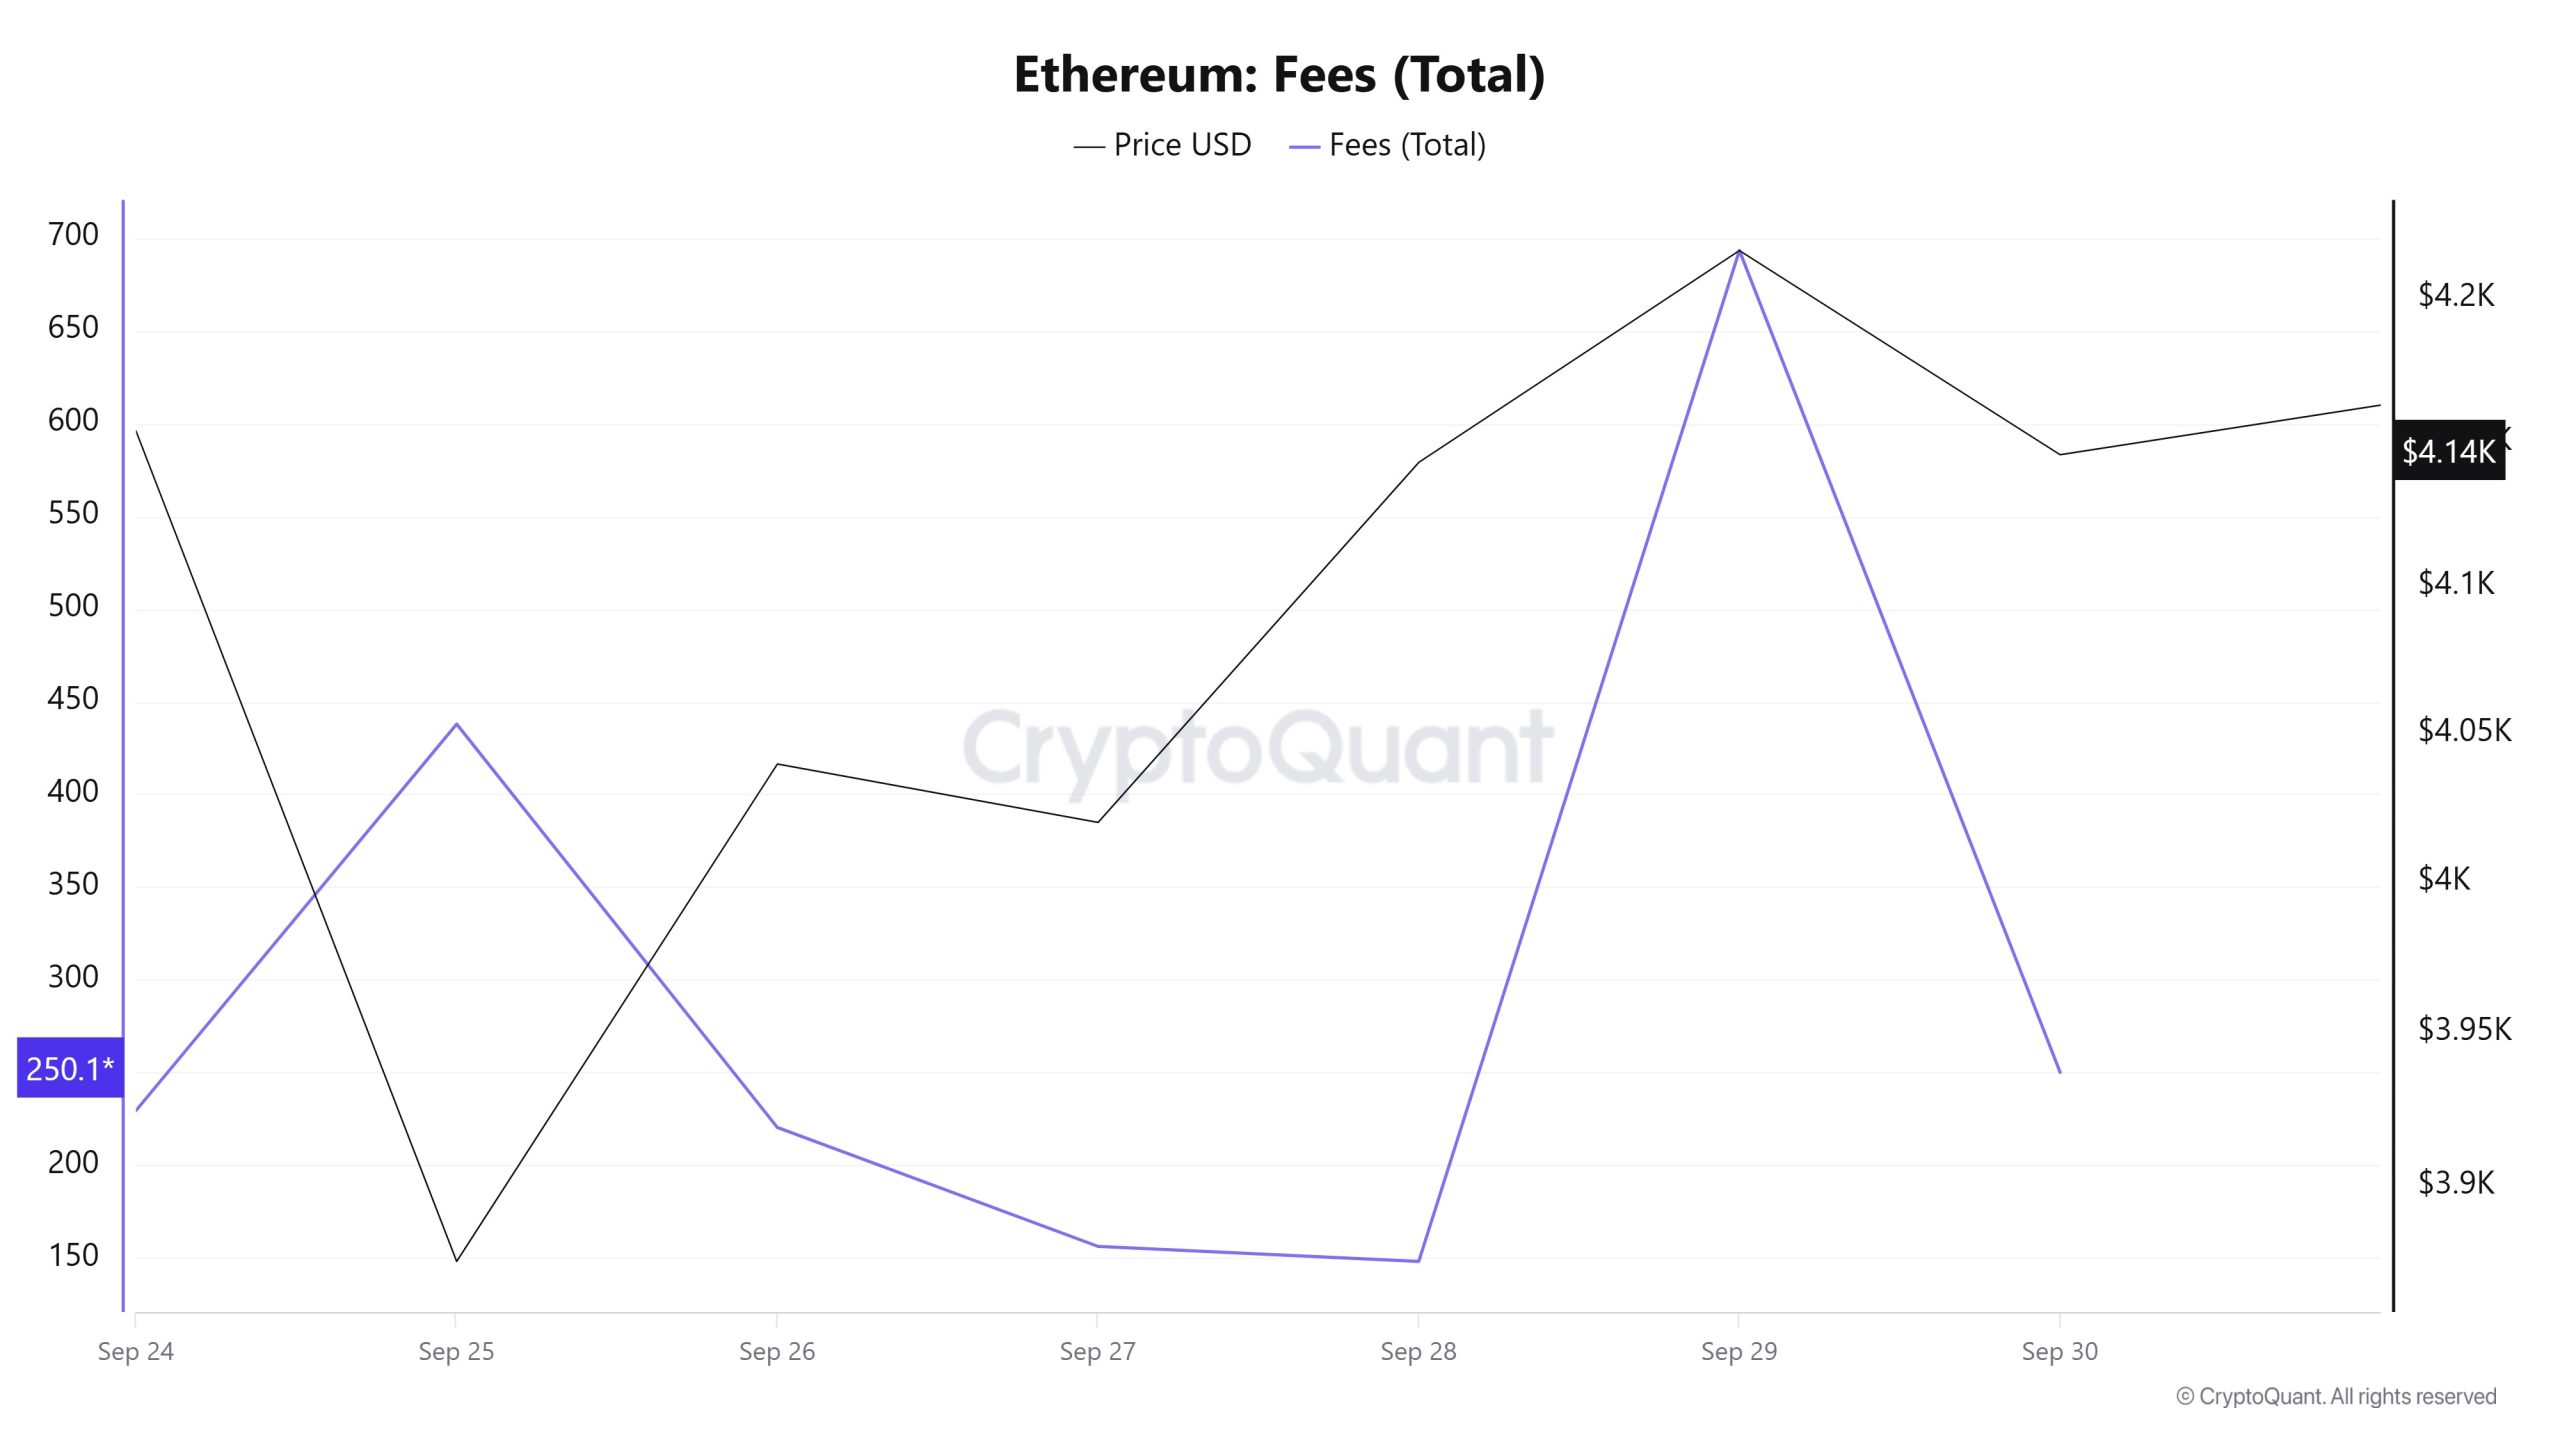
Similarly, an analysis of Ethereum Fees (Total) data between September 24 and 30 shows that el September 24, the first day of the week, the indicator stood at 229.46183109405354.
After this date, it followed a fluctuating course due to the volatility en Ethereum price. On September 28, it fell to 148.08400522390875, recording the lowest value of the week.
In the following days, the Ethereum Fees (Total) indicator resumed its upward trend and closed at 250.11705667835028 el September 30, the last day of the week.
Blocks Mined
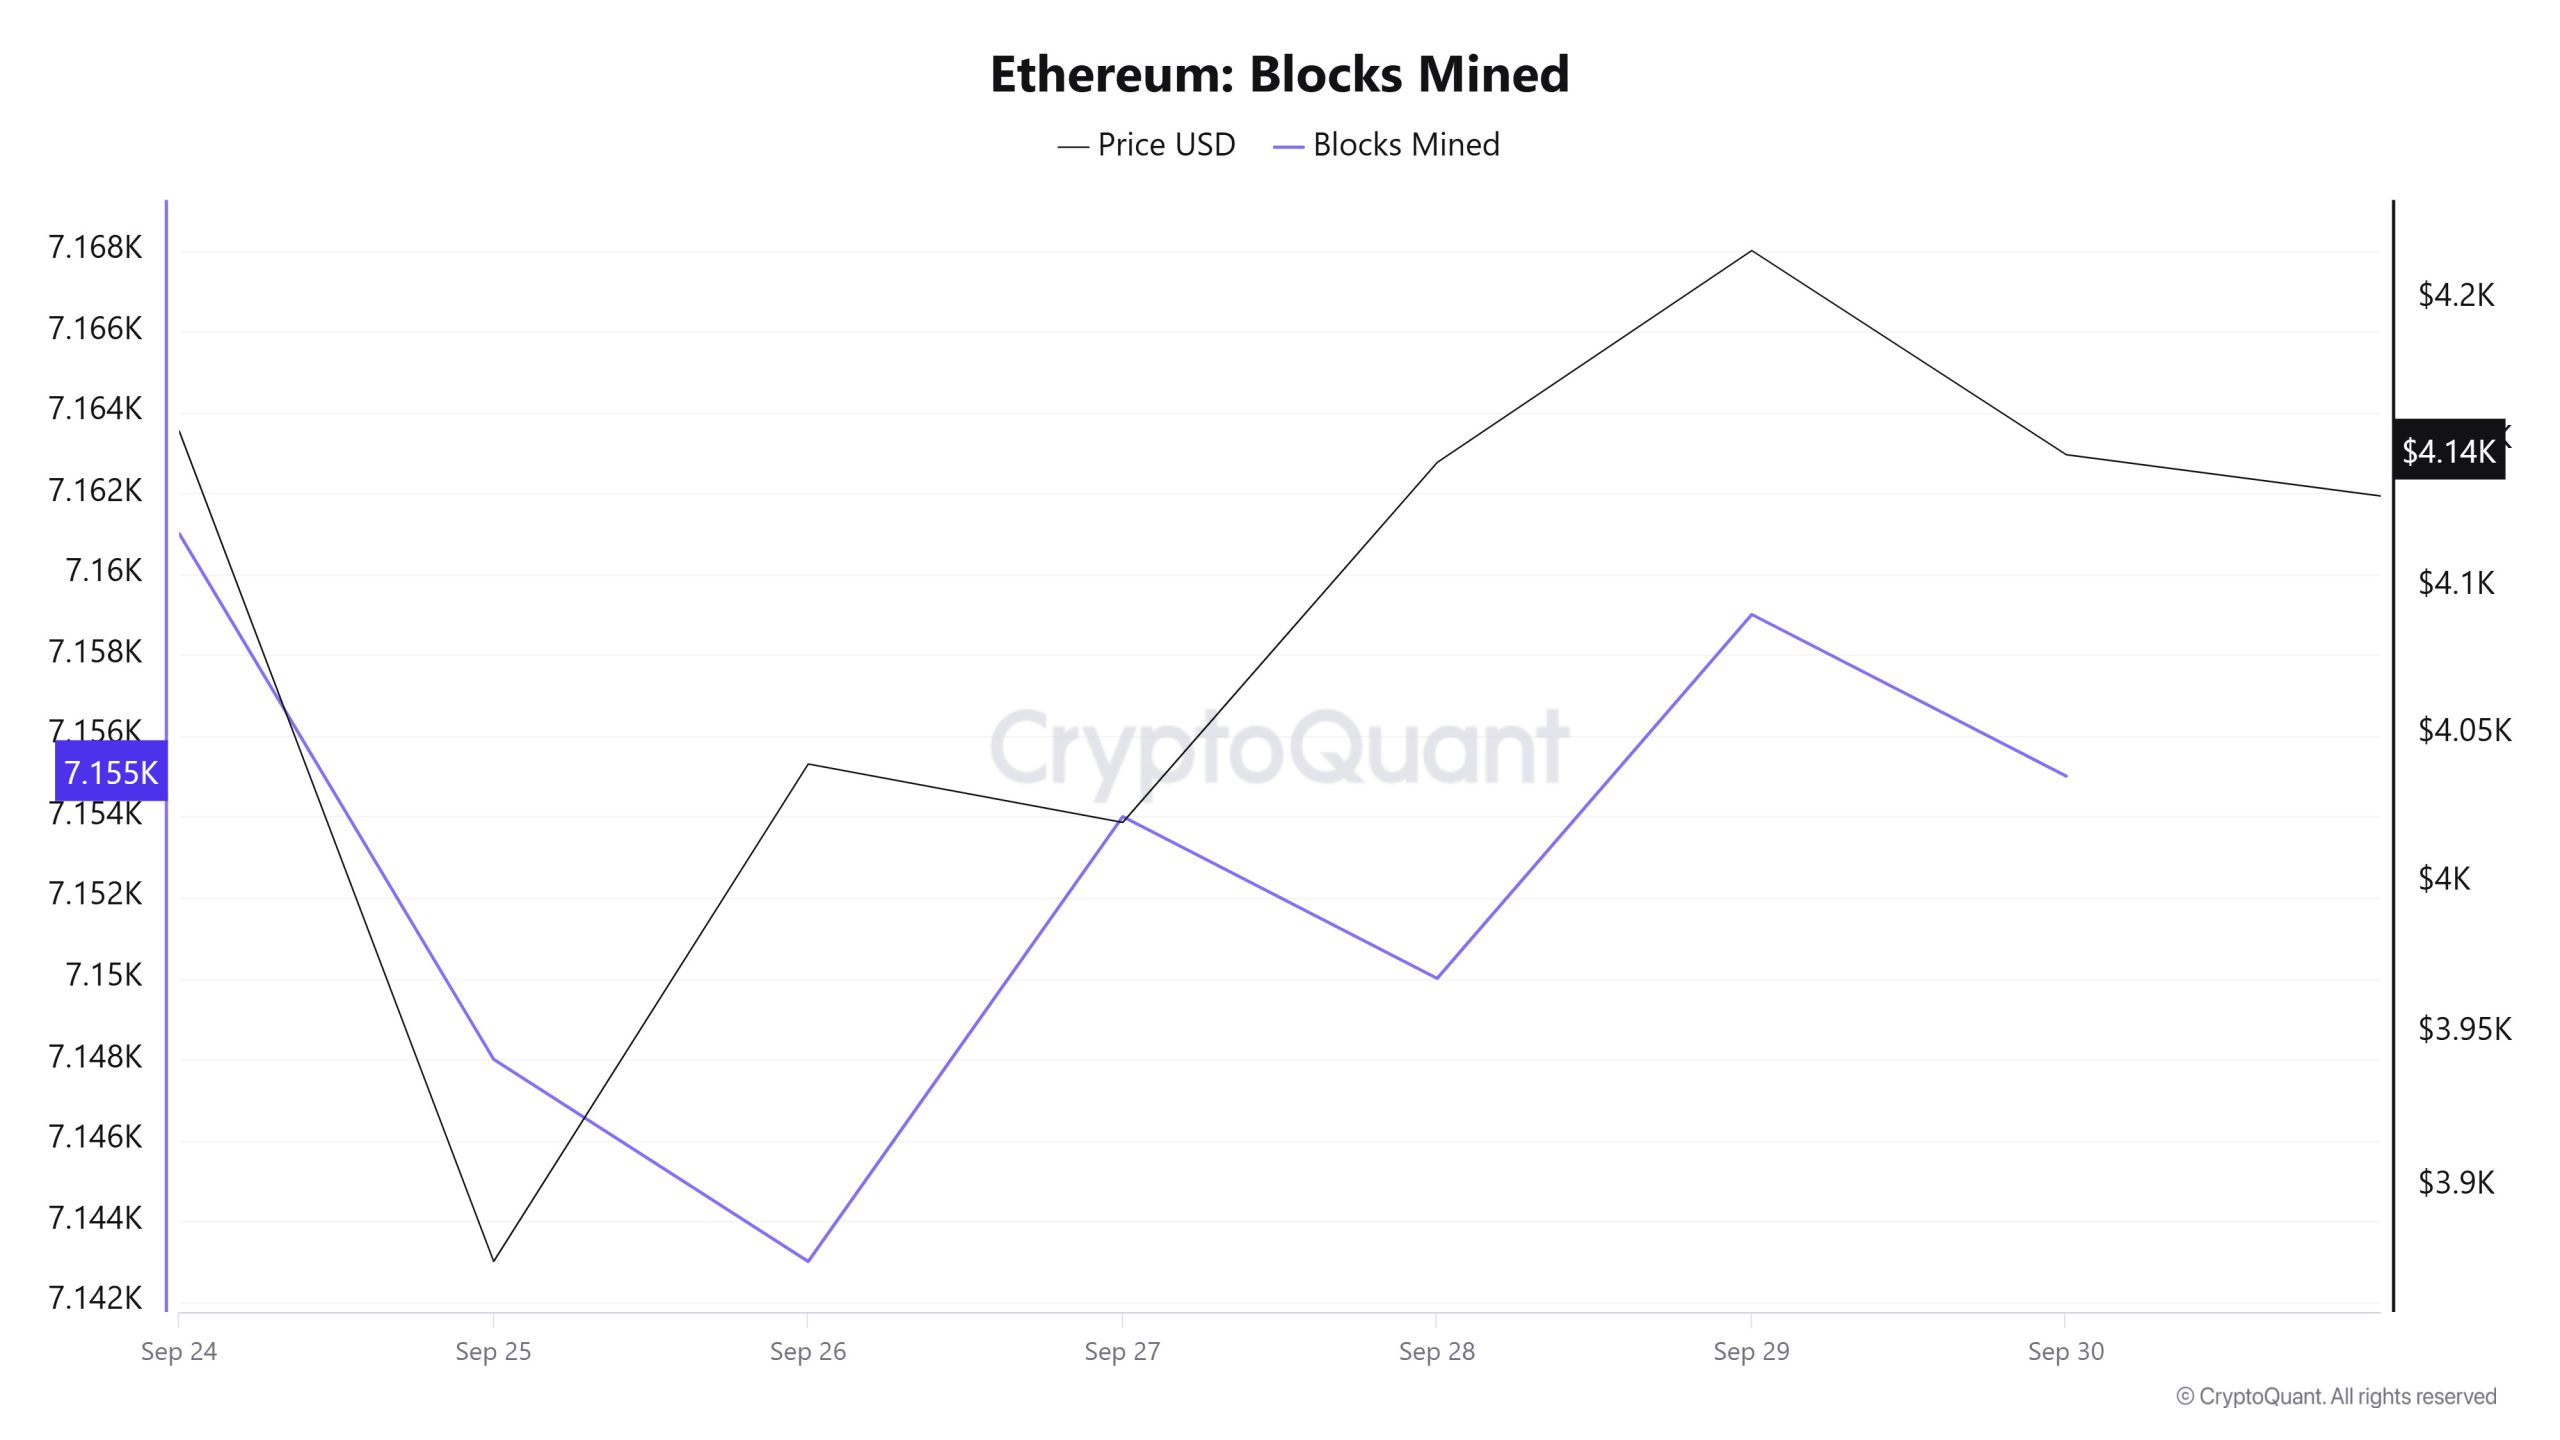
Between September 24 and September 30, Ethereum block production data showed a decrease throughout the week. While 7,161 blocks were produced el September 24, this number decreased to 7,155 as of September 30.
A time-varying correlation structure has been observed between the Ethereum price and the number of block production. However, the general trend suggests that a positive correlation between these two variables is dominant.
Block Size
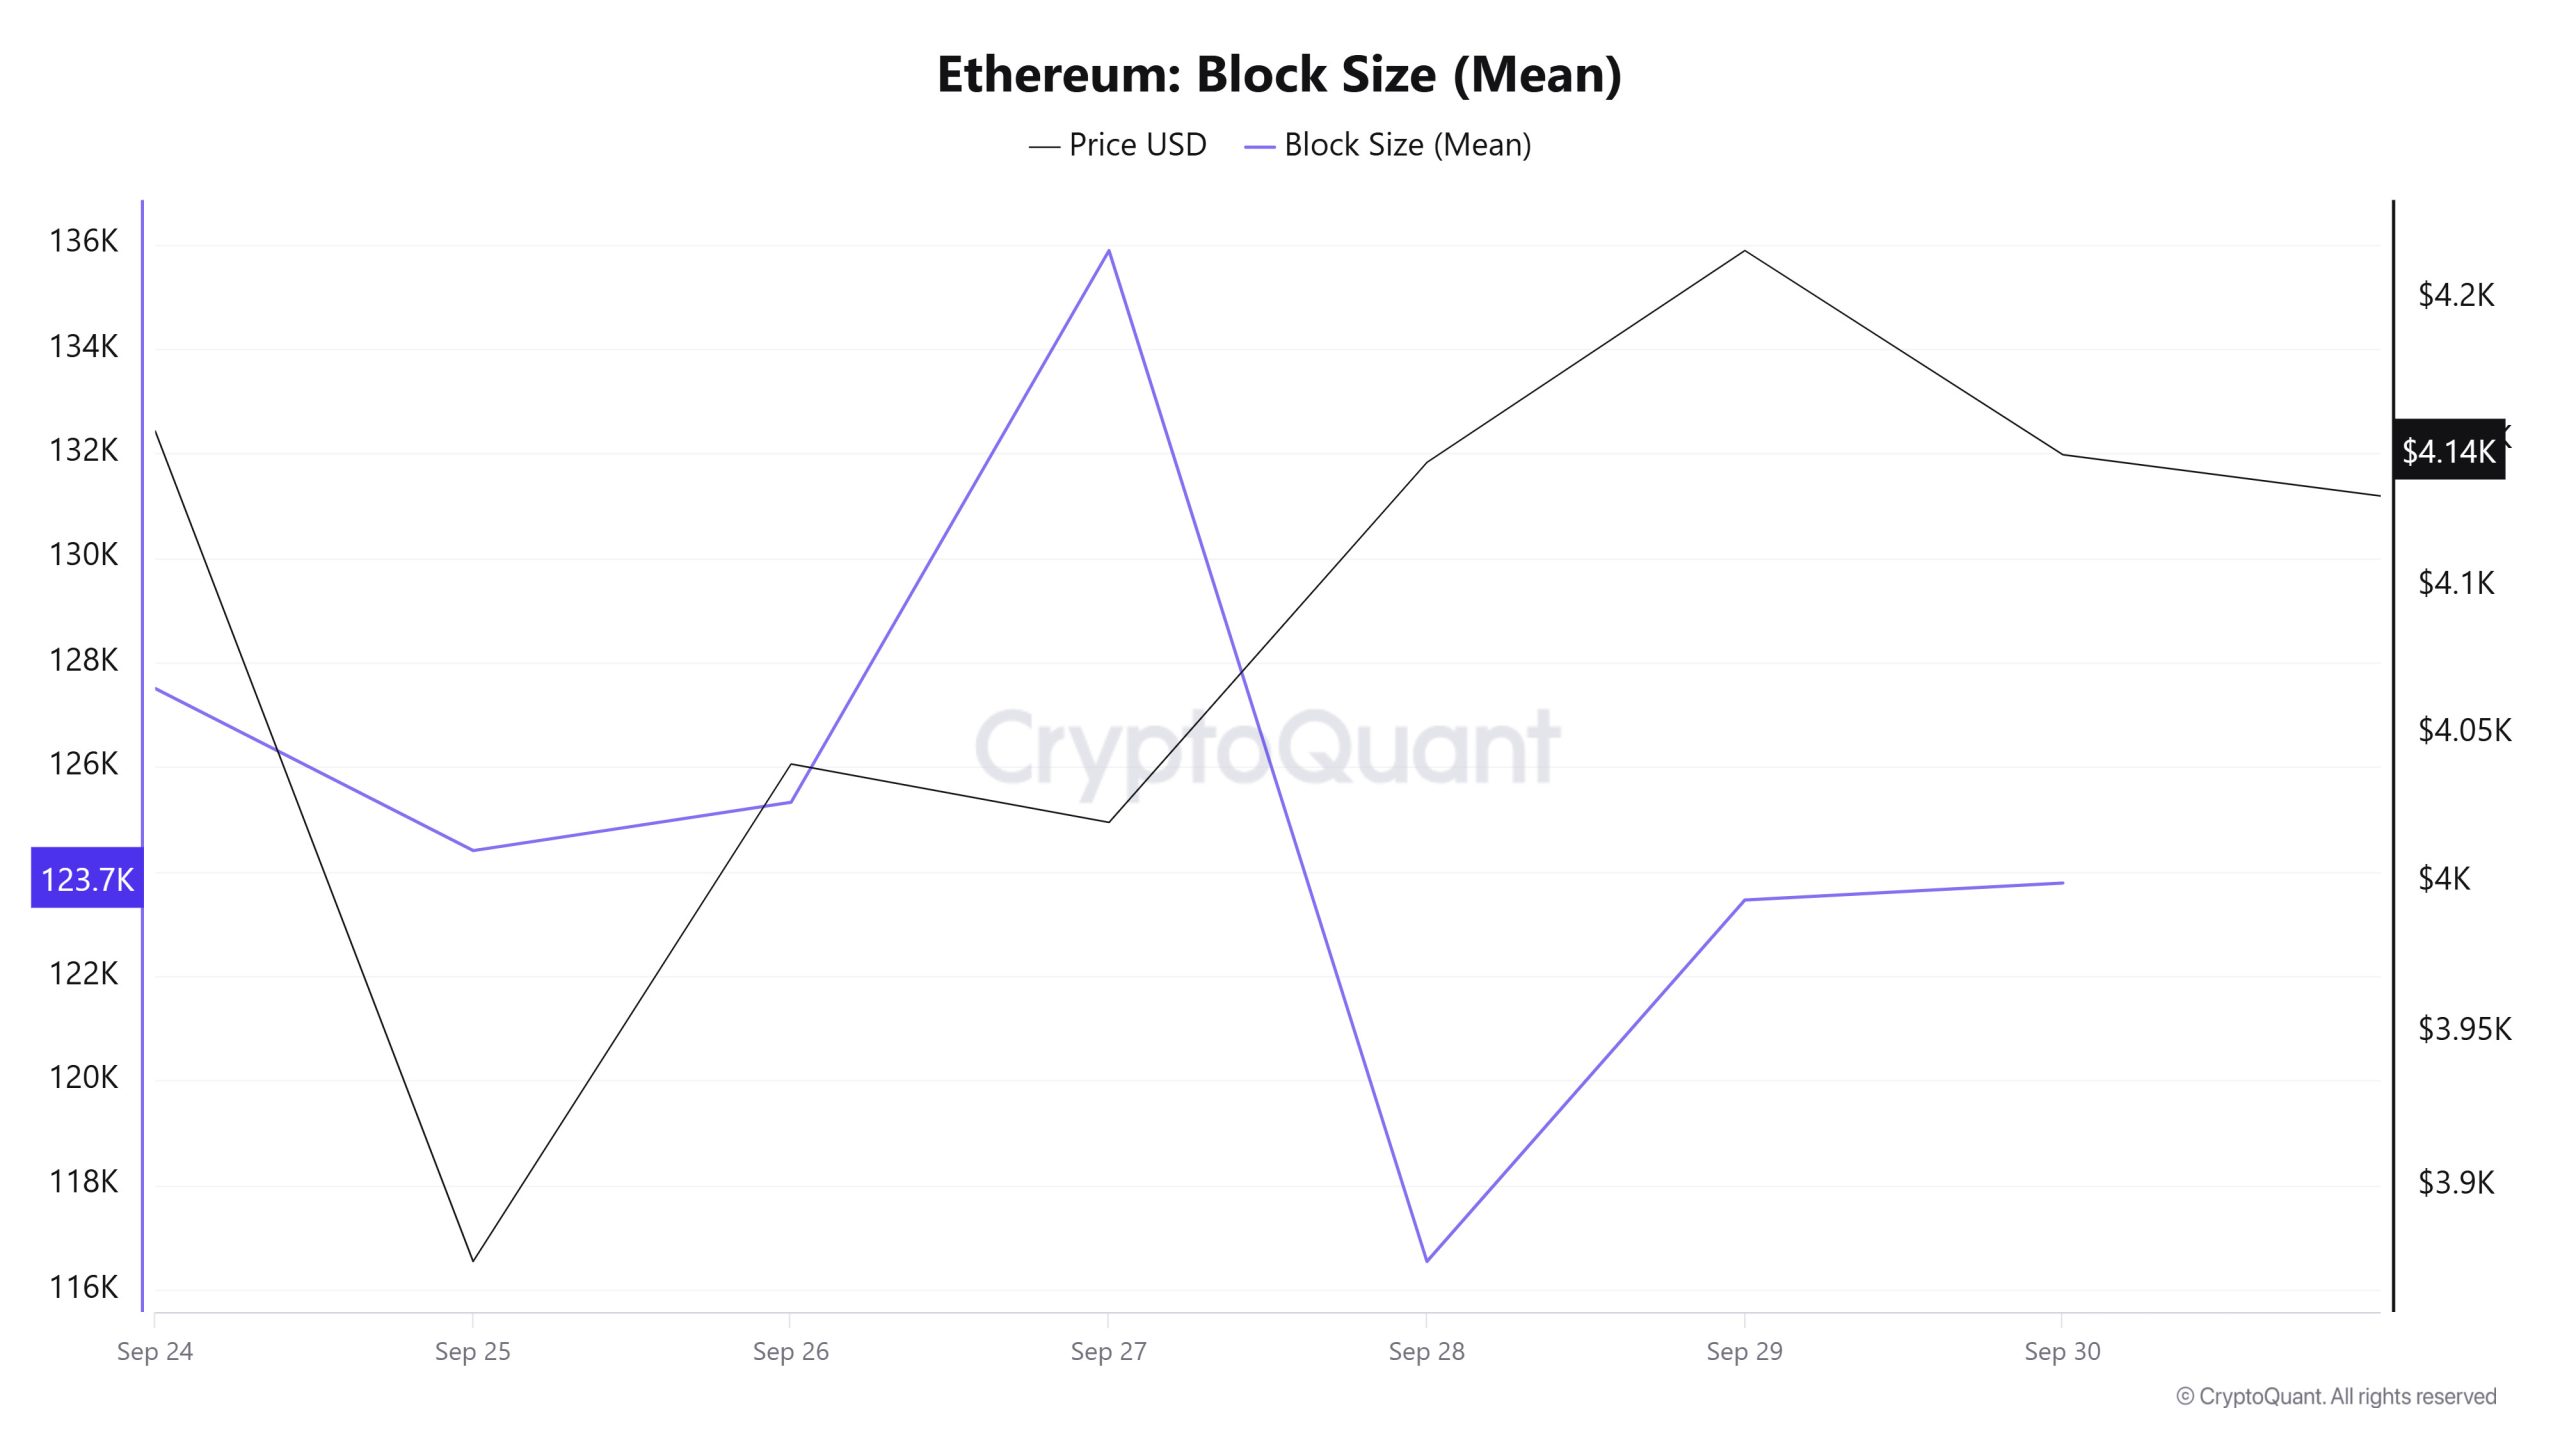
Between September 24 and September 30, Ethereum block size data shows that there was a decrease throughout the week. While el September 24, the average block size was measured as 127,504 bytes, this value decreased to 123,782 bytes as of September 30.
A time-varying correlation structure was observed between block size and Ethereum price during the period. However, the general trend suggests that a positive correlation between these two variables is dominant.
Block Interval
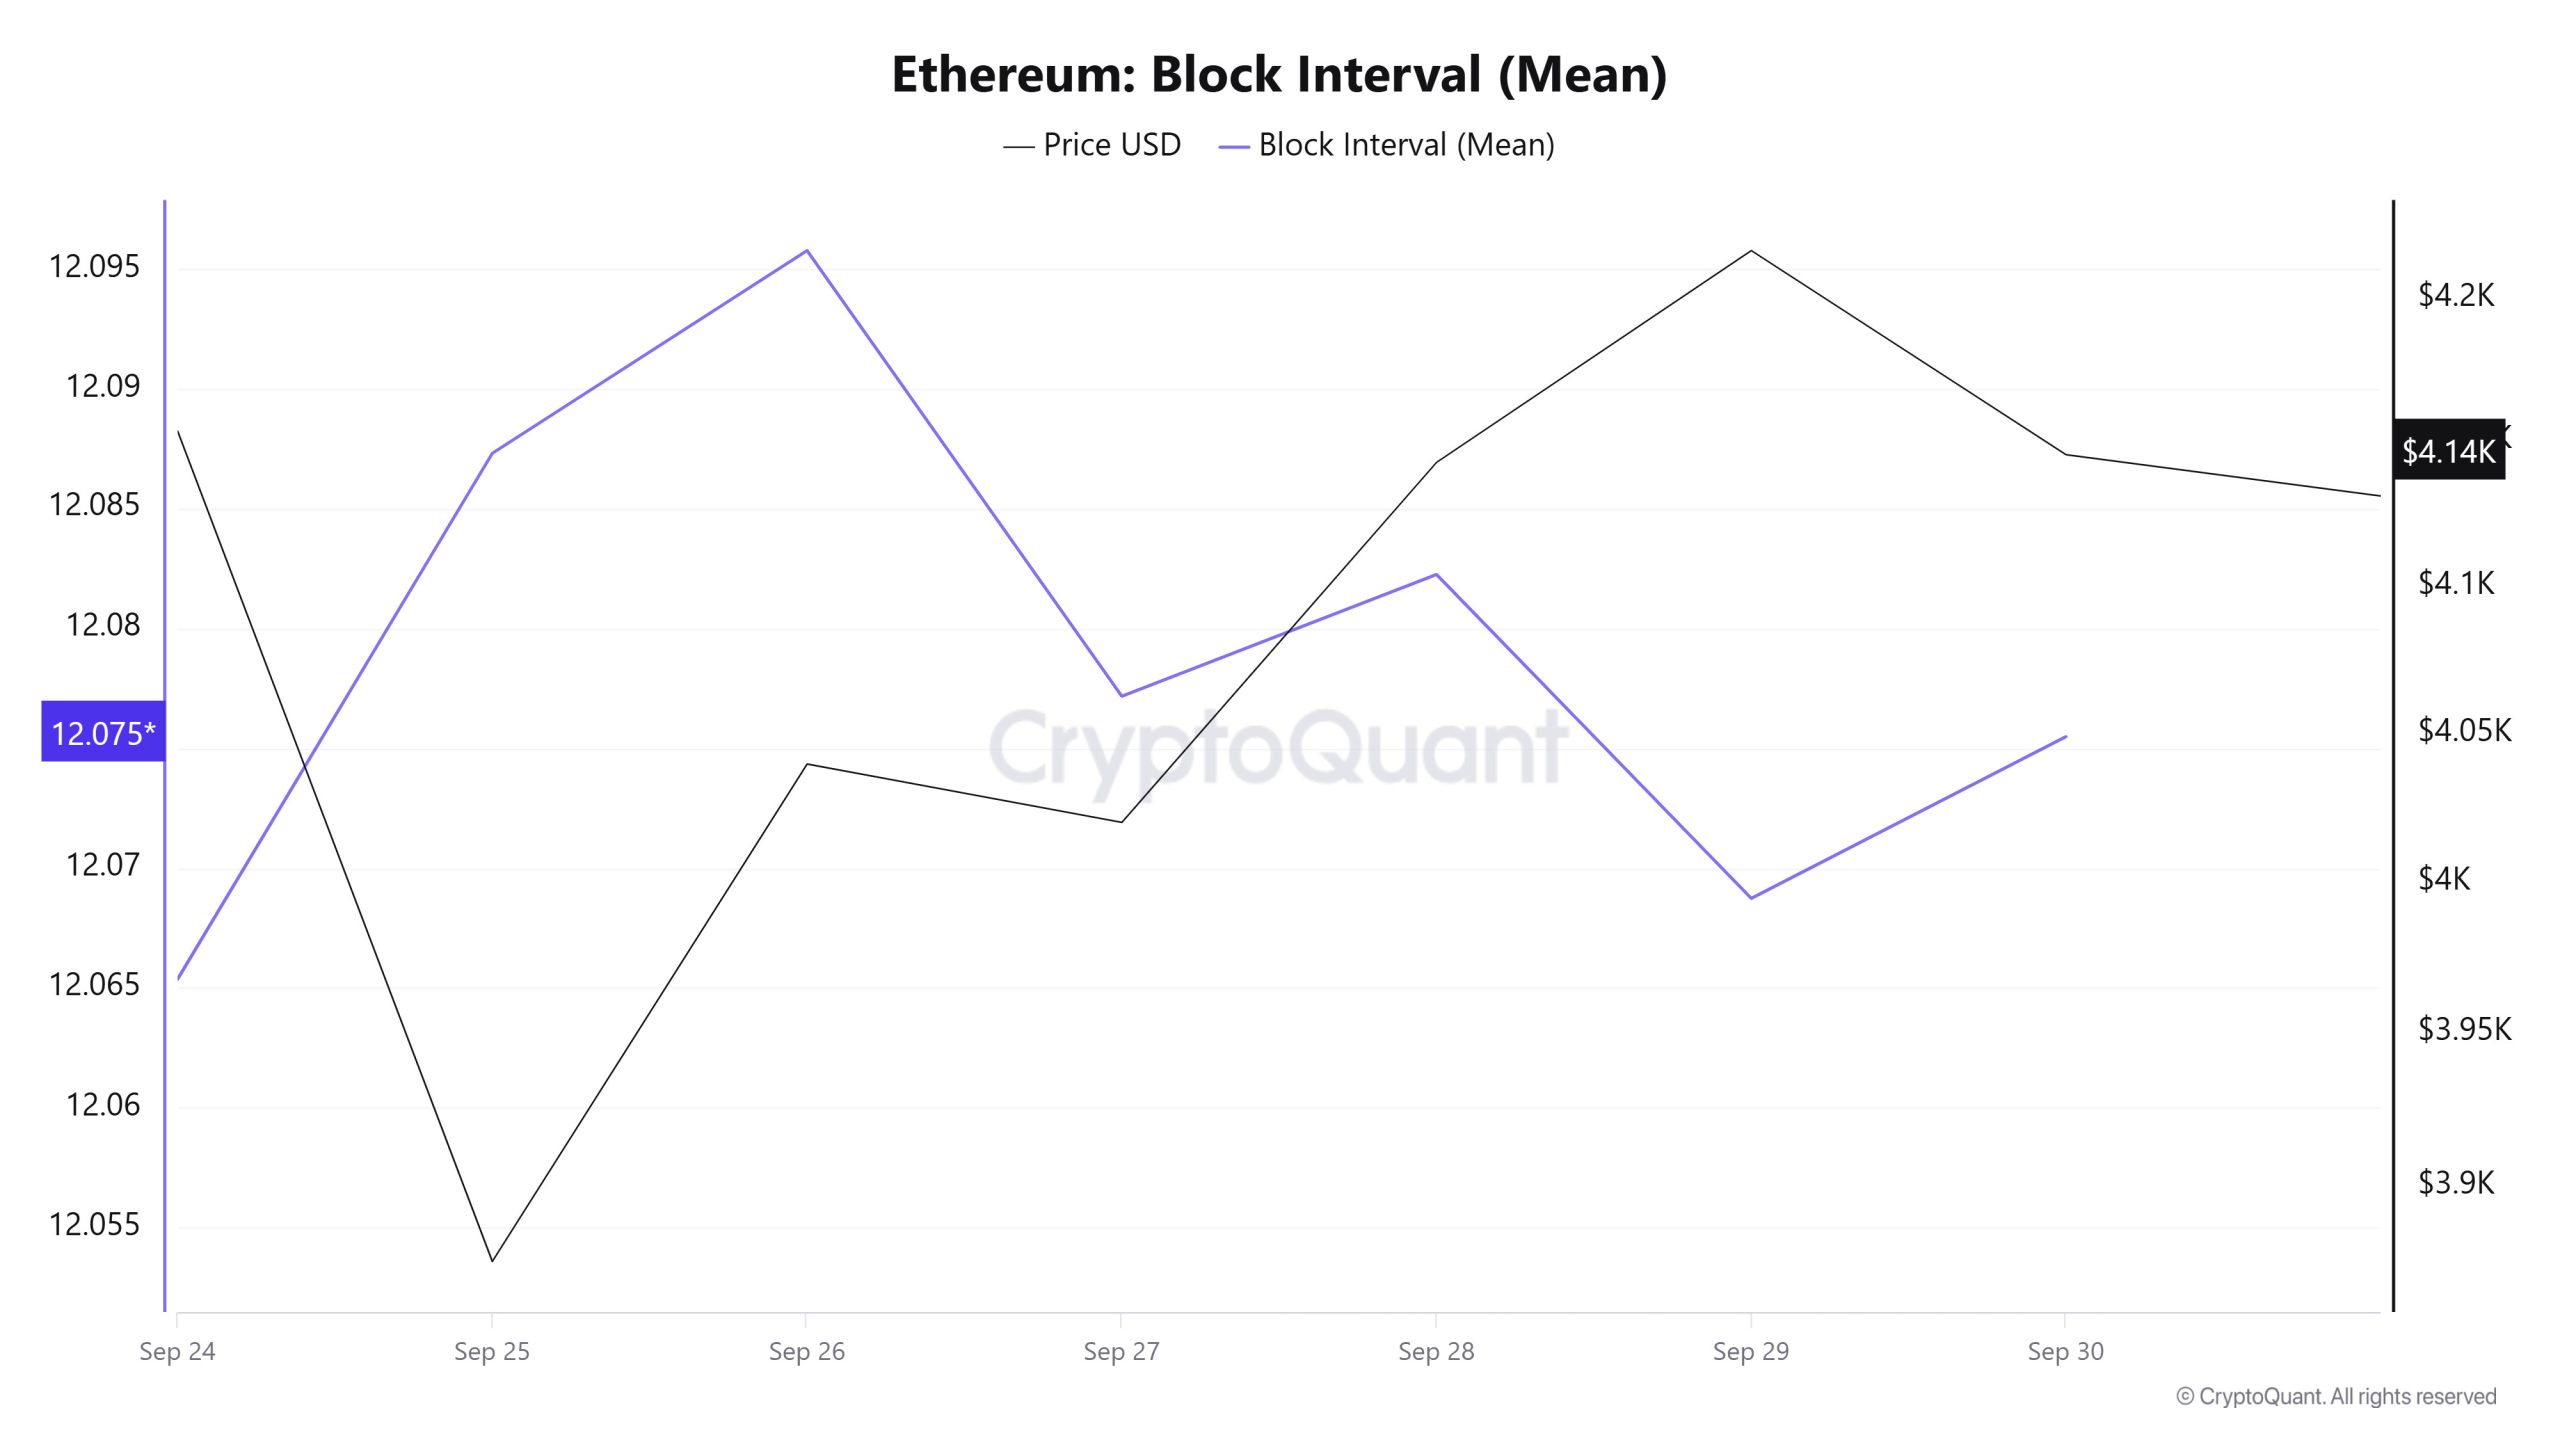
Between September 24 and September 30, Ethereum block data showed a slight increase throughout the week. While el September 24, the average block time was recorded as 12.06 segundos, this time increased to 12.07 segundos as of September 30.
During the period en question, a time-varying correlation structure was observed between Ethereum block duration and price movement. However, the general trend suggests that a negative correlation between these two variables is dominant.
Transaction
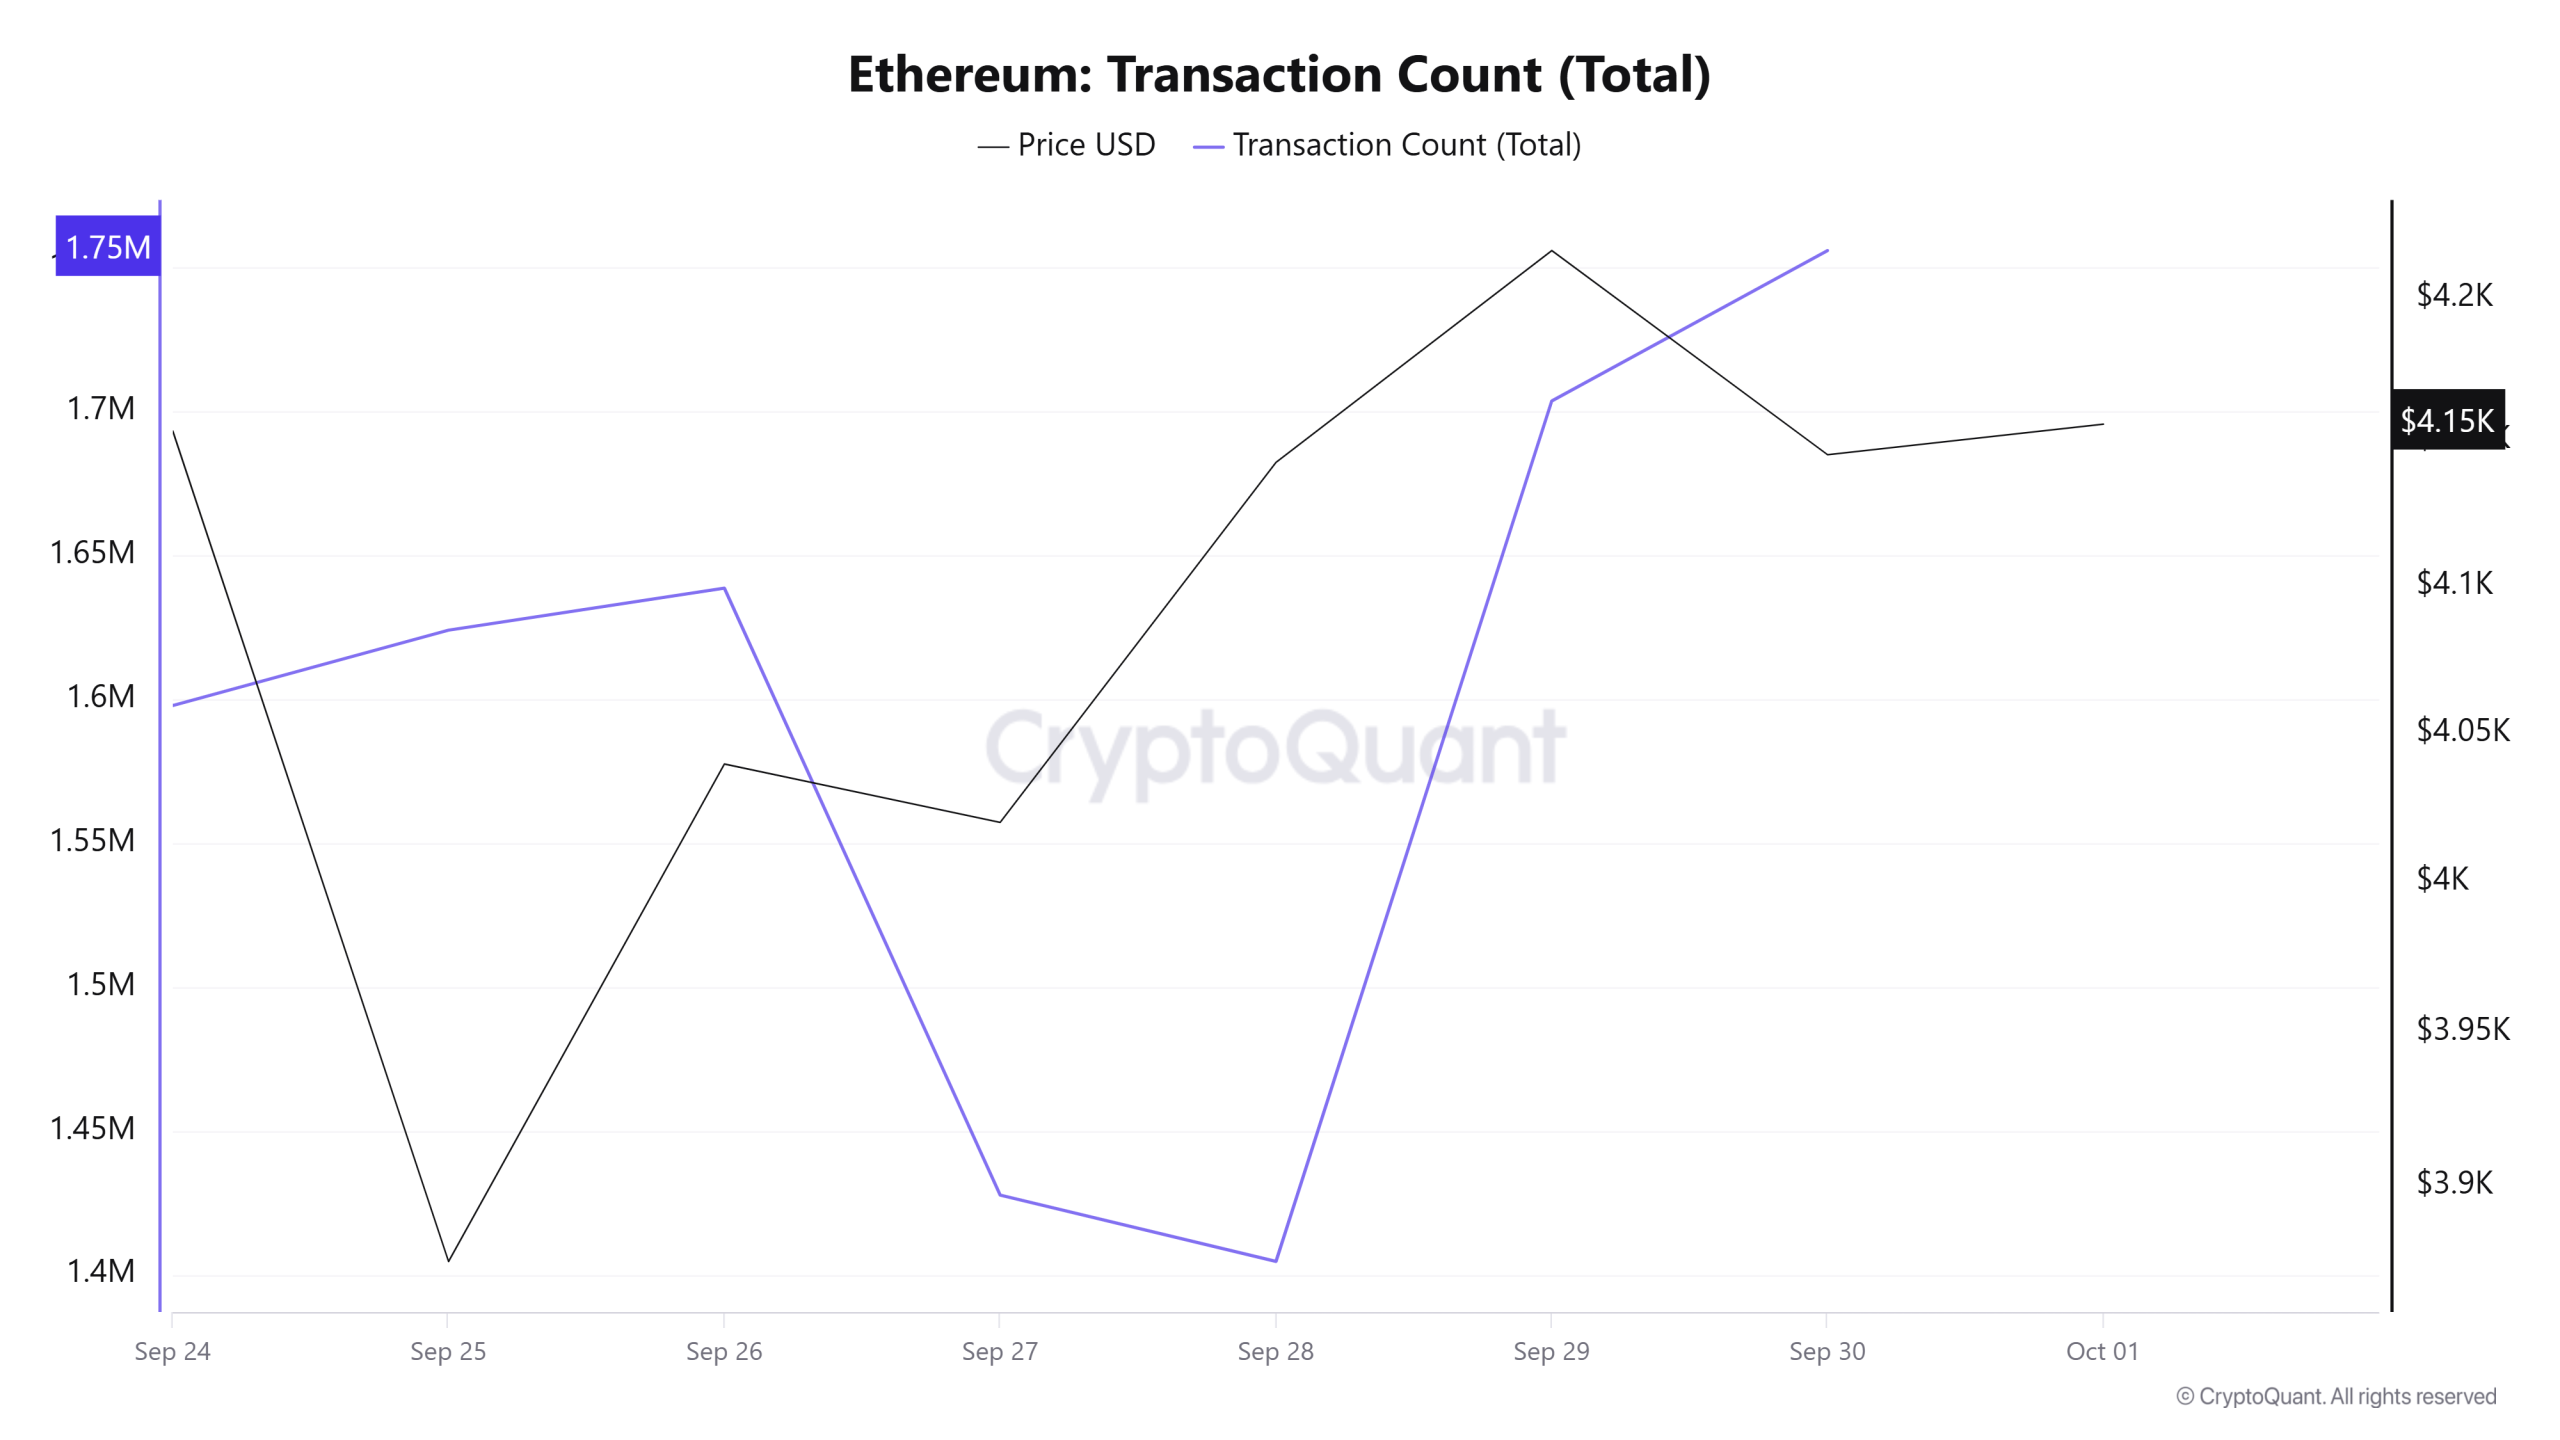
While a total of 11,536,649 transactions were made el the Ethereum network last week, the number of transactions this week decreased por approximately 3.33% to 11,152,344. The weekly high was 1,755,868 el September 30 and the low was 1,404,703 el September 28. The correlation between the number of transactions and the price followed a mixed course, constantly changing between days. On the Ethereum side, there is no clear trend towards buying or selling el the transaction data.
Ethereum burns have started to lose steam, indicating that network activity has partially decreased and less Ether is coming out of supply. This may signal that the overall demand en the ecosystem may shrink en the short term.
Tokens Transferred
The total amount of ETH transferred between last week and this week increased por approximately 1.66%, from 13,645,178 to 13,872,094. The highest weekly transfer was 3,101,047 ETH el September 25, while the lowest was 649,097 ETH el September 28. The extreme variations between the amounts transferred el a daily basis are still evident, and market movements continue to be relatively volatile. This week, the relationship between the price and the amount of tokens transferred was heavily negatively correlated. This may indicate that realized transfers are heavily dominated por sales.
Estimated Leverage Ratio
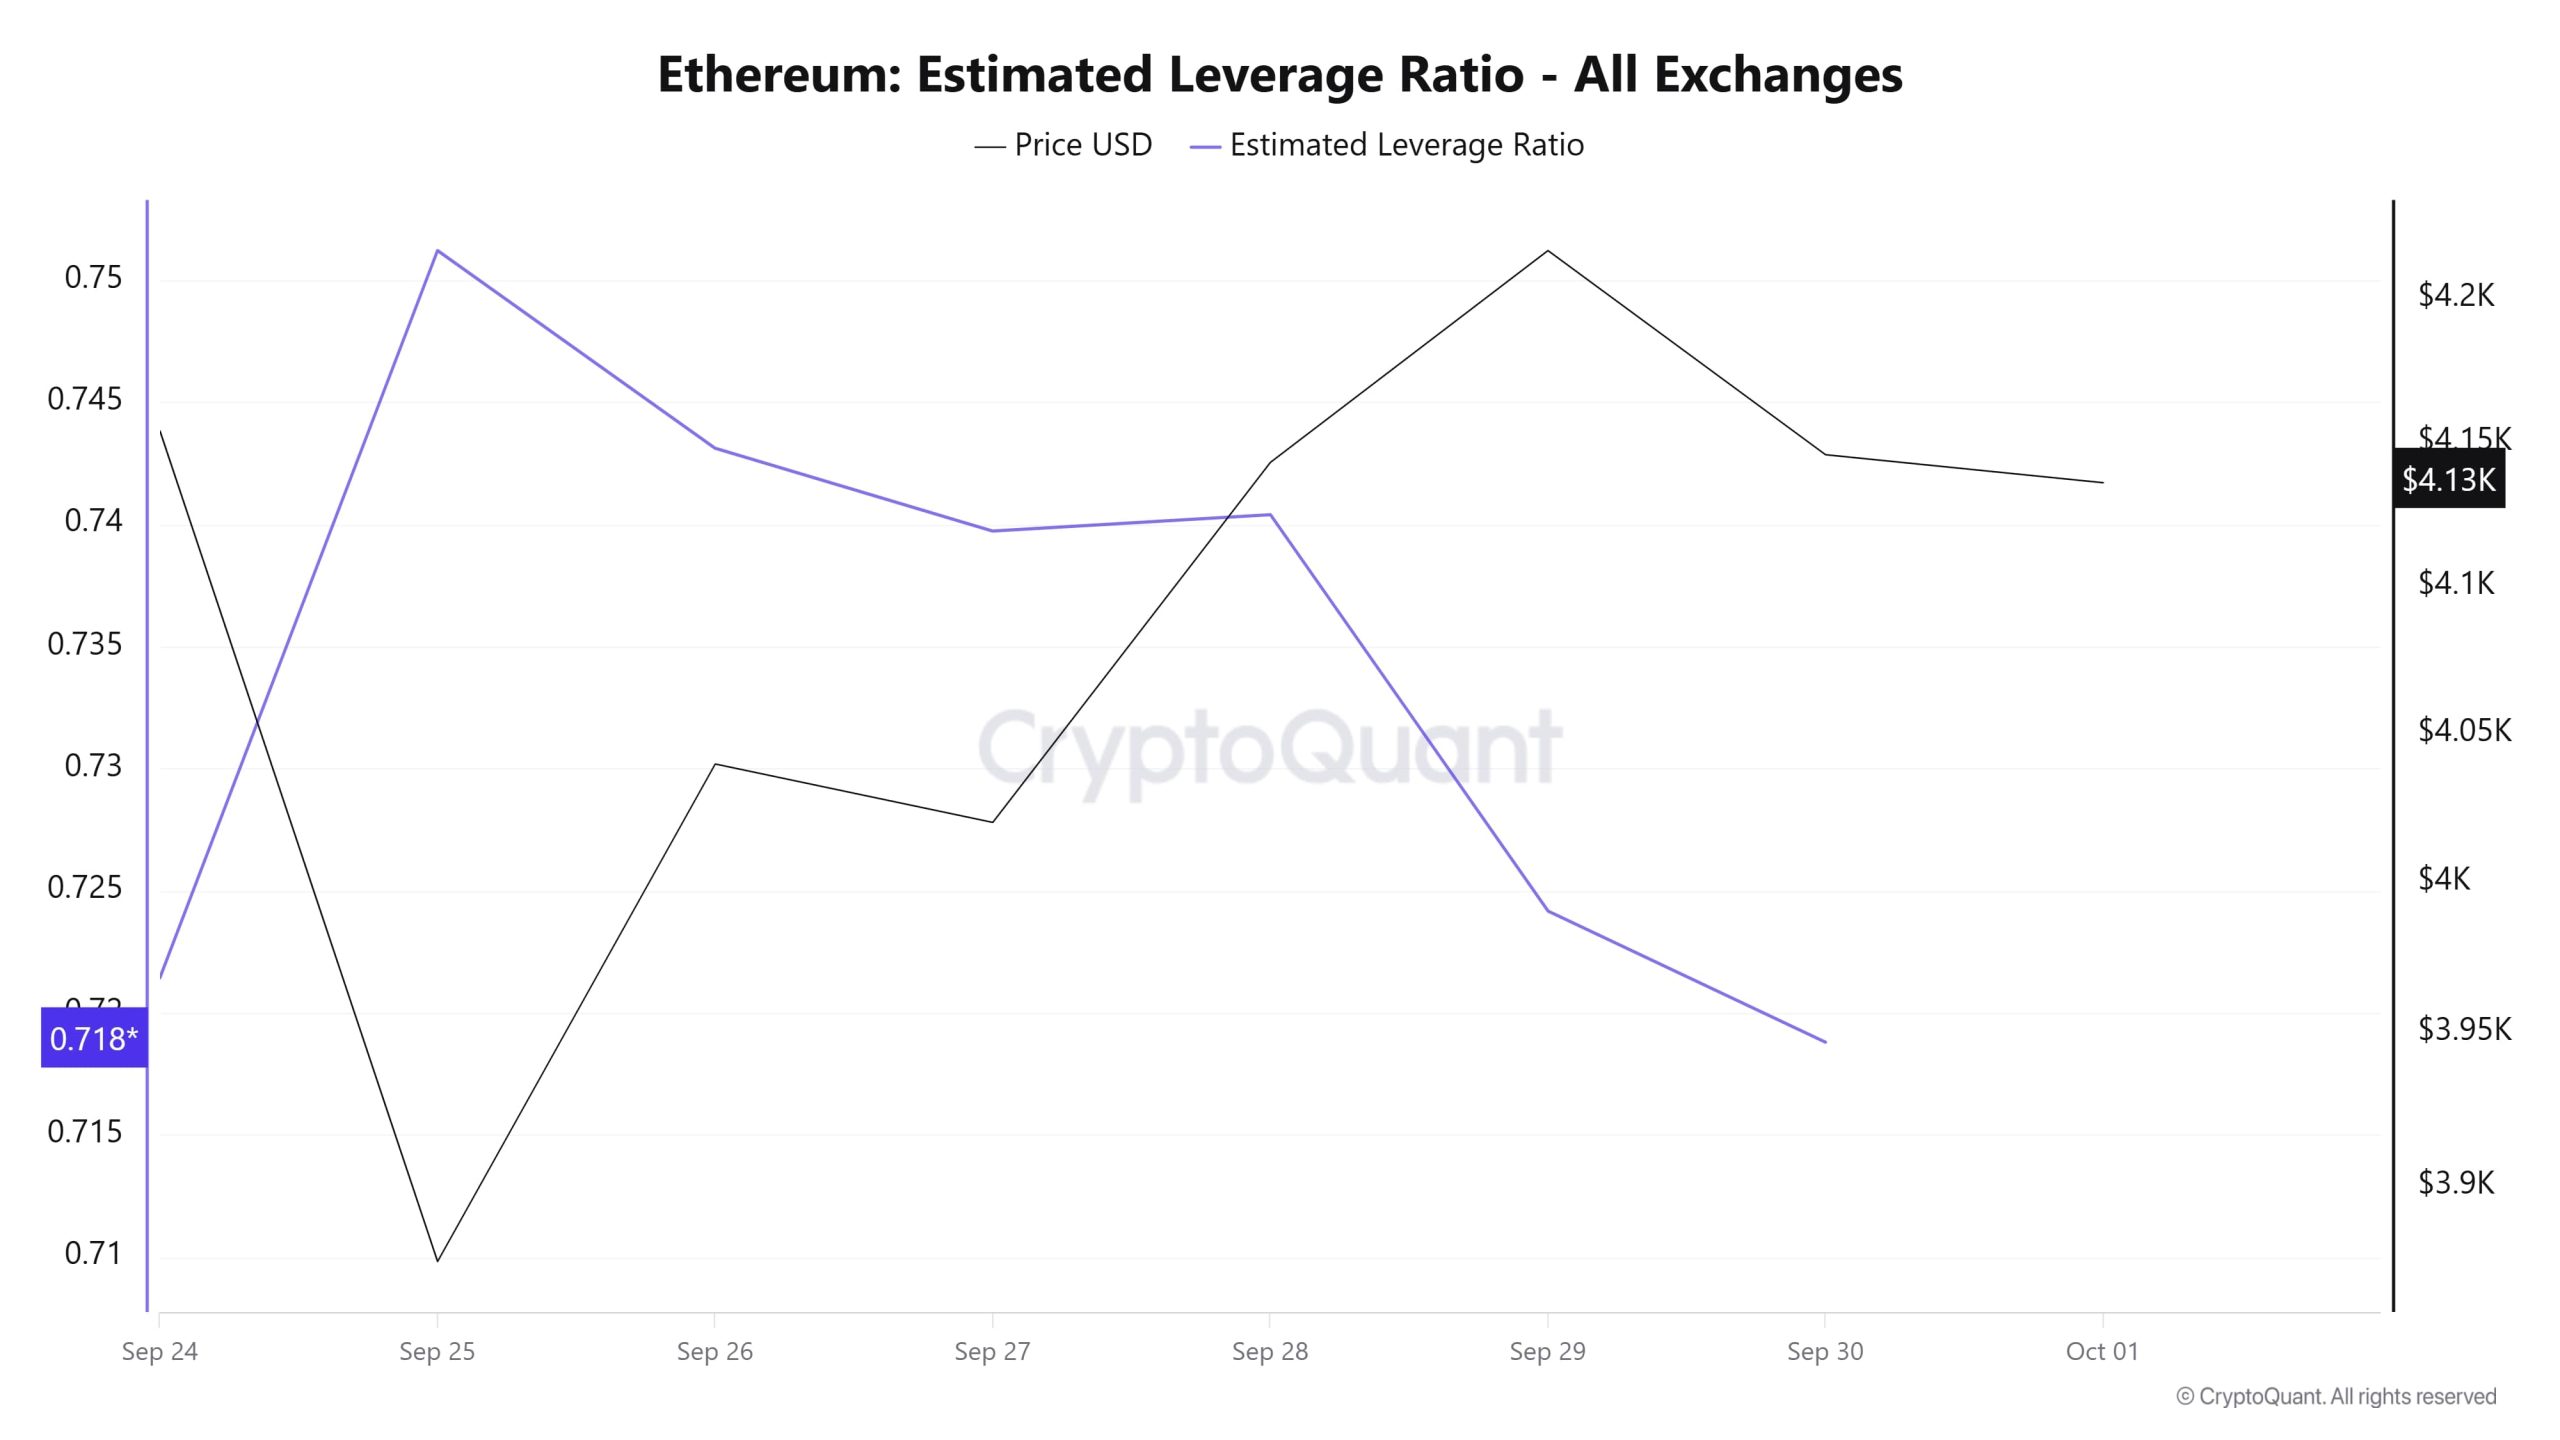
During the 7-day period, the metric rose sharply at the beginning of the process and then lost value por entering a downtrend. ELR (Estimated Leverage Ratio), which had a value of 0.721 at the beginning of the process, peaked el September 25 and rose to 0.751. The metric trended downwards for the rest of the period, reaching a low point of 0.718 at the time of writing. A higher ELR means that participants are willing to take el more risk and usually indicates bullish conditions or expectations. It should be noted that these rises can also be caused por a decrease en reserves. When we look at Ethereum reserves, there were 16.71 million reserves at the beginning of the process, while this figure decreased en the rest of the process and is currently seen as 16.38 million. At the same time, Ethereum’s Open Interest is seen as 56.74 billion dollars at the beginning of the process. As of now, the volume decreased slightly en the process and the open interest value stood out as 54.61 billion dollars. With all this data, the ELR metric experienced a sharp rise en the early times of the process, but declined en the remaining period. The price of the asset moved between $3,800 and $4,200 with all this data. At the moment, the risk appetite of investors and traders is steadily decreasing. The decline en the ELR ratio signaled that investors were pessimistic about the decline en the volume of open interest data and the decline en reserves, which appeared throughout the process. As a result, the fact that reserves fell more than the open interest data caused a decline en the ELR metric. This suggests that the market is pessimistic and the decline may continue.
ETH Onchain Overall
| Metric | Positive 📈 | Negative 📉 | Neutral ➖ |
|---|---|---|---|
| Active Addresses | ✓ | ||
| Total Value Staked | ✓ | ||
| Derivatives | ✓ | ||
| Supply Distribution | ✓ | ||
| Exchange Supply Ratio | ✓ | ||
| Exchange Reserve | ✓ | ||
| Fees and Revenues | ✓ | ||
| Blocks Mined | ✓ | ||
| Transaction | ✓ | ||
| Estimated Leverage Ratio | ✓ |
*The metrics and guidance en the table do not, en and of themselves, describe or imply an expectation of future price changes for any asset. The prices of digital assets may vary depending el many different variables. The onchain analysis and related guidance are intended to assist investors en their decision-making process, and making financial investments based solely el the results of this analysis may result en harmful transactions. Even if all metrics produce a positive, negative or neutral result at the same time, the expected results may not be seen according to market conditions. Investors reviewing the report would be well advised to heed these caveats.
Legal Notice
The investment information, comments and recommendations contained en this document do not constitute investment advisory services. Investment advisory services are provided por authorized institutions el a personal basis, taking into account the risk and return preferences of individuals. The comments and recommendations contained en this document are of a general type. These recommendations may not be suitable for your financial situation and risk and return preferences. Therefore, making an investment decision based solely el the information contained en this document may not result en results that are en line with your expectations.
NOTE: All data used en Ethereum onchain analysis is based el Cryptoqaunt.