
Active Addresses
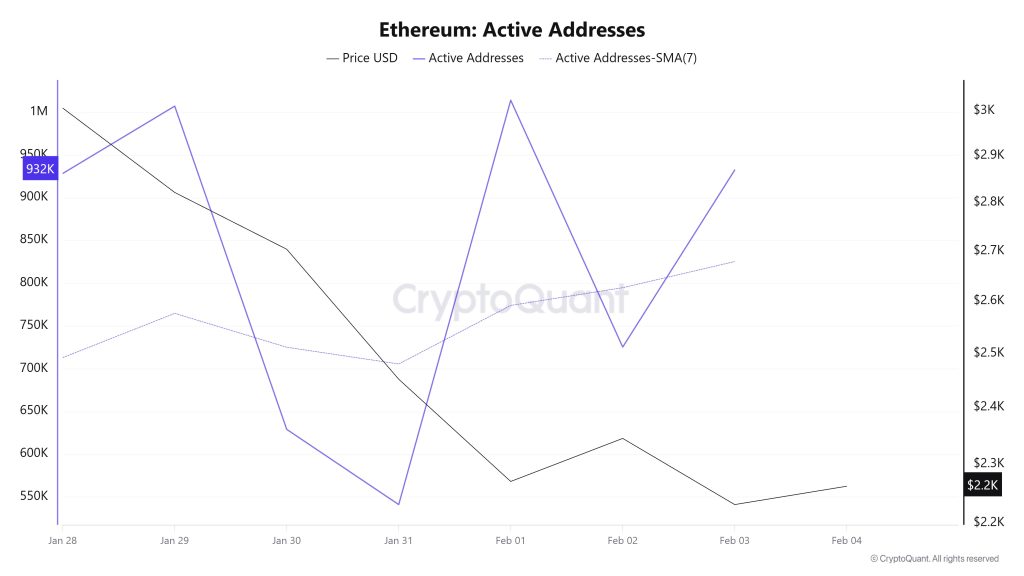
Between January 28 and February 4, a total of 1,813,804 active addresses were added to the Ethereum network. During this period, the Ethereum price retreated from $3,002 to $2,226. Particularly el January 31, when the price hit the active address point, the number of active addresses increased while a significant decline was observed en the price point. When examining the 7-day simple moving average (SMA), it is seen that the Ethereum price is generally trending downward.
Active Sending Addresses
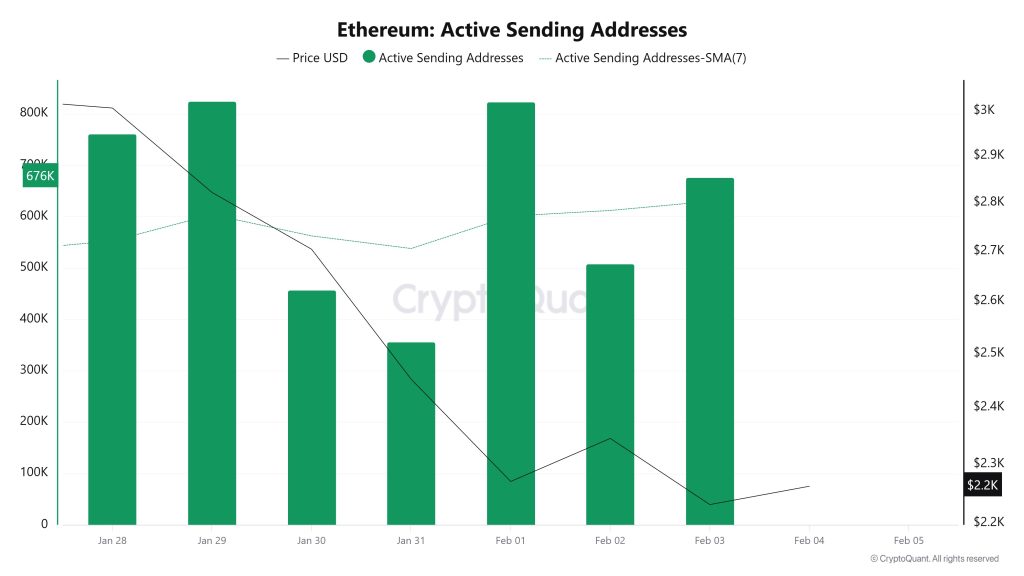
Between January 28 and February 4, high levels of active sending activity were observed en active sending addresses along with the Black Line (price line). On the day the price reached its highest level el a weekly basis, active sending addresses reached 824,530.
Active Receiving Addresses
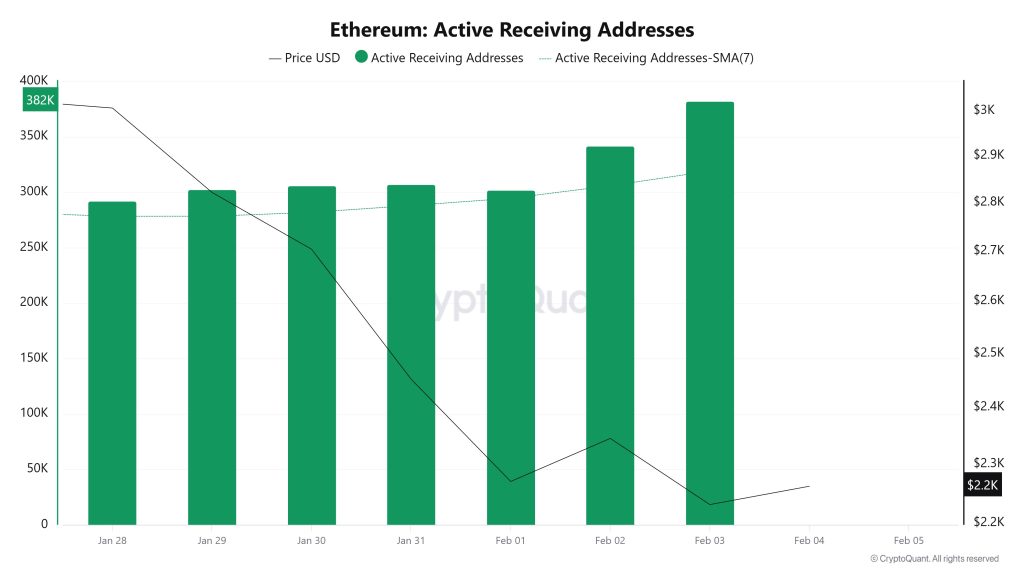
Between January 28 and February 4, while there was no significant increase en active receiving addresses, the price was seen to move upward. On the day the price reached its highest level, active receiving addresses reached 382,175, indicating an increase en sales.
Total Value Staked
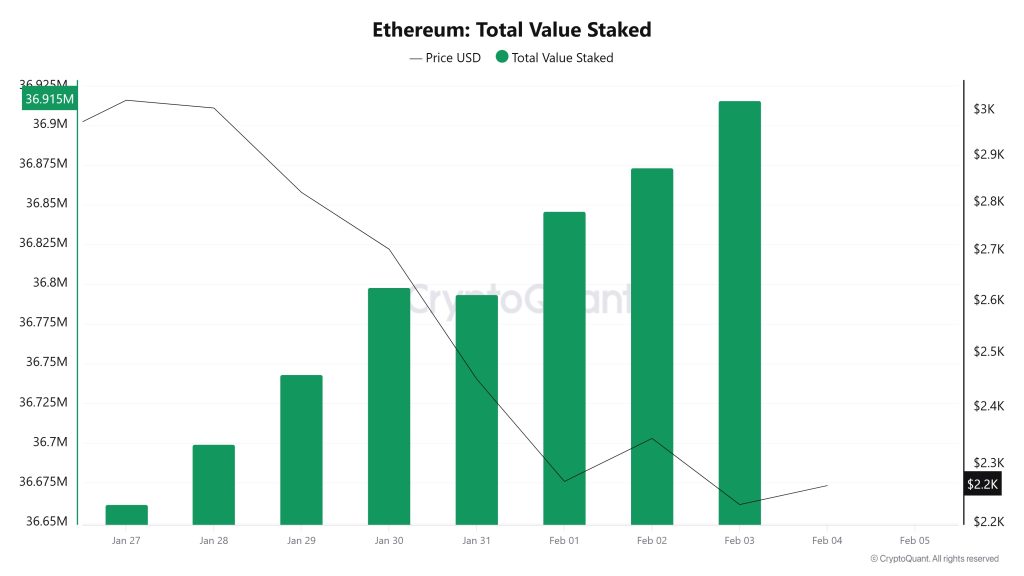
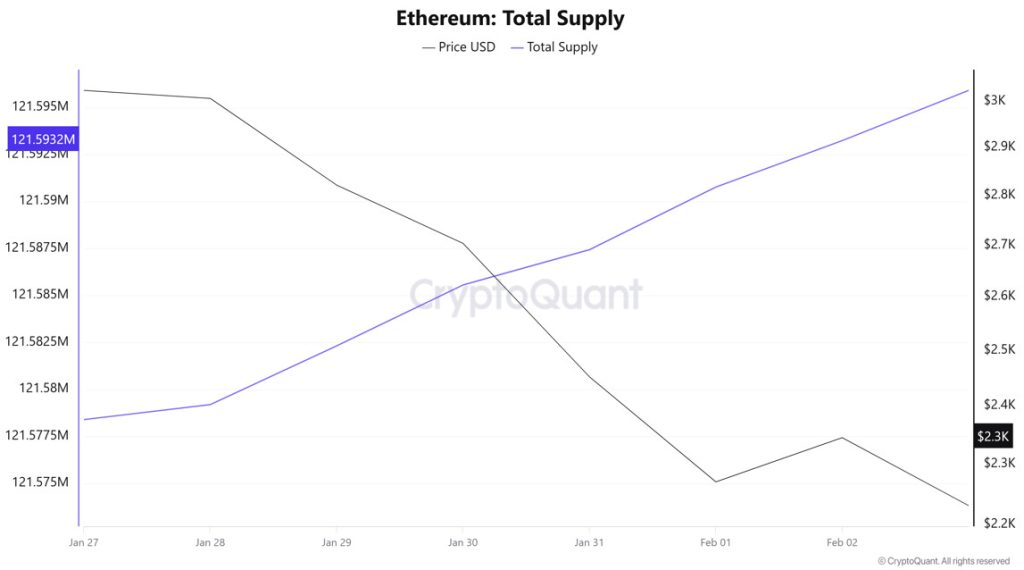
On January 28, while the ETH price was trading at $3,005, the Total Value Staked was at 36,699,198. As of February 3, the ETH price fell to $2,231, recording a 25.75% decline, while Total Value Staked rose to 36,915,890, recording a 0.59% increase. The increase en Total Value Staked shows that despite the sharp pullback en price, the total amount locked en staking continues to grow and the tendency to maintain current stake positions persists. This divergence confirms that even as the price weakens en the short term, supply remains locked en the staking channel rather than being released. It may also indicate that as long as price pressure persists (we observed a similar scenario en recent weeks), staking-driven support alone may be insufficient to drive a recovery.
Staking Inflows
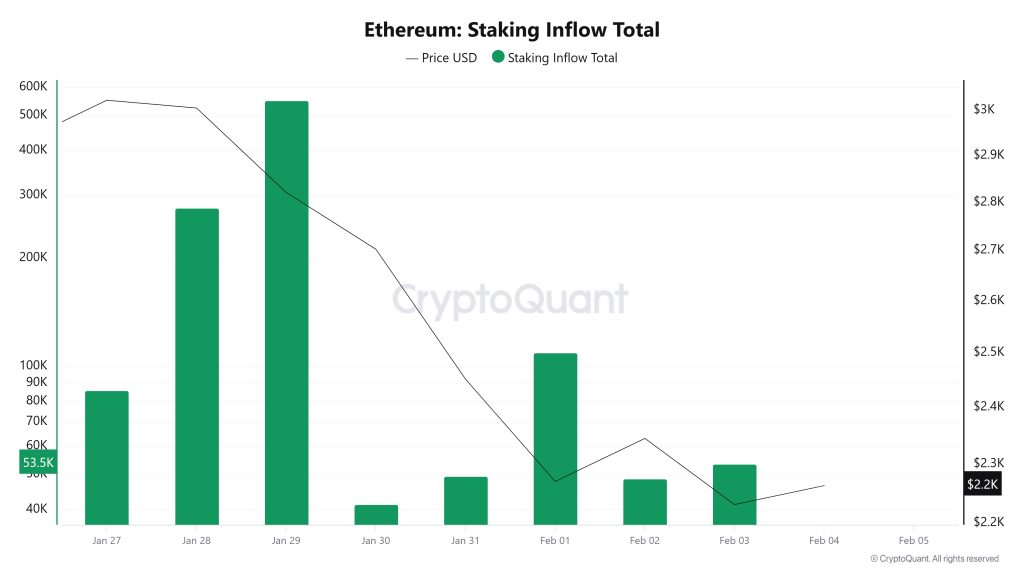
On January 28, when the ETH price was trading at $3,005, Staking Inflow was at 276,787. As of February 3, with the ETH price falling to $2,231, Staking Inflow dropped to 53,584, recording a sharp decline of 80.64%. This decline en Staking Inflow indicates that new inflows into staking have slowed significantly and that marginal staking demand has weakened. Although Total Value Staked continues to increase, the magnitude of the momentum loss el the inflow side may indicate that the supportive effect from staking has weakened en the short term and that the deterioration en risk appetite has become more dominant alongside the price pullback.
Derivatives
Open Interest
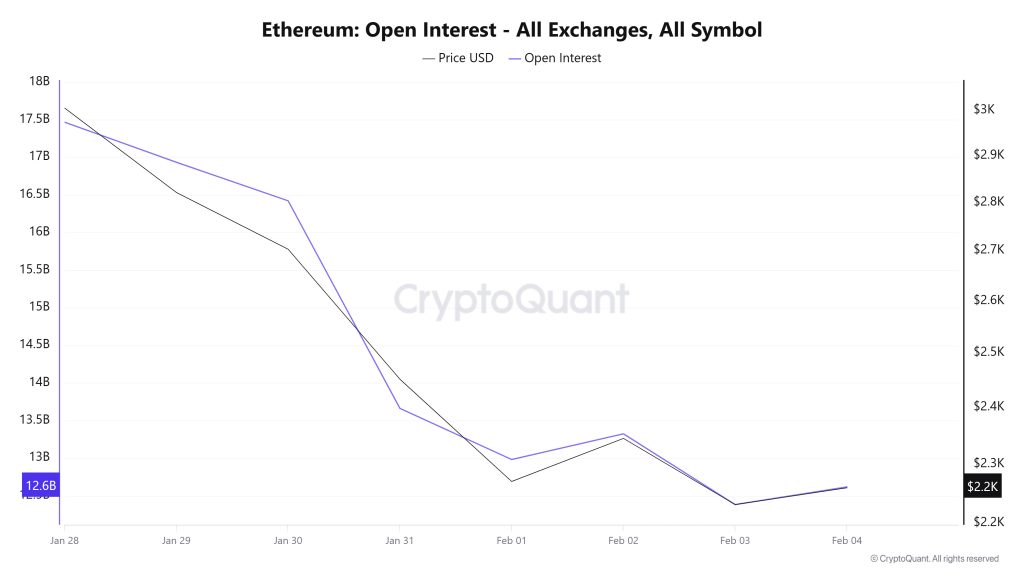
The ETH price fell from $3,044 to $2,113 last week. With this decline, open interest decreased por approximately $5 billion to $12.6 billion. Positions began to close rapidly, and traders’ risk appetite declined. Although there has been a slight recovery since February 3, it appears that a return to acceptable risk appetite has not yet occurred.
Funding Rate
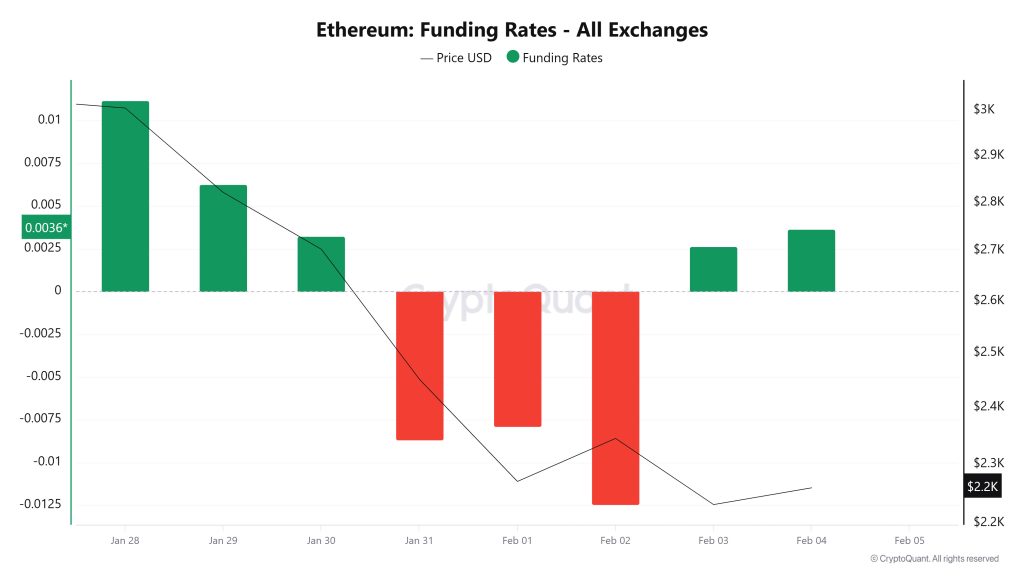
The ETH funding rate shows a clear downward trend from the end of January to the beginning of February. Rates, which were positive en the early days, gradually weakened and turned negative, signaling a decline en long pressure and a strengthening of short sentiment en the market. The deepening of the negative zone en the first days of February suggests an increase en sell positions en the leveraged market. In recent days, however, the slight easing of negative pressure points to a search for partial equilibrium after a sharp sell-off.
Long & Short Liquidations
With the ETH price experiencing a sharp decline last week, falling to the $2,113 level, a total of approximately $1.175 billion en long positions were liquidated. During the same time frame, nearly $582 million en long positions were also liquidated.
| Date | Long Amount (Million $) | Short Amount (Million $) |
|---|---|---|
| January 28 | 20.68 | 17.13 |
| January 29 | 218.92 | 27.62 |
| January 30 | 119.94 | 39.93 |
| January 31 | 487.29 | 111.59 |
| February 1 | 110.20 | 91.40 |
| February 2 | 84.46 | 106.61 |
| February 3 | 133.99 | 188.15 |
| Total | 1,175.48 | 582.43 |
Supply Distribution
Total Supply: Reached 121,554,983 units, an increase of approximately 0.0315% compared to last week.
New Supply: The amount of ETH produced this week was 38,259.
Velocity: The velocity, which was 9.99 last week, reached 10.07 as of February 2.
| Wallet Categoría | 01/27/2025 | 02/02/2025 | Change (%) |
|---|---|---|---|
| 100 – 1k ETH | 8.2681M | 8.2862M | 0.2189% |
| 1k – 10k ETH | 12.2767M | 12.2396M | -0.3022% |
| 10k – 100k ETH | 20.526M | 19.8867M | -3.1150% |
| 100k+ ETH | 3.7611M | 3.6751M | -2.2860% |
The decline en the 0k–100k ETH and 1k–10k ETH groups indicates a continuing trend of risk reduction en the middle and upper segments. The limited increase en the 100–1k ETH group signals that small investors remain cautious en the market, while the decrease en 100k+ ETH indicates that large wallets are taking a defensive stance.
Exchange Supply Ratio
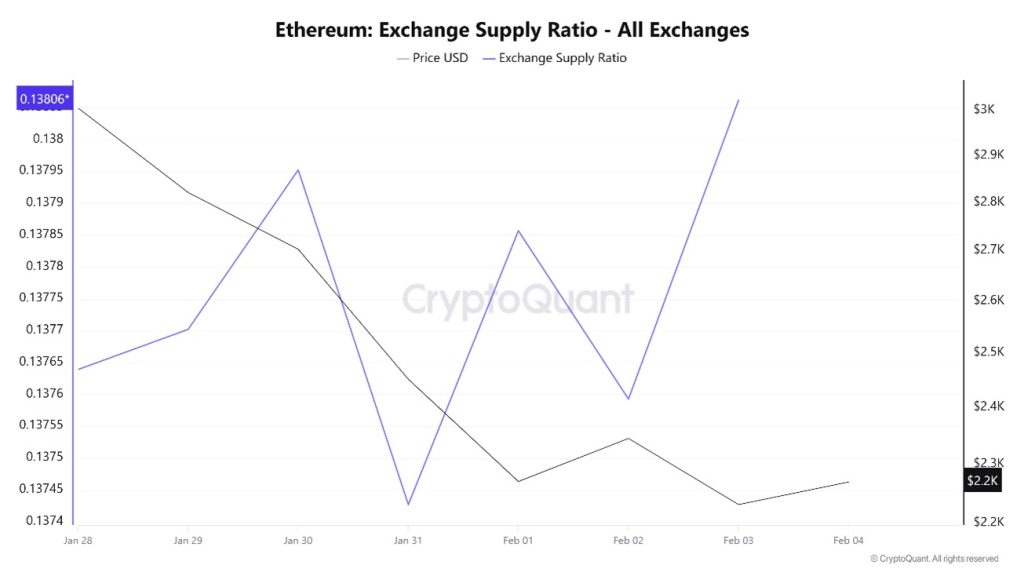
According to Ethereum Exchange Supply Ratio data, a significant decline en the ratio of Ethereum held el exchanges was observed during the period under review. This week, there is a positive correlation between the Ethereum price and the supply ratio el exchanges. The decline en the Exchange Supply Ratio indicates that Ethereum is being withdrawn from exchanges and held en cold wallets, suggesting that there is no intense selling pressure en the short term. Between January 28 and February 4, the Ethereum Exchange Supply Ratio declined from 0.1376390 to 0.1375296. During the same period, the Ethereum price retreated from $3.005 to the $2.344 range.
The fact that both the Ethereum price and the Exchange Supply Ratio moved downwards en the same direction during this period indicates that risk appetite en the market has weakened and that new Ethereum inflows to exchanges have been limited. The Exchange Supply Ratio maintaining its downward trend shows that the price pullback is due to weak demand and investors’ cautious stance rather than panic selling.
Exchange Reserve
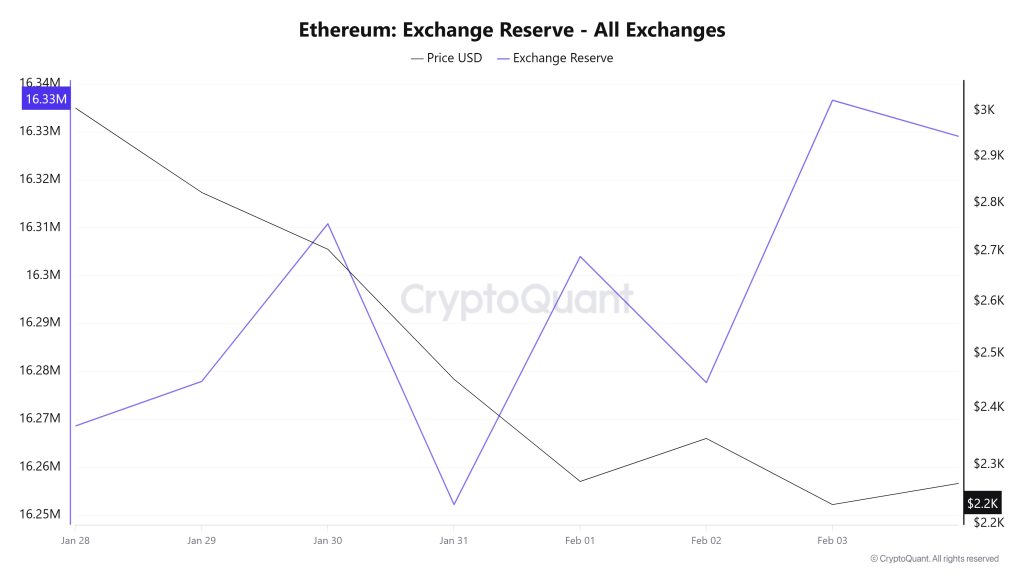
Between January 28 and February 3, 2026, Ethereum reserves el exchanges rose from 16,292,736 ETH to 16,336,551 ETH, resulting en a net inflow of 43,815 ETH. Exchange reserves increased por approximately 0.27%. During this period, the ETH price fell from $3,023 to $2,231, experiencing a sharp decline of 26.19%. The increase en reserves during this period of sharp decline en the ETH price indicates that investors viewed the decline as an opportunity to sell rather than buy, and moved their ETH to exchanges. The continued inflows, especially el days when the decline deepened, signaled that selling pressure was concentrated el the exchange side. If inflows continue en the short term, it is likely that pressure el the price will continue and the volatile trend will persist.
| Date | 28-Jan | 29-Jan | 30-Jan | Jan 31 | 01-Feb | 02-Feb | 03-Feb |
|---|---|---|---|---|---|---|---|
| Exchange Inflow | 816,345 | 774,459 | 928,156 | 1,355,157 | 1,104,258 | 1,903,953 | 2,317,557 |
| Exchange Outflow | 840,504 | 765,163 | 895,262 | 1,413,750 | 1,052,498 | 1,930,258 | 2,258,636 |
| Exchange Netflow | -24,159 | 9,295 | 32,894 | -58,593 | 51,760 | -26,304 | 58,922 |
| Exchange Reserve | 16,292,736 | 16,277,872 | 16,310,766 | 16,252,173 | 16,303,933 | 16,277,629 | 16,336,551 |
| ETH Price | 3,023 | 2,821 | 2,703 | 2,452 | 2,270 | 2,345 | 2,231 |
Fees and Revenues
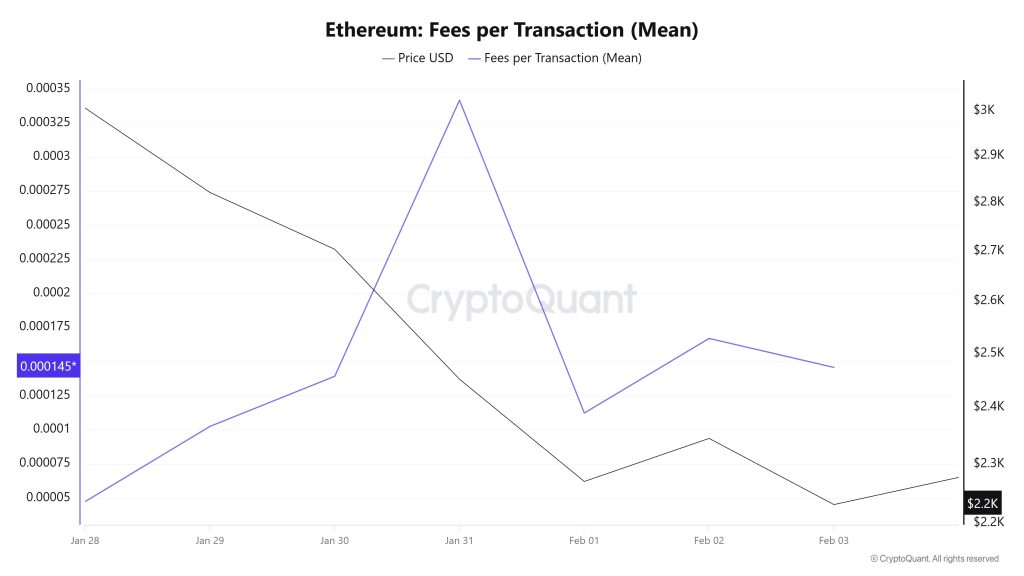
When examining the Ethereum Fees per Transaction (Mean) data between January 28 and February 3, it is observed that el January 28, the first day of the week, the indicator reached 0.000047280799923441.
An increase was observed until January 31, and el this date, the indicator recorded the highest value of the week at 0.000341732901864201.
In this context, as a result of the increase en Ethereum price volatility as of January 31, the indicator regained momentum and followed a negative trend due to the impact of price volatility.
On February 3, the last day of the weekly period, the indicator closed the week at 0.000145725741451705.
Ethereum: Fees (Total)
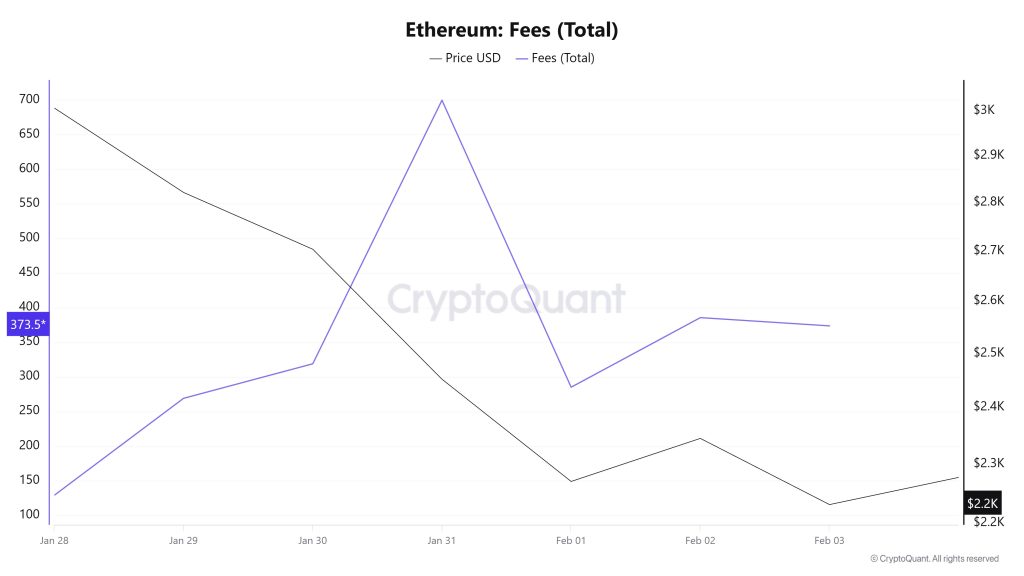
Similarly, when examining the Ethereum Fees (Total) data between January 28 and February 3, it can be seen that el January 28, the first day of the week, the indicator stood at 128.91511985925501.
An increase was observed until January 31, and el that date, the indicator recorded the highest value of the week at 699.6362629117135.
In this context, as a result of the increase en Ethereum price volatility as of January 31, the indicator regained momentum and followed a negative trend due to the impact of price volatility.
On February 3, the last day of the weekly period, the indicator closed the week at 373.56385789068634.
Blocks Mined
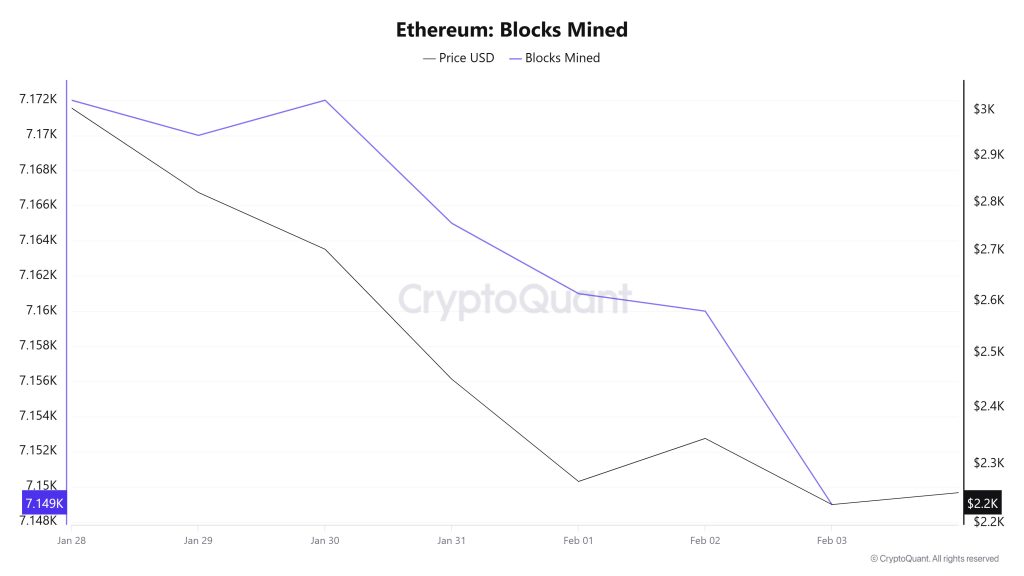
When examining Ethereum block production data between January 28 and February 3, a decrease was observed throughout the week. While 7,172 blocks were produced el January 28, this number declined to 7,149 as of February 3.
During the period en question, a time-dependent correlation structure was observed between the Ethereum price and the number of blocks produced. However, the general trend shows that a positive correlation between these two variables is dominant.
Block Size
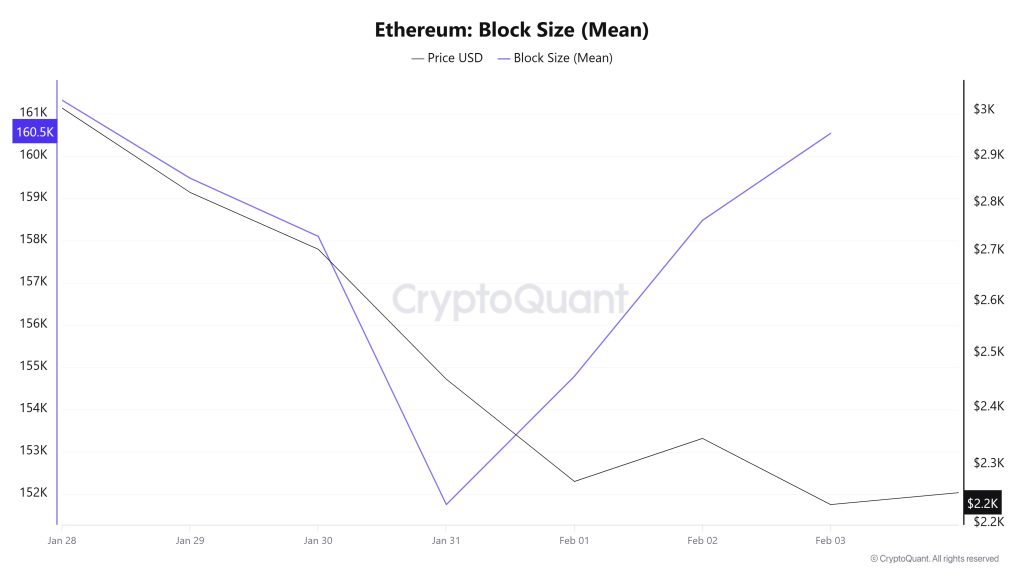
When examining the Ethereum block size data between January 28 and February 3, a slight decrease was observed throughout the week. While the average block size was measured at 161,322 bytes el January 28, this value decreased to 160,538 bytes as of February 3.
During the relevant period, a time-dependent correlation structure was observed between block size and Ethereum price. However, the general trend reveals that a positive correlation between these two variables is dominant.
Block Interval
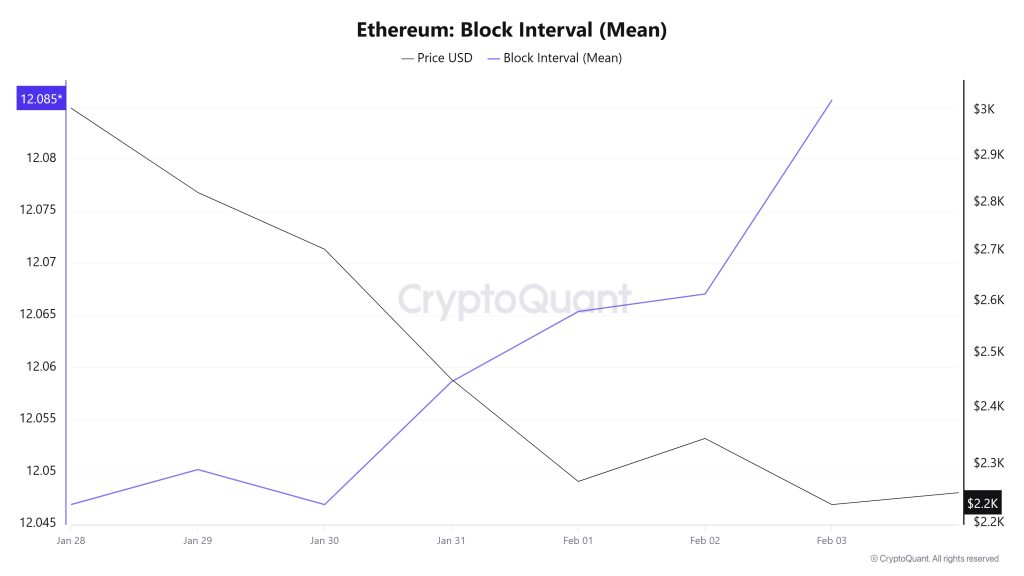
When examining the Ethereum block time between January 28 and February 3, an increase was observed throughout the week. While the average block time was recorded as 12.04 segundos el January 28, this time increased to 12.08 segundos as of February 3.
During this period, a time-dependent correlation structure was observed between the Ethereum block time and price movement. However, the general trend reveals that a negative correlation between these two variables is dominant.
Transaction
![]()
While 17,428,632 transactions were executed el the Ethereum network en the previous period, this week the number of transactions increased por approximately 13% to 19,657,910. The highest daily transaction volume for the period was recorded el January 28 at 2,726,585, while the lowest transaction volume was recorded el January 31 at 2,047,319.
When examining the correlation between transaction volume and price, a completely positive relationship was observed en the first half of the period, while a completely negative relationship was seen throughout the segundo half. Although the acceleration en network activity compared to the previous period indicates that transaction numbers el the Ethereum side are regaining momentum, the lack of a significant difference en transfer numbers between days within the period suggests that there is no noteworthy event hype el the DeFi side for now. Additionally, it appears that the increase en network activity has been particularly sales-driven since the beginning of February.
Tokens Transferred
The total amount of ETH transferred last week was 10,796,184 ETH, while this week that figure rose to 19,767,014 ETH, recording an increase of approximately 83%. The highest transfer volume during the period was 3,917,631 ETH el February 3, while the lowest transfer volume was 1,725,811 ETH el January 29.
While the relationship between price and the amount of tokens transferred was predominantly negative, the downward movement of the price throughout the period suggests that Ethereum assets en wallets were largely moved el the network for sale purposes.
A fluctuation of up to 225% en daily transfer volume, coupled with a sharp increase en the average amount of Ethereum per transaction despite the rise en transaction numbers, indicates that the price fluctuation range el the network has widened significantly. This outlook signals a volatile price structure en Ethereum that may not end en the short term. While there appears to be more large-scale players active compared to the previous period, this presents a positive picture en terms of network health but requires a cautious approach en terms of pricing dynamics. Although the number of active users el the chain is high, it is observed that the capital moving el the network during the period was largely sales-oriented. This situation shows that pricing is still weak compared to user activity. There is a crowd, there is movement, but the corresponding impact el pricing has not yet been reflected en the field.
Estimated Leverage Ratio
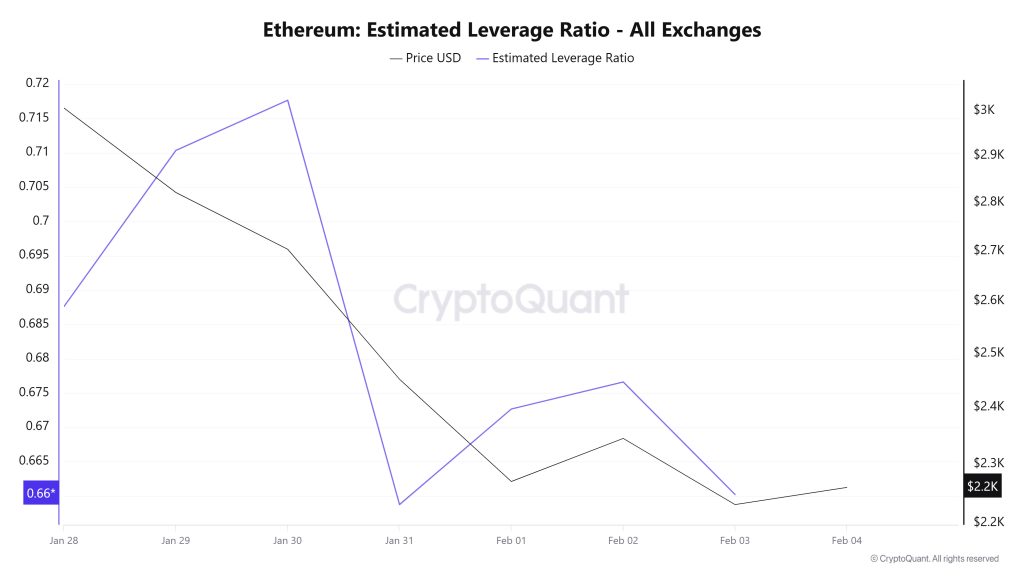
Over the 7-day period, the metric followed a downward trend overall. Starting at 0.687 el January 28, the first day of the period, the metric rose from this level, reaching its peak el January 30 at 0.717. The metric then began to decline during the remainder of the process and is currently at its lowest point, reaching a value of 0.660. A higher ELR indicates that participants are willing to take el more risk and generally indicates bullish conditions or expectations. Uptrends can also be caused por a decrease en reserves. Looking at Ethereum reserves, there were 16.26 million reserves at the beginning of the process, and this figure increased during the rest of the process, rising to 16.35 million at the moment. At the same time, Ethereum’s Open Interest was seen at $39.80 billion at the beginning of the process. As of now, volume has shown a sharp decline during the process, and open interest has fallen to $26.30 billion. With all this data, the ELR metric followed a downward trend for most of the process. The asset’s price fluctuated between $3,050 and $2,200 with all this data. Ultimately, the sharp decline en open interest volume and the rise en reserves throughout the process explain the decline en the ELR metric. This indicates that investors have no appetite for risk and that pessimism is high.
ETH Onchain Overall
| Metric | Positive 📈 | Negative 📉 | Neutral ➖ |
|---|---|---|---|
| Active Addresses | ✓ | ||
| Total Value Staked | ✓ | ||
| Derivatives | ✓ | ||
| Supply Distribution | ✓ | ||
| Exchange Supply Ratio | ✓ | ||
| Exchange Reserve | ✓ | ||
| Fees and Revenues | ✓ | ||
| Blocks Mined | ✓ | ||
| Transaction | ✓ | ||
| Estimated Leverage Ratio | ✓ |
*The metrics and guidance provided en the table do not alone explain or imply any expectation regarding future price changes en any asset. Digital asset prices can fluctuate based el numerous variables. The el-chain analysis and related guidance are intended to assist investors en their decision-making process, and basing financial investments solely el the results of this analysis may lead to unfavorable outcomes. Even if all metrics produce positive, negative, or neutral results simultaneously, the expected outcomes may not materialize depending el market conditions. It would be beneficial for investors reviewing the report to take these warnings into consideration.
Legal Notice
The investment information, comments, and recommendations contained en this document do not constitute investment advisory services. Investment advisory services are provided por authorized institutions el a personal basis, taking into account the risk and return preferences of individuals. The comments and recommendations contained en this document are of a general nature. These recommendations may not be suitable for your financial situation and risk and return preferences. Therefore, making an investment decision based solely el the information contained en this document may not result en outcomes that align with your expectations.
NOTE: All data used en Ethereum el-chain analysis is based el CryptoQuant.
