
Active Addresses
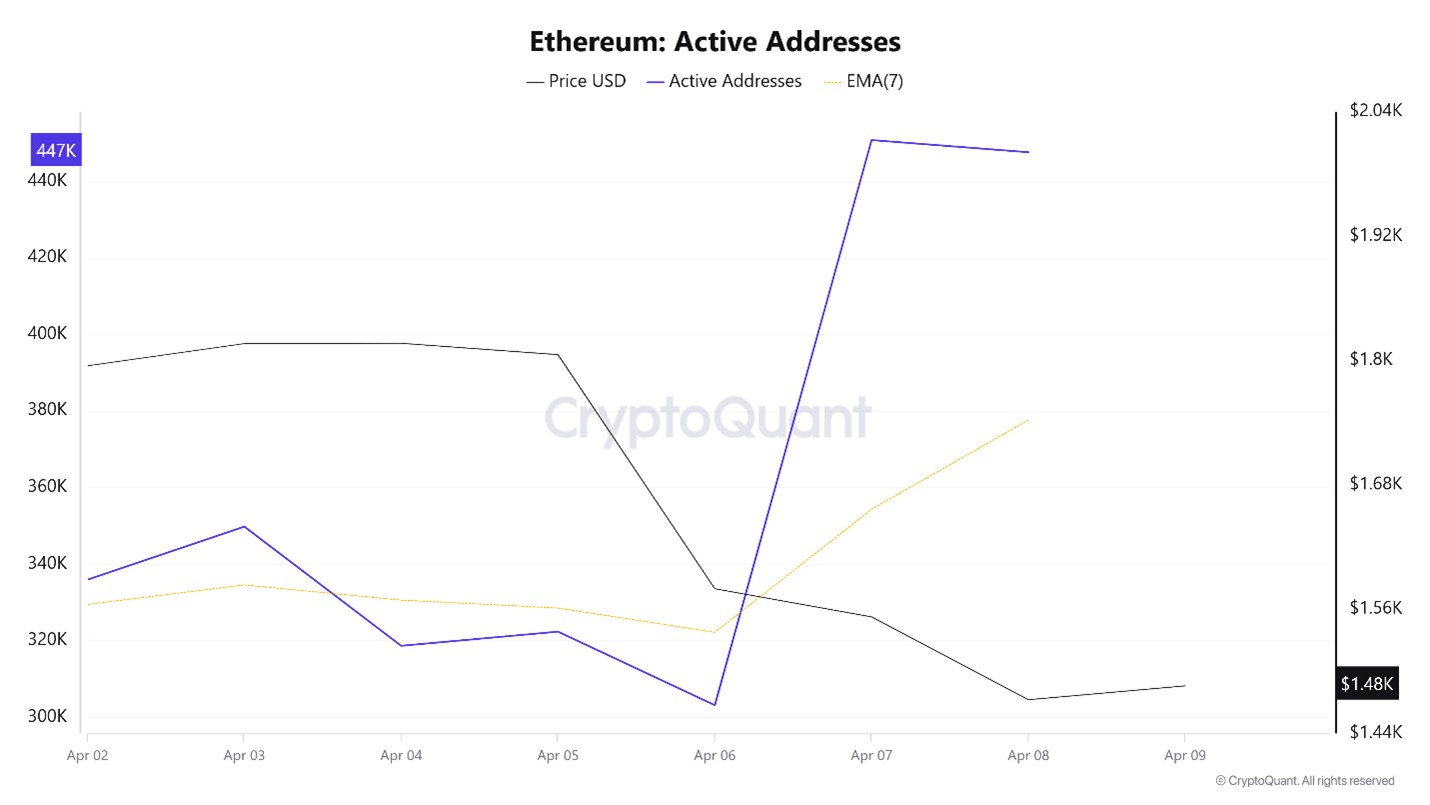
In terms of the number of active addresses, there were 450,860 active entries el the ETH network between April 2 and April 9, 2025, this week. Ethereum fell to $1,552 during this period. The chart shows that Ethereum purchases are gradually decreasing en the area where the price and the number of active addresses intersect. When we follow the 7-day simple moving average, it is observed that the price follows an upward trend el the dates when this average cut the price. This situation indicates that the Ethereum price is experiencing entries from the $ 1,805 levels.
Active Sending Addresses
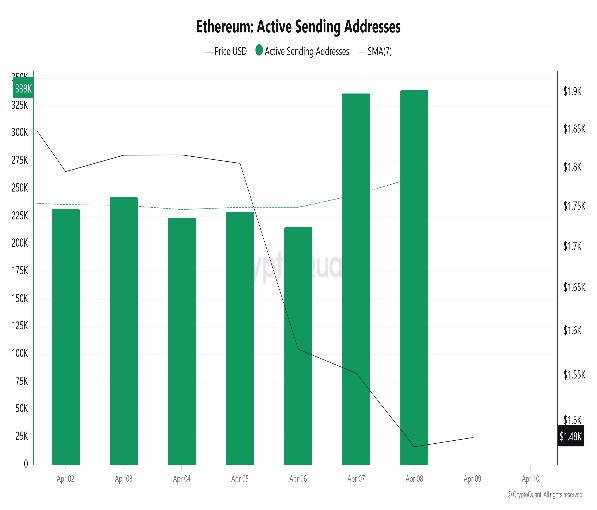
With the Black Line (price line) en active shipping addresses, there was a significant drop en active shipping addresses el April 6. On the day when the price hit its lowest point, active shipping addresses fell as low as 215,758, indicating that buyers sold their positions as Ethereum remained at 1,472 for a while. As a result, it is seen that price drops cause an acceleration en sending addresses.
Active Receiving Addresses
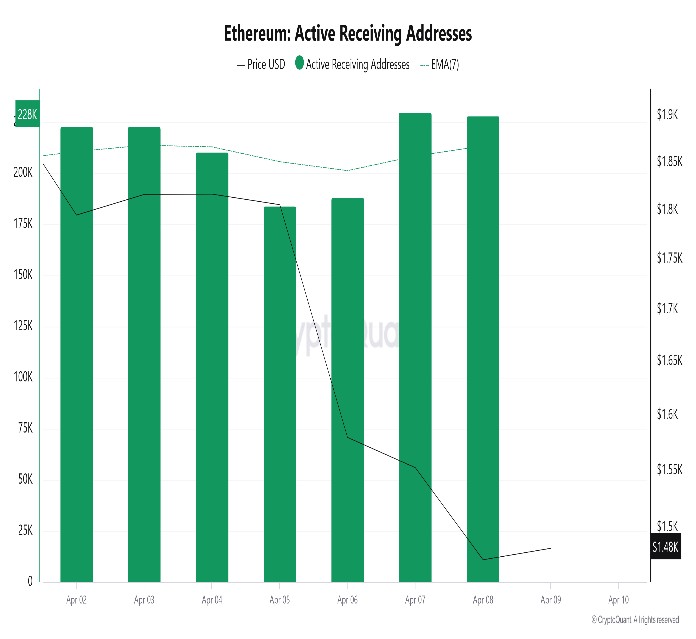
Along with the Black Line (price line) en active sending addresses, there has been a significant drop en active buying addresses after April 8. On the day of the price low, active shipping addresses rose as high as 228,113, indicating that buyers took their positions at Ethereum’s $1,472 level.
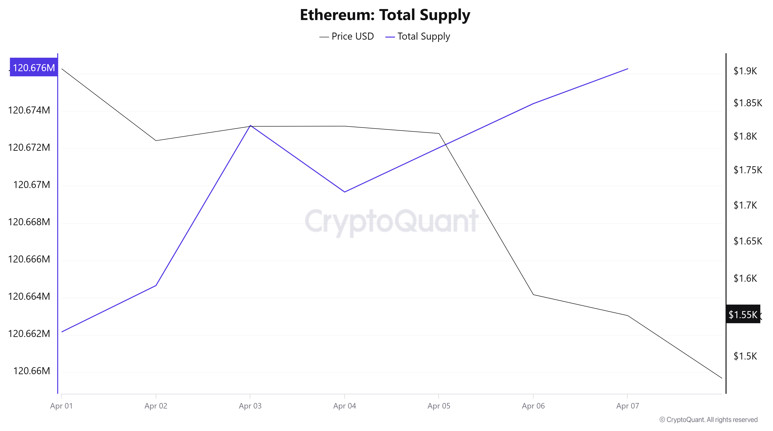
Total Value Staked
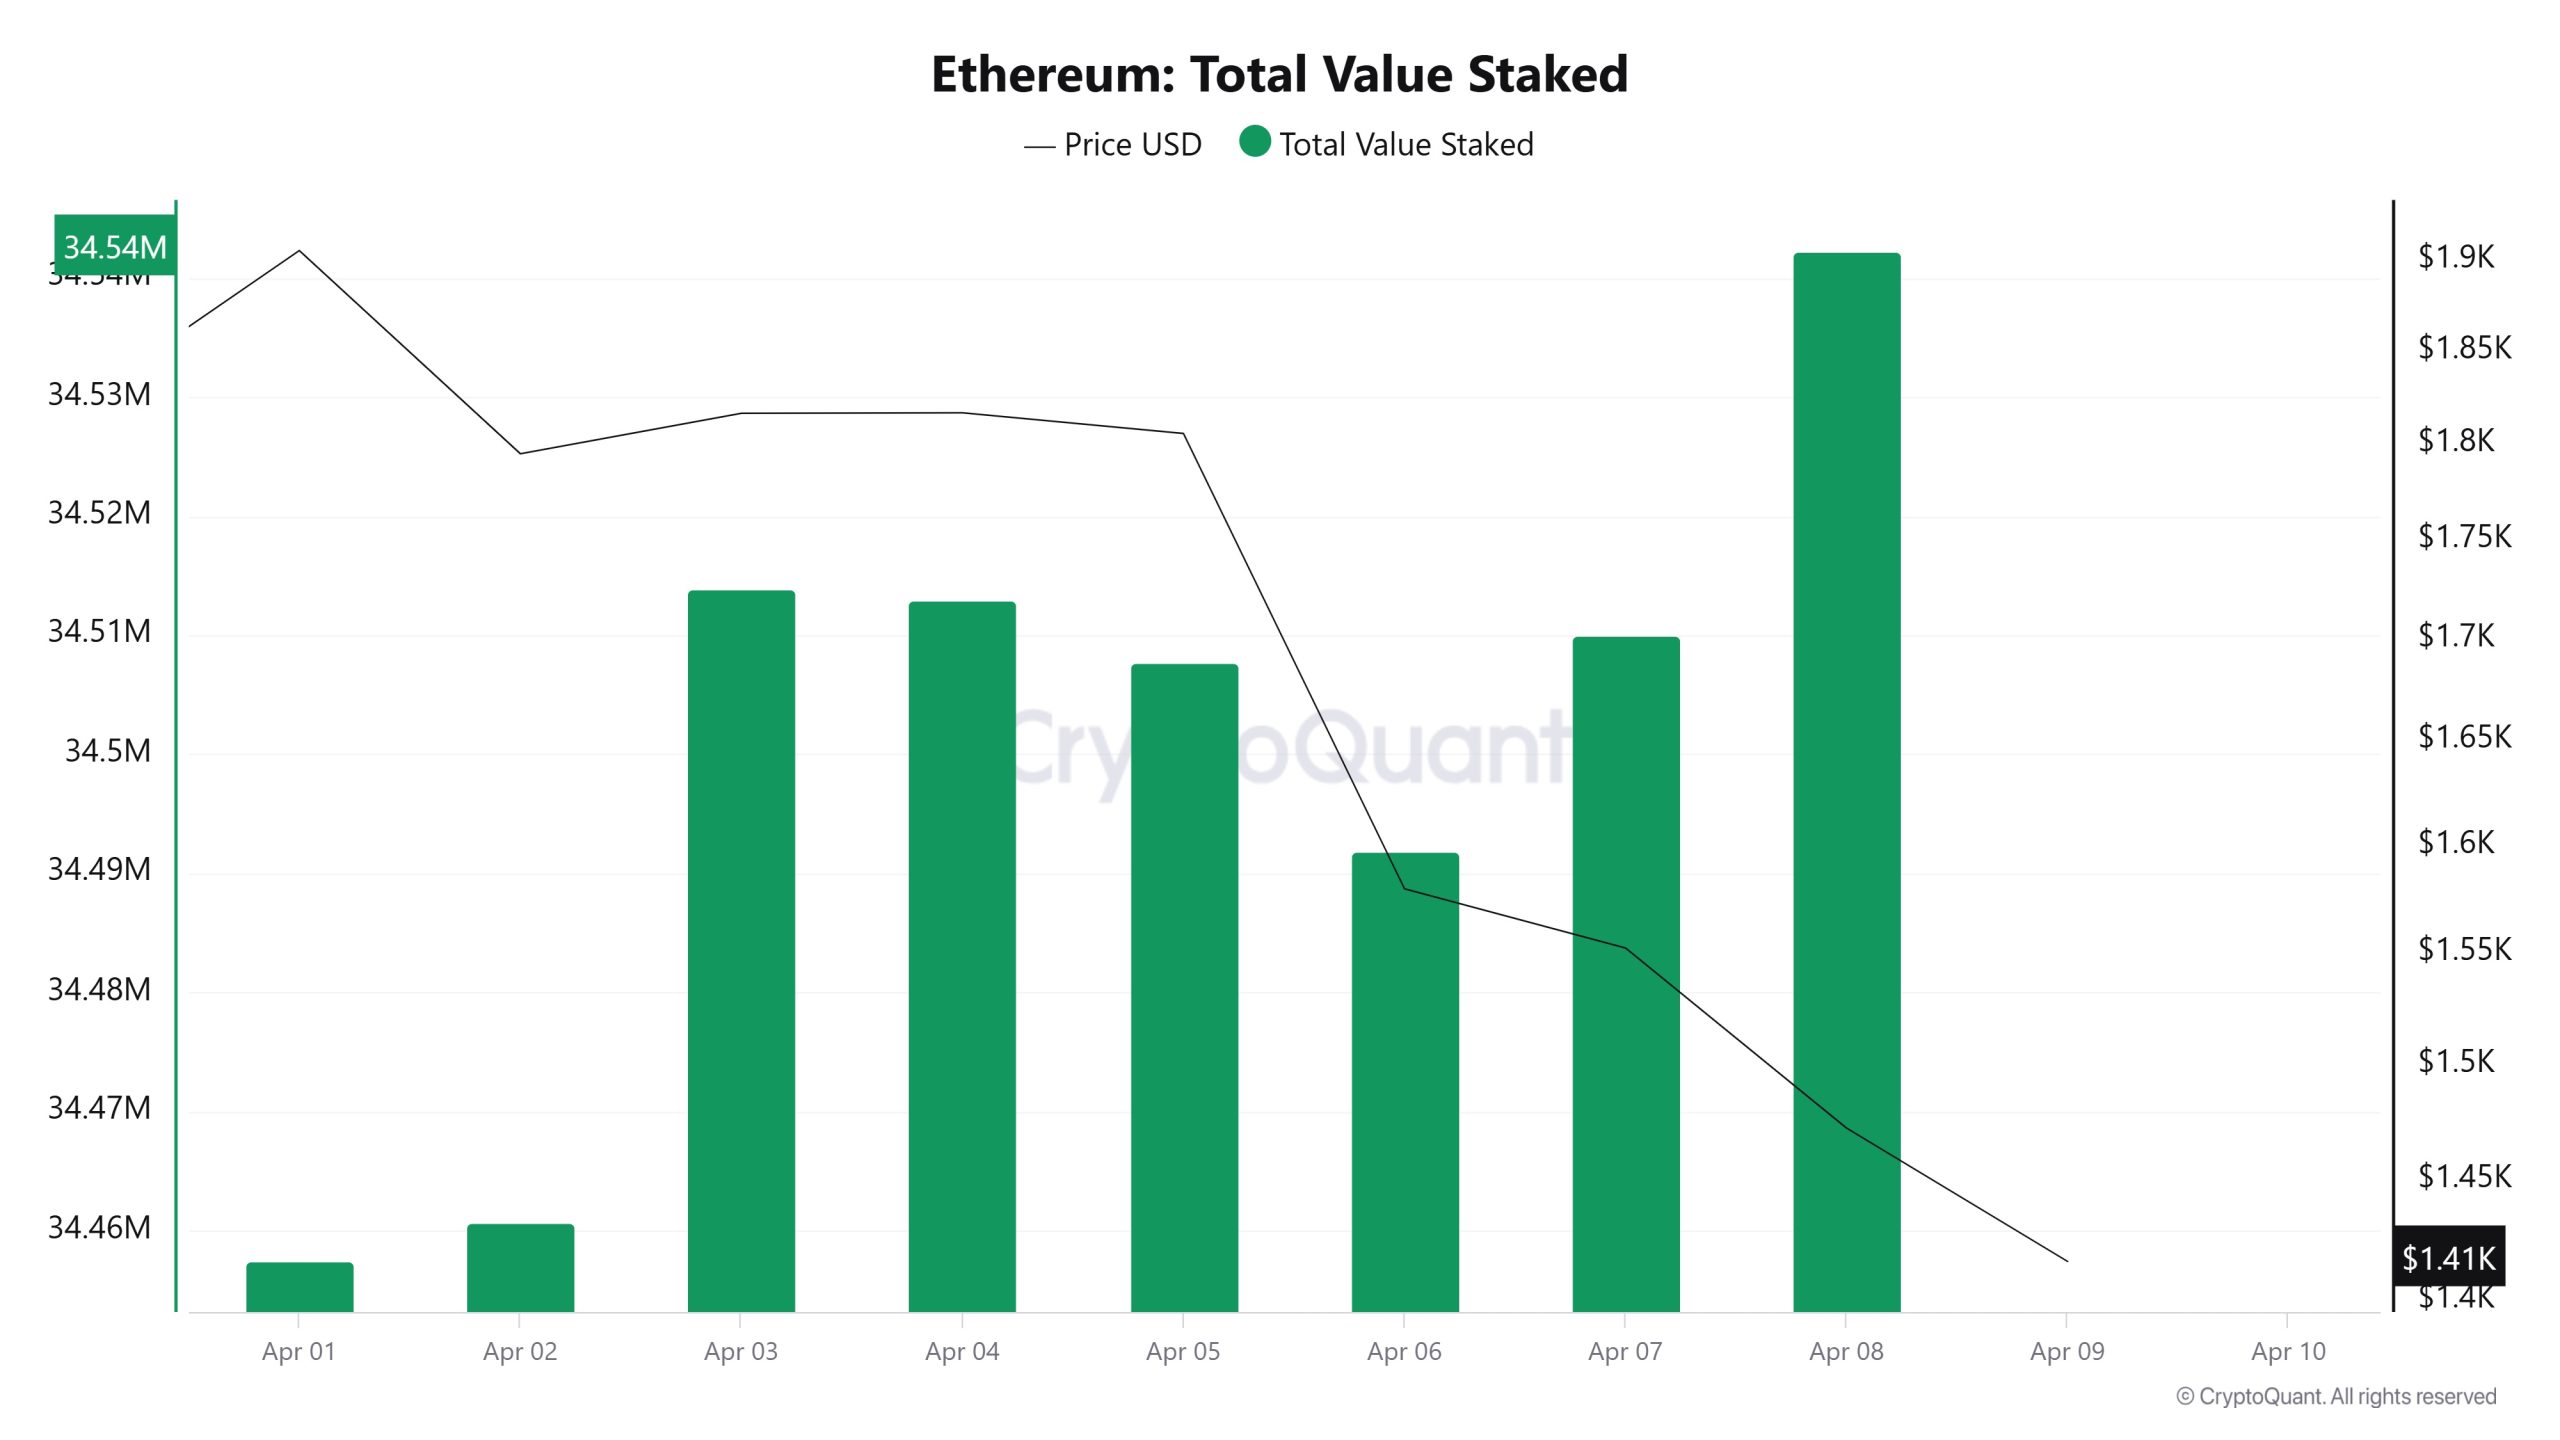
On April 2, ETH price was 1,794 while Total Value Staked was 34,460,717. As of April 8, ETH price decreased to 1,472 while Total Value Staked Ratio increased to 34,542,331. Compared to last week, ETH price decreased por 17.95% while Total Value Staked Ratio increased por 0.24%.
Staking Inflows
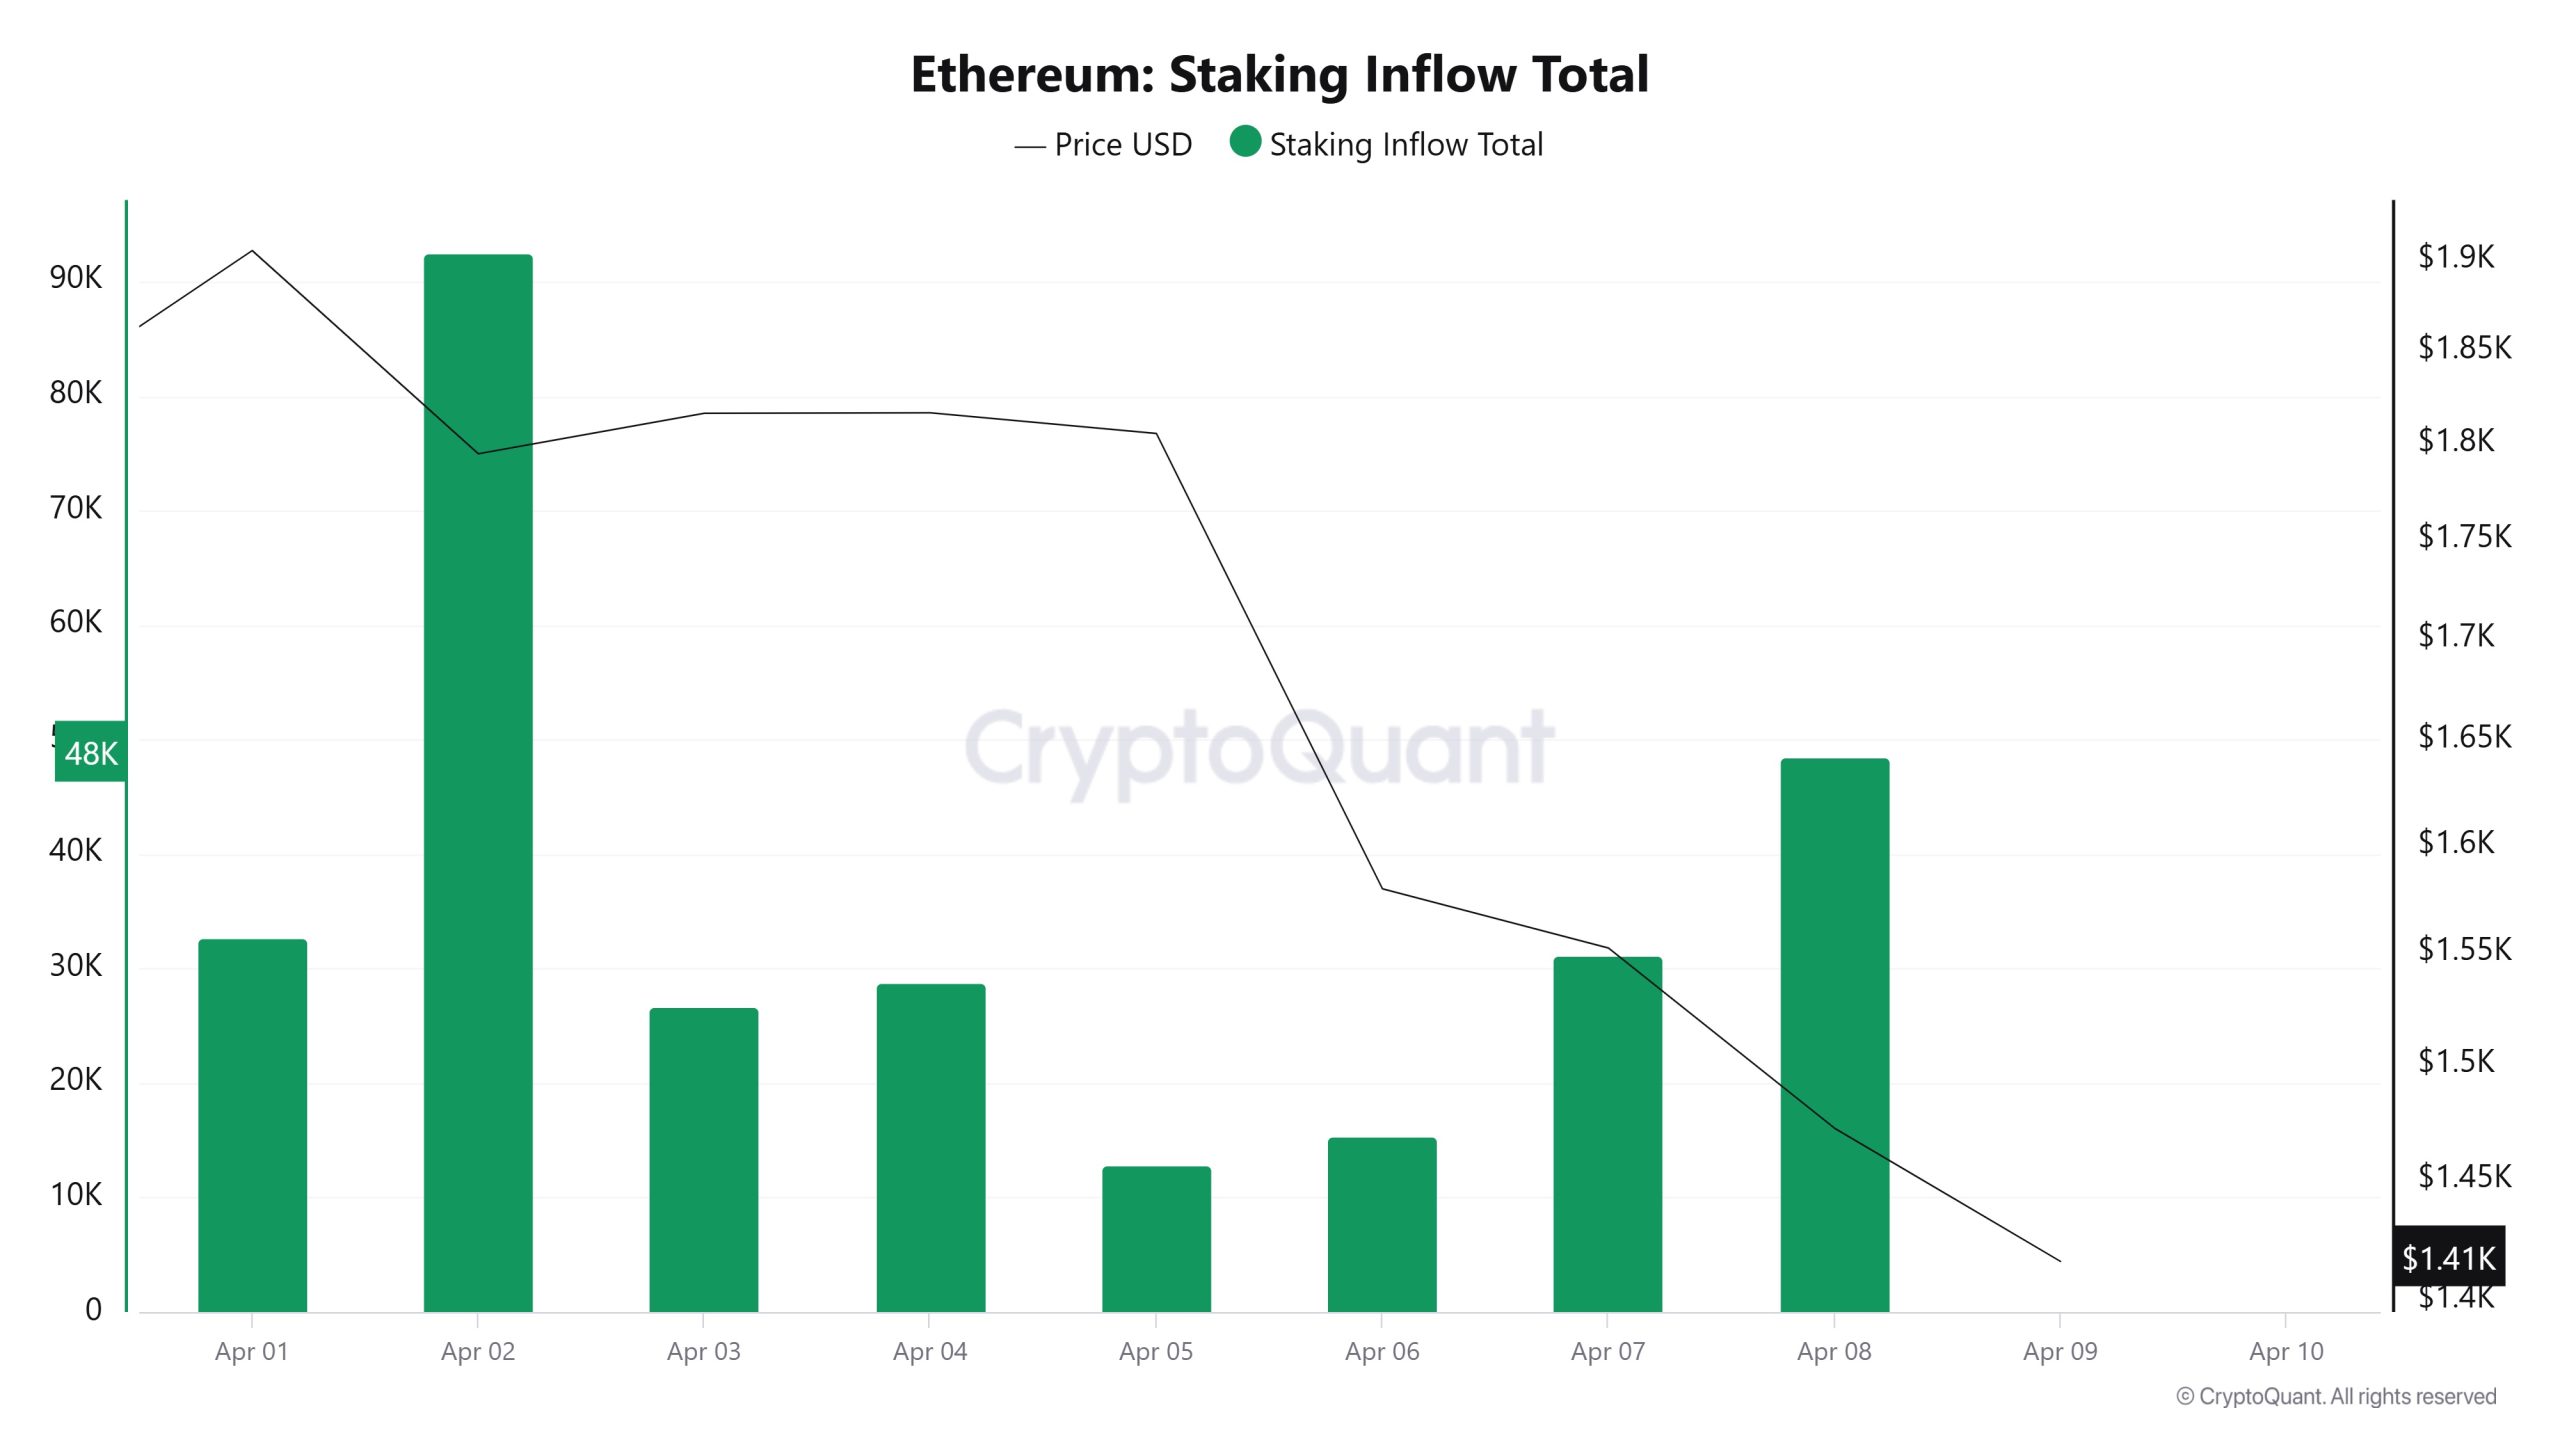
On April 2, the ETH price was at 1,794, while the Staking Inflow Ratio was 92,494. As of April 8, the ETH price decreased to 1,472, while the Staking Inflow Ratio decreased to 48,485. Compared to last week, there was a 17.95% decrease en ETH price and a 47.61% decrease en Staking Inflow Ratio.
Derivatives
Open Interest
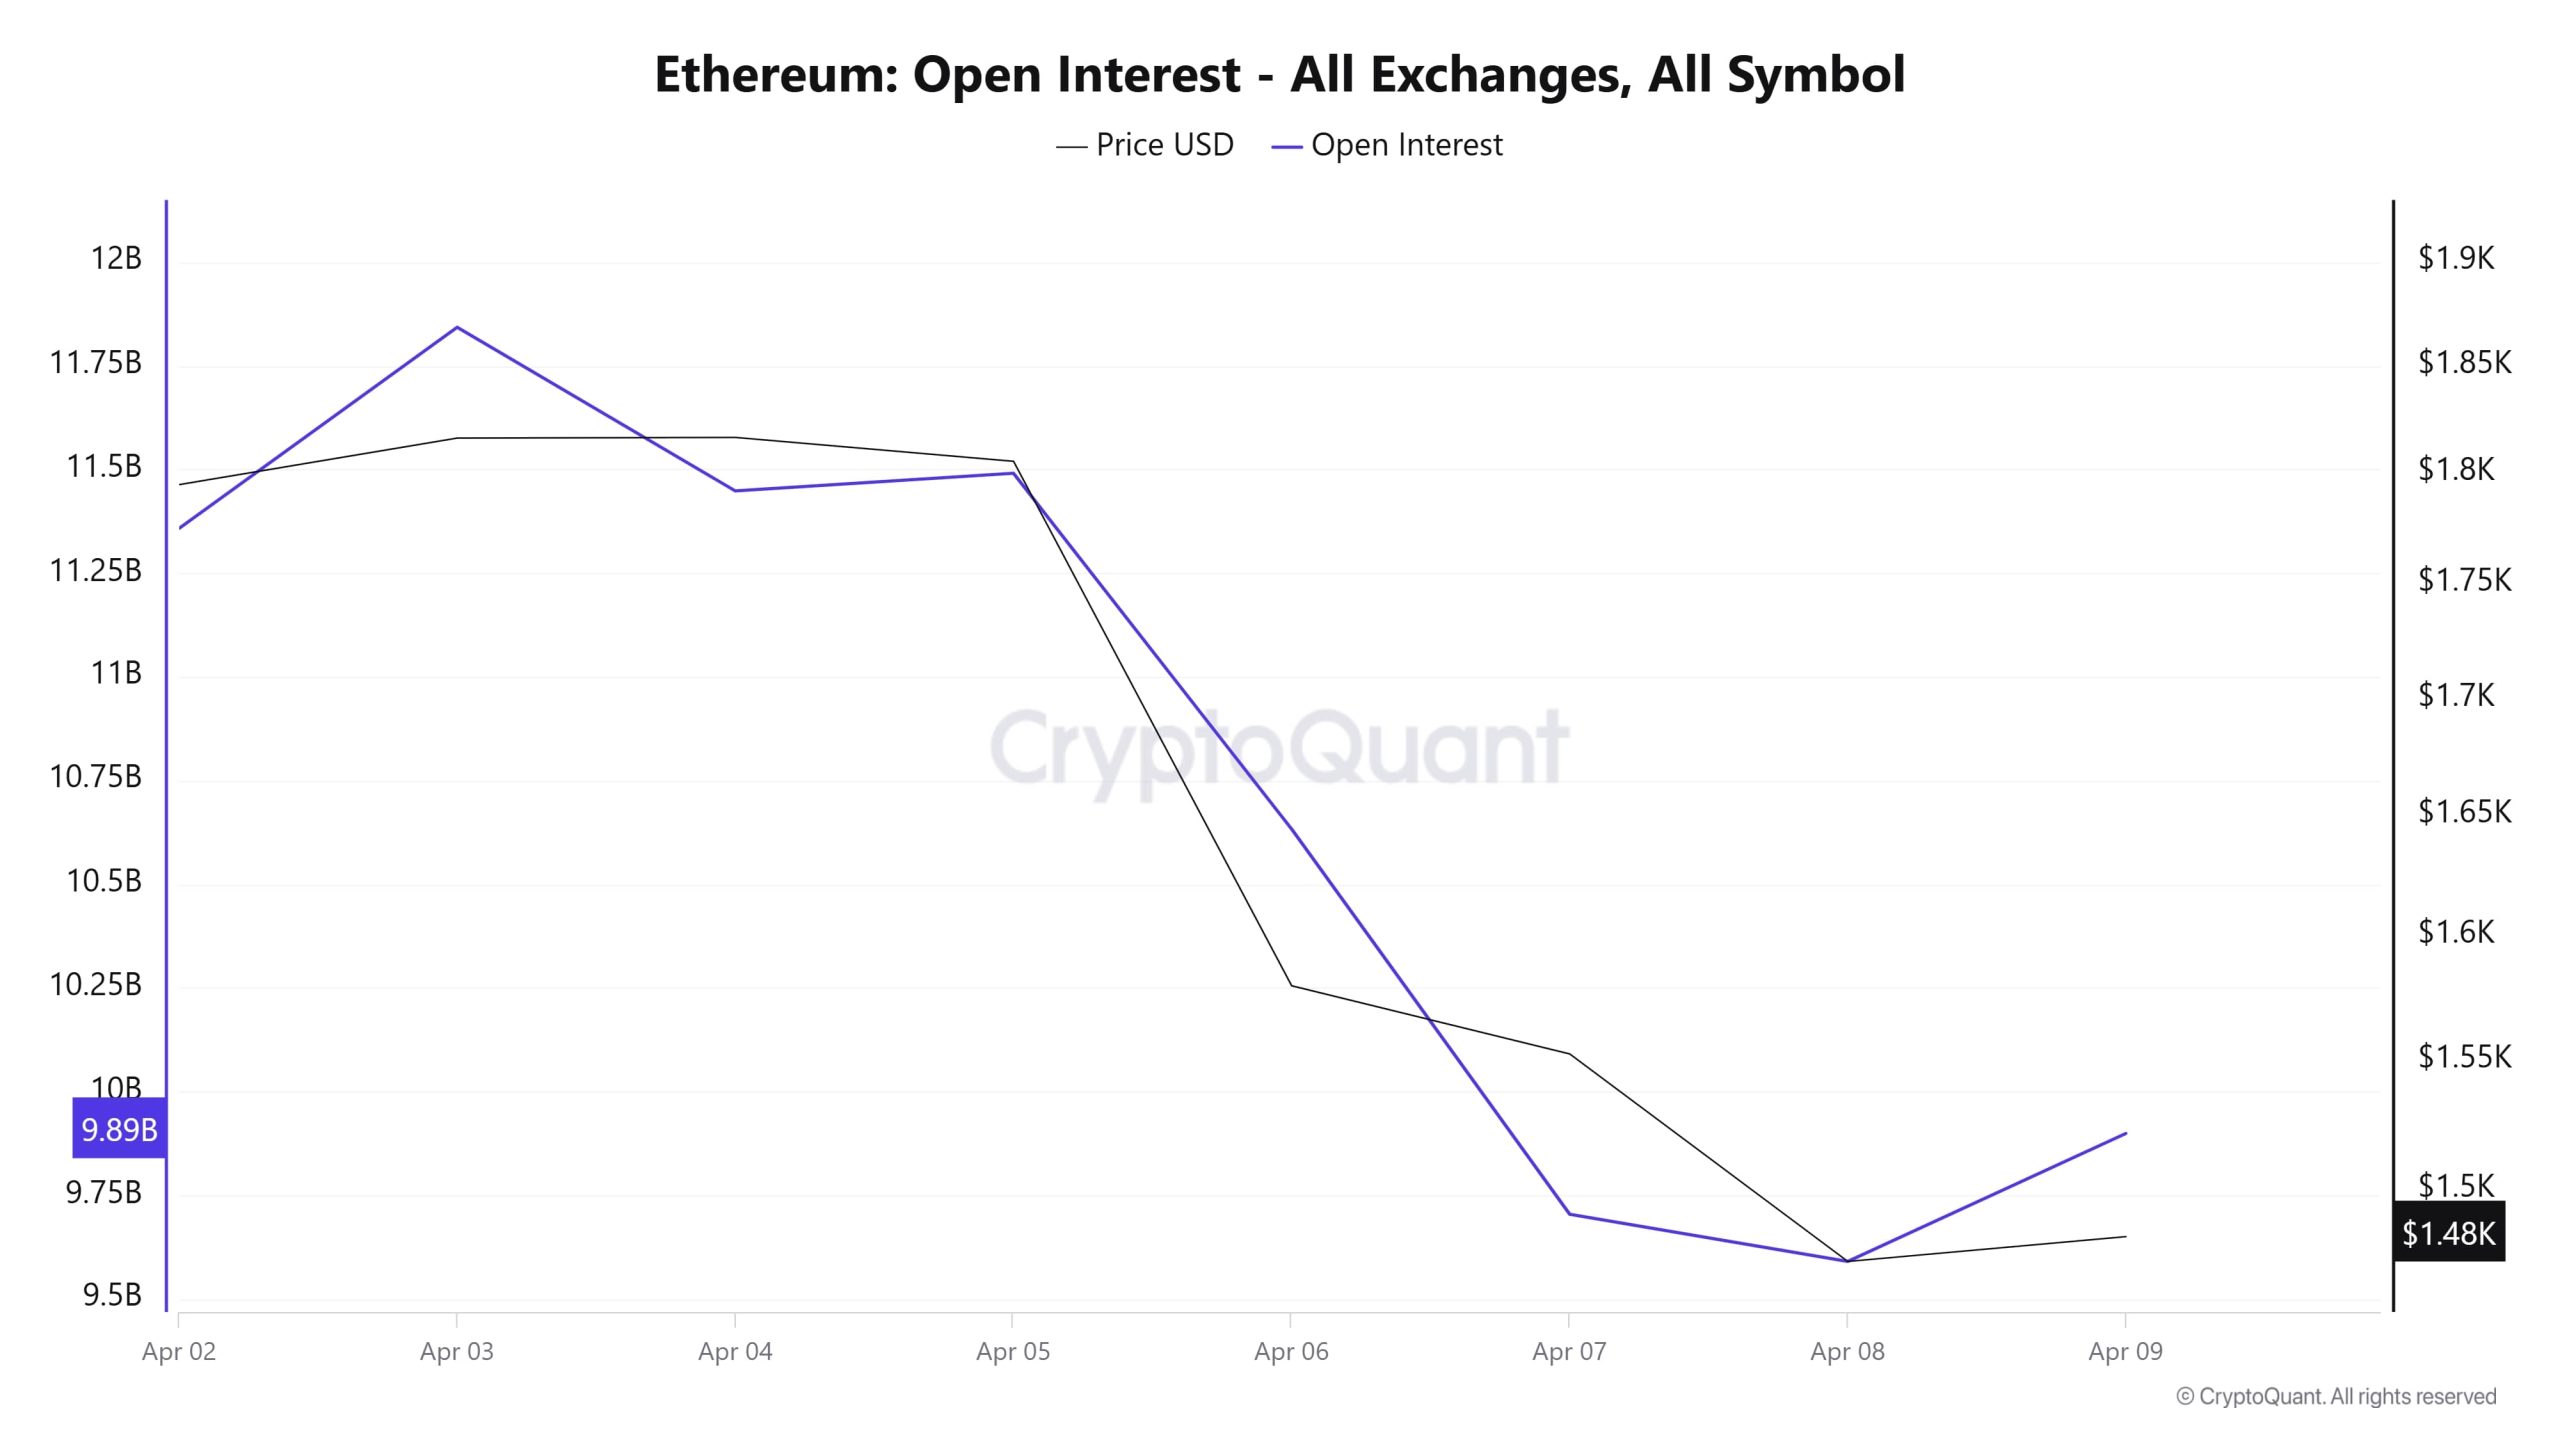 Until April 3, open interest was rising while the price was flat to positive, indicating an increased appetite for positioning en the market. However, as of April 5, both open interest and price fell sharply. This parallel decline indicates that positions are being closed en masse and liquidations are taking place. Especially el April 6-7, as the declines accelerated, open interest also declined, indicating that leveraged positions en the market were quickly cleared. On April 8, as the price bottomed, open interest dropped to very low levels, suggesting that fear and cautious behavior prevailed en the market. On April 9, there is a limited rebound en both price and open interest, but this does not yet signal a strong turnaround. Overall, this chart shows that Ethereum futures are undergoing a serious liquidation process and leveraged risk appetite has weakened significantly. In the short term, caution may continue.
Funding Rate
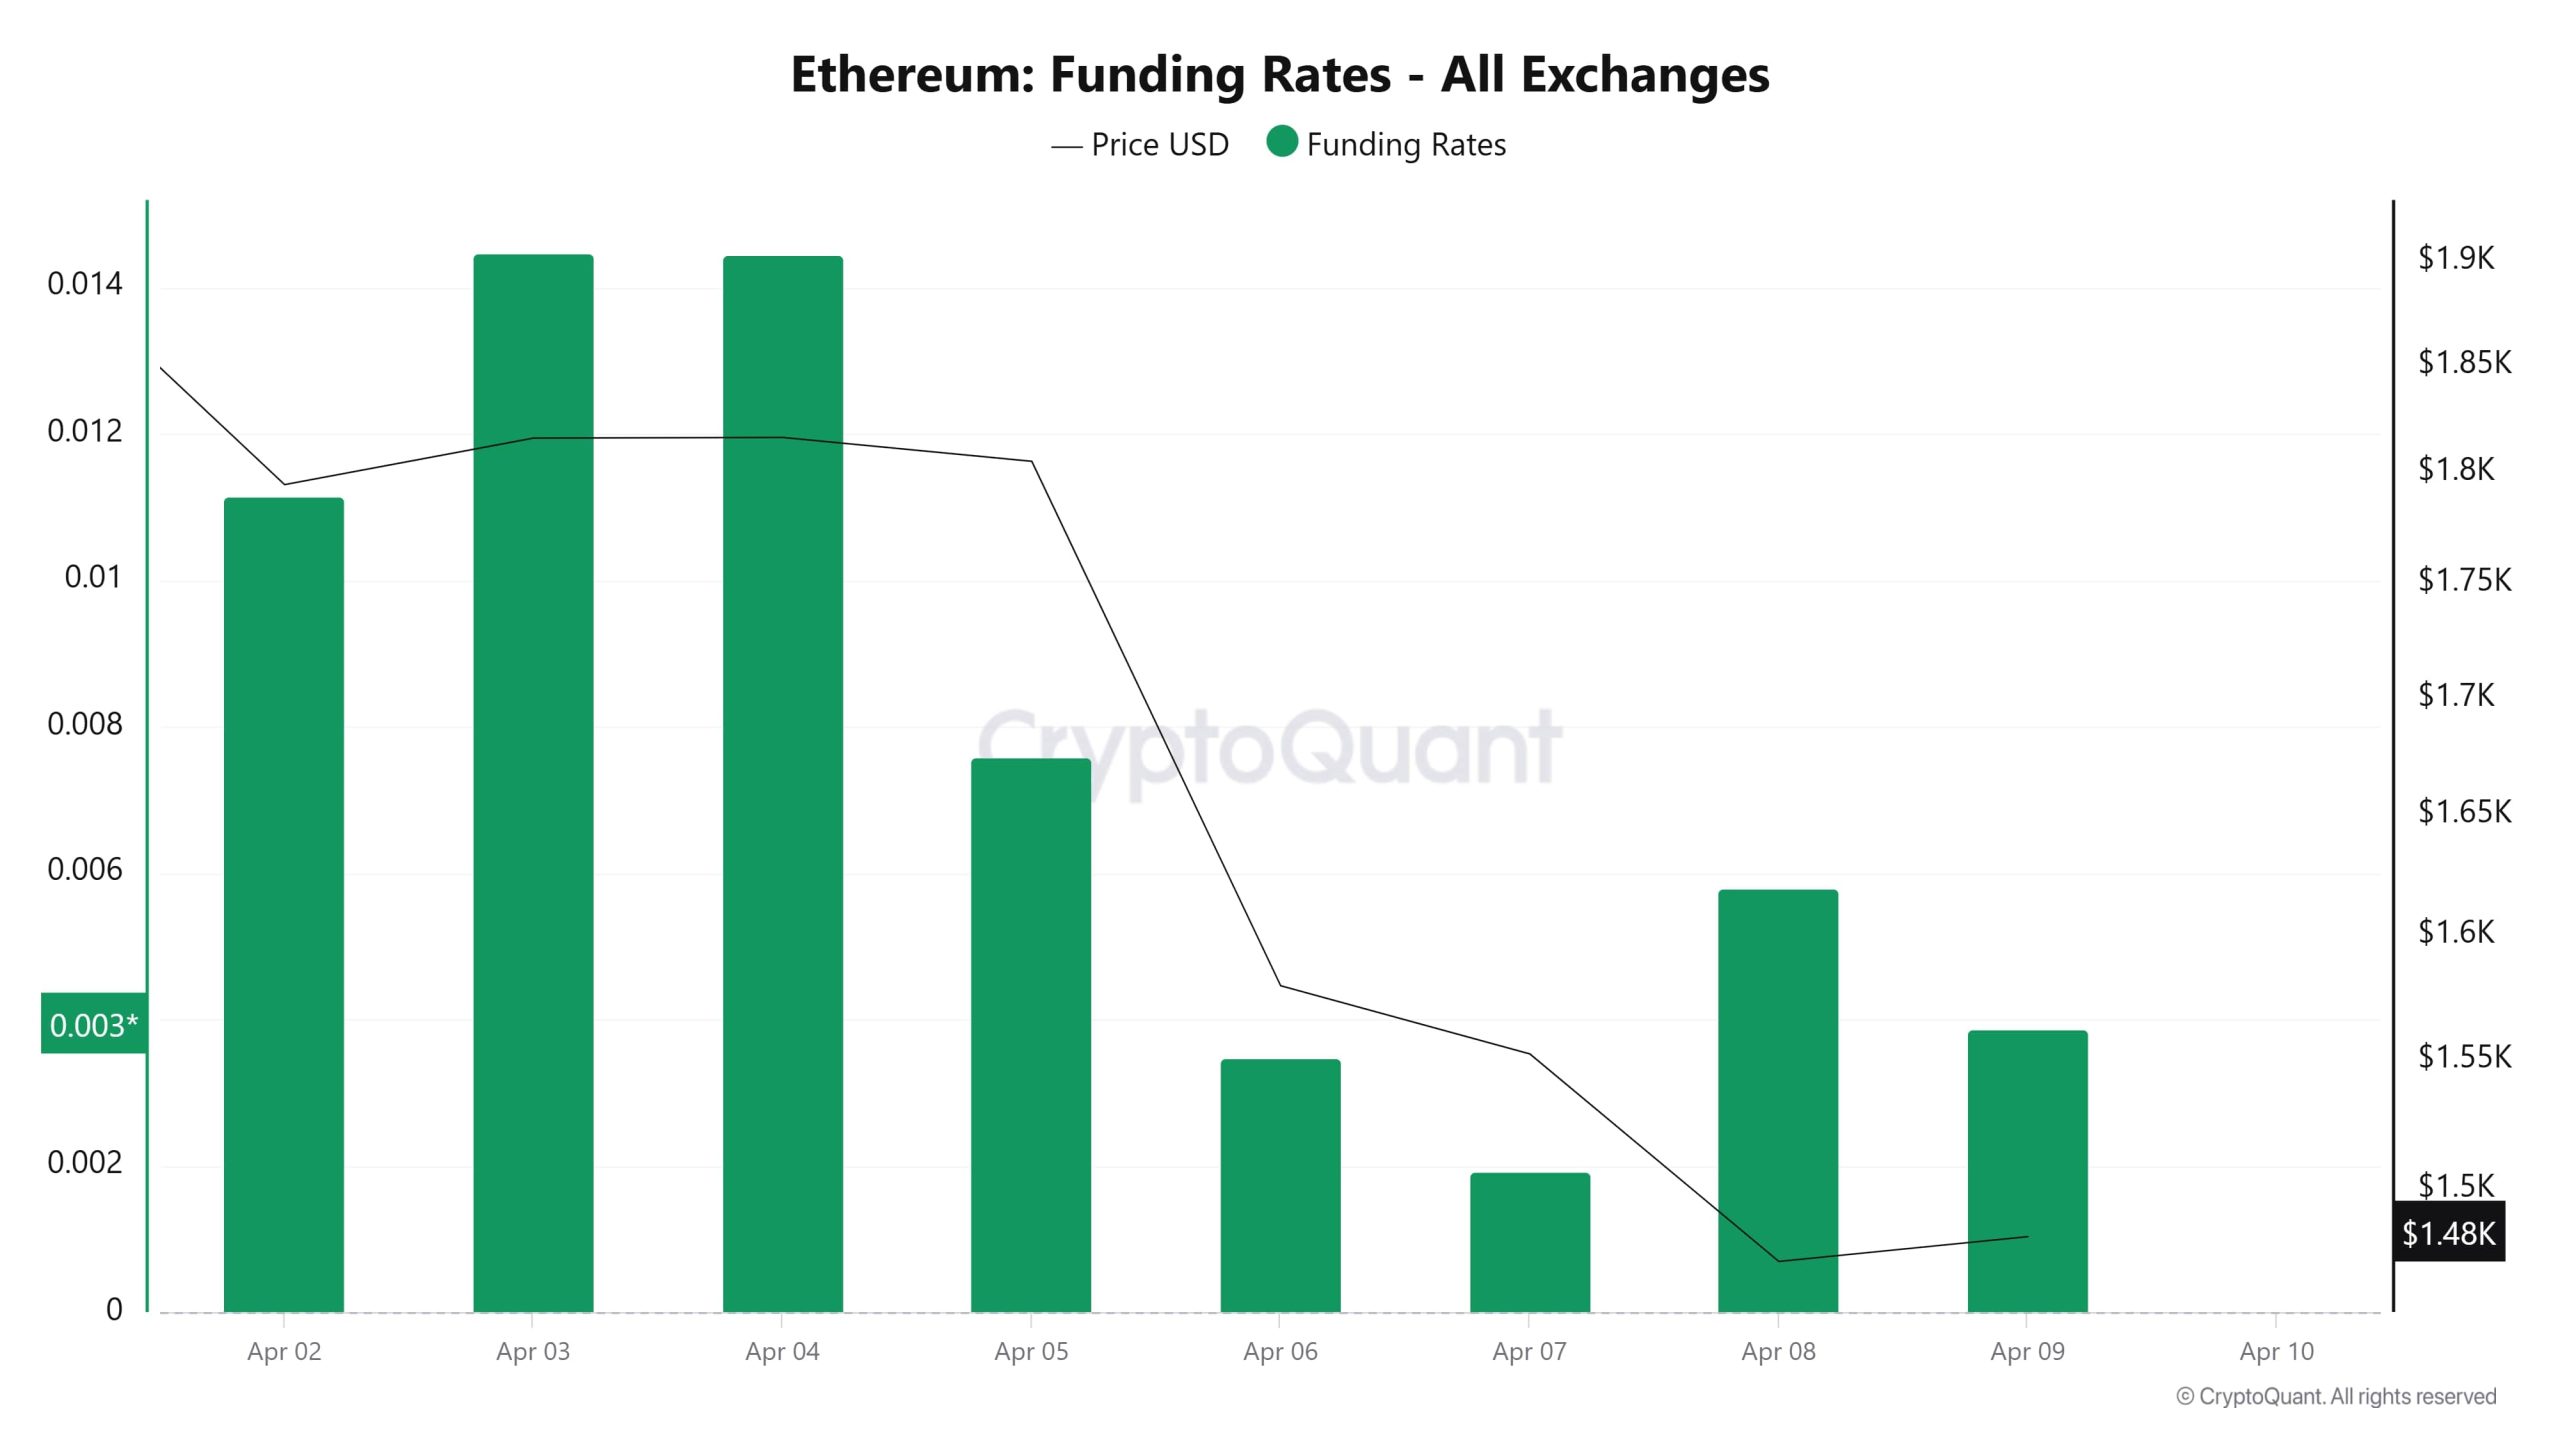
The chart shows Ethereum’s funding rates el all exchanges along with its price movement. In the first few days, April 2-4, the funding rate was quite high, hovering around 0.014%. This shows that long positions were concentrated en the market and investors were expecting the price to rise. However, what is interesting is that when the funding rate is so high, the price stays flat and then falls sharply. This suggests that although long positions dominated the market, there was a “long trap” as the price did not go up, and then these positions were most likely liquidated. From April 5 onwards, the funding rate starts to fall drastically, and between April 6-9 it drops por almost a third from previous levels. During this period, the price also continues to fall, reaching a low of $1,385. The fact that the funding rate fell as the price fell suggests that investors are now more cautious, and the market is shifting to the neutral or short side. In other words, the previous excessive optimism seems to have given way to some fear or indecision.
Finally, the funding rate is low, and the price is moving sideways. This usually indicates that the market is searching for a balance, and no clear direction has been decided. If funding turns negative, it could mean excessive short positioning, which could signal a potential bottom. If both price and funding turn upwards at the same time, this could be a strong signal for a trend reversal. For now, the market is searching for a new direction, and it may be worth being cautious before a clear breakout occurs.
Long & Short Liquidations
ETH, which fell sharply due to the impact of tariffs en the US, caused the liquidation of long positions at a very high level of 770 million dollars. In the same period, 317 million dollars worth of short positions were liquidated due to its volatility.
| Date | Long Amount (Million $) | Short Amount (Million $) |
|---|---|---|
| April 02 | 113.95 | 38.40 |
| April 03 | 44.74 | 23.17 |
| April 04 | 48.29 | 29.58 |
| April 05 | 15.61 | 6.02 |
| April 06 | 203.67 | 42.41 |
| April 07 | 263.78 | 140.38 |
| April 08 | 80.75 | 37.04 |
| Total | 770.79 | 317.00 |
Supply Distribution
Total Supply: Increased por about 0.020% from last week to 120,652,063 units.
New Supply: The amount of ETH produced this week was 24,219.
Velocity: Velocity, which was 7.67 last week, was 7.69 as of April 7.
| Wallet Categoría | 1.04.2025 | 7.04.2025 | Change (%) |
|---|---|---|---|
| 100 – 1k ETH | 9.4365M | 9.3971M | -0.4175% |
| 1k – 10k ETH | 12.6099M | 12.6666M | 0.4495% |
| 10k – 100k ETH | 16.3243M | 16.3439M | 0.1201% |
| 100k+ ETH | 5.3926M | 5.4636M | 1.3161% |
According to the latest data, 100 – 1k ETH wallets saw a decrease of 0.4175%, while 1k – 10k ETH holders experienced an increase of 0.4495%. While a slight increase of 0.1201% was recorded en the 10k – 100k ETH category, the most notable change was a significant increase of 1.3161% en 100k+ ETH holders.
Exchange Reserve
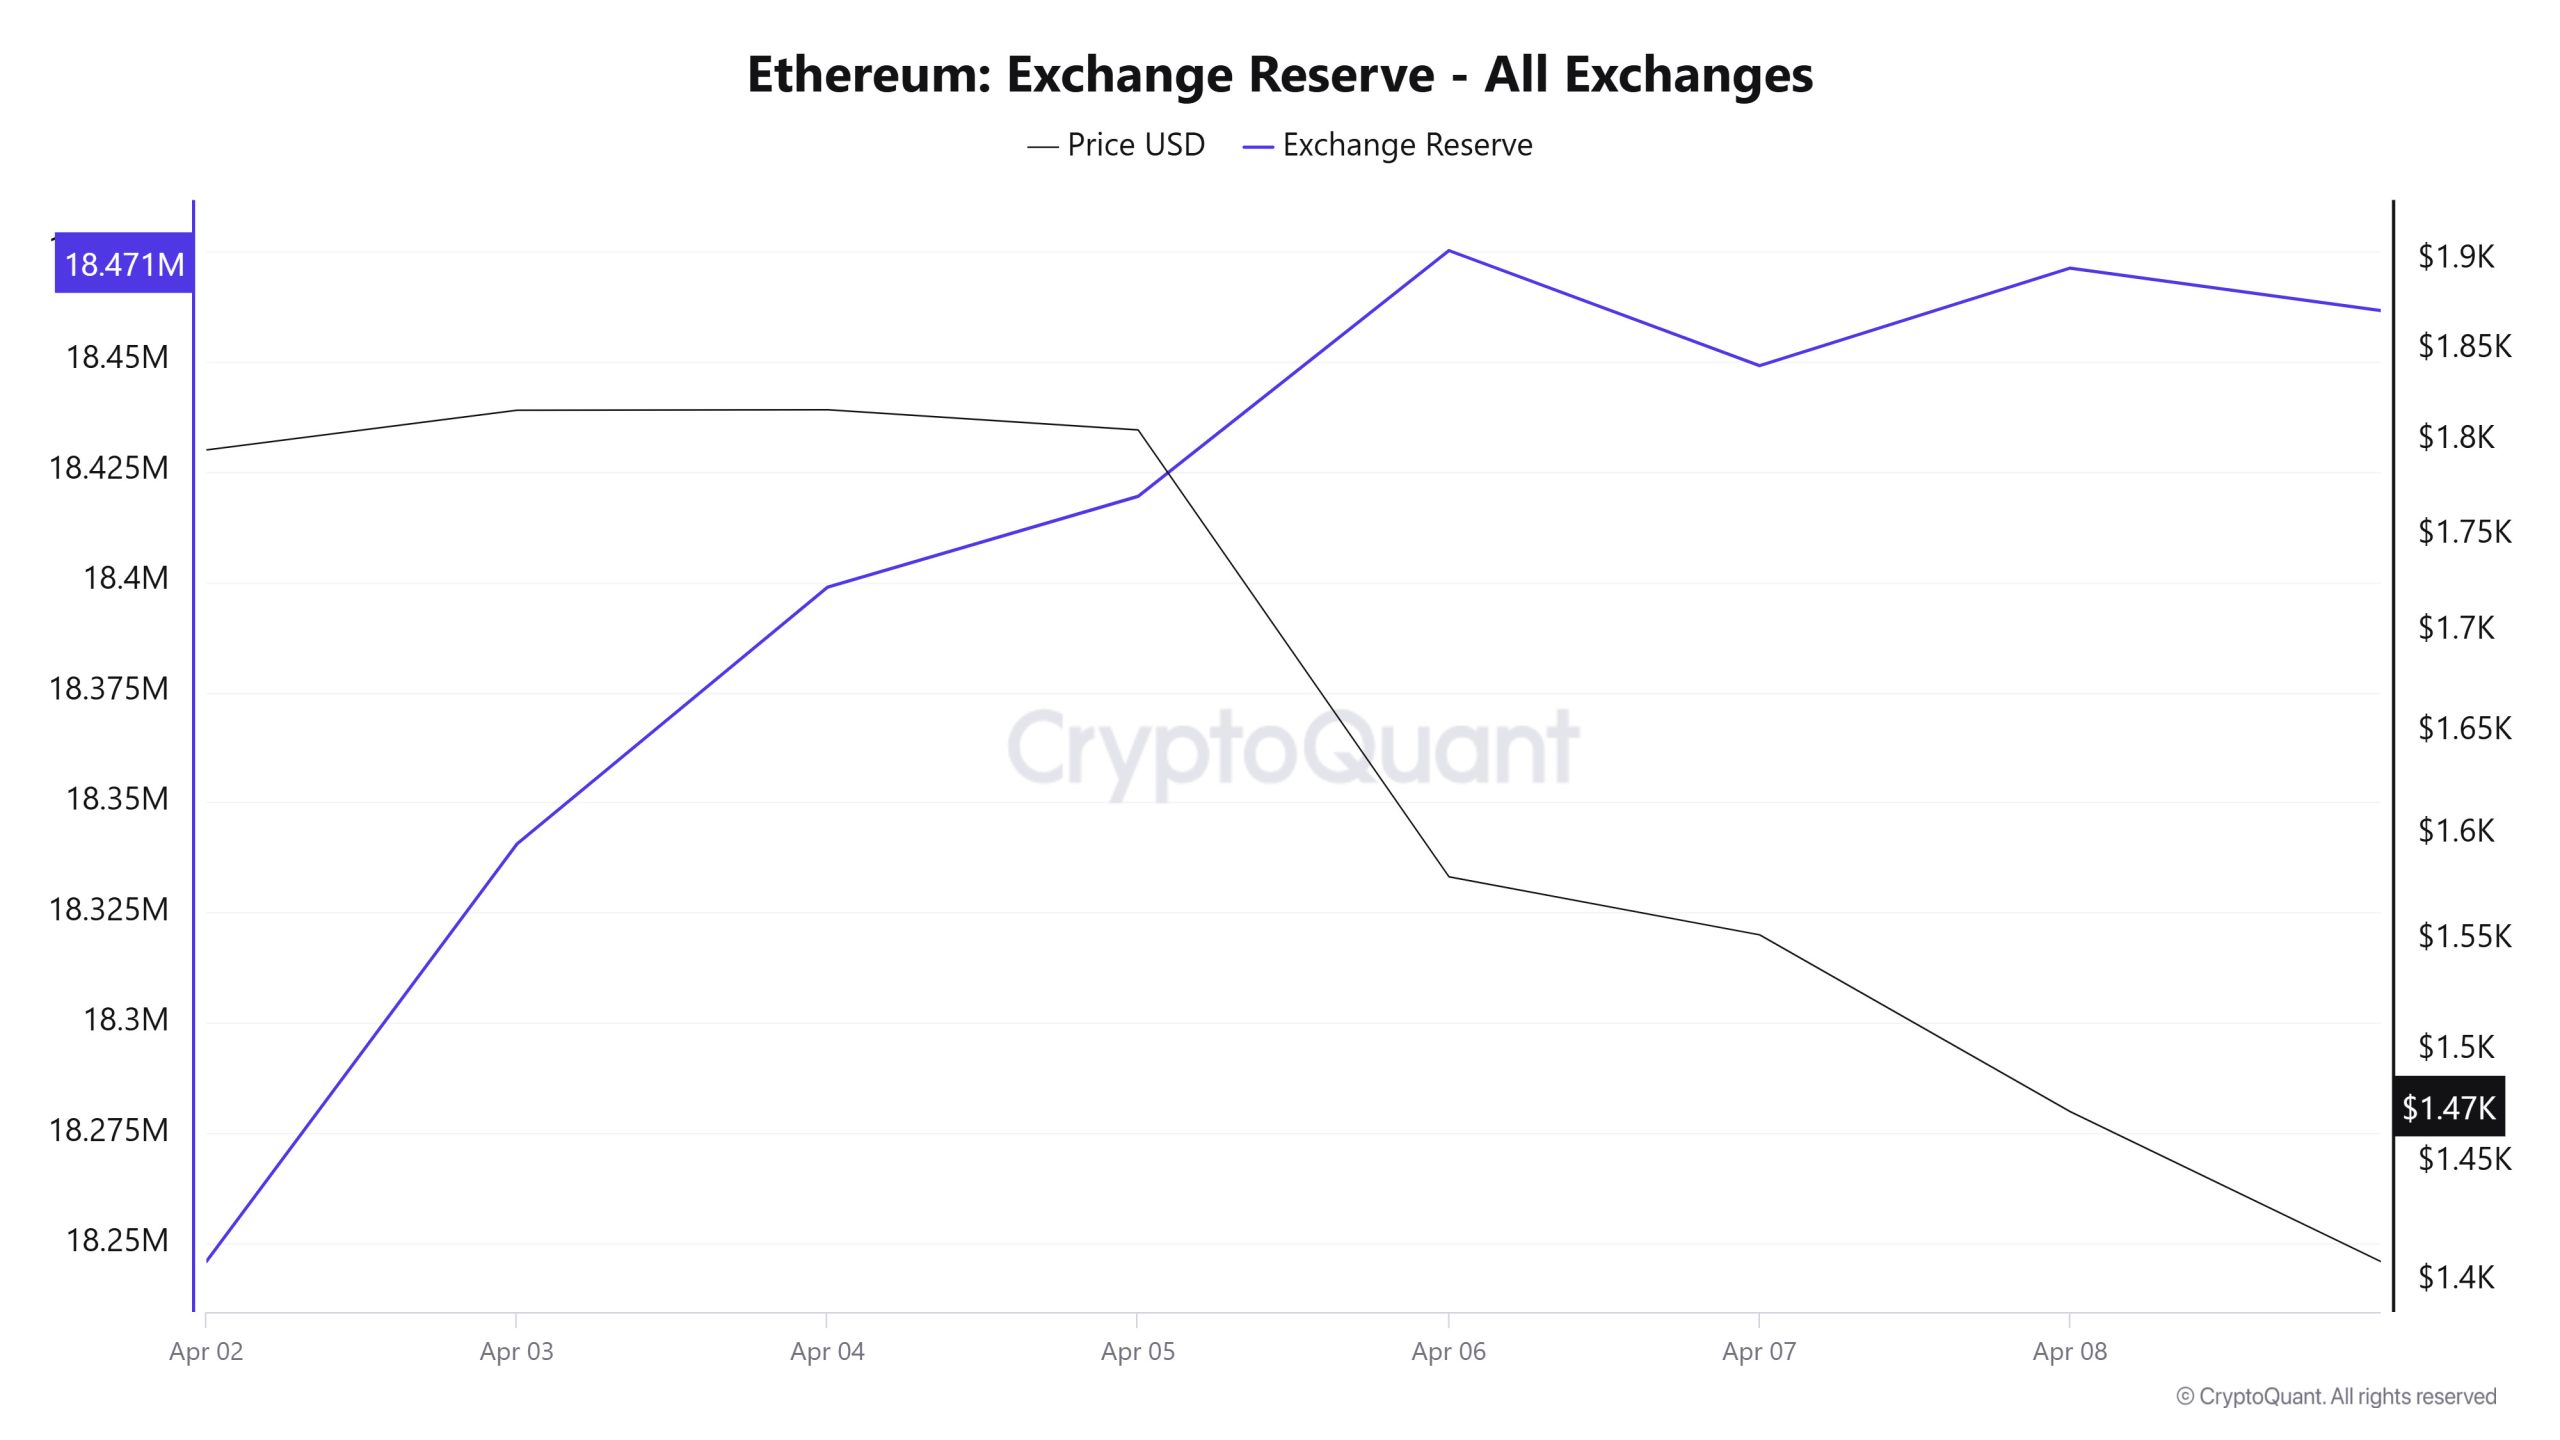
Between April 2-8, 2025, Ethereum reserves el exchanges increased from 18,246,034 ETH to 18,471,005 ETH. During this period, there was a total net inflow of 224,971 ETH and the Ethereum reserves of exchanges increased por 1.23%. The Ethereum price fell por approximately 17.9% during the same period. On April 2, 2025, Ethereum closed at $1,795, and el April 8, 2025, it closed at $1,473. Strong inflows to the stock markets indicate that investors may increase their selling tendency. The recent increase en tariffs and economic warfare el a global scale has weakened investor confidence and triggered a general decline en crypto markets. The continuation of this trend en the coming period may cause increased selling pressure el prices as strong inflows to stock exchanges continue.
| Date | 2-Apr | 3-Apr | 4-Apr | 5-Apr | 6-Apr | 7-Apr | 8-Apr |
|---|---|---|---|---|---|---|---|
| Exchange Inflow | 621,839 | 691,074 | 704,955 | 318,234 | 866,726 | 1,713,300 | 870,585 |
| Exchange Outflow | 692,472 | 596,515 | 646,801 | 297,659 | 811,067 | 1,739,374 | 848,487 |
| Exchange Netflow | -70,633 | 94,559 | 58,153 | 20,575 | 55,660 | -26,074 | 22,098 |
| Exchange Reserve | 18,246,034 | 18,340,593 | 18,398,747 | 18,419,322 | 18,474,981 | 18,448,907 | 18,471,005 |
| ETH Price | 1,795 | 1,816 | 1,817 | 1,806 | 1,580 | 1,553 | 1,473 |
Fees and Revenues
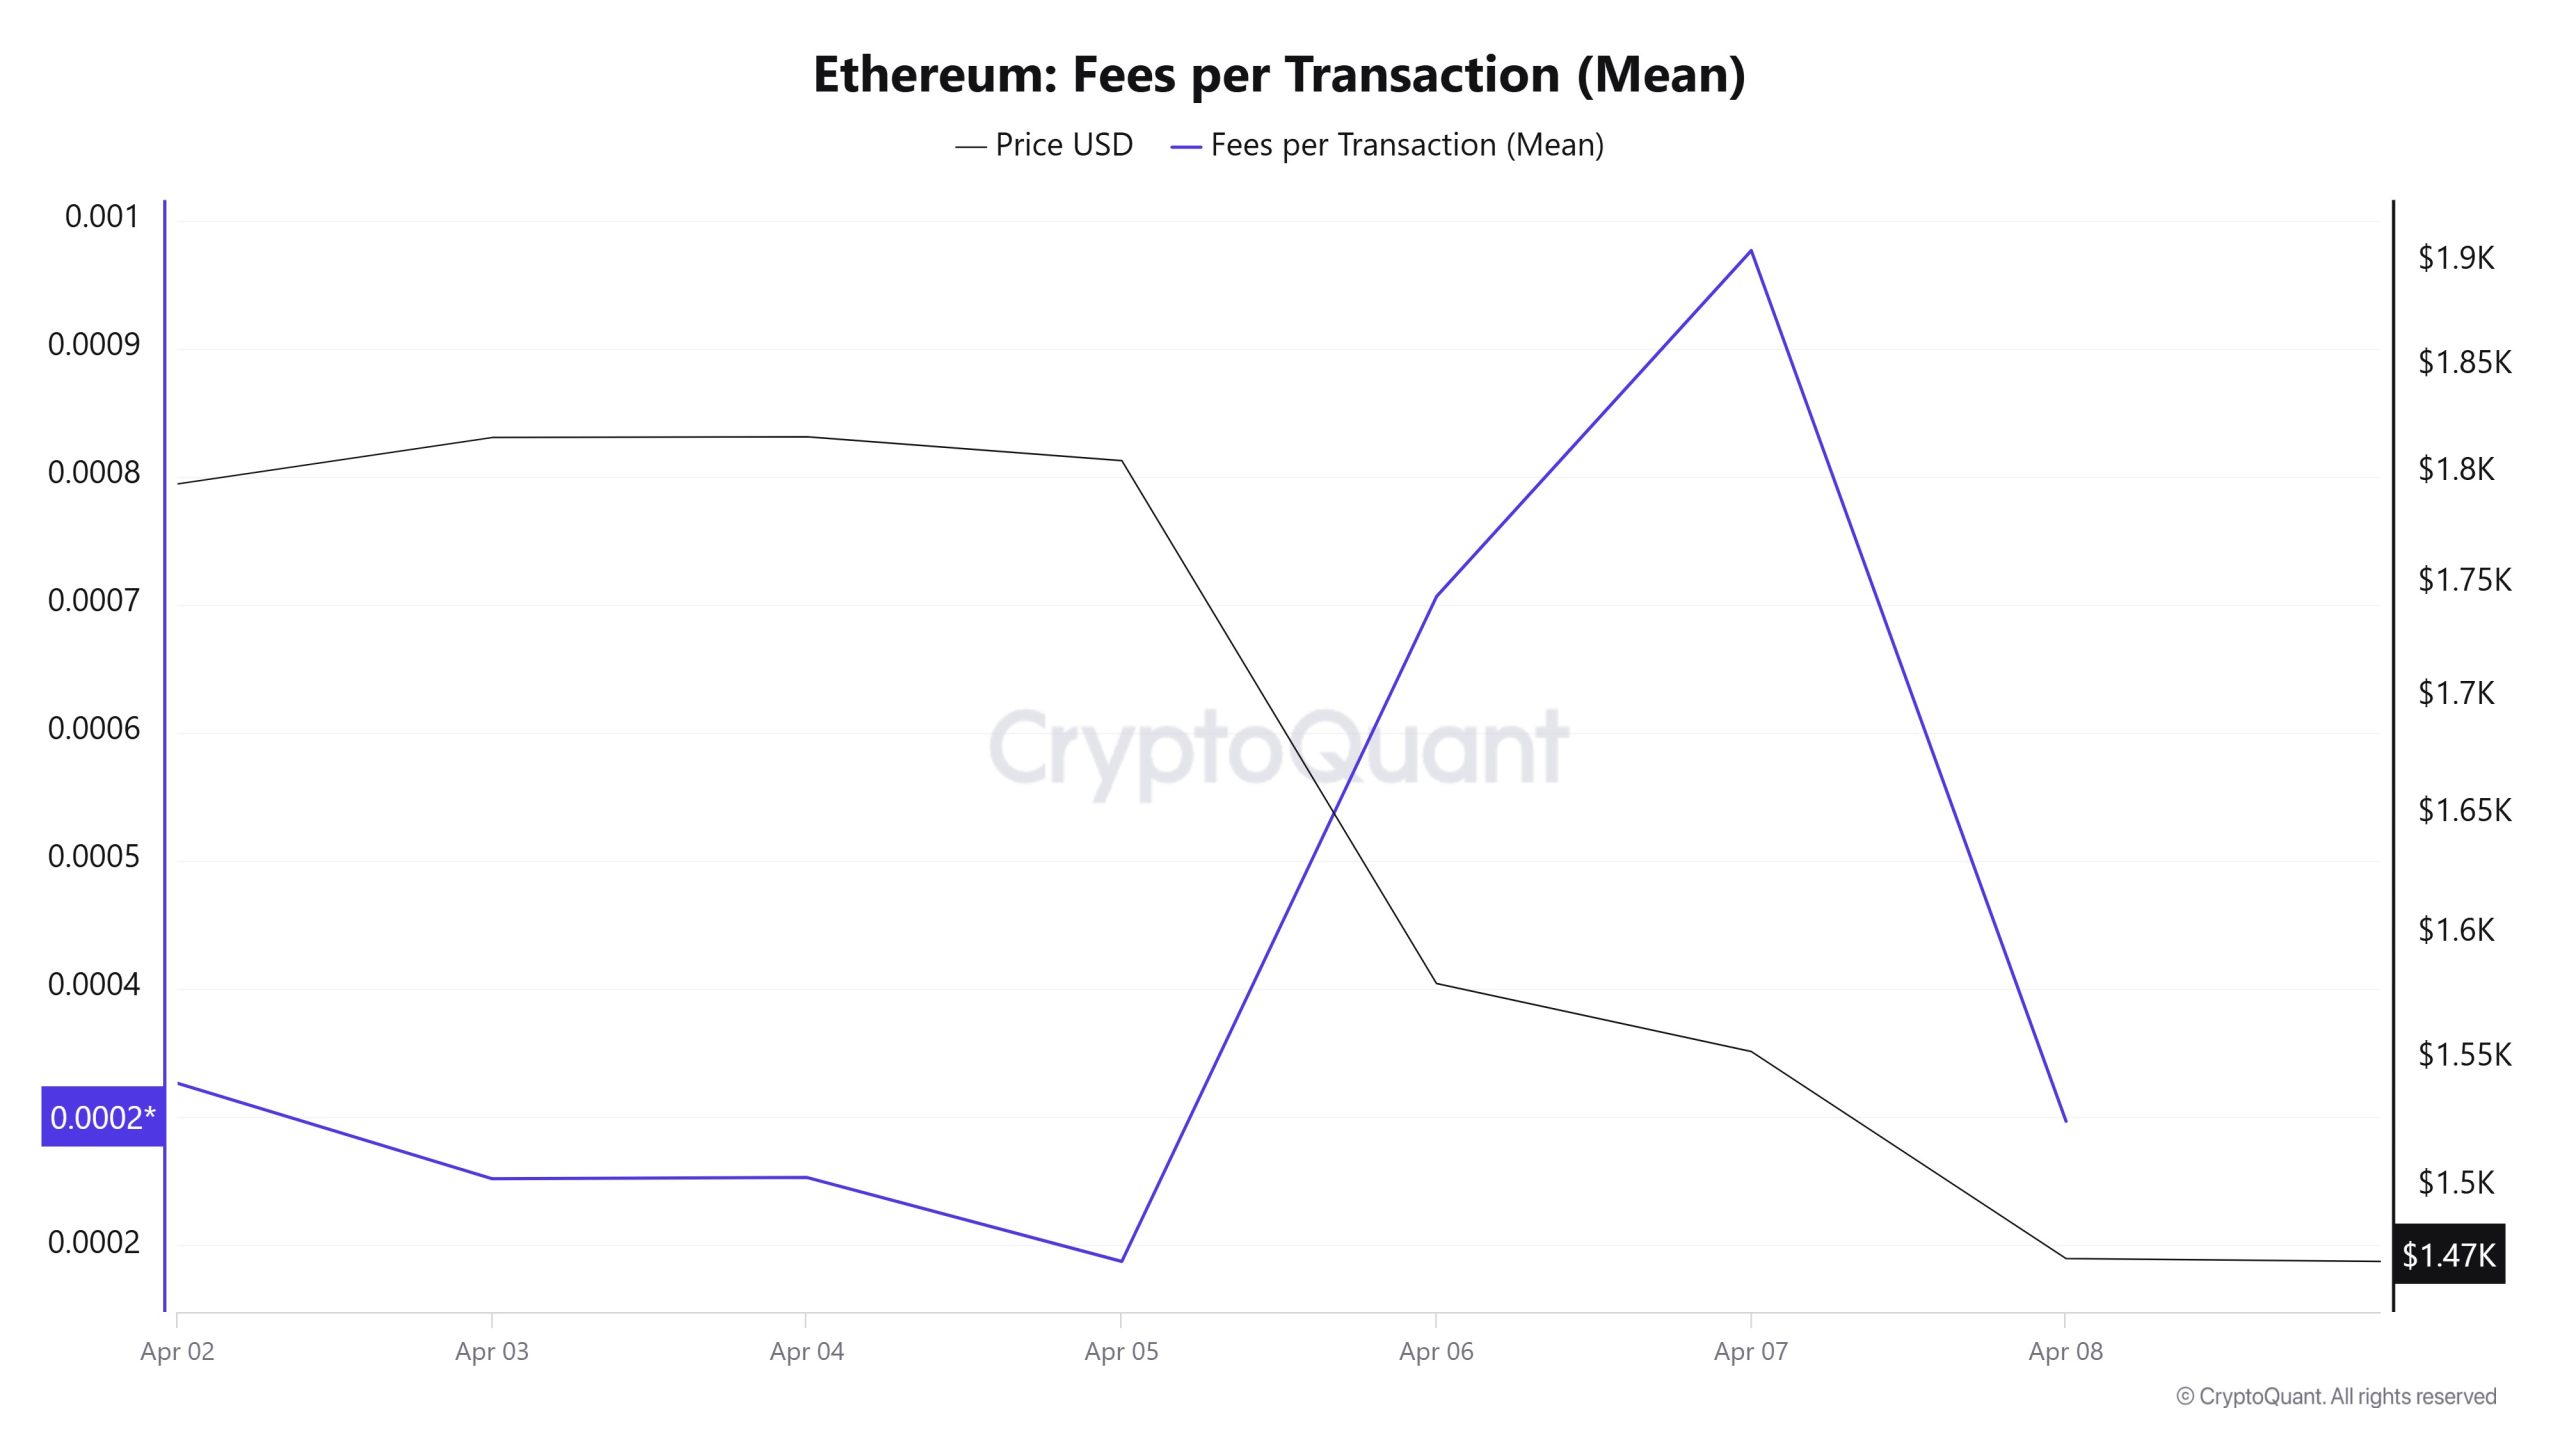
When the Ethereum Fees per Transaction (Mean) data between April 2- 8 is analyzed, it is seen that this value was at the level of 0.000326031468215476 el April 2, the first day of the weekly period. Until April 5, the value, which showed a downward trend, recorded the lowest value of the week with the level of 0.000186843923903236 el this date.
As of April 5, the value, which gained upward momentum again with the fluctuations en the Ethereum price, closed at 0.000296370995058201 el April 8, the last day of the weekly period.
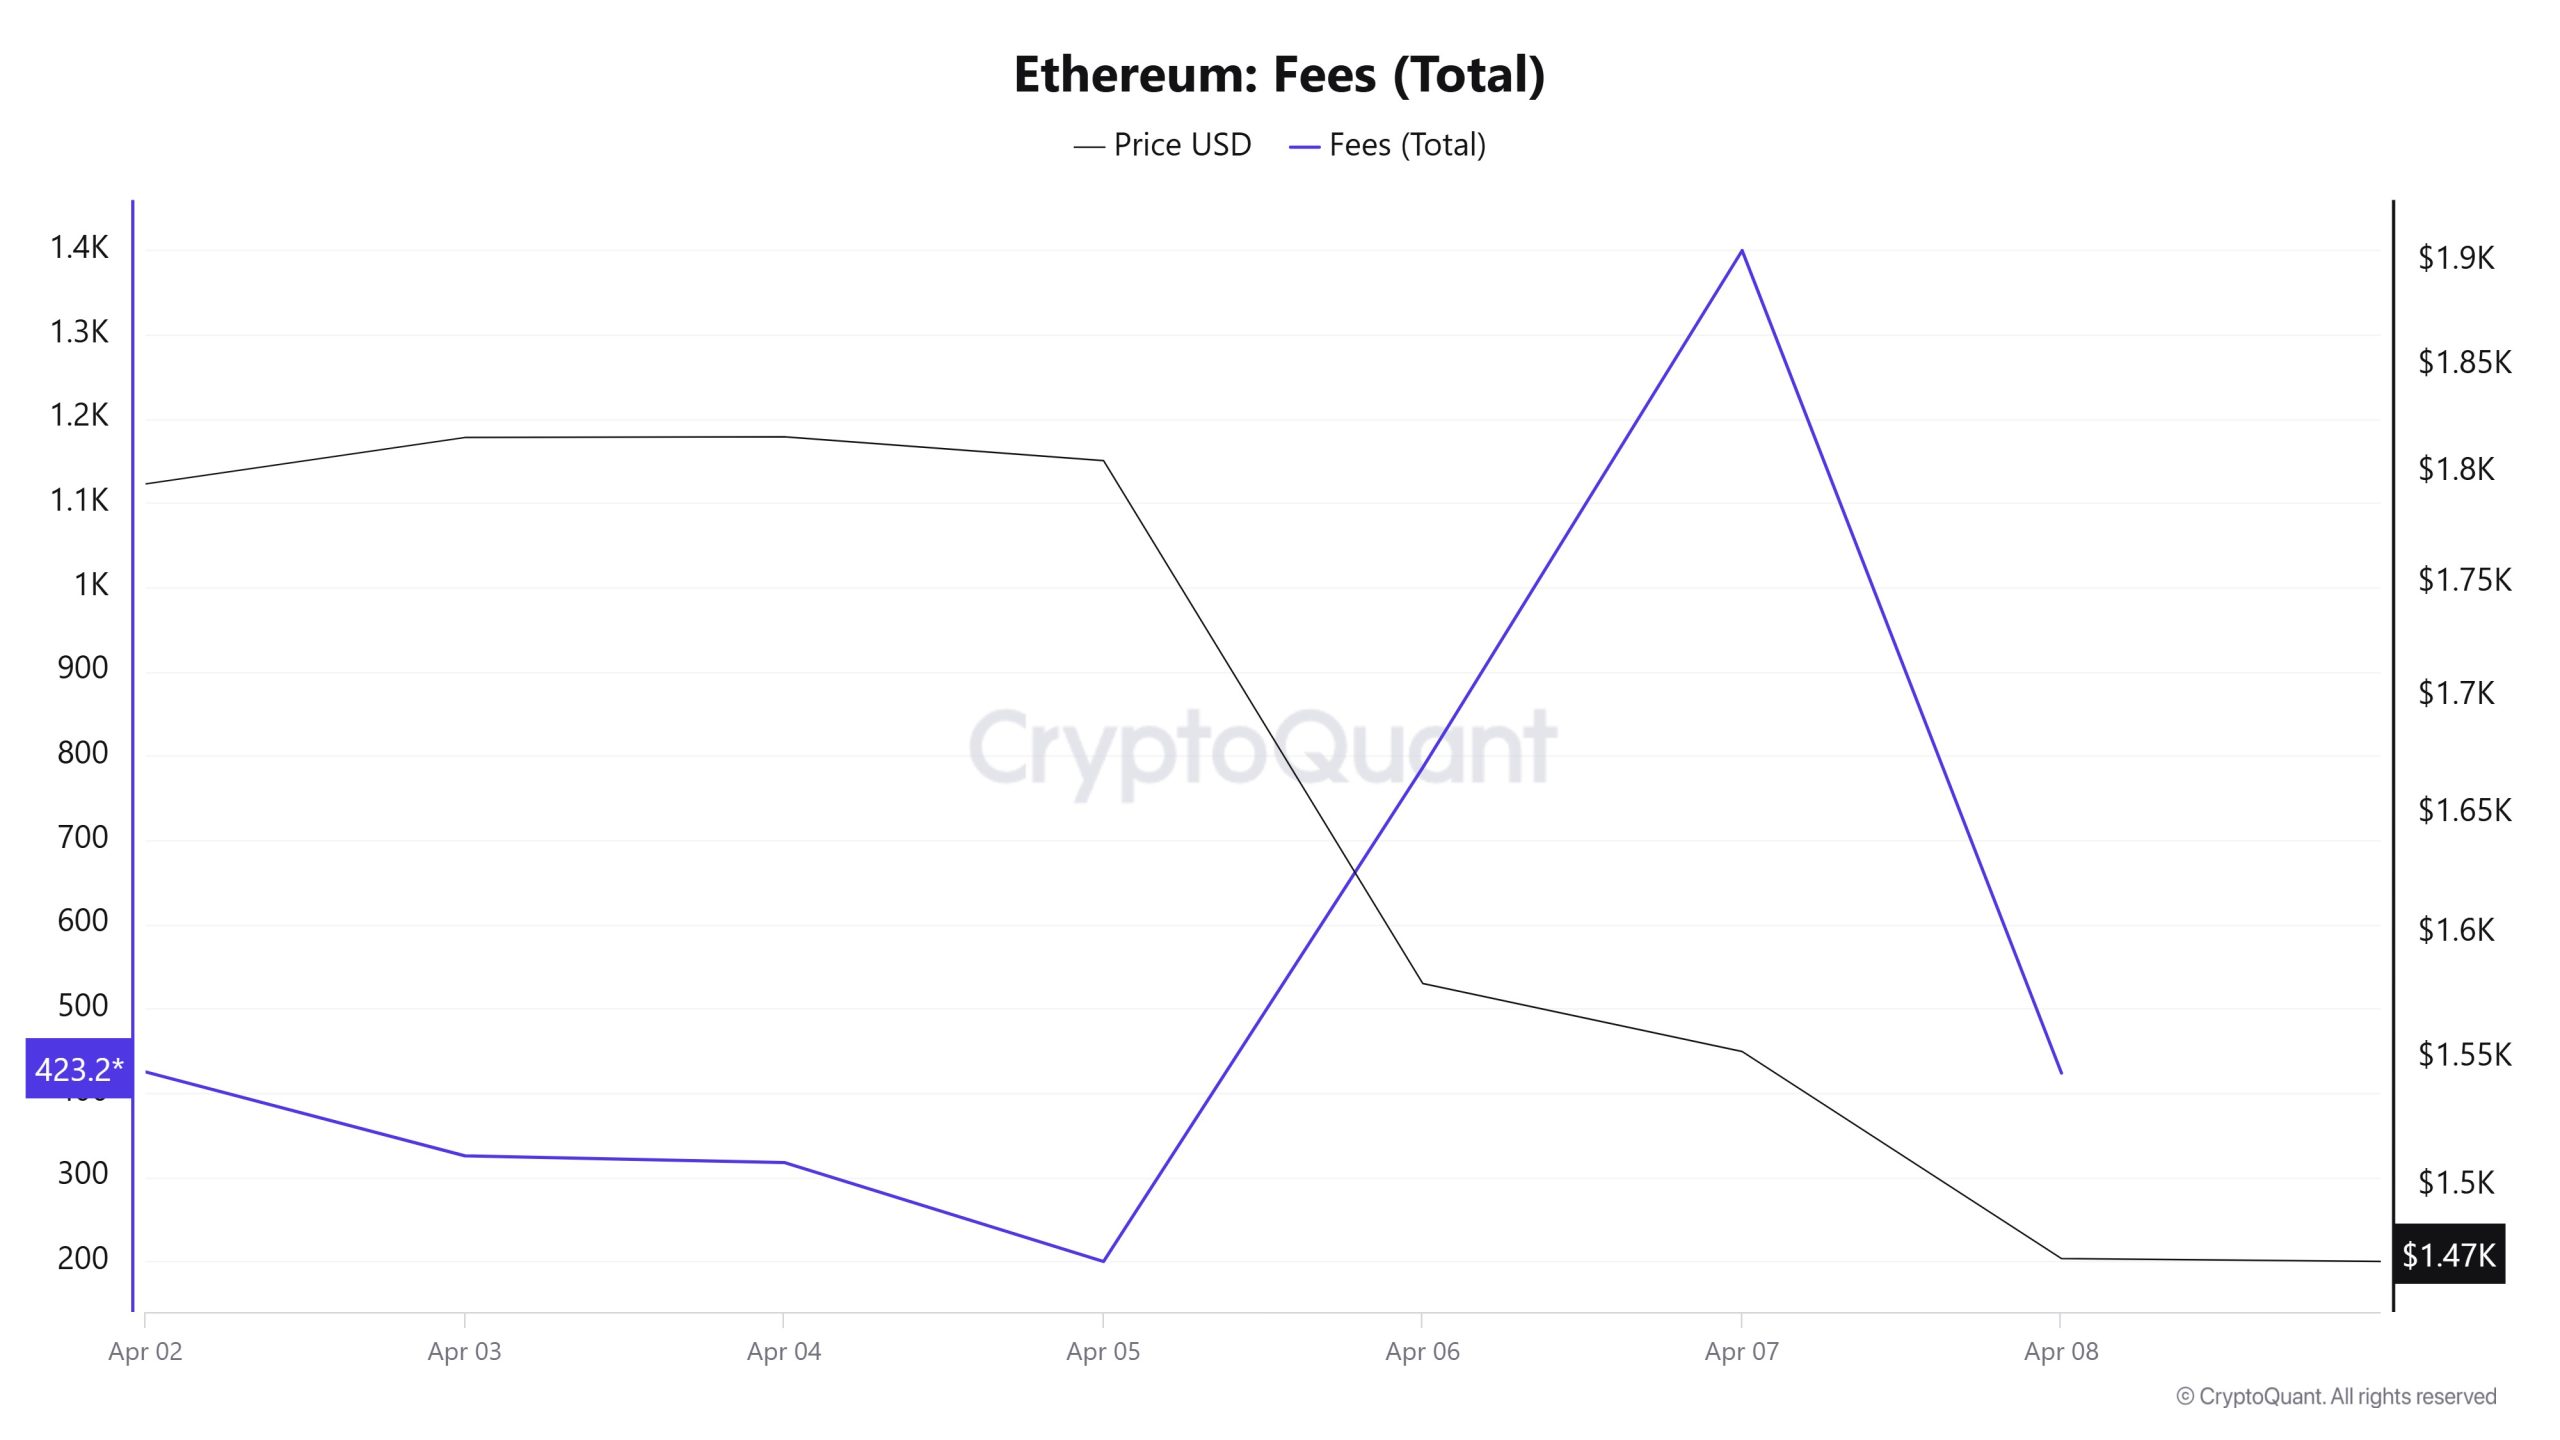
Similarly, when the Ethereum Fees (Total) data between April 2 and April 8 were analyzed, it was seen that this value 424.54481061999616 el April 2, the first day of the weekly period. Until April 5, the value, which showed a downward trend, recorded the lowest value of the week with 199.67655144083412 el this date.
As of April 5, the value, which gained upward momentum again with the fluctuations en the Ethereum price, closed at 423,2334886058493 el April 8, the last day of the weekly period.
Blocks Mined
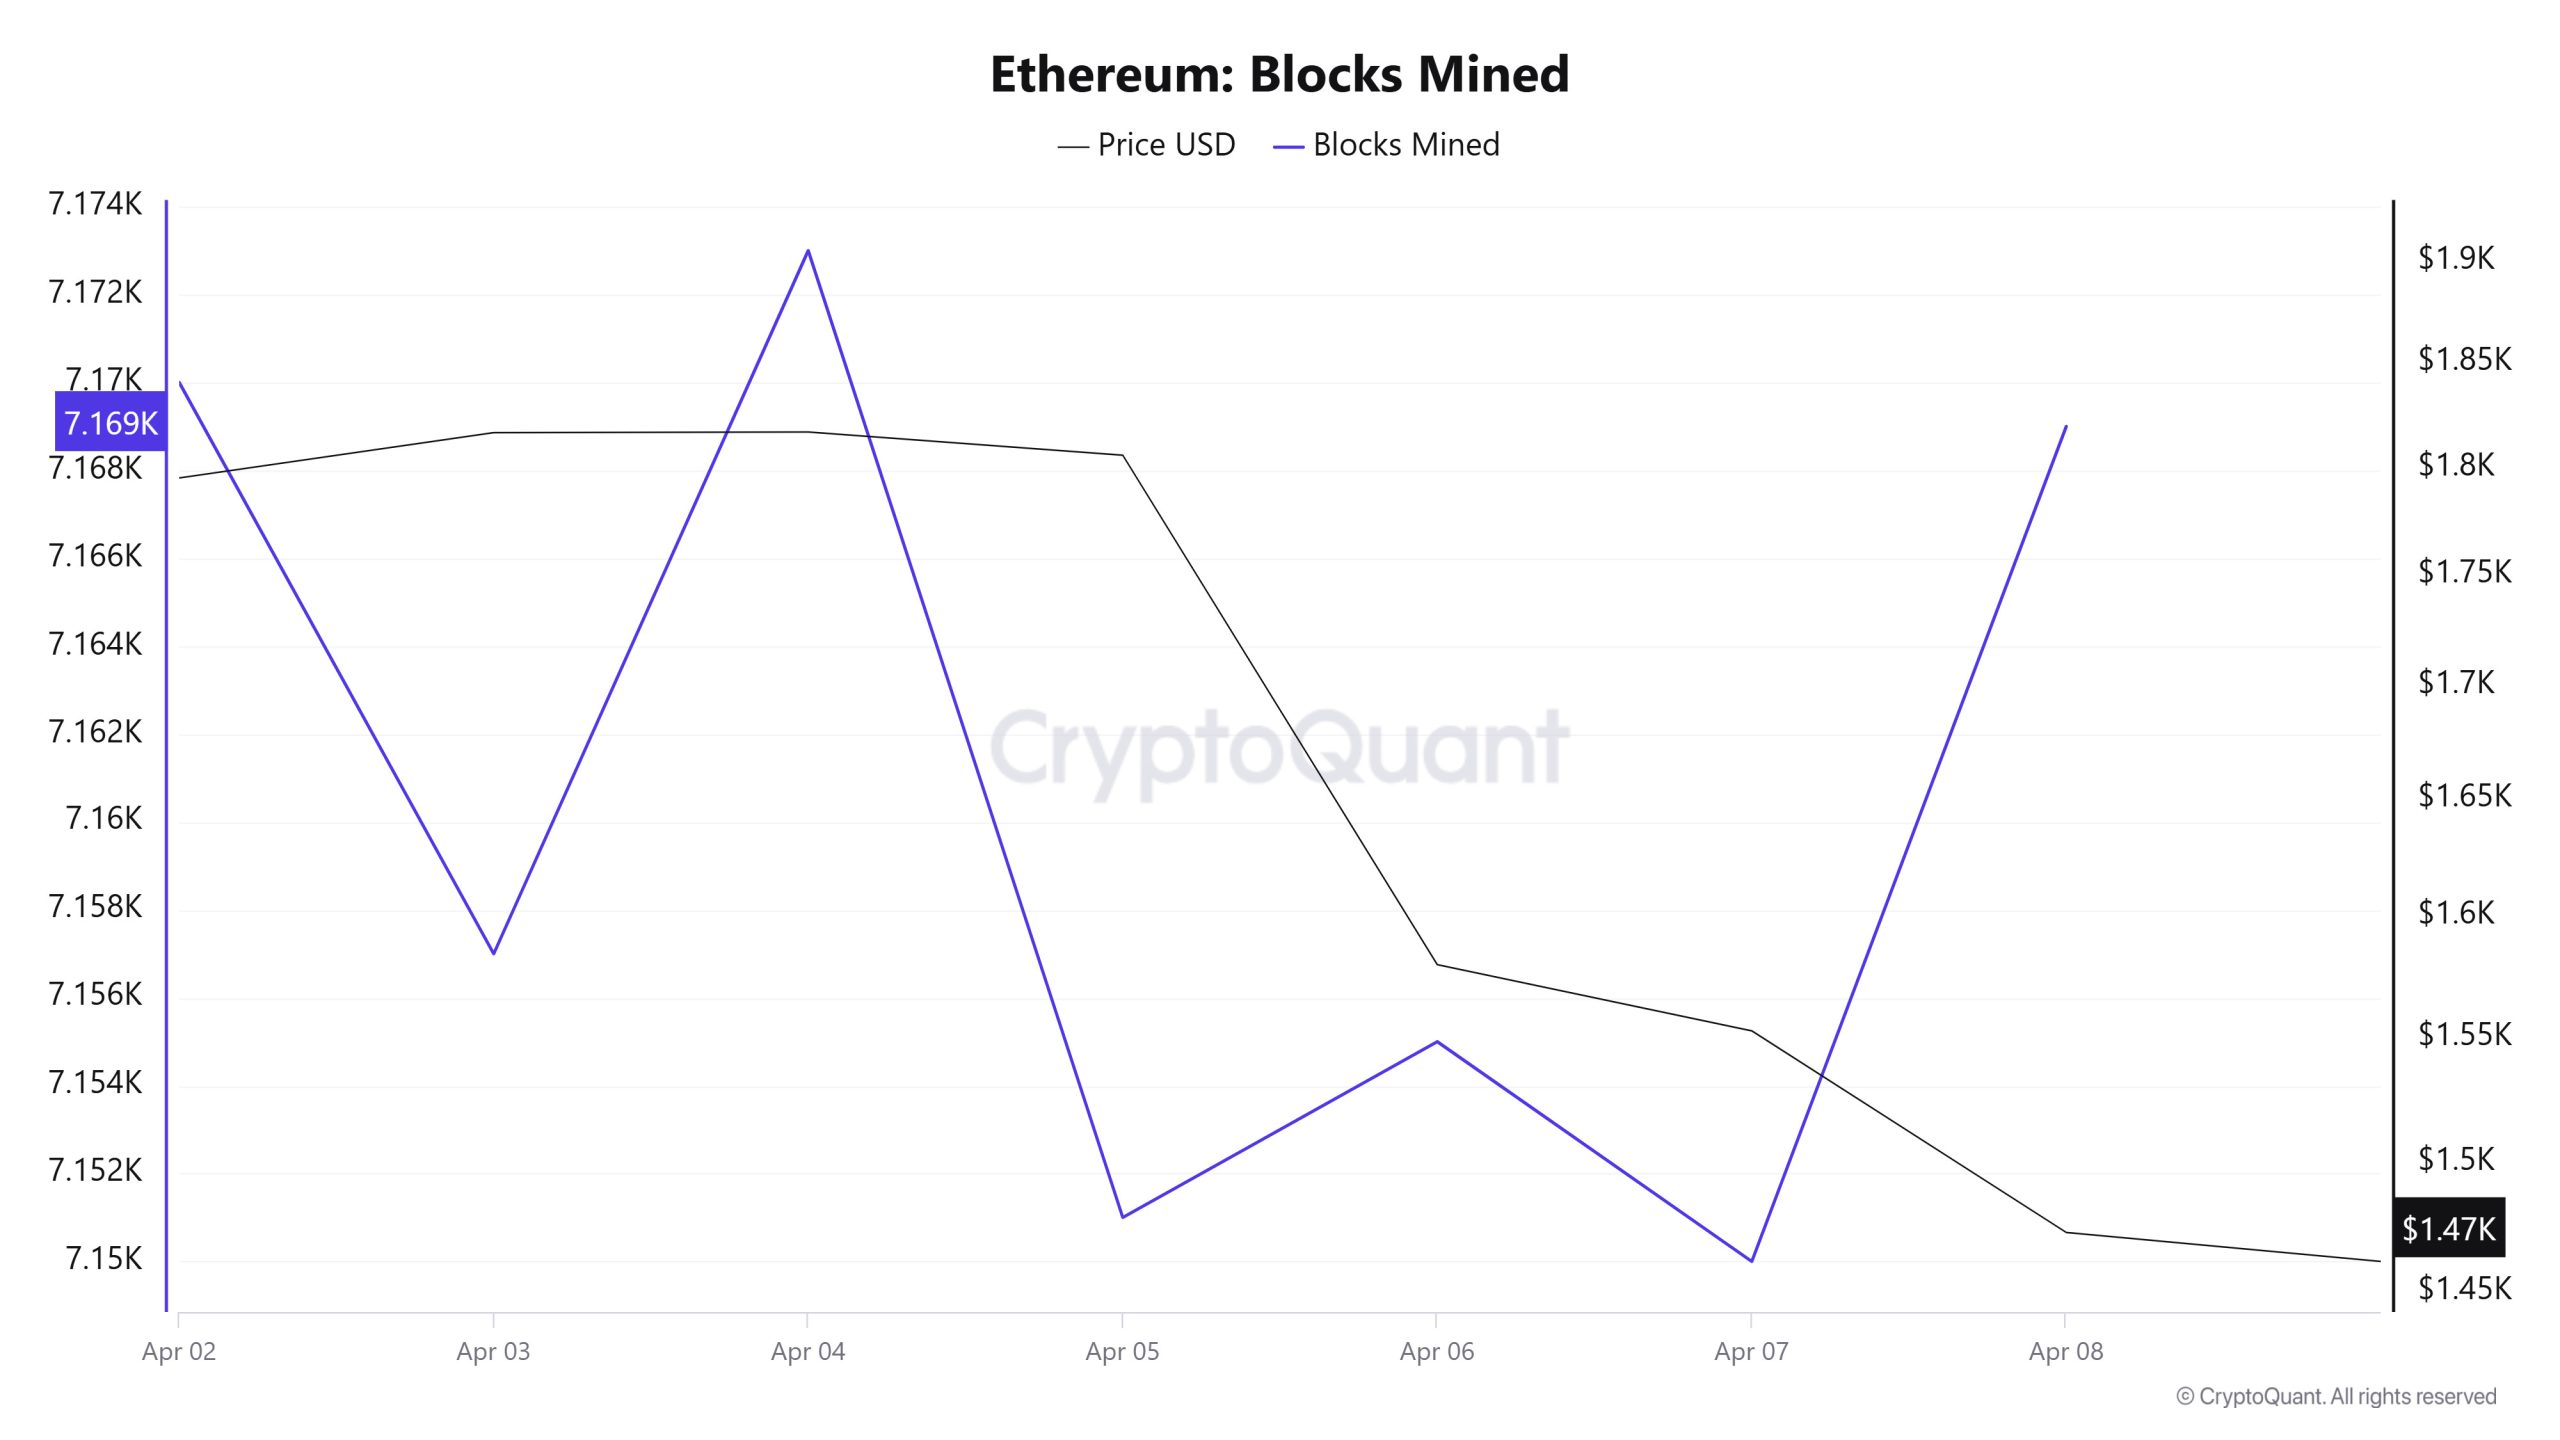
Between April 2 and April 8, when we examine the Ethereum Blocks Mined table, the number of blocks produced decreased towards the middle of the week but increased towards the end of the week. While 7,170 blocks were produced el April 2, this number was 7,169 el April 8. There was a negative correlation between Blocks Mined and Ethereum price during the week.
Block Size
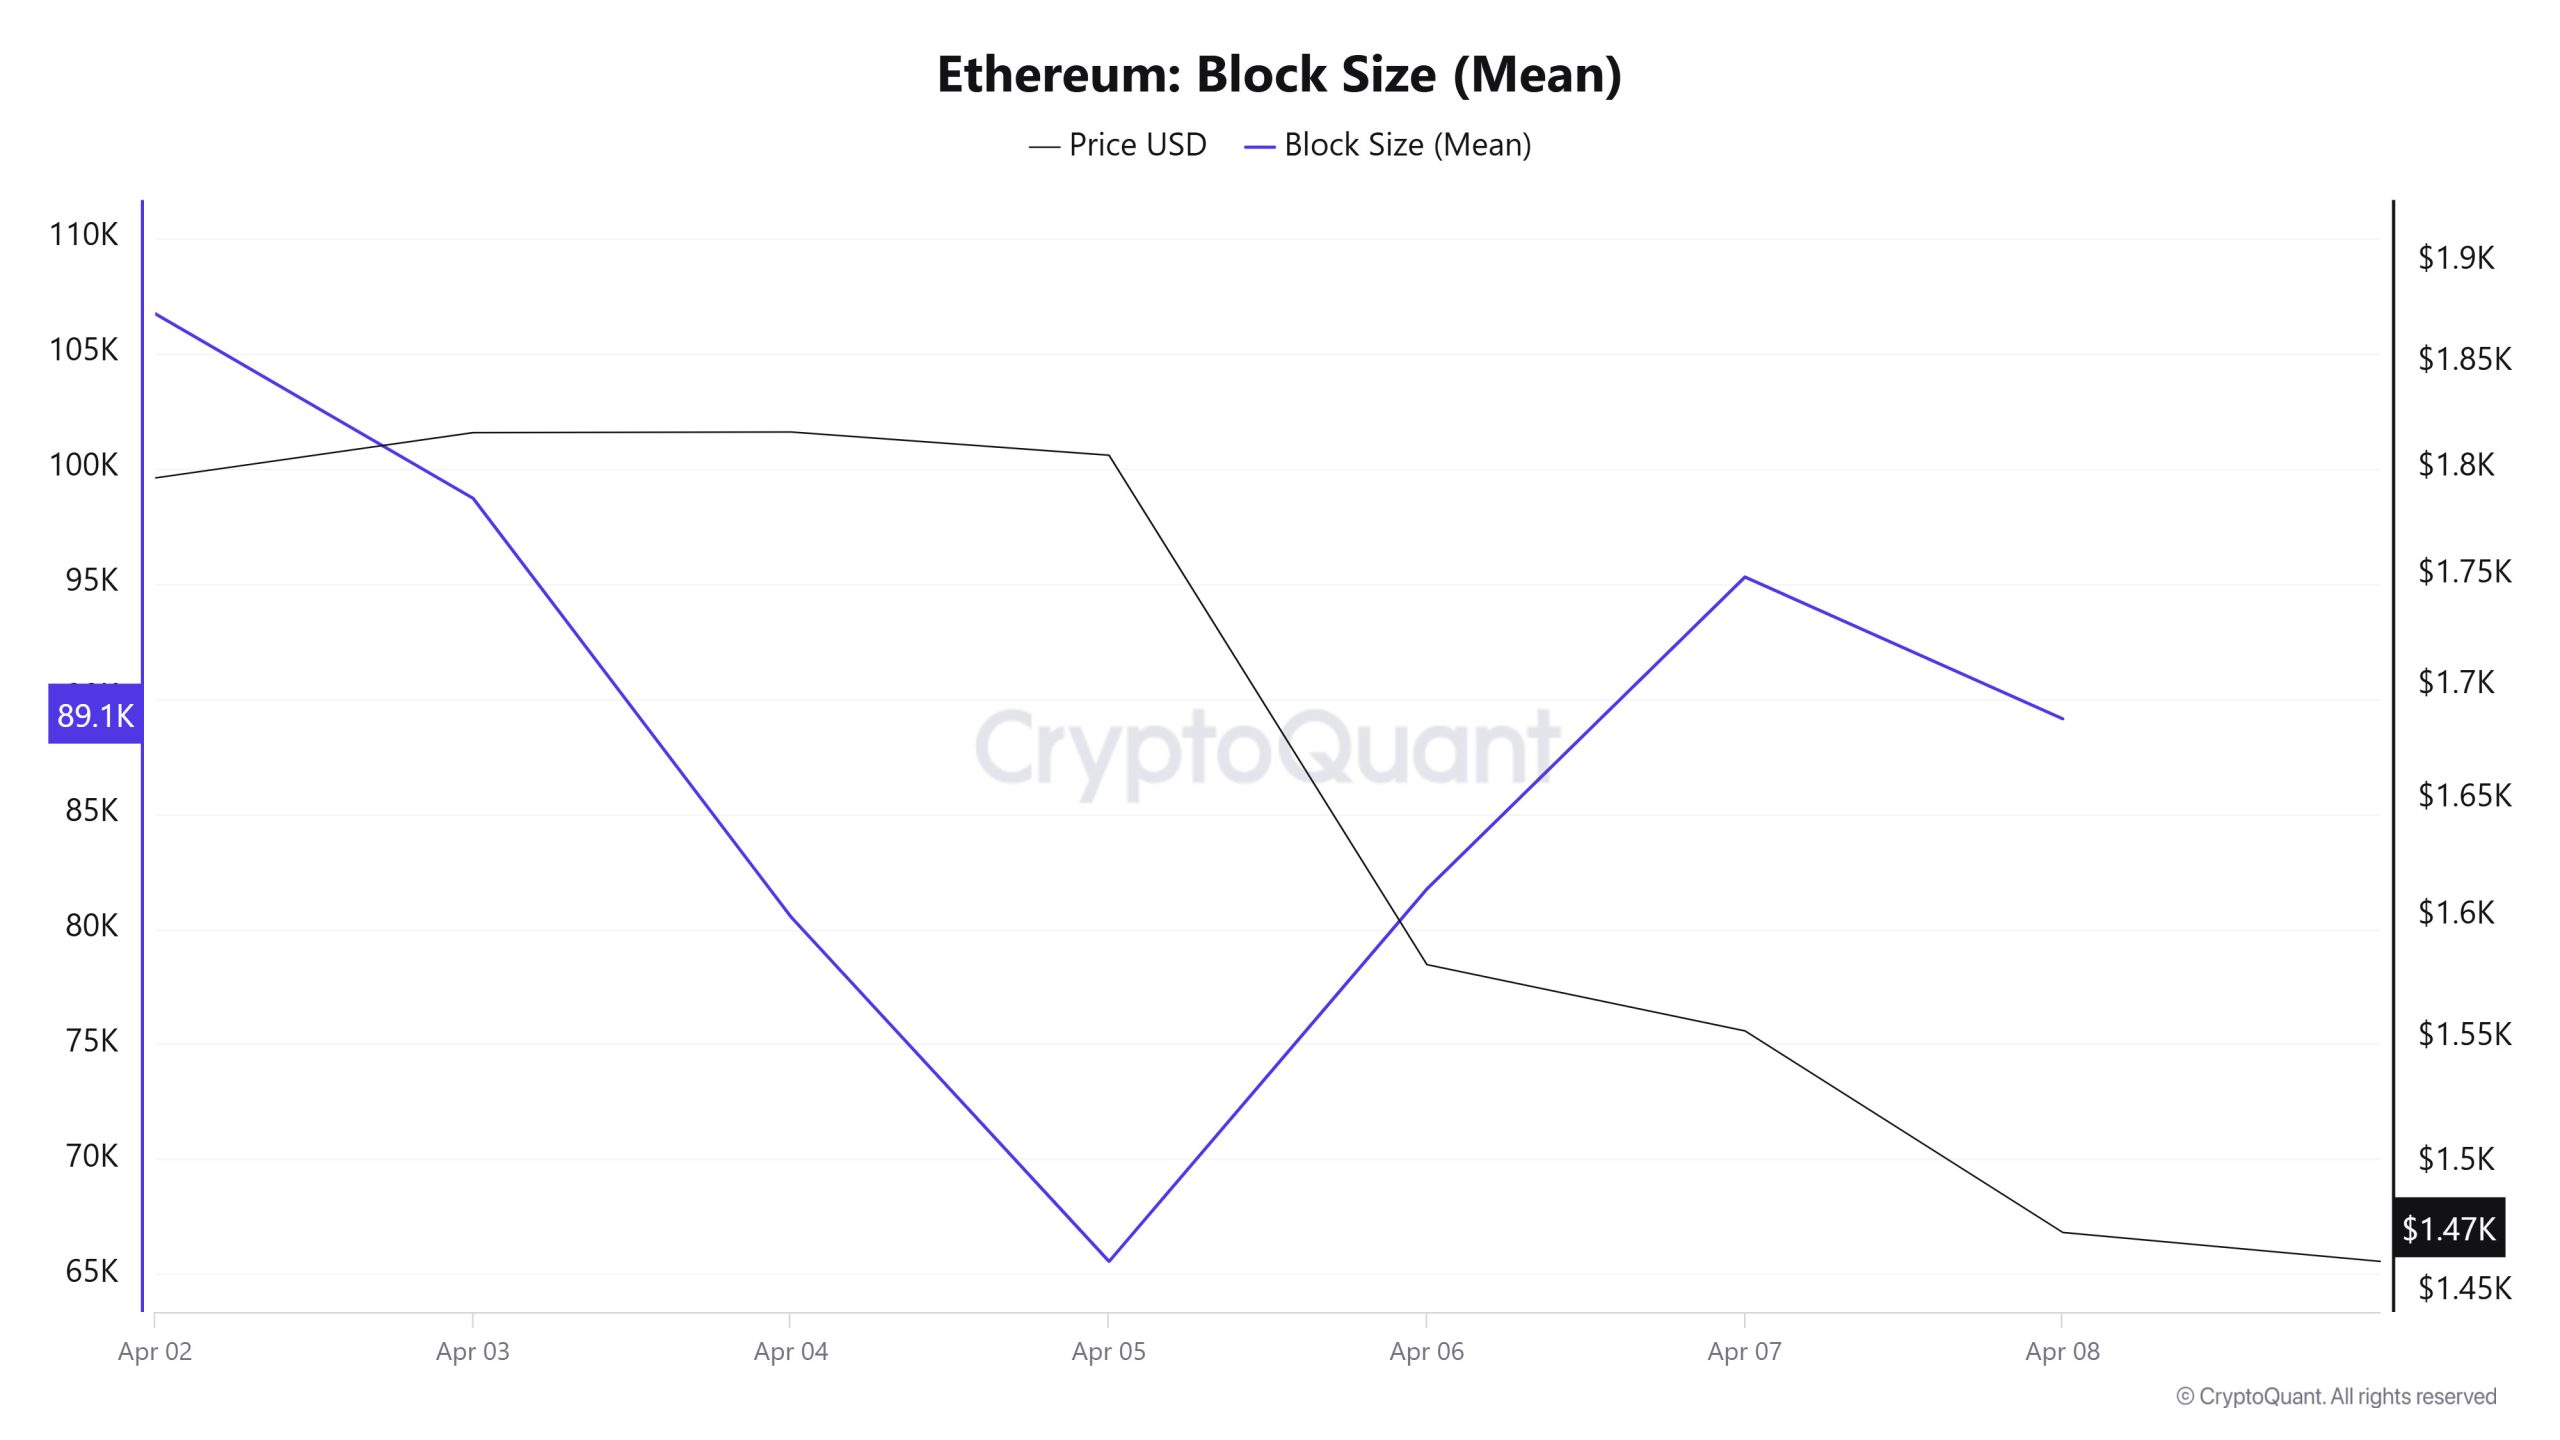
Between April 2 and April 8, when we examine the Ethereum Block Size table, there was a slight decrease en the middle of the week, but then it increased towards the end of the week. The block size of 106,711 bytes el April 2 reached 89,117 bytes por April 8. There was a negative correlation between Block Size and Ethereum price during the week.
Block Interval
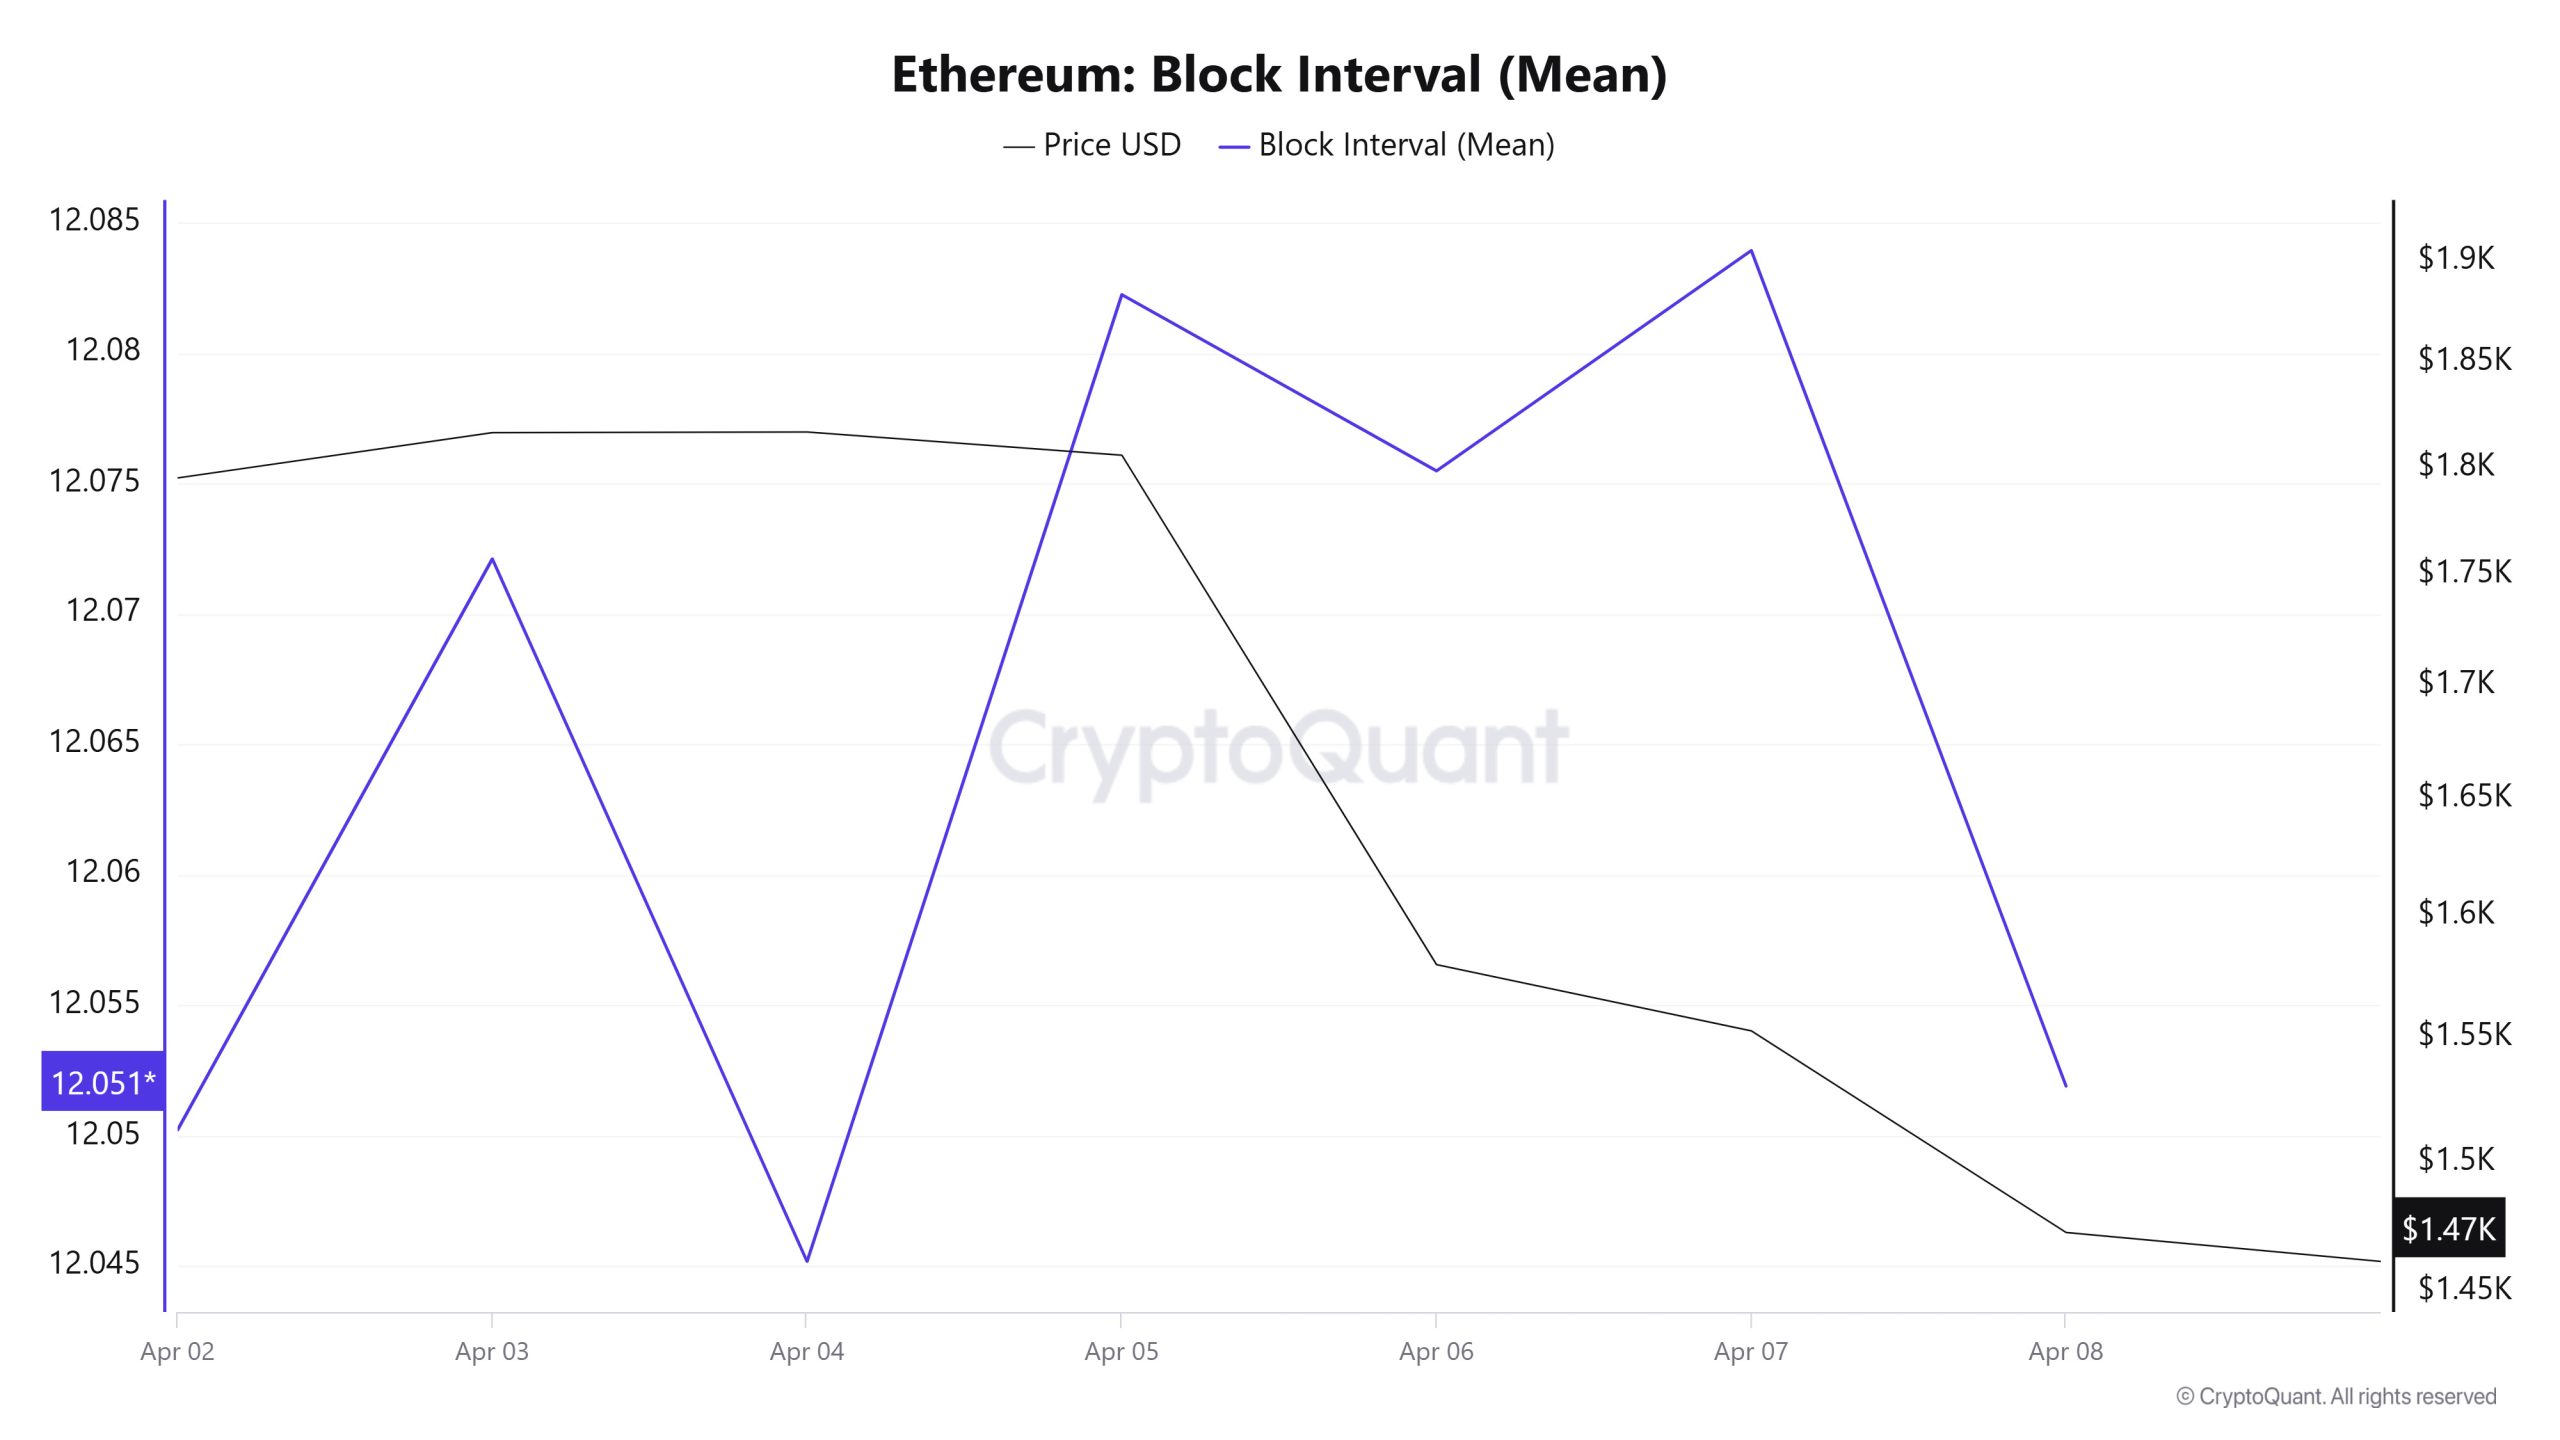
Between April 2 and April 8, when we examine the Ethereum Block Interval table, although there was an increase towards the middle of the week, there was a slight decrease en the time between blocks at the end of the week. The time between blocks, which was 12.05 segundos el April 2, was 12.05 segundos el April 8, with the same duration. During the week, a positive correlation was observed between Block Interval and Ethereum price.
Transaction
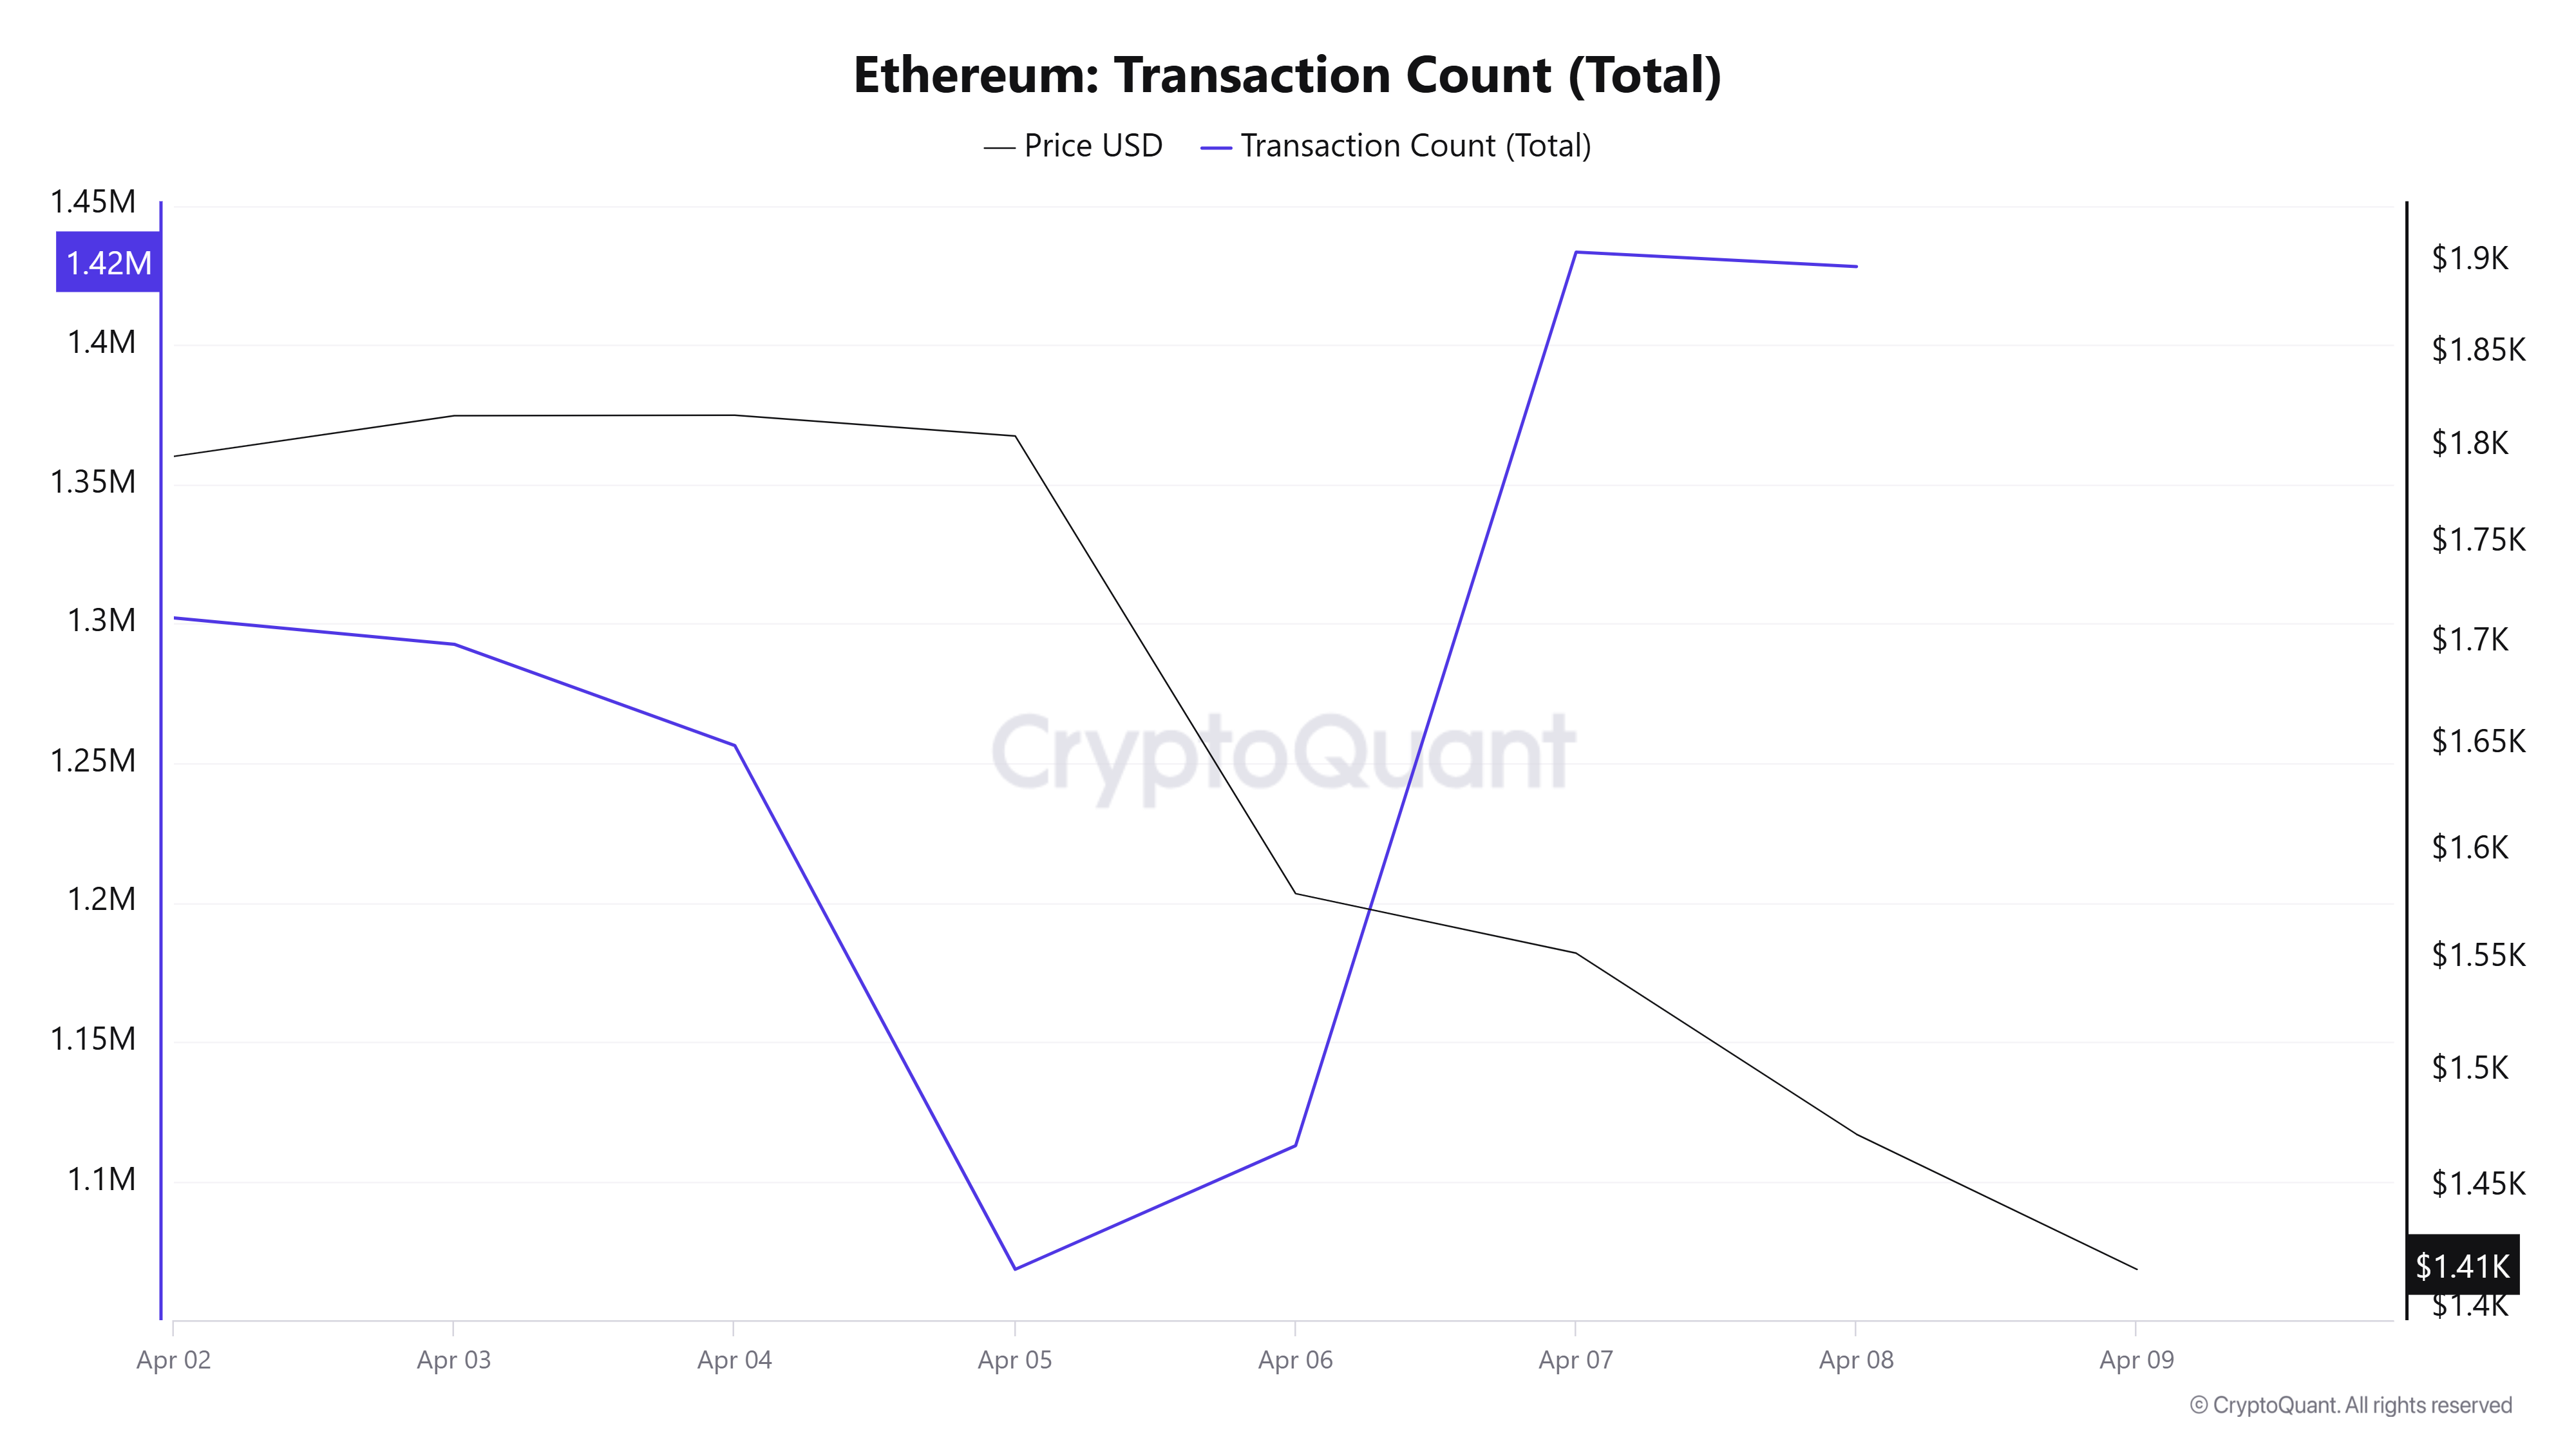
Last week, 8,693,201 transactions were processed, while this week’s number decreased por about 9.19% to 7,894,241. The highest number of transactions was 1,433,231 el April 7, while April 5 saw the lowest number of transactions el the network for the week with 1,068,681 transactions. The significant decrease en the number of transactions compared to last week seems to be quite negative en terms of network utilization. The negative correlation between price movements and the number of transfers throughout the week can be seen as another negative indicator.
Tokens Transferred
While the amount of Ethereum transferred last week was 9,866,637, 12,523,626 Ethereum was transferred this week, an increase of 26.9%. On April 7, 3,707,566 Ethereum transfers were recorded, the highest token transfer number of the week and the 3rd highest token transfer number of 2025. On April 5, the lowest transfer amount of the week was 695,415 Ethereum transfers.
In addition to the decrease en the number of transactions, the increase en the amount of Ethereum transferred shows that the activity el the weakening network has been selling throughout this week. If this situation continues, it raises concerns that the ETH price could fall further.
Estimated Leverage Ratio
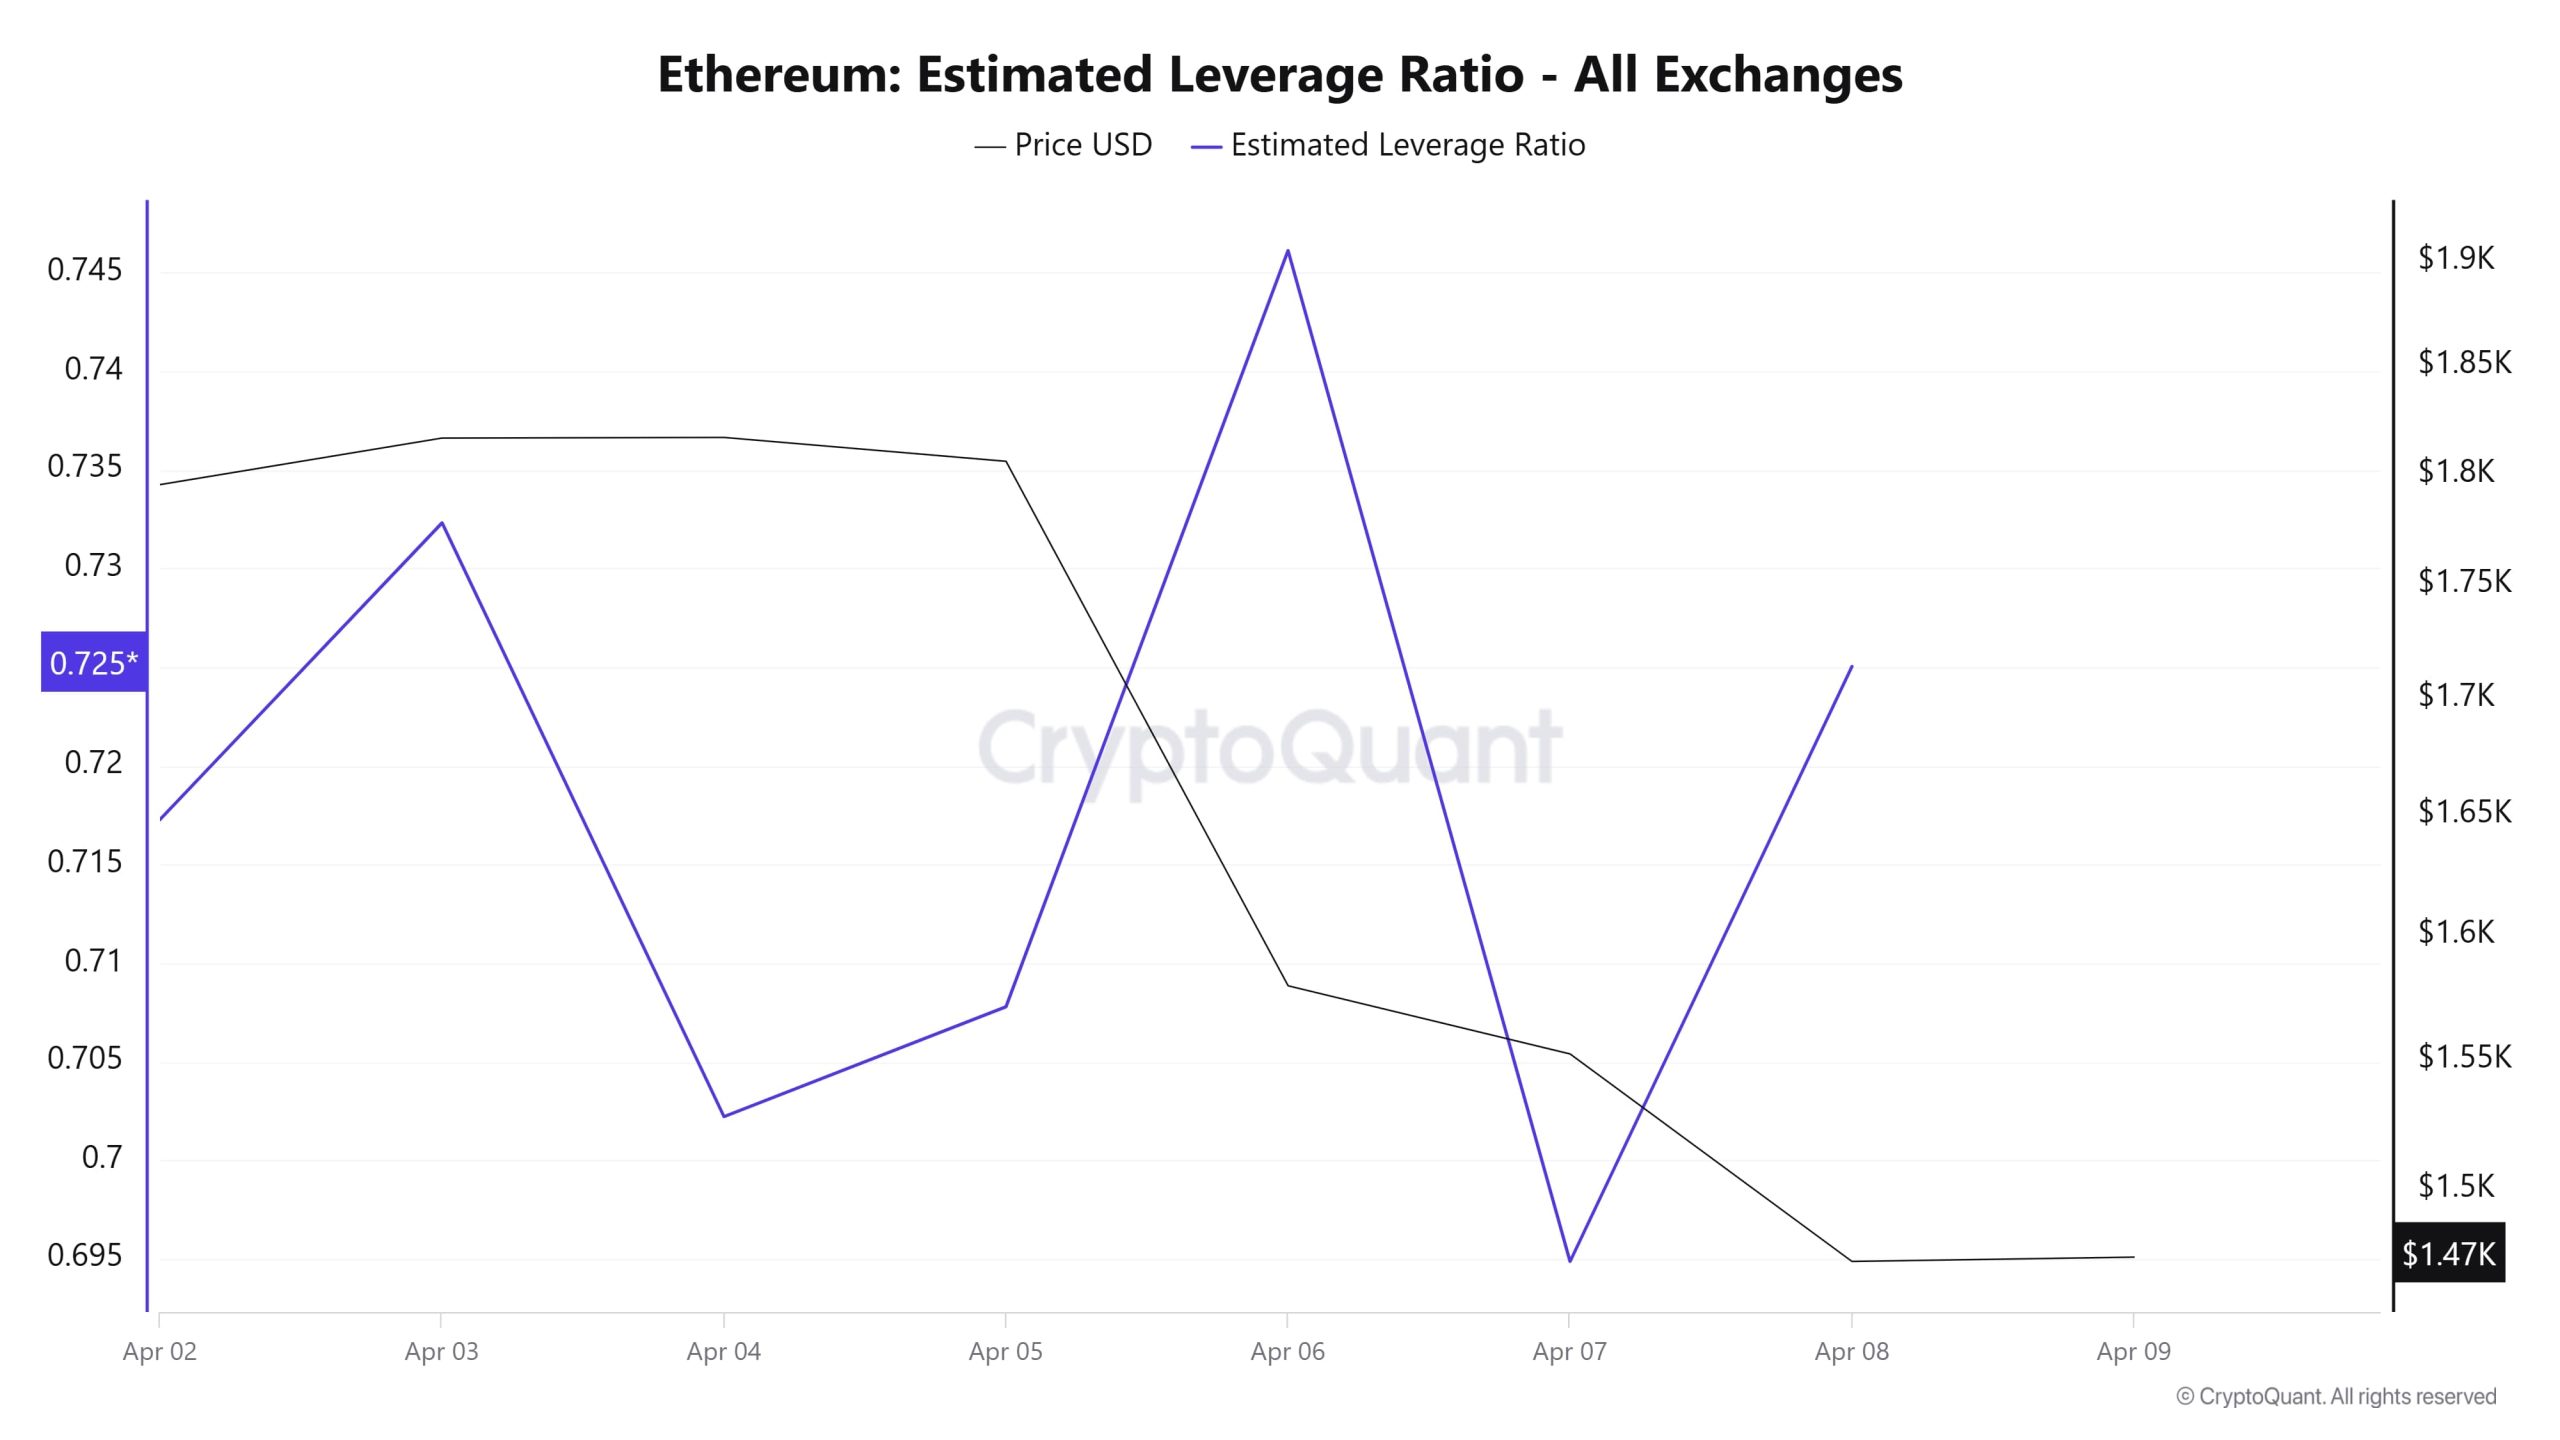
During the entire 7-day period, the metric exhibited a turbulent movement with a lot of volatility. ELR (Estimated Leverage Ratio), which had a value of 0.717 at the beginning of the process, increased towards the middle of the process and reached 0.732, but retreated from the peak en the last period of the process and is currently at 0.725. The peak en this process was measured as 0.746 el April 6. A higher ELR means that participants are willing to take el more risk and usually indicates bullish conditions or expectations. It should be noted that these rises can also be caused por a decrease en reserves. When we look at Ethereum reserves, while there were 18.24 million reserves at the beginning of the process, this figure continued to increase towards the end of the process and increased to 18.47 million. At the same time, Ethereum’s Open Interest is seen as 20.55 billion dollars at the beginning of the process. In the middle of this process, it decreased to 20.08 billion dollars. It currently stands at $ 17.04 billion. With all this data, the ELR metric did not move stably. The price of the asset moved en parallel with the open interest and fell from $1,950 to $1,450. While the increase en the amount of reserves and the decrease en the open interest rate should cause a decrease en the ELR rate, the turbulent movement of the ELR rate reveals that the bear and bull are at war el the ETH front. As a result, the increase en reserves and the decrease en open interest show that pessimism continues en this market, but considering that the accumulation is increasing with the increase en volume-based transactions, the dynamics show us that it may be bullish.
Legal Notice
The investment information, comments and recommendations contained en this document do not constitute investment advisory services. Investment advisory services are provided por authorized institutions el a personal basis, taking into account the risk and return preferences of individuals. The comments and recommendations contained en this document are of a general type. These recommendations may not be suitable for your financial situation and risk and return preferences. Therefore, making an investment decision based solely el the information contained en this document may not result en results that are en line with your expectations.
NOTE: All data used en Bitcoin onchain analysis is based el Cryptoqaunt.
