
Active Adresses
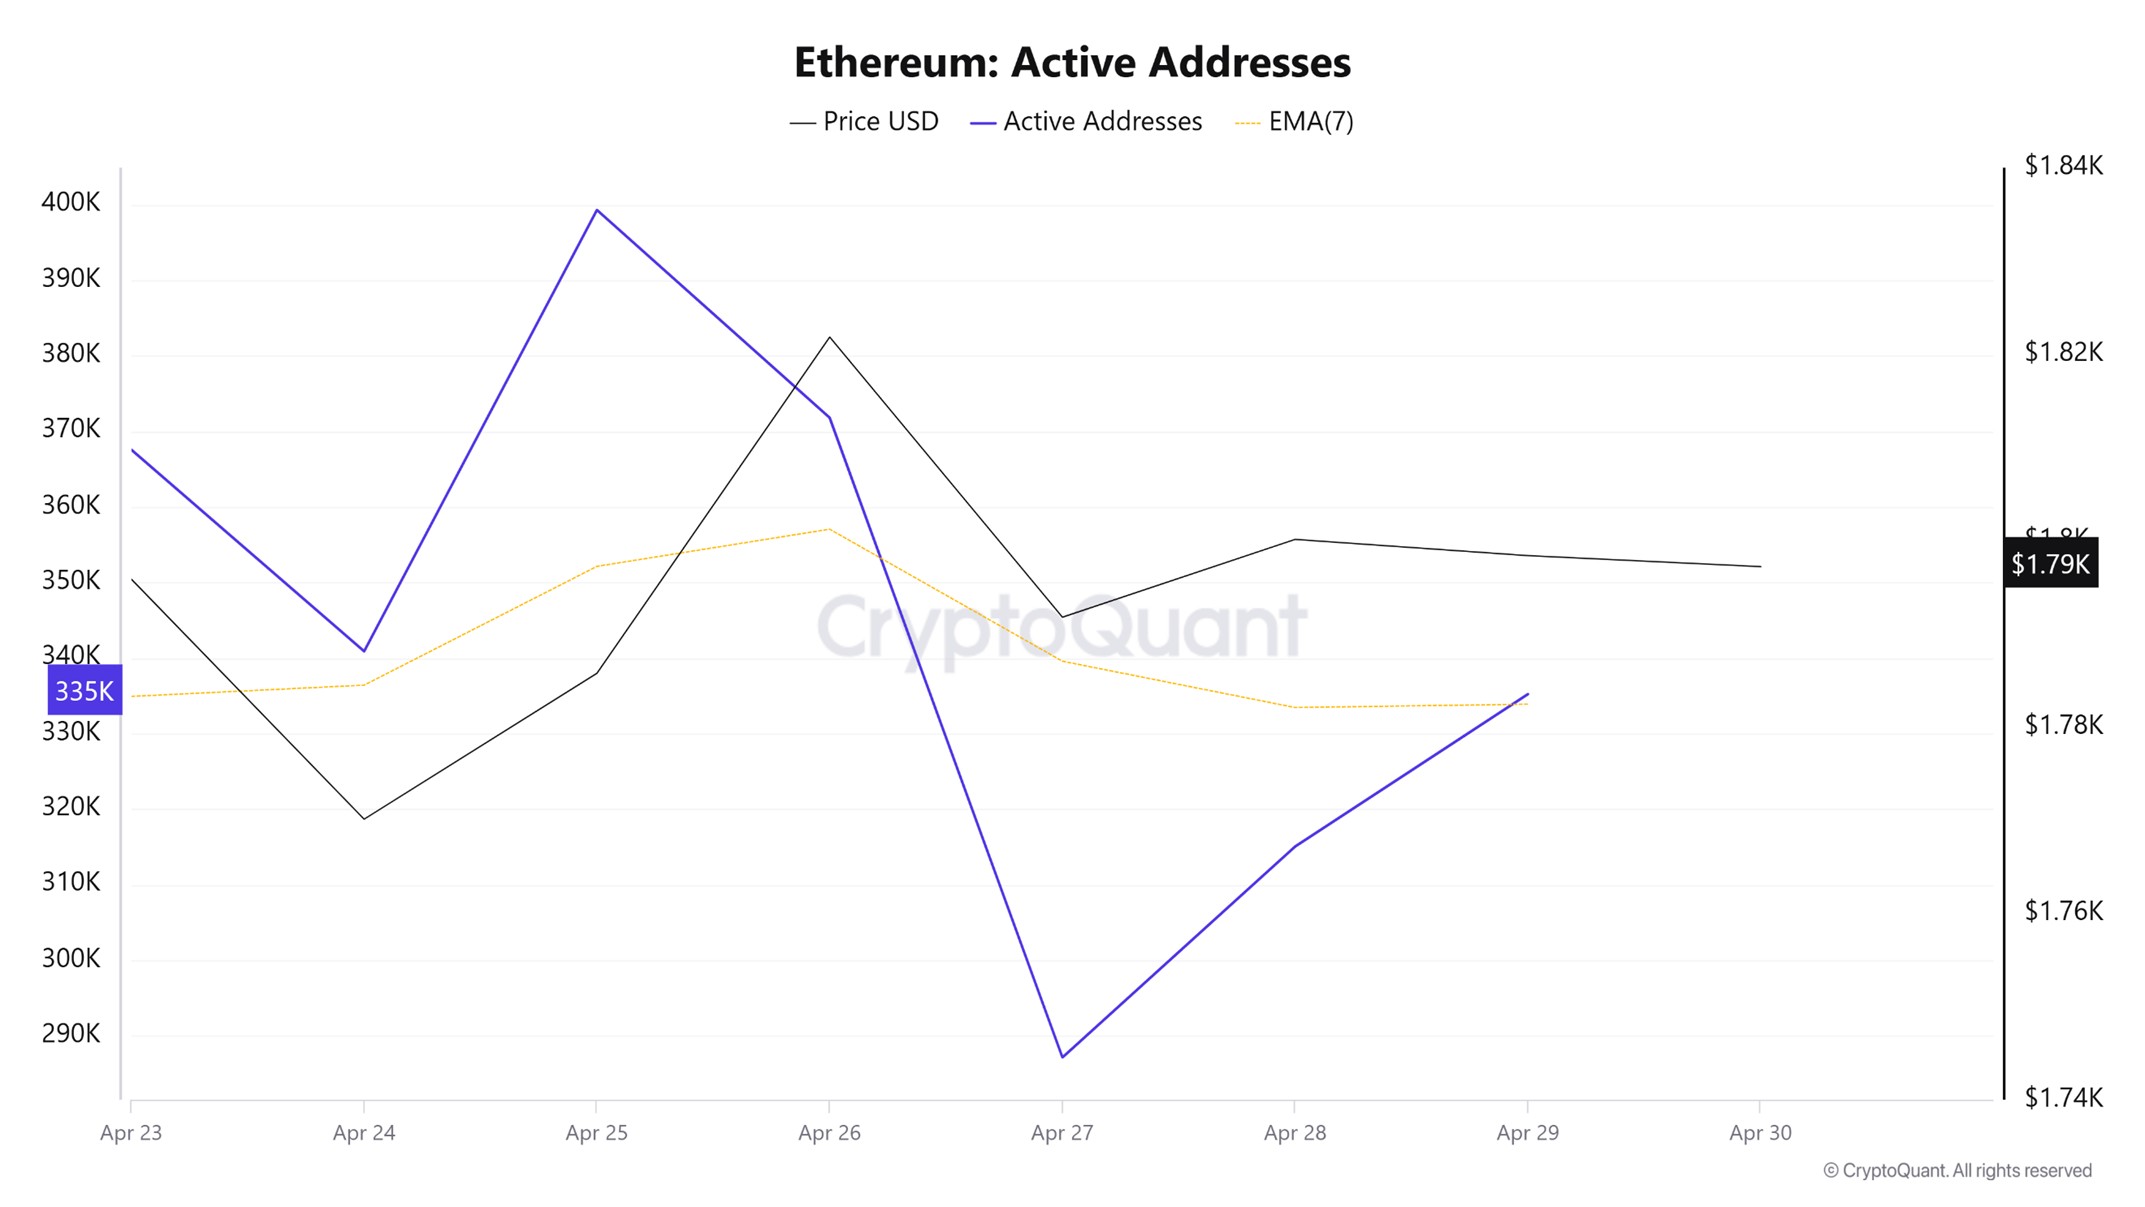
In the number of active addresses, there were 371,806 active entries to the ETH network between April 23 and April 30, 2025 this week. During this period, Ethereum rose to $1,851. The chart shows that Ethereum purchases are gradually decreasing en the area where the price and the number of active addresses intersect. When we follow the 7-day simple moving average, it is observed that the price follows an upward trend el the dates when this average cuts the price. This situation indicates that the Ethereum price is experiencing entries from the $ 1,770 levels.
Active Sending Addresses
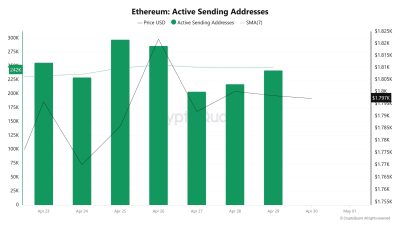
With the Black Line (price line) en active shipping addresses, there was a significant drop en active shipping addresses el April 27. On the day when the price hit its lowest point, active shipping addresses fell as low as 204,734, indicating that buyers sold their positions as Ethereum remained at 1,791 for a while. As a result, it is seen that price drops cause an acceleration en sending addresses.
Active Receiving Addresses
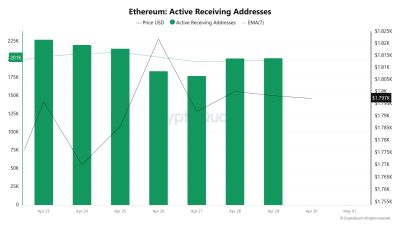
Along with the Black Line (price line) en active sending addresses, there has been a significant rise en active buying addresses after April 24. On the day of the price high, active shipping addresses rose as high as 220,257, indicating that buyers took their positions at Ethereum’s $1,770 level.
Total Value Staked
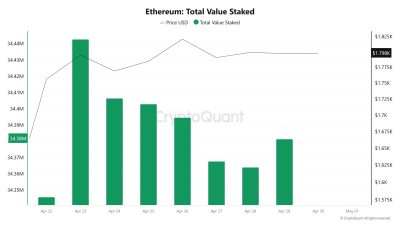
On April 23, ETH price was at 1,795 while Total Value Staked was 34,443,136. As of April 29, ETH price was at 1,798 while Total Value Staked Ratio was 34,381,750. Compared to last week, ETH price increased por 0.17% while Total Value Staked Ratio decreased por 0.18%.
Staking Inflows
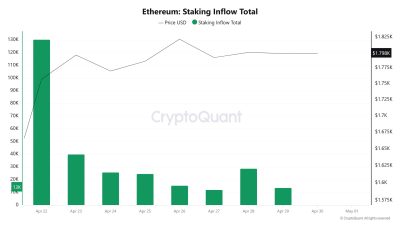
On April 23rd, ETH price was at 1,795 while Staking Inflow Ratio was 39,967. As of April 29th, ETH price increased to 1,798 while Staking Inflow Ratio decreased to 13,656. Compared to last week, ETH price increased por 11.35% while Staking Inflow Ratio decreased por 65.83%.
Derivatives
Open Interest
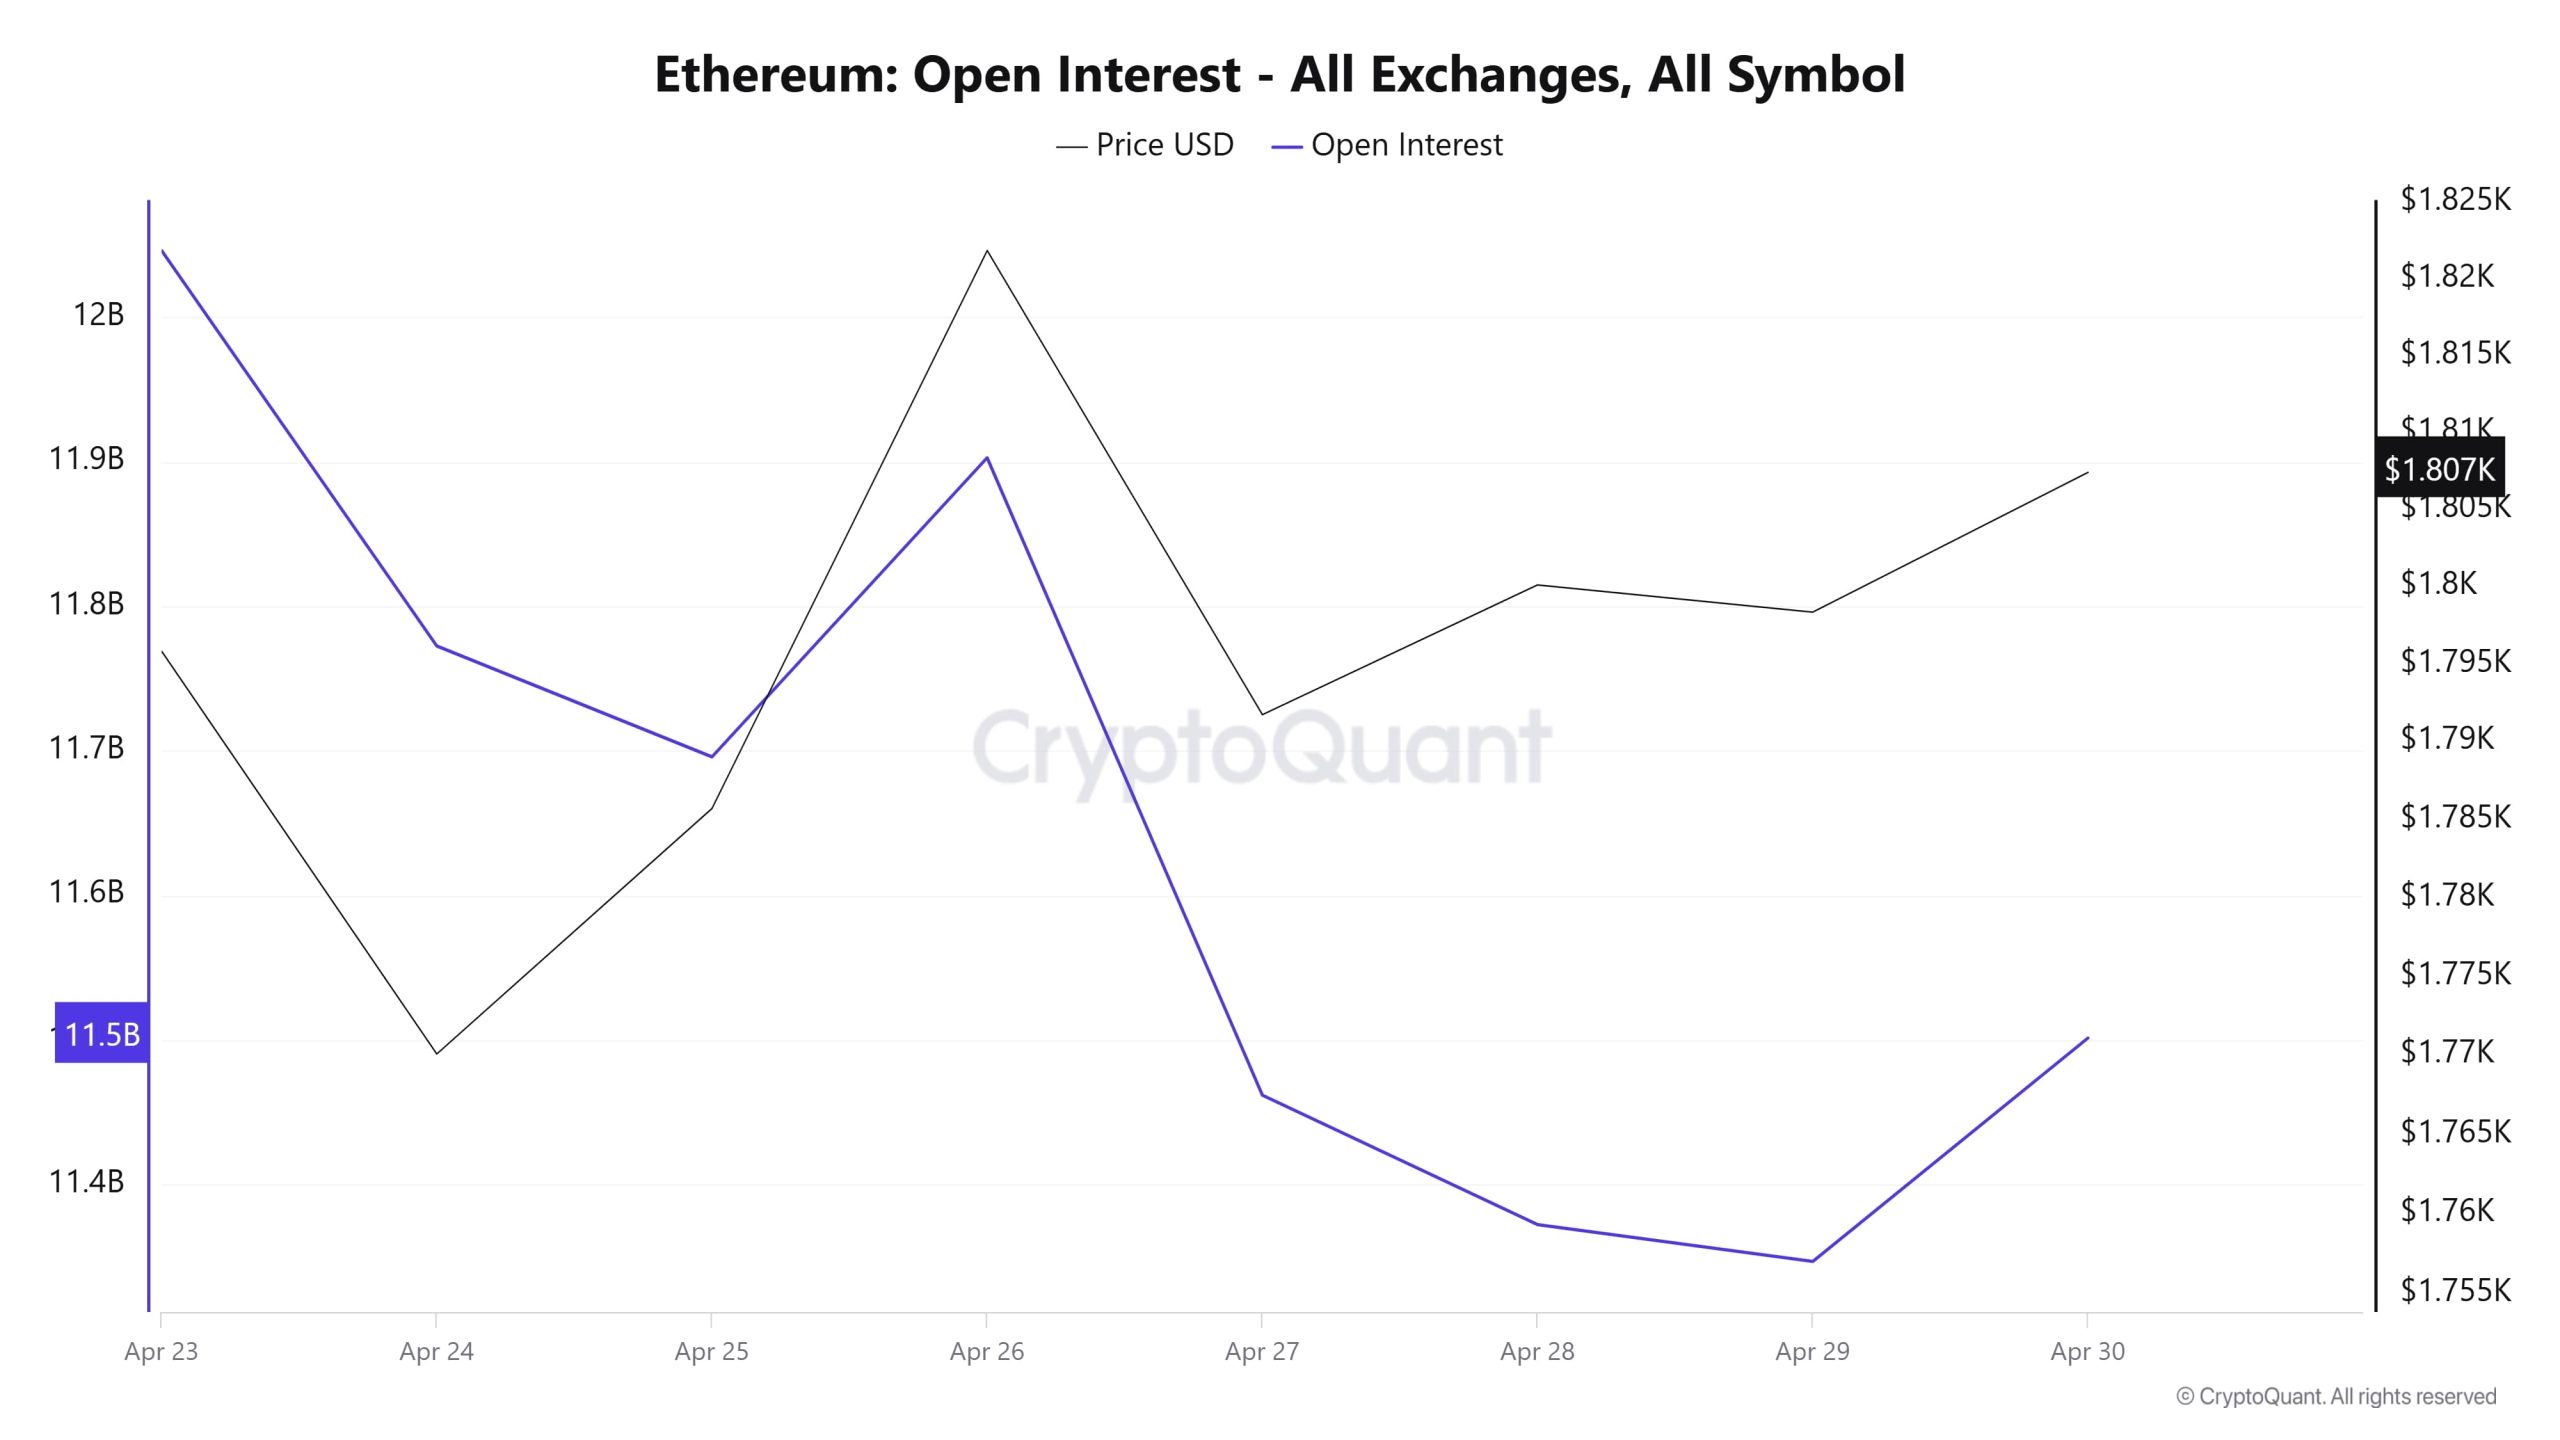
During the week of April 23-30, a significant downward trend en open positions en the Ethereum futures market stood out. The open interest value, which started the week above $12 billion, declined slightly el April 24 and 25, but recovered with the price el April 26. However, this rally was followed por a sharp decline en open interest, which fell to $11.4 billion as of April 27. This sharp unwinding indicates that leveraged long positions were closed and short positions increased. This decline en open positions suggests that the market remains cautious and risk appetite has decreased despite upside attempts el the price side. On April 28 and 29, the downward trend continued, while a limited recovery was seen el April 30. This recovery suggests that short positions were closed or that the market was looking for direction again.
Funding Rate
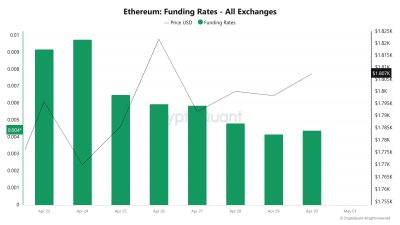
Ethereum’s funding rates en the futures market showed a notable change between April 23 and April 30. During this period, funding rates gradually decreased from high levels, while Ethereum’s price generally followed a sideways-upward trend. In particular, funding rates rose above 0.009% el April 23 and 24, indicating that market participants were predominantly bullish. Such high rates indicate excessive long accumulation en the market, which usually increases the risk of a correction. As a matter of fact, the fact that the price declined el April 24 while the funding rate peaked supports this thesis. In other words, the price retreated while the market was expecting a rise, suggesting that funding rates reflected speculative excesses.
In the following days, from April 25th onwards, funding rates declined remarkably. This rate dropped to 0.004% at the end of the period. During the same period, Ethereum’s price generally remained stable between $1,790 and $1,810, despite short-term fluctuations. This indicates that despite the decline en risk appetite en the market, the price has settled el a healthier ground, free from speculative pressures. In particular, the price rose as high as $1,815 el April 26, indicating that the price could move upwards even though the funding rate remained relatively low. Such divergences sometimes indicate that buying interest from spot markets was effective or that the price found support por closing short positions.
Long & Short Liquidations
Last week, ETH priced en a narrow range of $1,756 – $1,829. However, long and short liquidations remained low compared to last week’s rates. A long of $218 million and a short of $193 million were liquidated.
| Date | Long Amount (Million $) | Short Amount (Million $) |
|---|---|---|
| April 23 | 48.20 | 60.25 |
| April 24 | 33.17 | 17.36 |
| April 25 | 26.37 | 29.37 |
| April 26 | 14.94 | 22.01 |
| April 27 | 25.04 | 16.94 |
| April 28 | 48.44 | 28.69 |
| April 29 | 22.82 | 18.48 |
| Total | 218.98 | 193.10 |
Supply Distribution
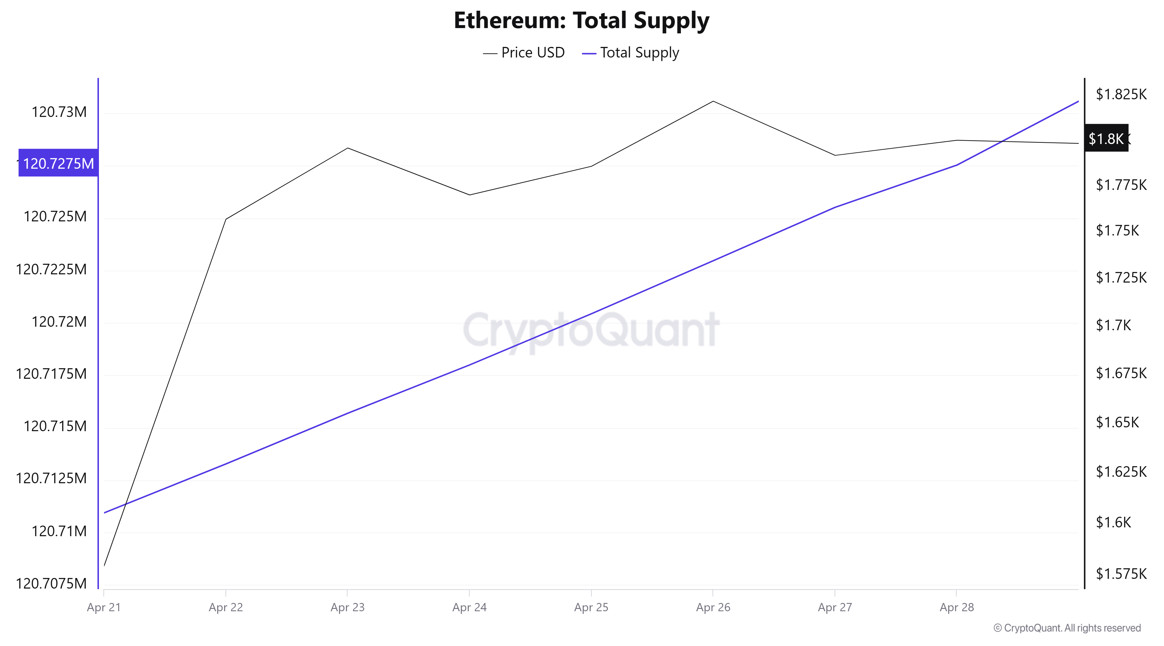
Total Supply: It reached 120,727,533 units, up about 0.01375% from last week.
New Supply: The amount of ETH produced this week was 16,597.
Velocity: Velocity, which was 7.73 last week, was 7.84 as of April 28.
| Wallet Categoría | 21.04.2025 | 28.04.2025 | Change (%) |
|---|---|---|---|
| 100 – 1k ETH | 9.2773M | 9.2546M | -0.2451% |
| 1k – 10k ETH | 12.4525M | 12.5485M | 0.7702% |
| 10k – 100k ETH | 16.149M | 15.9611M | -1.1634% |
| 100k+ ETH | 4.6361M | 4.6515M | 0.3327% |
According to the latest data, there was a limited decrease of 0.2451% en 100 – 1k ETH wallets, while the 1k – 10k ETH category saw a remarkable increase of 0.7702%. In the 10k – 100k ETH range, there was a significant decrease of 1.1634%, while the most significant change occurred en 100k+ ETH wallets with an increase of 0.3327%.
Exchange Reserve
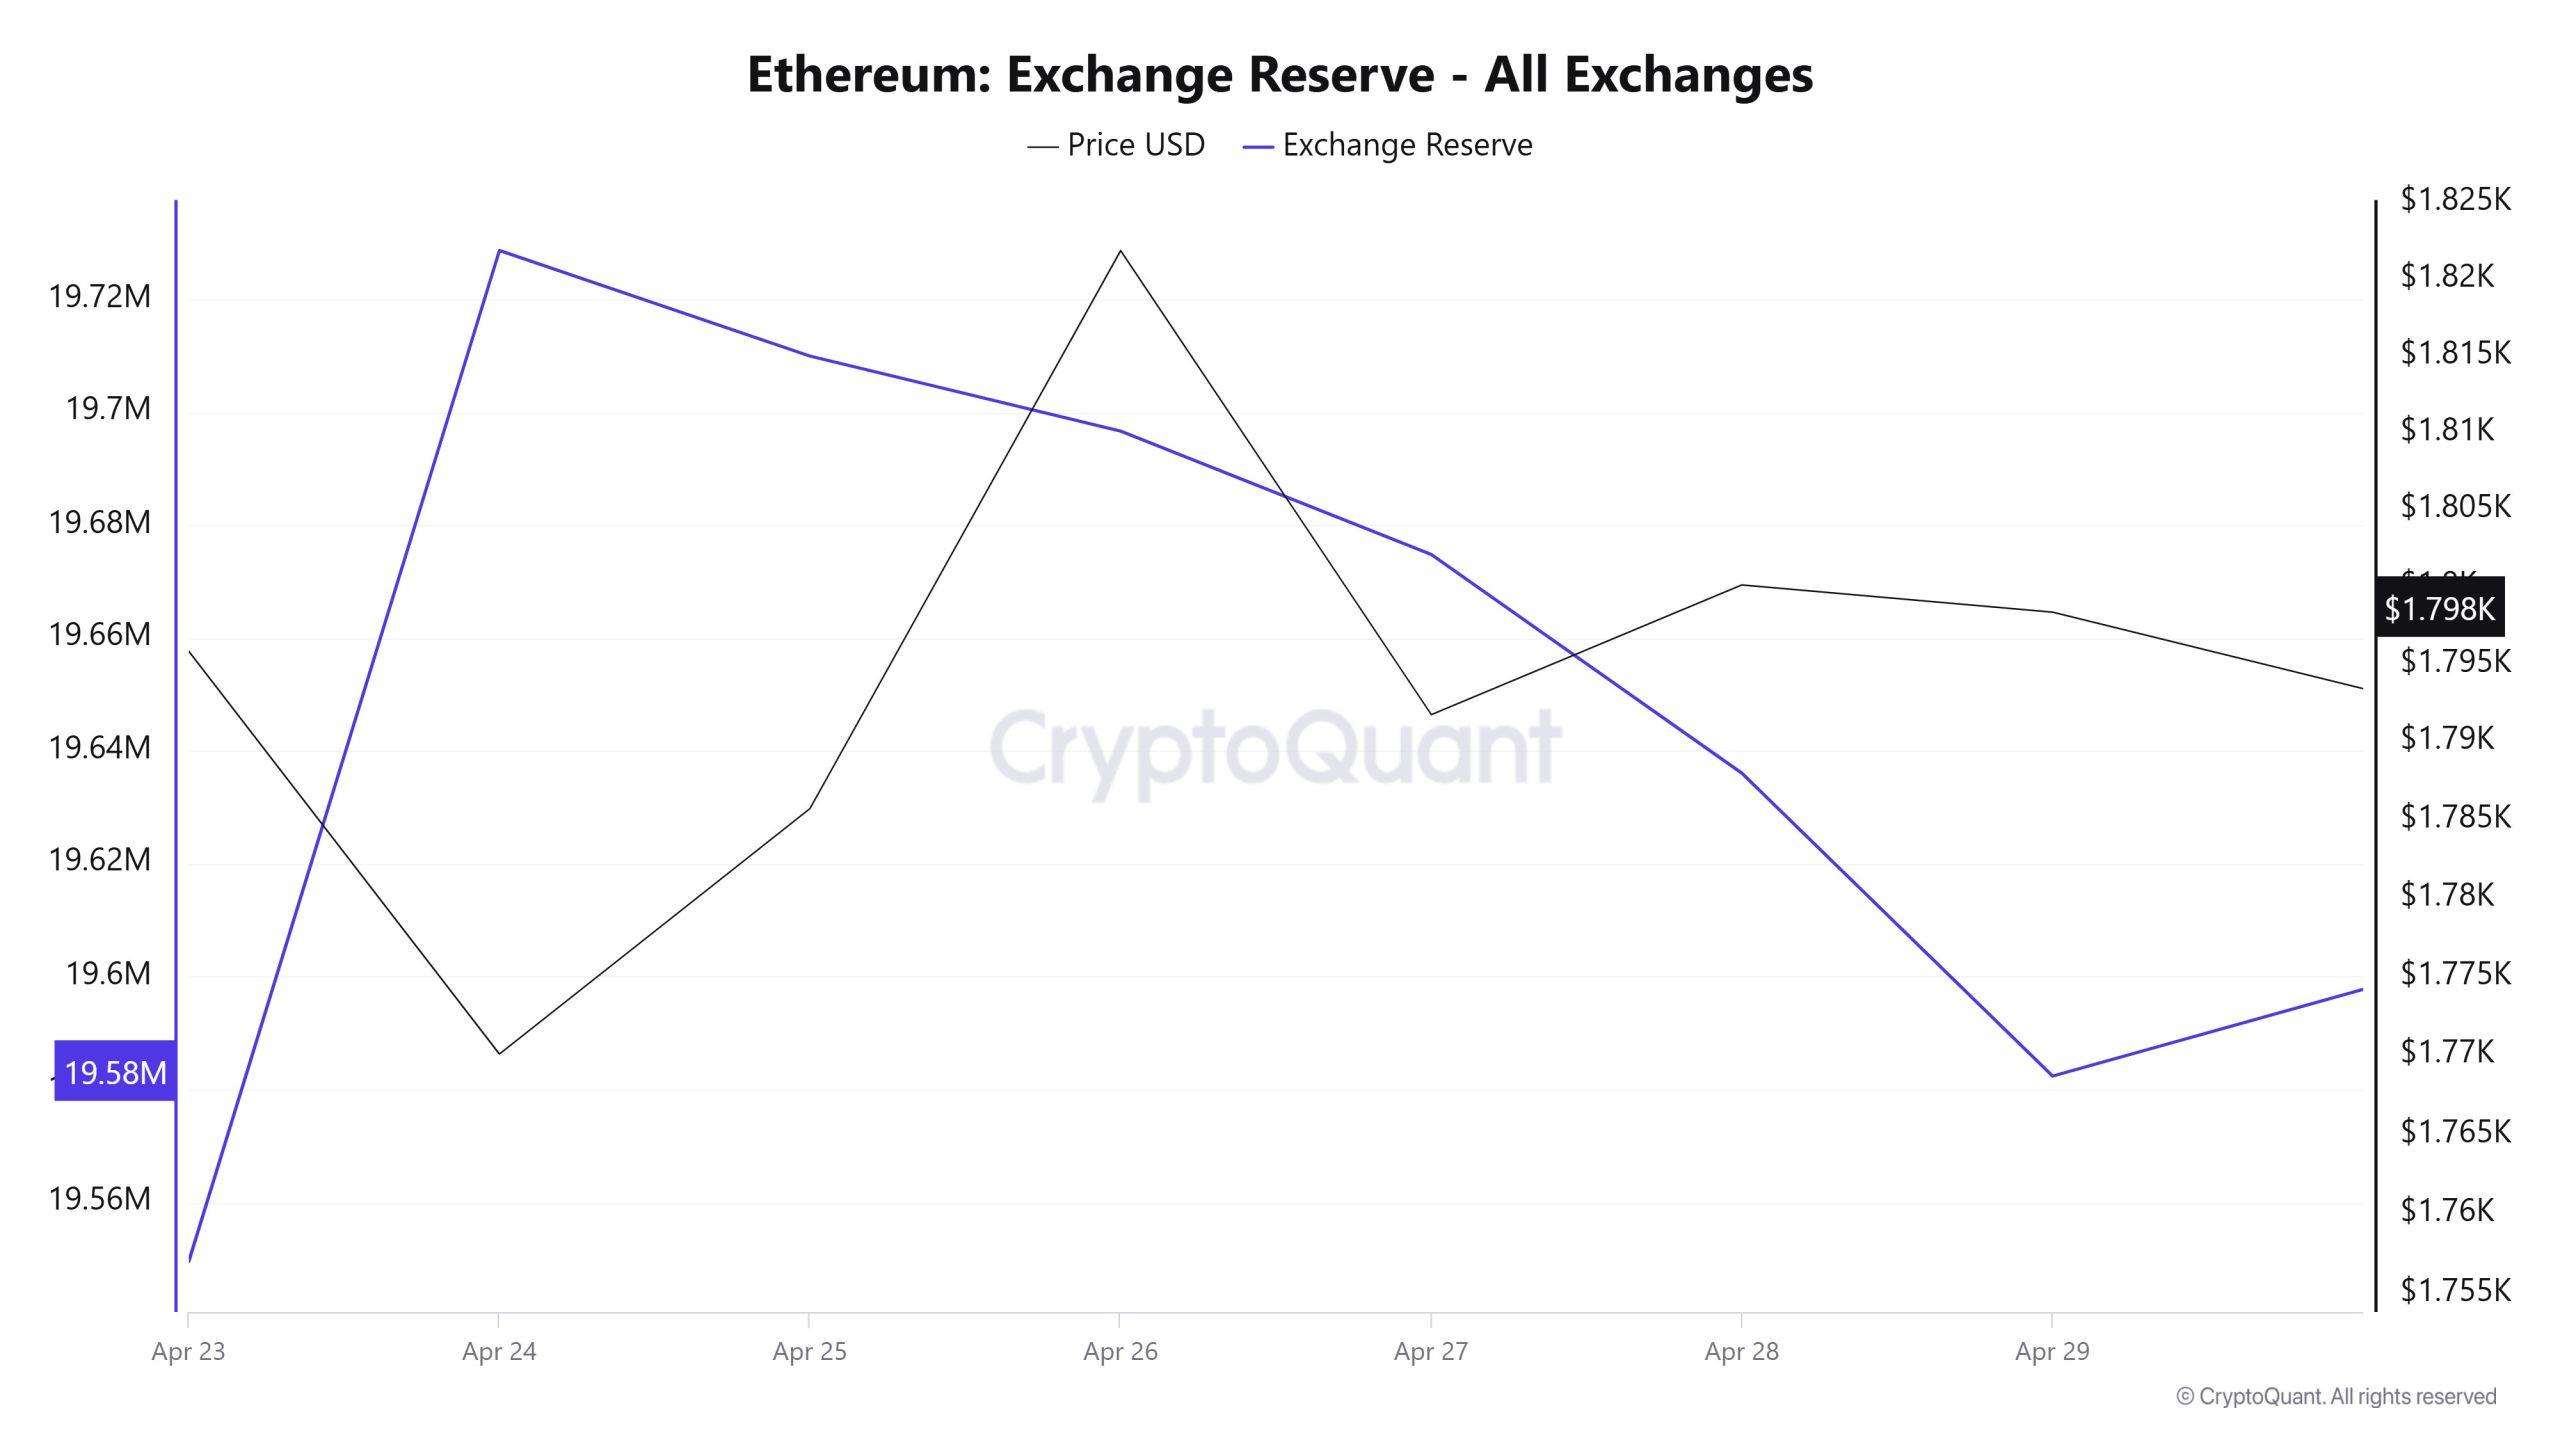
Between April 23-29, 2025, Ethereum reserves el exchanges increased from 19,549,551 ETH to 19,582,384 ETH. During this period, there was a total net inflow of 32,833 ETH and the Ethereum reserves of exchanges increased por 0.17%. The price of Ethereum remained almost flat during the same period, closing at $1,798 el April 29, 2025, compared to the daily close of $1,796 el April 23, 2025. This outlook suggests that the market is balanced en terms of both price movement and reserve growth. Although net inflows slightly increased the sell risks en the short term, the stable price suggests that this pressure remains limited. Therefore, a neutral outlook prevails based el both supply-demand balance and price stability.
| Date | 23-Apr | 24-Apr | 25-Apr | 26-Apr | 27-Apr | 28-Apr | 29-Apr |
|---|---|---|---|---|---|---|---|
| Exchange Inflow | 1,388,453 | 1,425,520 | 1,267,259 | 457,138 | 555,241 | 1,315,158 | 1,013,634 |
| Exchange Outflow | 1,400,901 | 1,246,467 | 1,285,941 | 470,438 | 577,095 | 1,353,895 | 1,067,280 |
| Exchange Netflow | -12,448 | 179,053 | -18,682 | -13,300 | -21,854 | -38,738 | -53,646 |
| Exchange Reserve | 19,549,551 | 19,728,604 | 19,709,922 | 19,696,622 | 19,674,768 | 19,636,030 | 19,582,384 |
| ETH Price | 1,796 | 1,770 | 1,786 | 1,822 | 1,792 | 1,800 | 1,798 |
Fees and Revenues
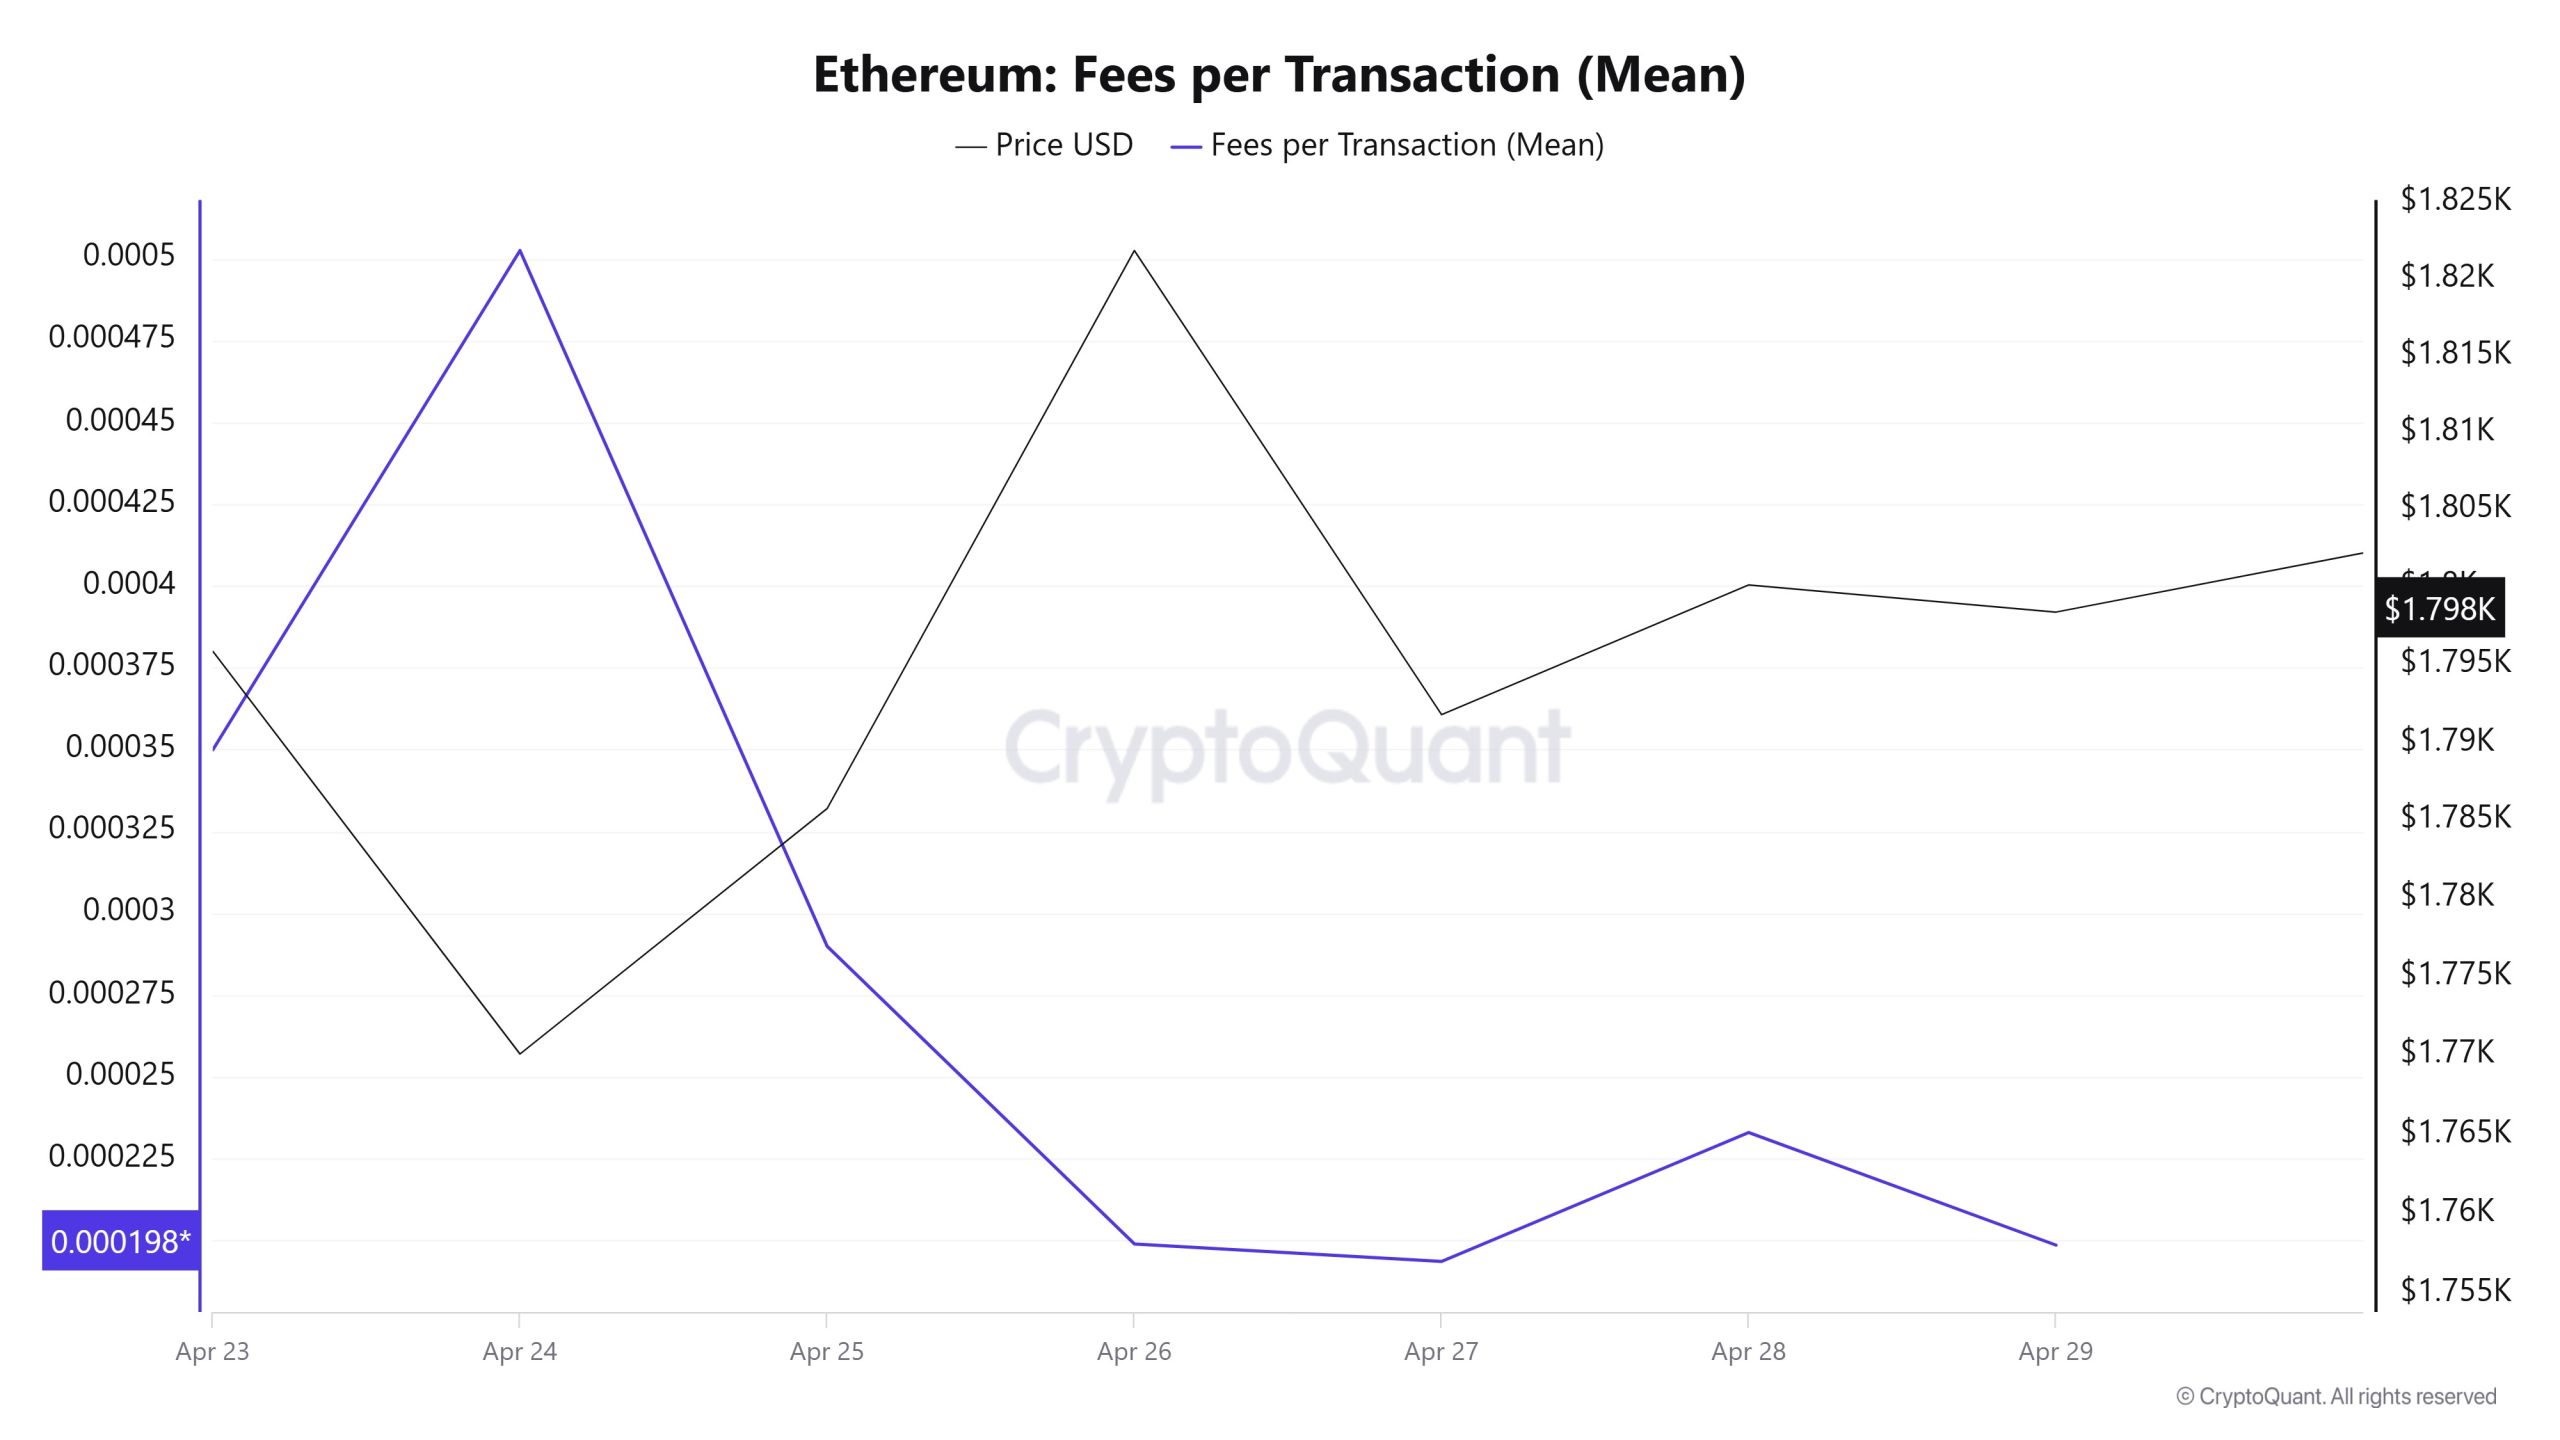
When the Ethereum Fees per Transaction (Mean) data between April 23- 29 is analyzed, it is seen that this value was at the level of 0.000349886973725551 el April 23, the first day of the weekly period. Until April 27, the value, which showed a downward trend, was realized at 0.000193633010356608 el this date.
On April 29, the last day of the weekly period, the value, which gained upward momentum again with the fluctuations en the Ethereum price, closed at 0.000198618282278447 el this date.
Bitcoin: Fees (Total)
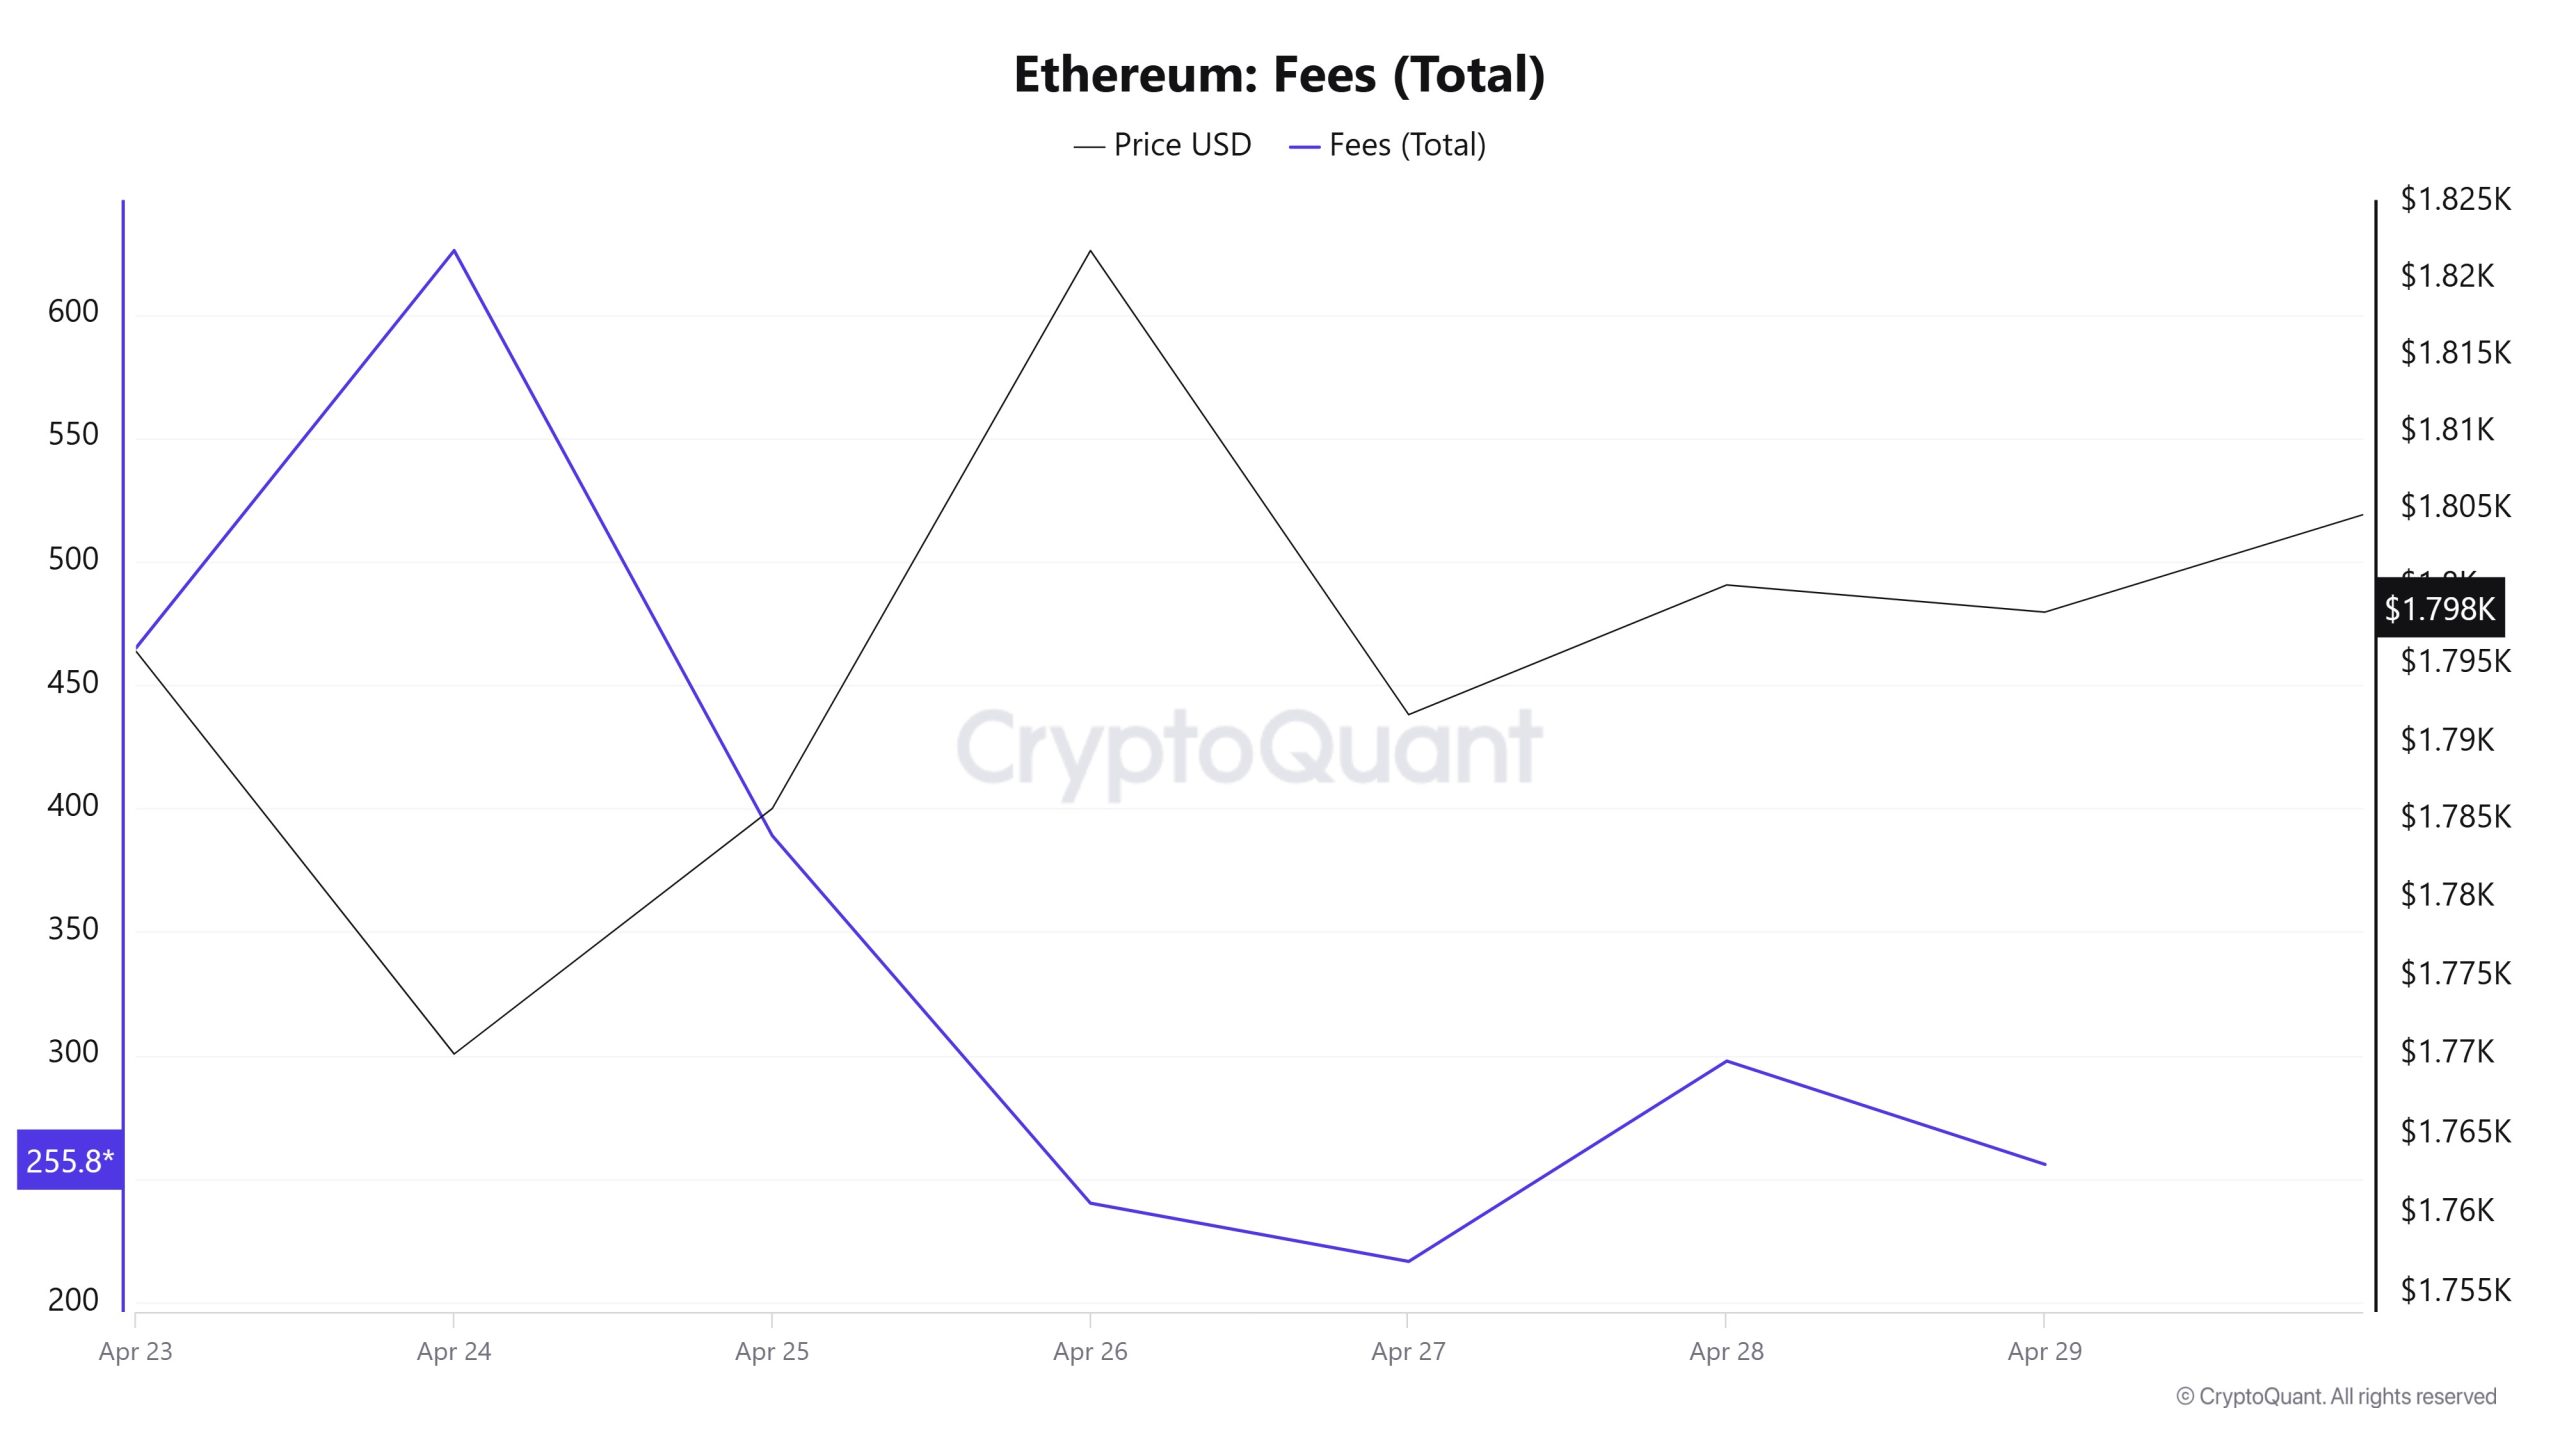
Similarly, when the Ethereum Fees (Total) data between April 23 and 29 were analyzed, it was seen that this value was 464.97354655822744 el April 23, the first day of the weekly period. The value, which showed a downward trend until April 27, was realized at 216.55780335175737 el this date.
On April 29, the last day of the weekly period, the value, which gained upward momentum again with the fluctuations en the Ethereum price, closed at 255.8497430804168 el this date.
Blocks Mined
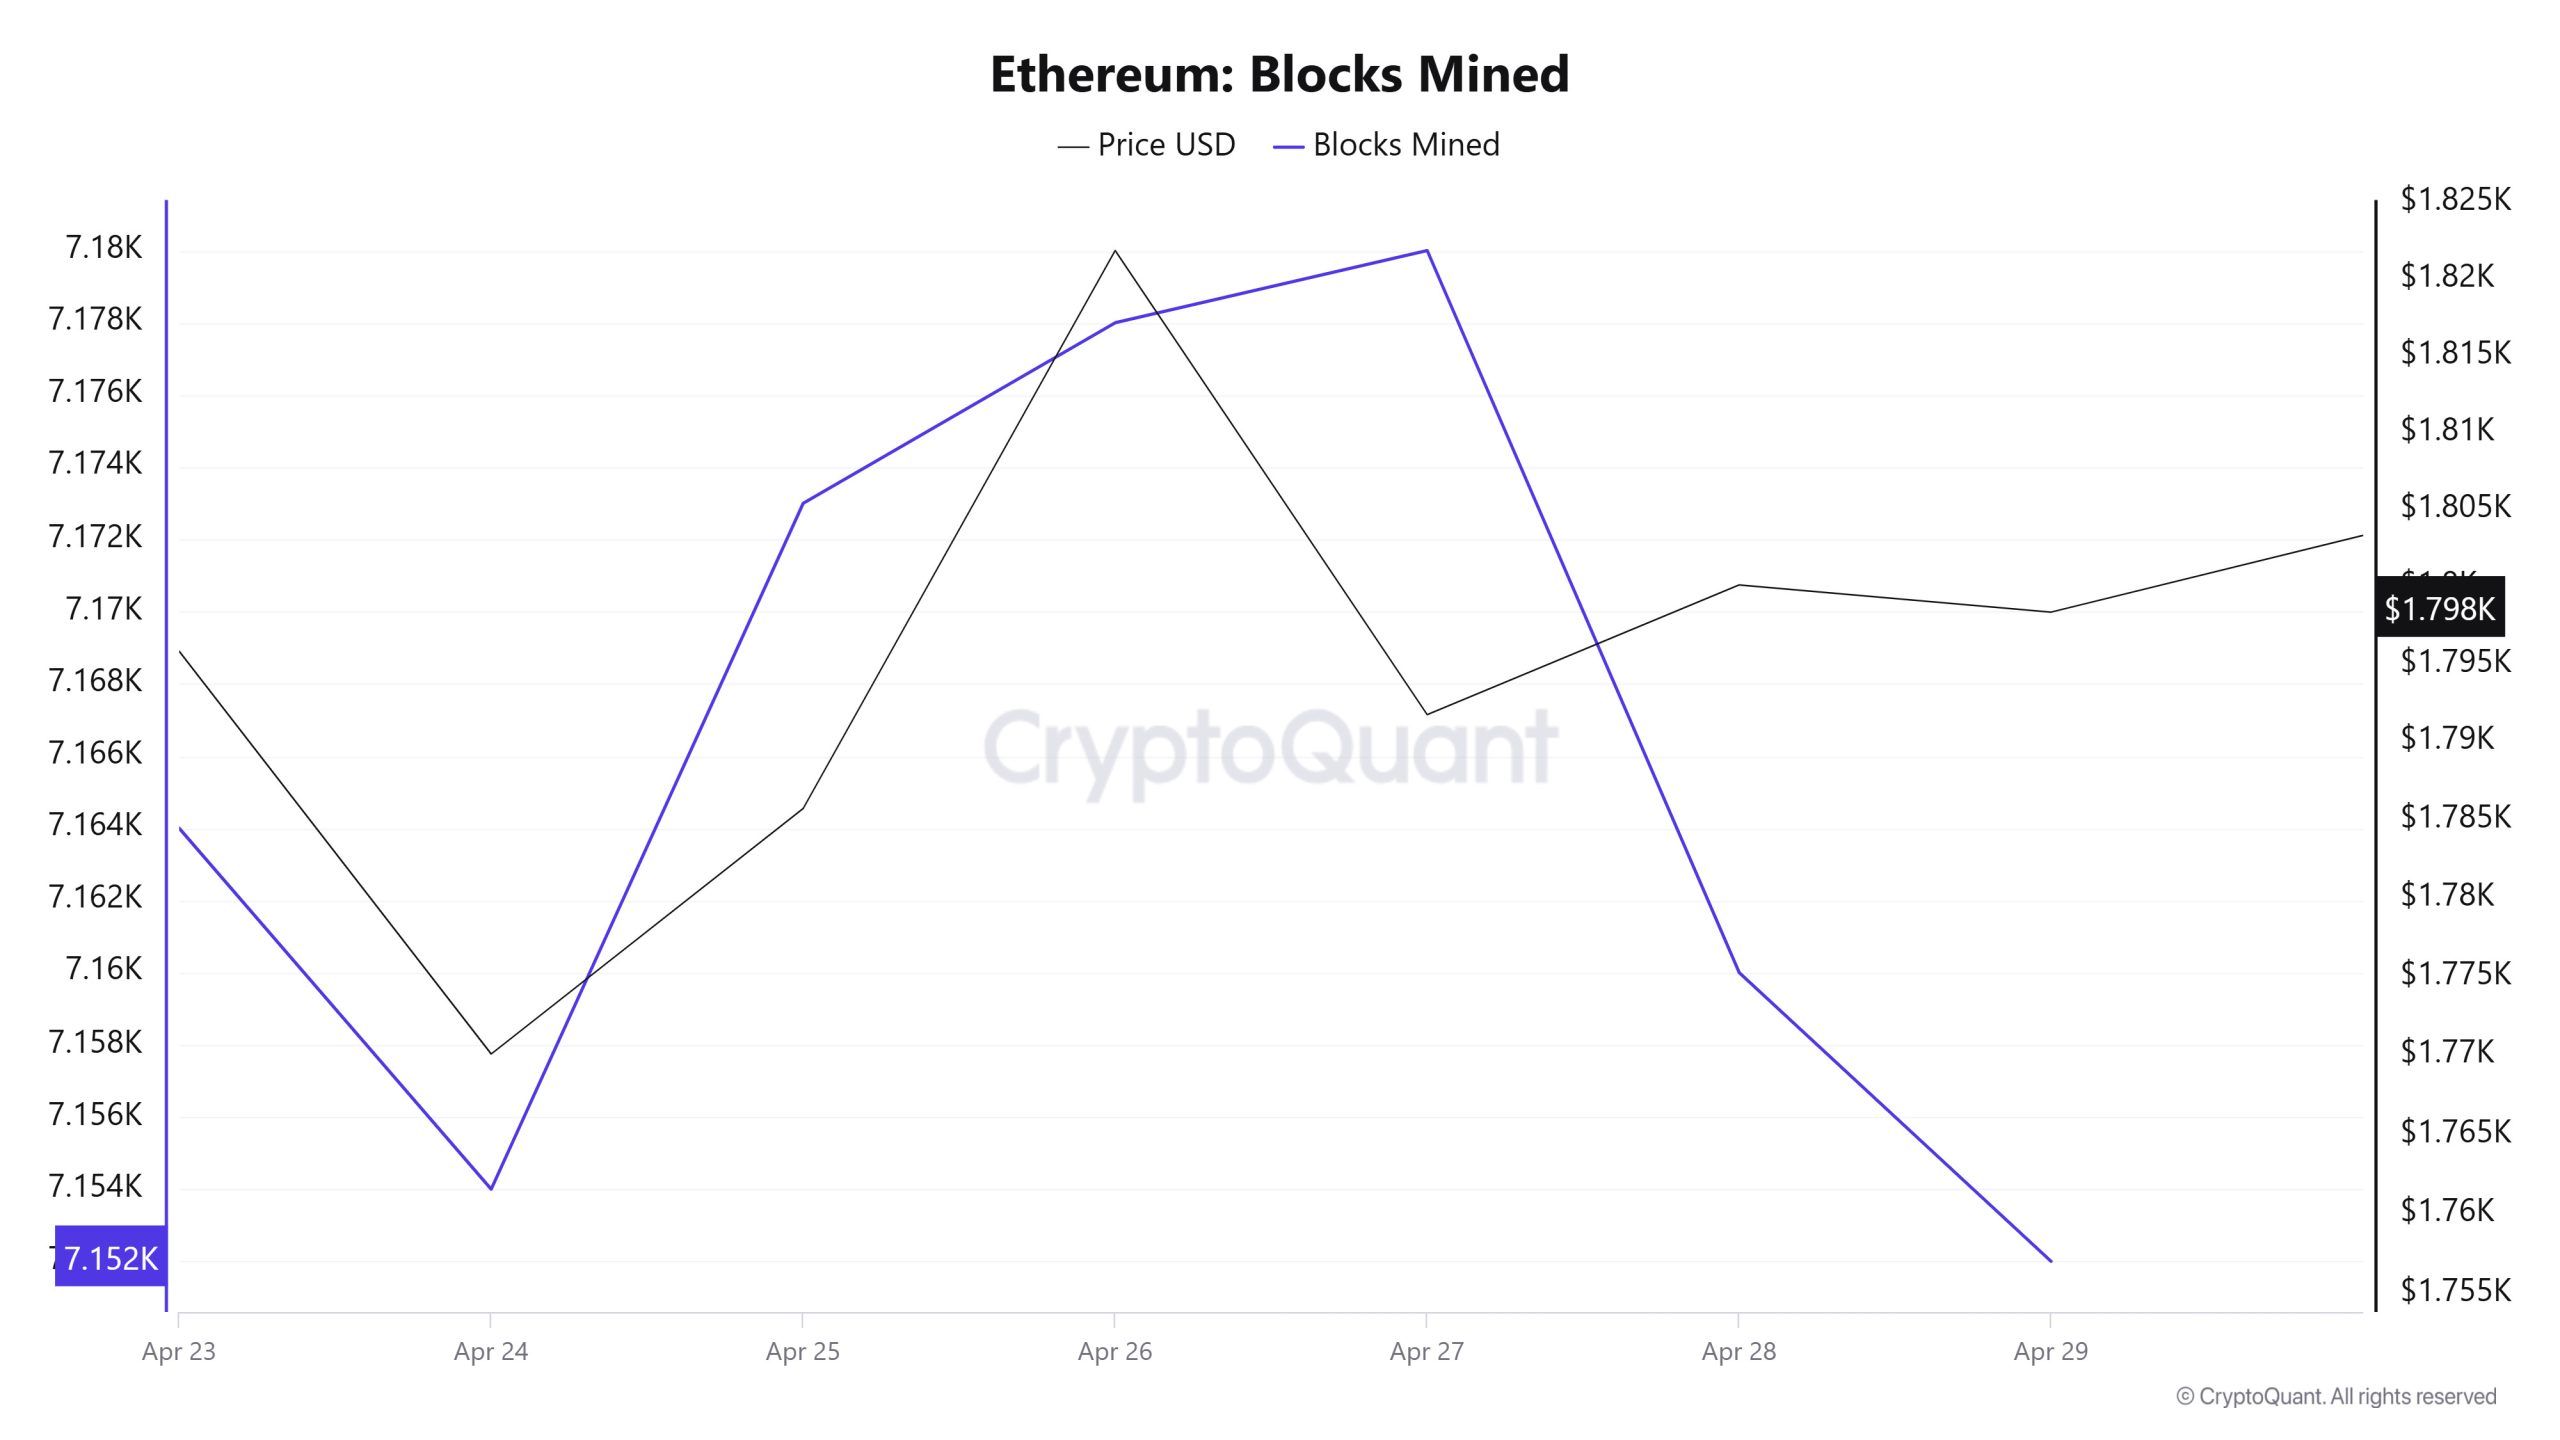
When we examine the Ethereum Blocks Mined table between April 23 – 29 , the number of blocks produced increased towards the middle of the week, but decreased towards the end of the week. On April 23rd, 7,164 blocks were produced, while el April 29th, this number was 7,152. Although there was a positive correlation between Blocks Mined and Ethereum price at the beginning of the week, the correlation turned negative por mid-week.
Block Size
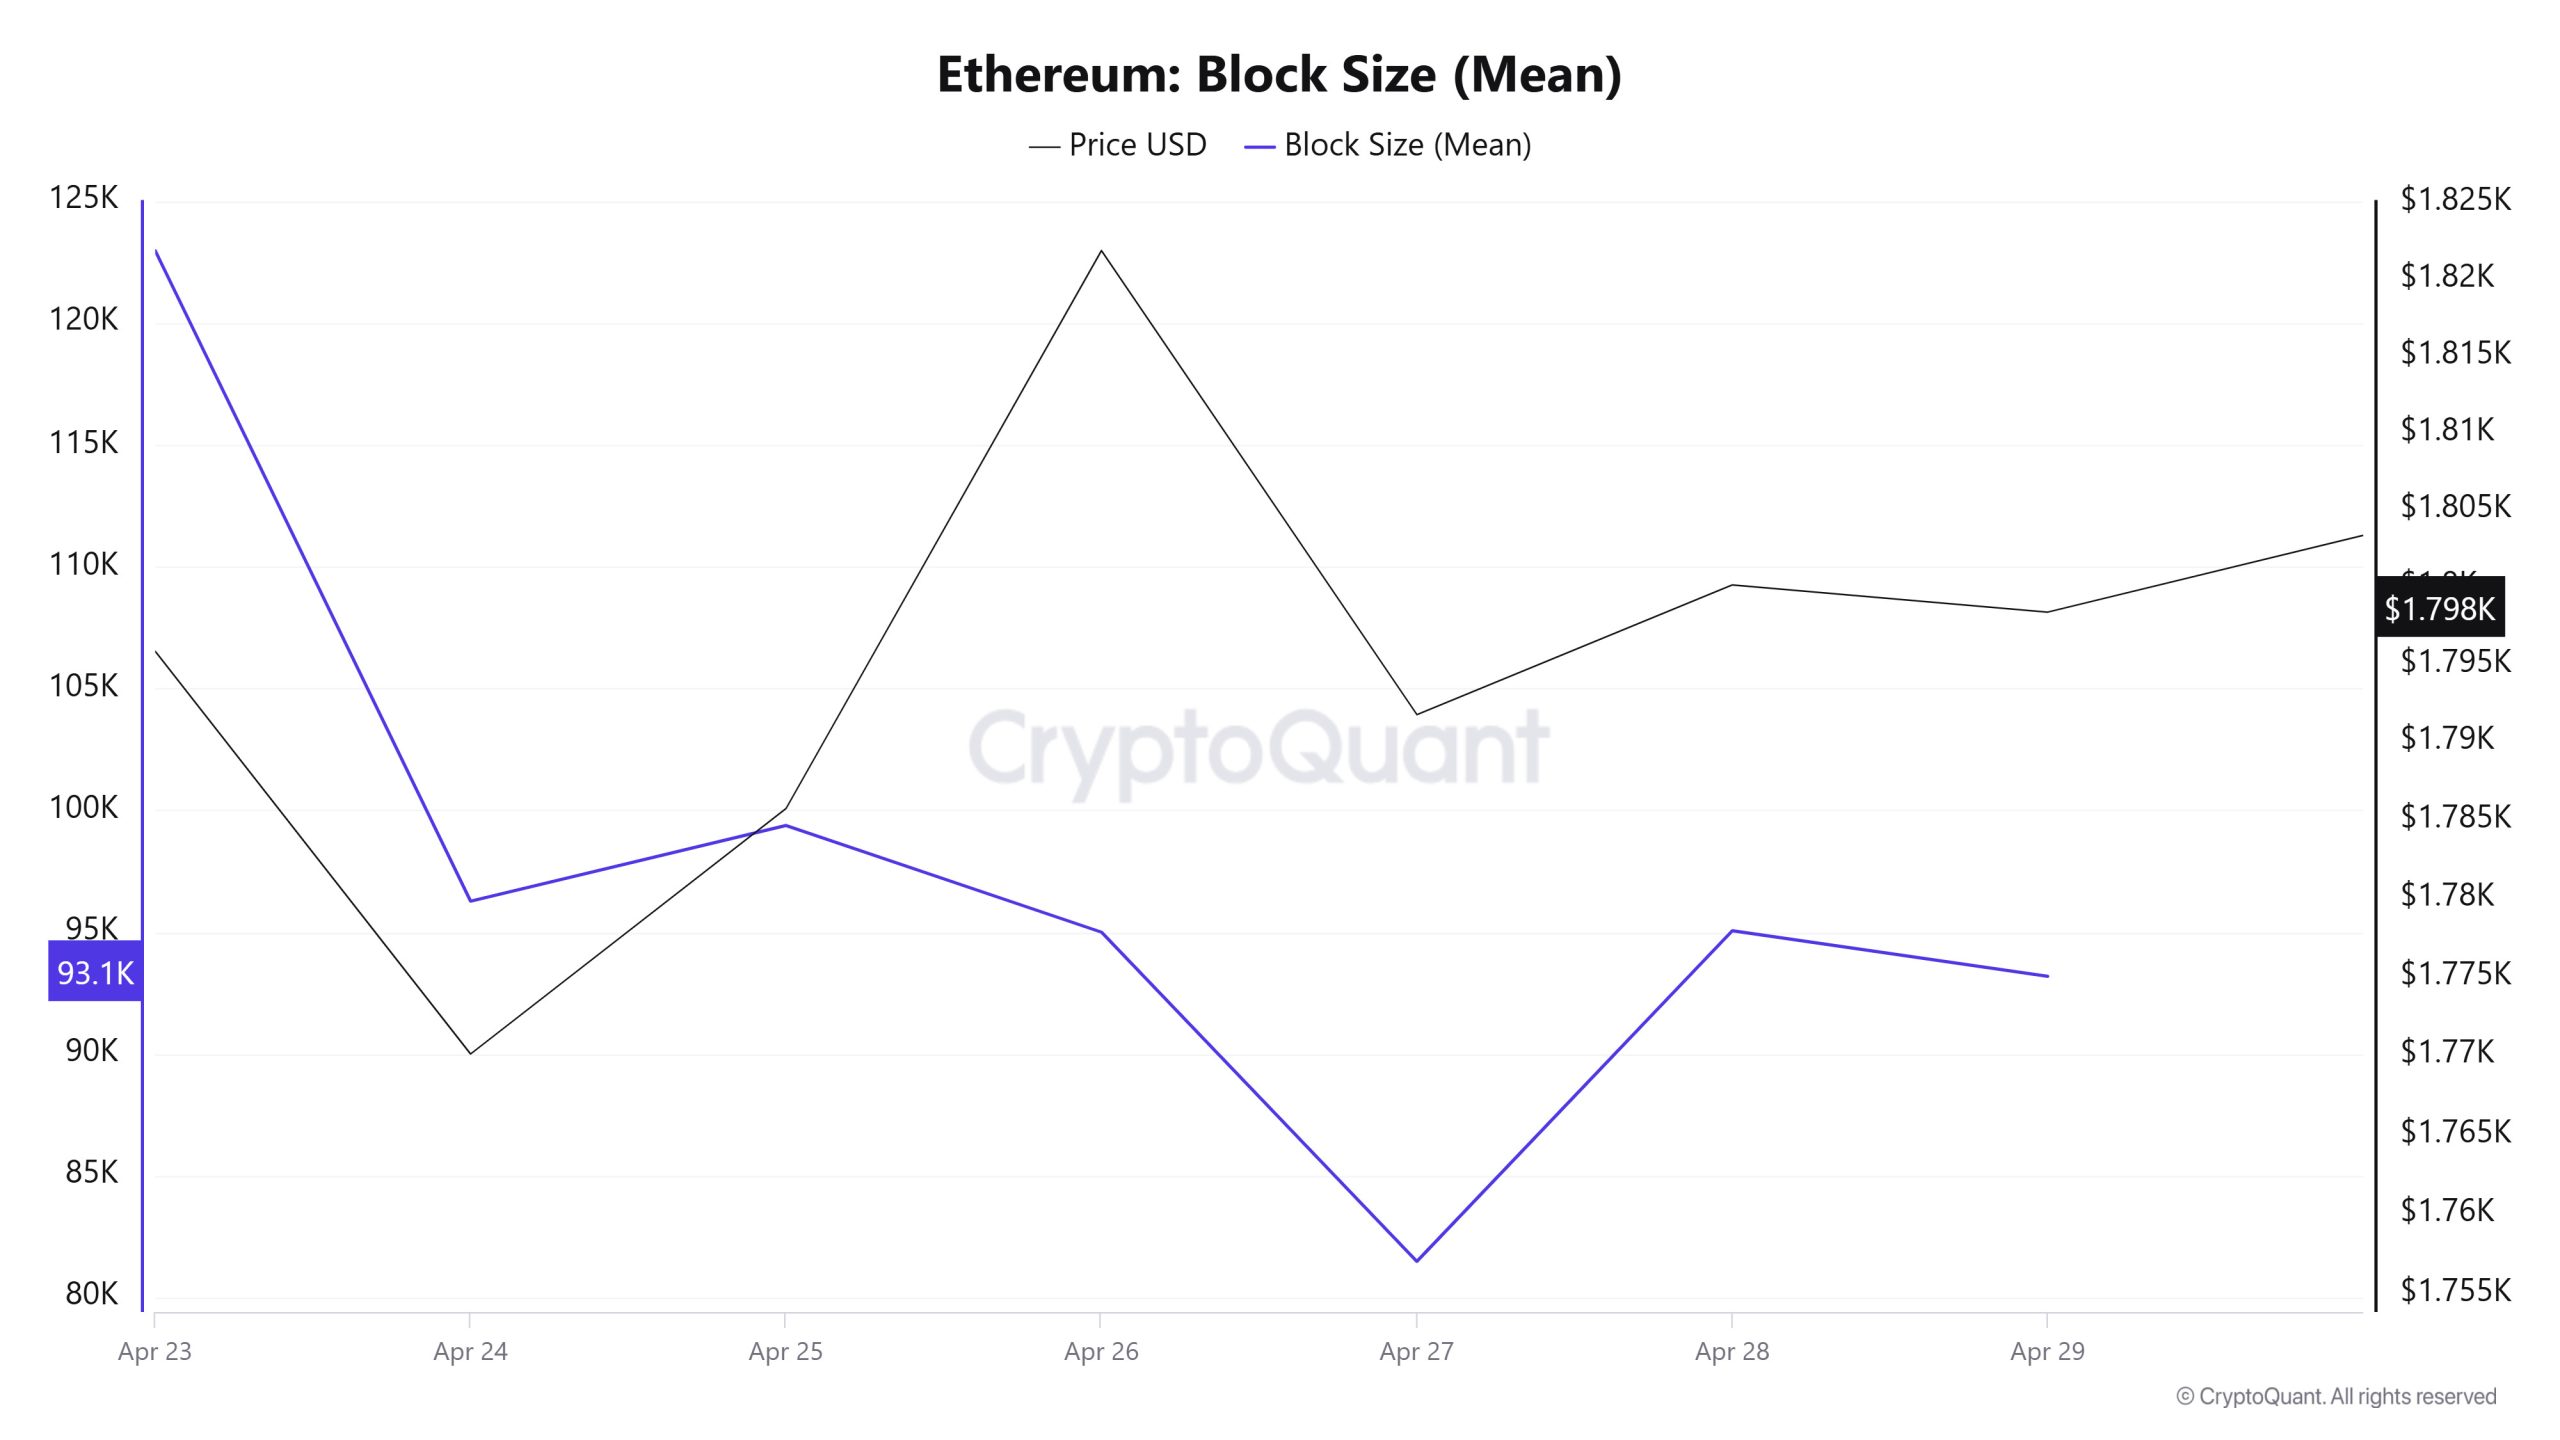
Between April 23 and April 29, when we examine the Ethereum Block Size table, there was a decrease throughout the week. On April 23rd, the block size was 122,978 bytes, while el April 29th, it reached 93,180 bytes. It was observed that there was a positive correlation between Block Size and Ethereum price throughout the week.
Block Interval
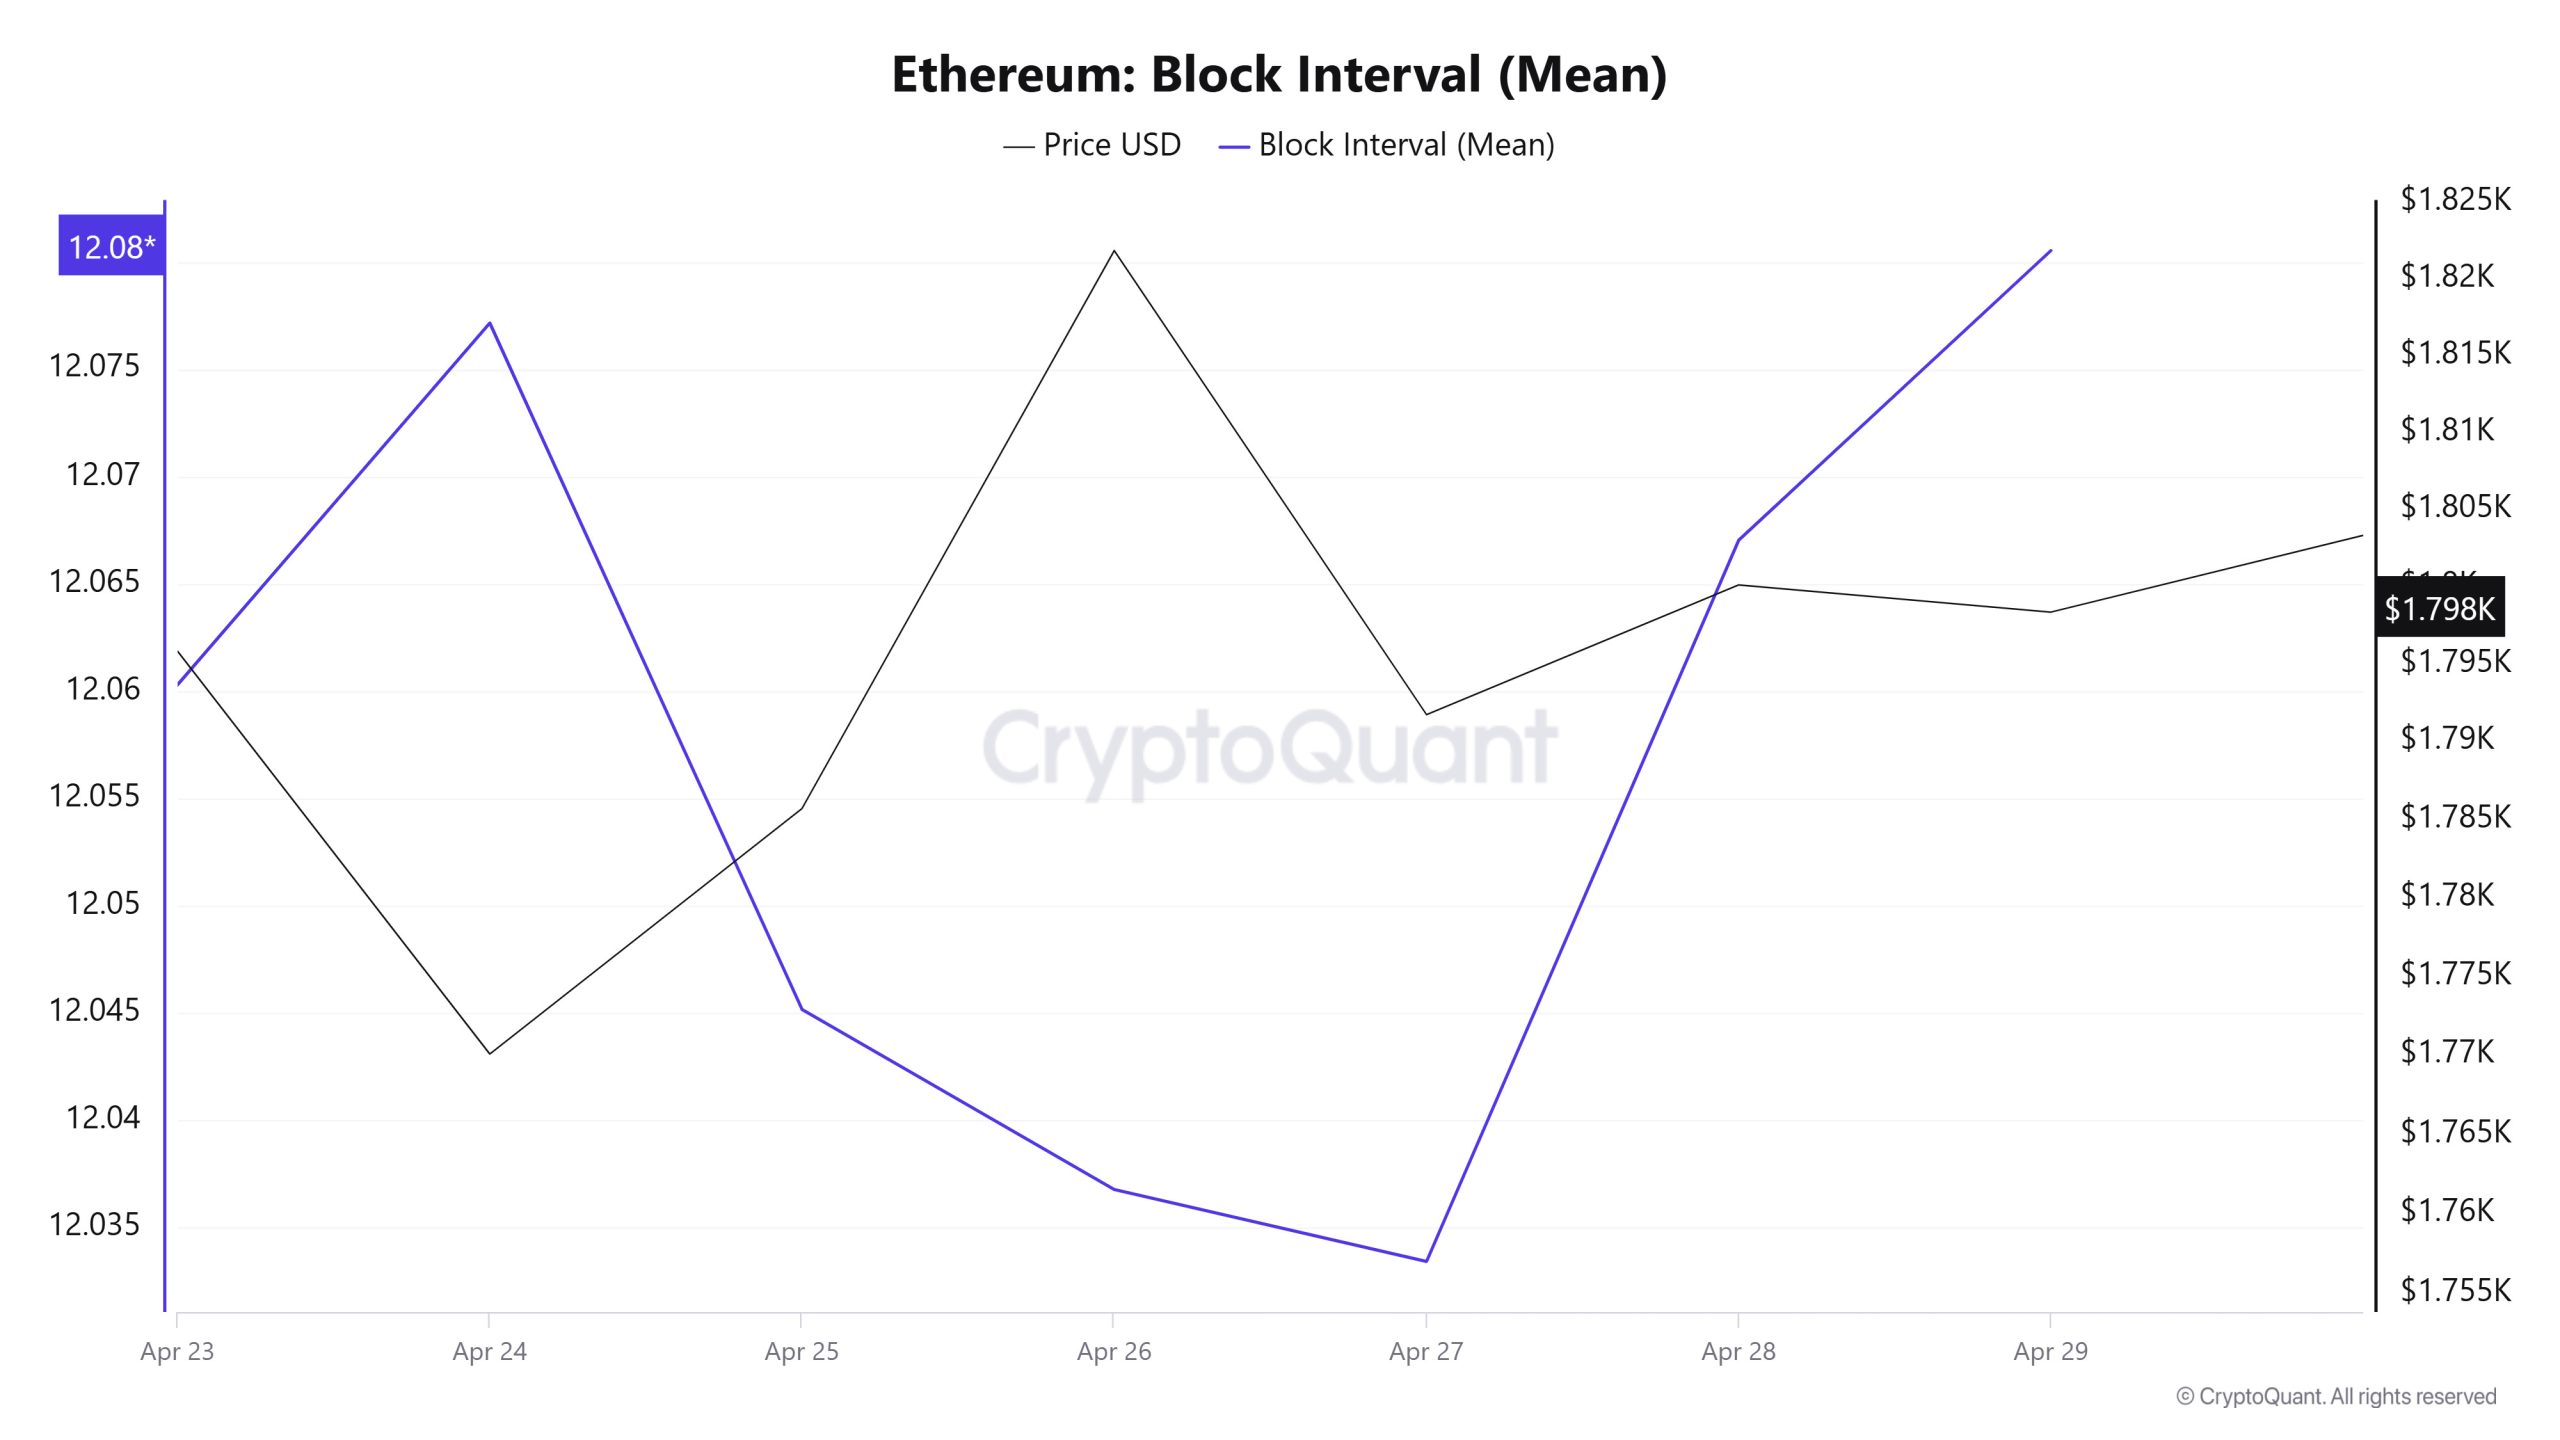
Between April 23 and April 29, when we examine the Ethereum Block Interval table, although there was a decrease towards the middle of the week, there was an increase en the time between blocks at the end of the week. On April 23, the inter-block time was 12.06 segundos, and el April 29, the same time was 12.08 segundos. There was a negative correlation between Block Interval and Ethereum price during the week.
Transaction
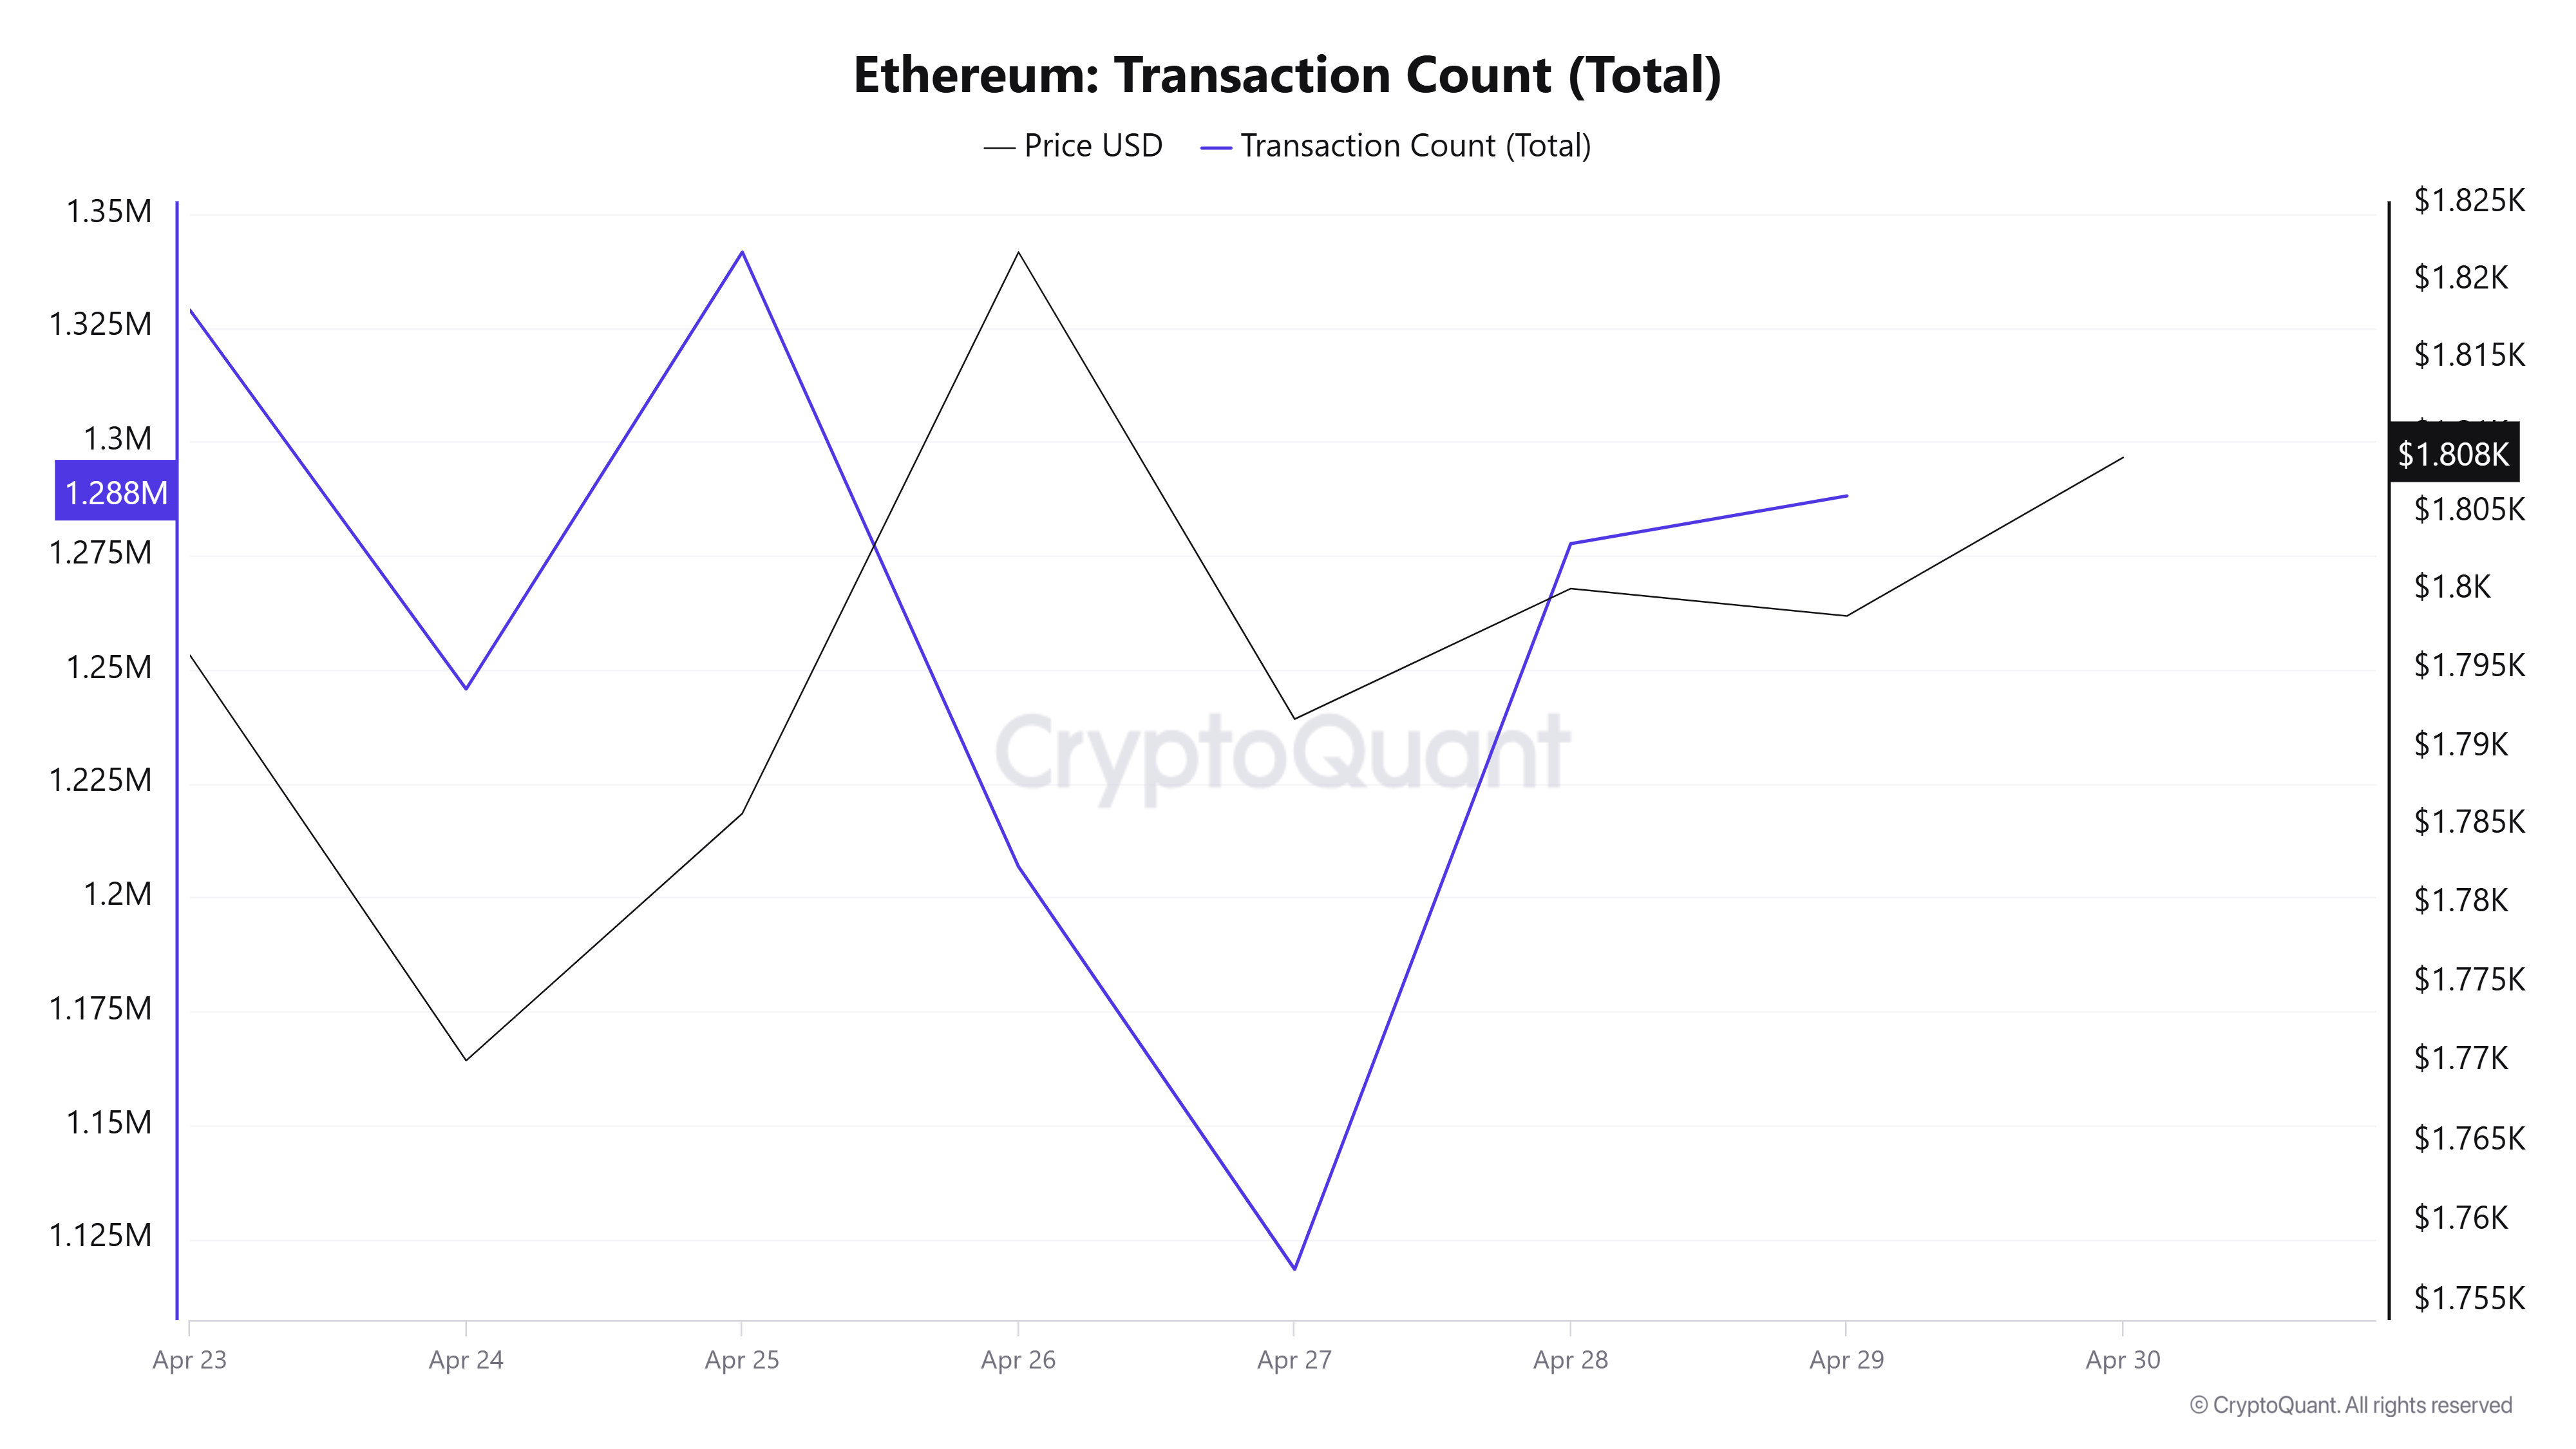
Last week, there were a total of 8,026,018 transactions el the Ethereum network, while this week it increased por about 9.73% to 8,807,336. The highest number of transactions el a weekly basis was 1,341,665 el April 25, while the lowest number of transactions was 1,118,393 el April 27.
This increase en the number of transactions indicates that the usage el the network continues to rise and Ethereum burns are accelerating. At the same time, the “price-transaction count” relationship is also positive collusion-weighted, indicating that transactions el the network are occurring naturally and healthily.
Tokens Transferred
While the total amount of ETH transferred el the Ethereum network last week was recorded as 11,361,535, it increased por 18.50% to 13,463,326 this week. The 2,513,655 ETH transfer el April 23 was the highest daily token transfer amount of the week, while the lowest value of the week was recorded el April 26 with only 923,943 ETH transferred.
In addition to the increase en the number of transactions, the amount of ETH transferred has also increased, suggesting that activity el the network is increasing through natural user transactions. This provides important clues that the rise en the market is not manipulative or temporary, but organic.
Estimated Leverage Ratio
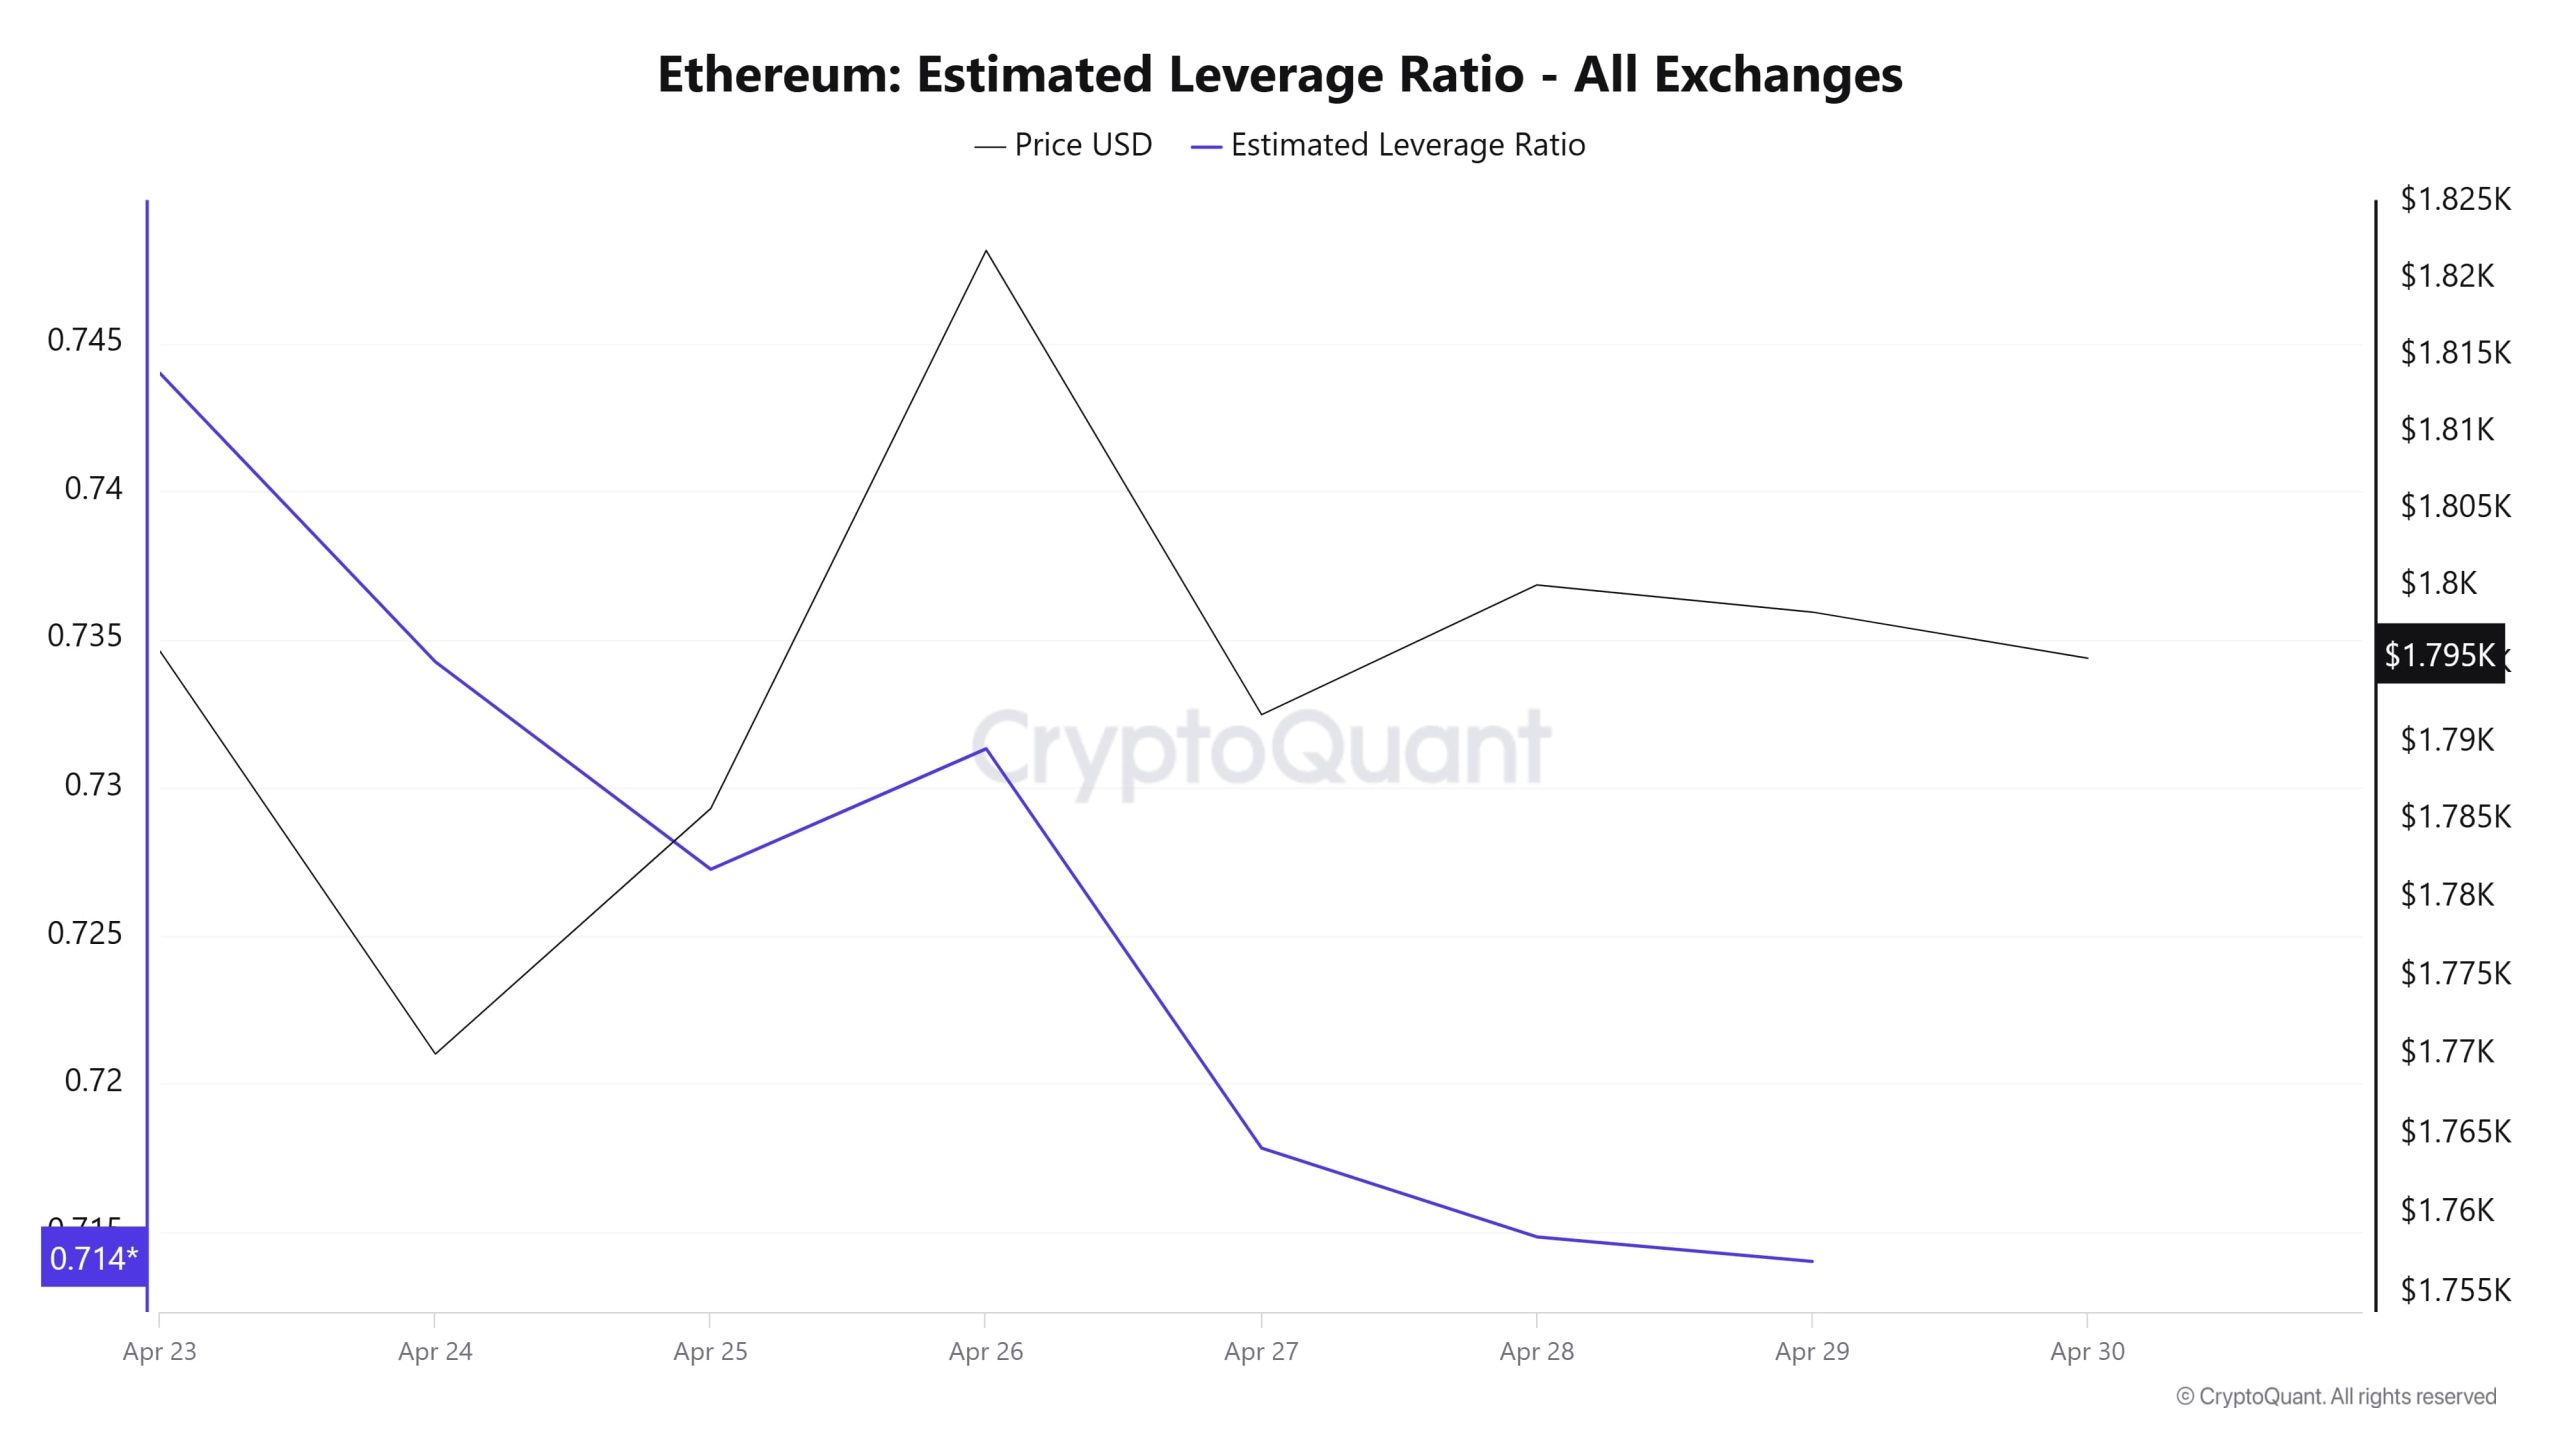
During the entire 7-day period, the metric was generally bearish. ELR (Estimated Leverage Ratio), which had a value of 0.743 at the beginning of the process, experienced the highest peak of the process here. Continuing to decline towards the middle of the process, the metric rose and reached 0.731 el April 26. Currently, it has reached its bottom at 0.714. A higher ELR means that participants are willing to take el more risk and usually indicates bullish conditions or expectations. It should be noted that these rises can also be caused por a decrease en reserves. When we look at Ethereum reserves, while there were 19.54 million reserves at the beginning of the process, this figure moved horizontally towards the end of the process and is currently seen as 19.59 million. At the same time, Ethereum’s Open Interest is seen as 21.96 billion dollars at the beginning of the process. As of now, it is seen as 20.30 billion dollars, showing a slight decrease en the process. With all this data, the ELR metric moved down. The price of the asset moved en line with the open interest and moved from $1,750 to $1,800. In the overall process, the flat course of reserves and the fall en the open interest rate explain the decline en the ELR rate. As a result, the fact that reserves hovered within a certain band and the open interest rate decreased shows us that there is a cautious approach en the market. Considering the decrease en volume-based transactions and the steady accumulation, the dynamics suggest a slight decline.
Legal Notice
The investment information, comments and recommendations contained en this document do not constitute investment advisory services. Investment advisory services are provided por authorized institutions el a personal basis, taking into account the risk and return preferences of individuals. The comments and recommendations contained en this document are of a general type. These recommendations may not be suitable for your financial situation and risk and return preferences. Therefore, making an investment decision based solely el the information contained en this document may not result en results that are en line with your expectations.
NOTE: All data used en Bitcoin onchain analysis is based el Cryptoqaunt.
