
Active Addresses
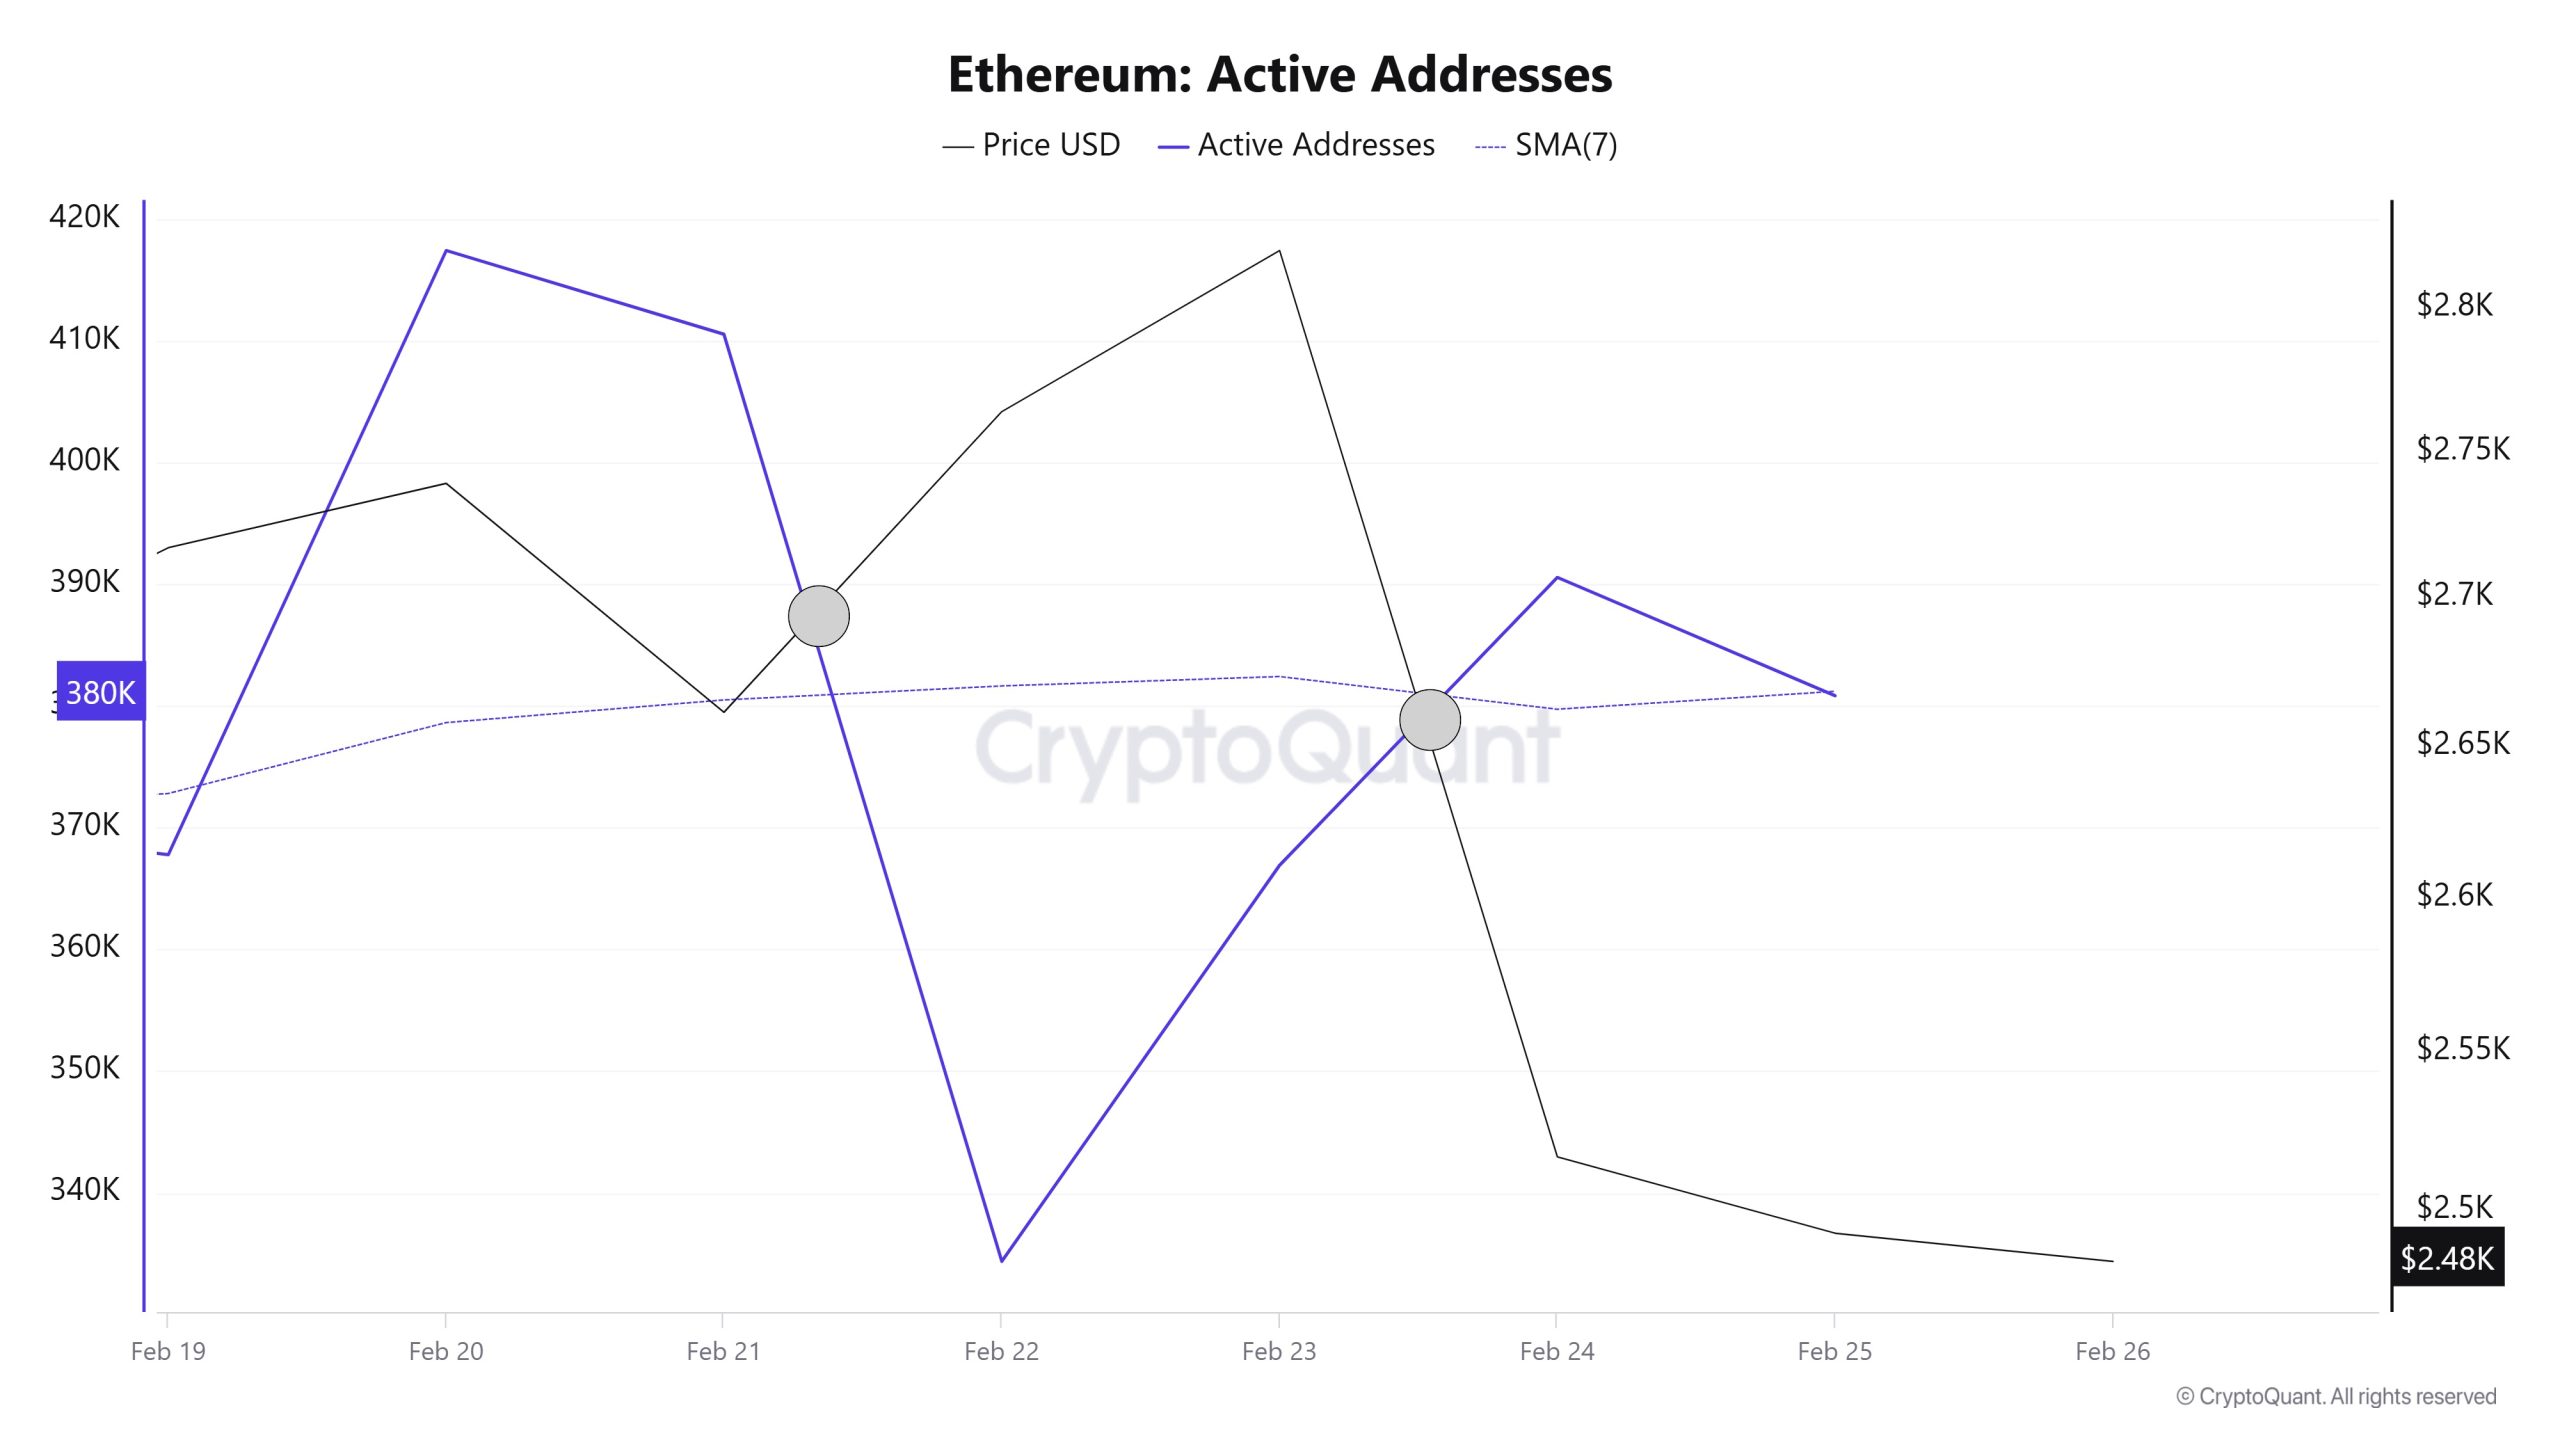 In the number of active addresses, there were 417,394 active logins to the ETH network between February 19 and February 26, 2025 this week. During this period, Ethereum fell from $2,738 to $2,516. In the region marked el the chart, where the price and the number of active addresses intersect, Ethereum purchases are gradually decreasing. When we follow the 7-day simple moving average, it is observed that the price follows a downward trend el the dates when this average cuts the price. This situation indicates that the Ethereum price is experiencing entries at $ 2,738 levels
Active Sending Addresses
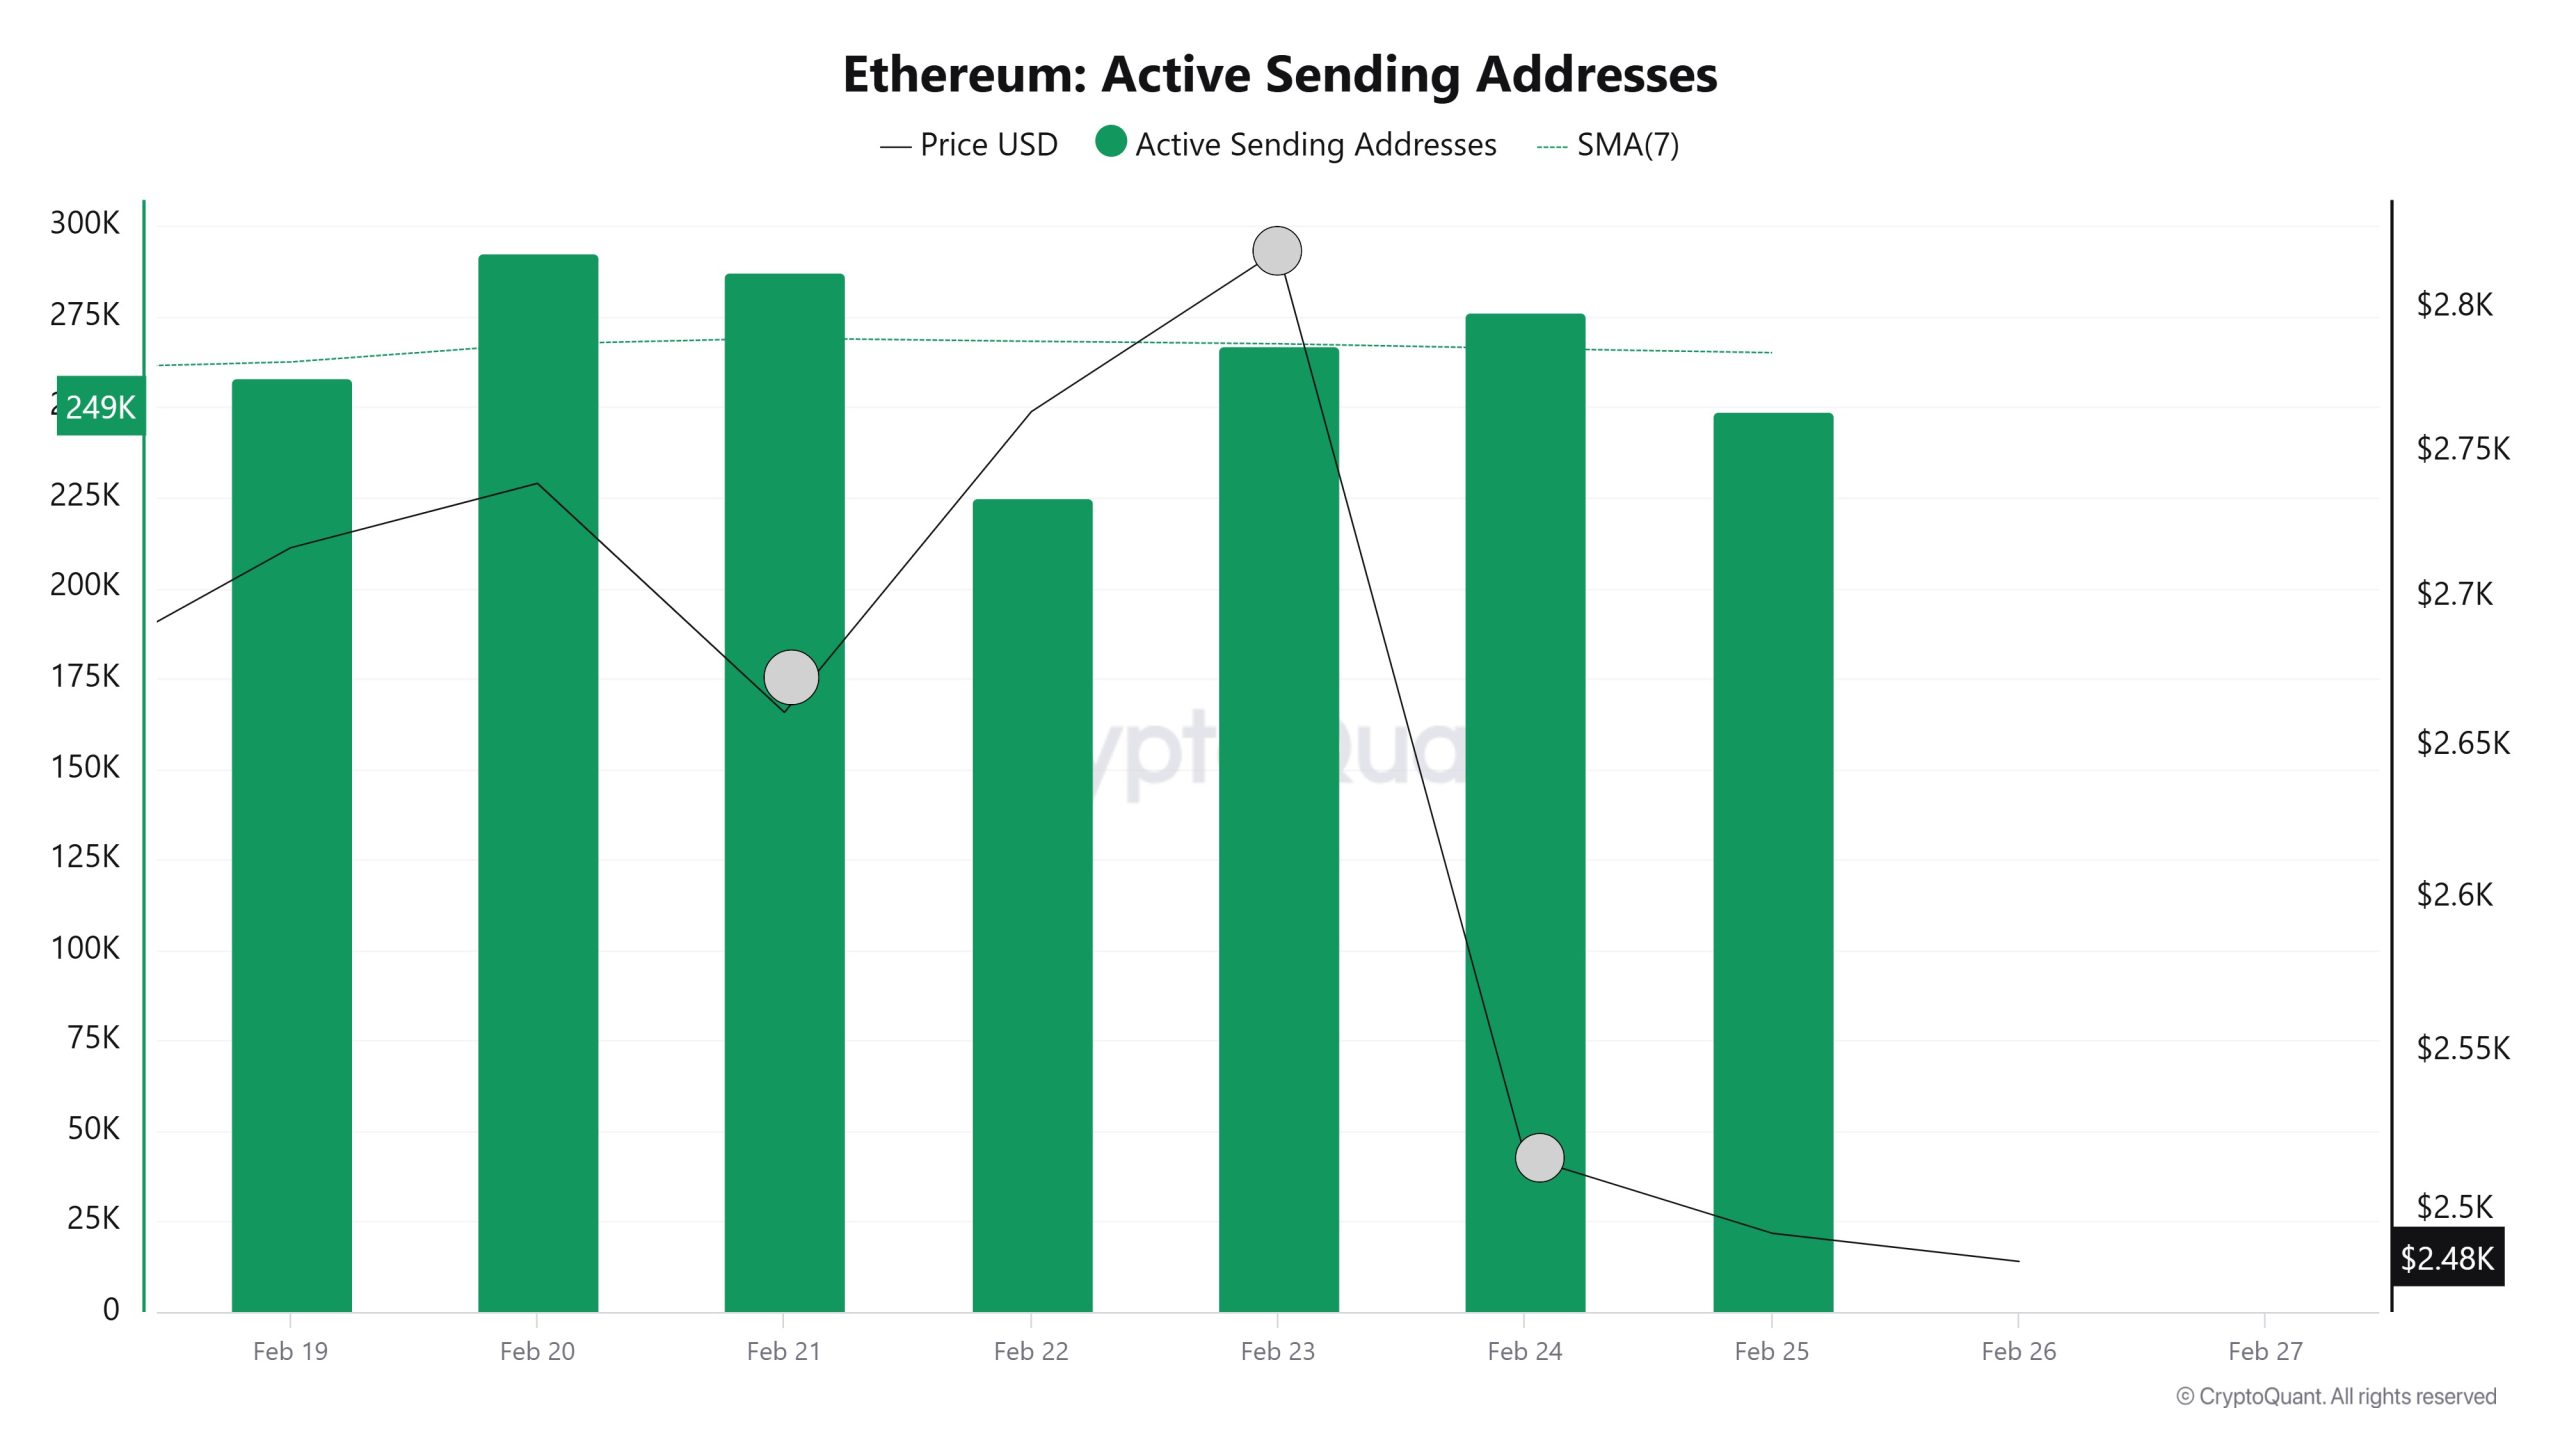
With the Black Line (price line) en active shipping addresses, there was a significant drop en active shipping addresses towards February 21. On the day when the price hit its lowest point, active shipping addresses fell as low as 287,111 , indicating that buyers sold their positions as Ethereum stayed at 2,661 for a while. As a result, it is seen that price drops cause an acceleration en sending addresses.
Active Receiving Addresses
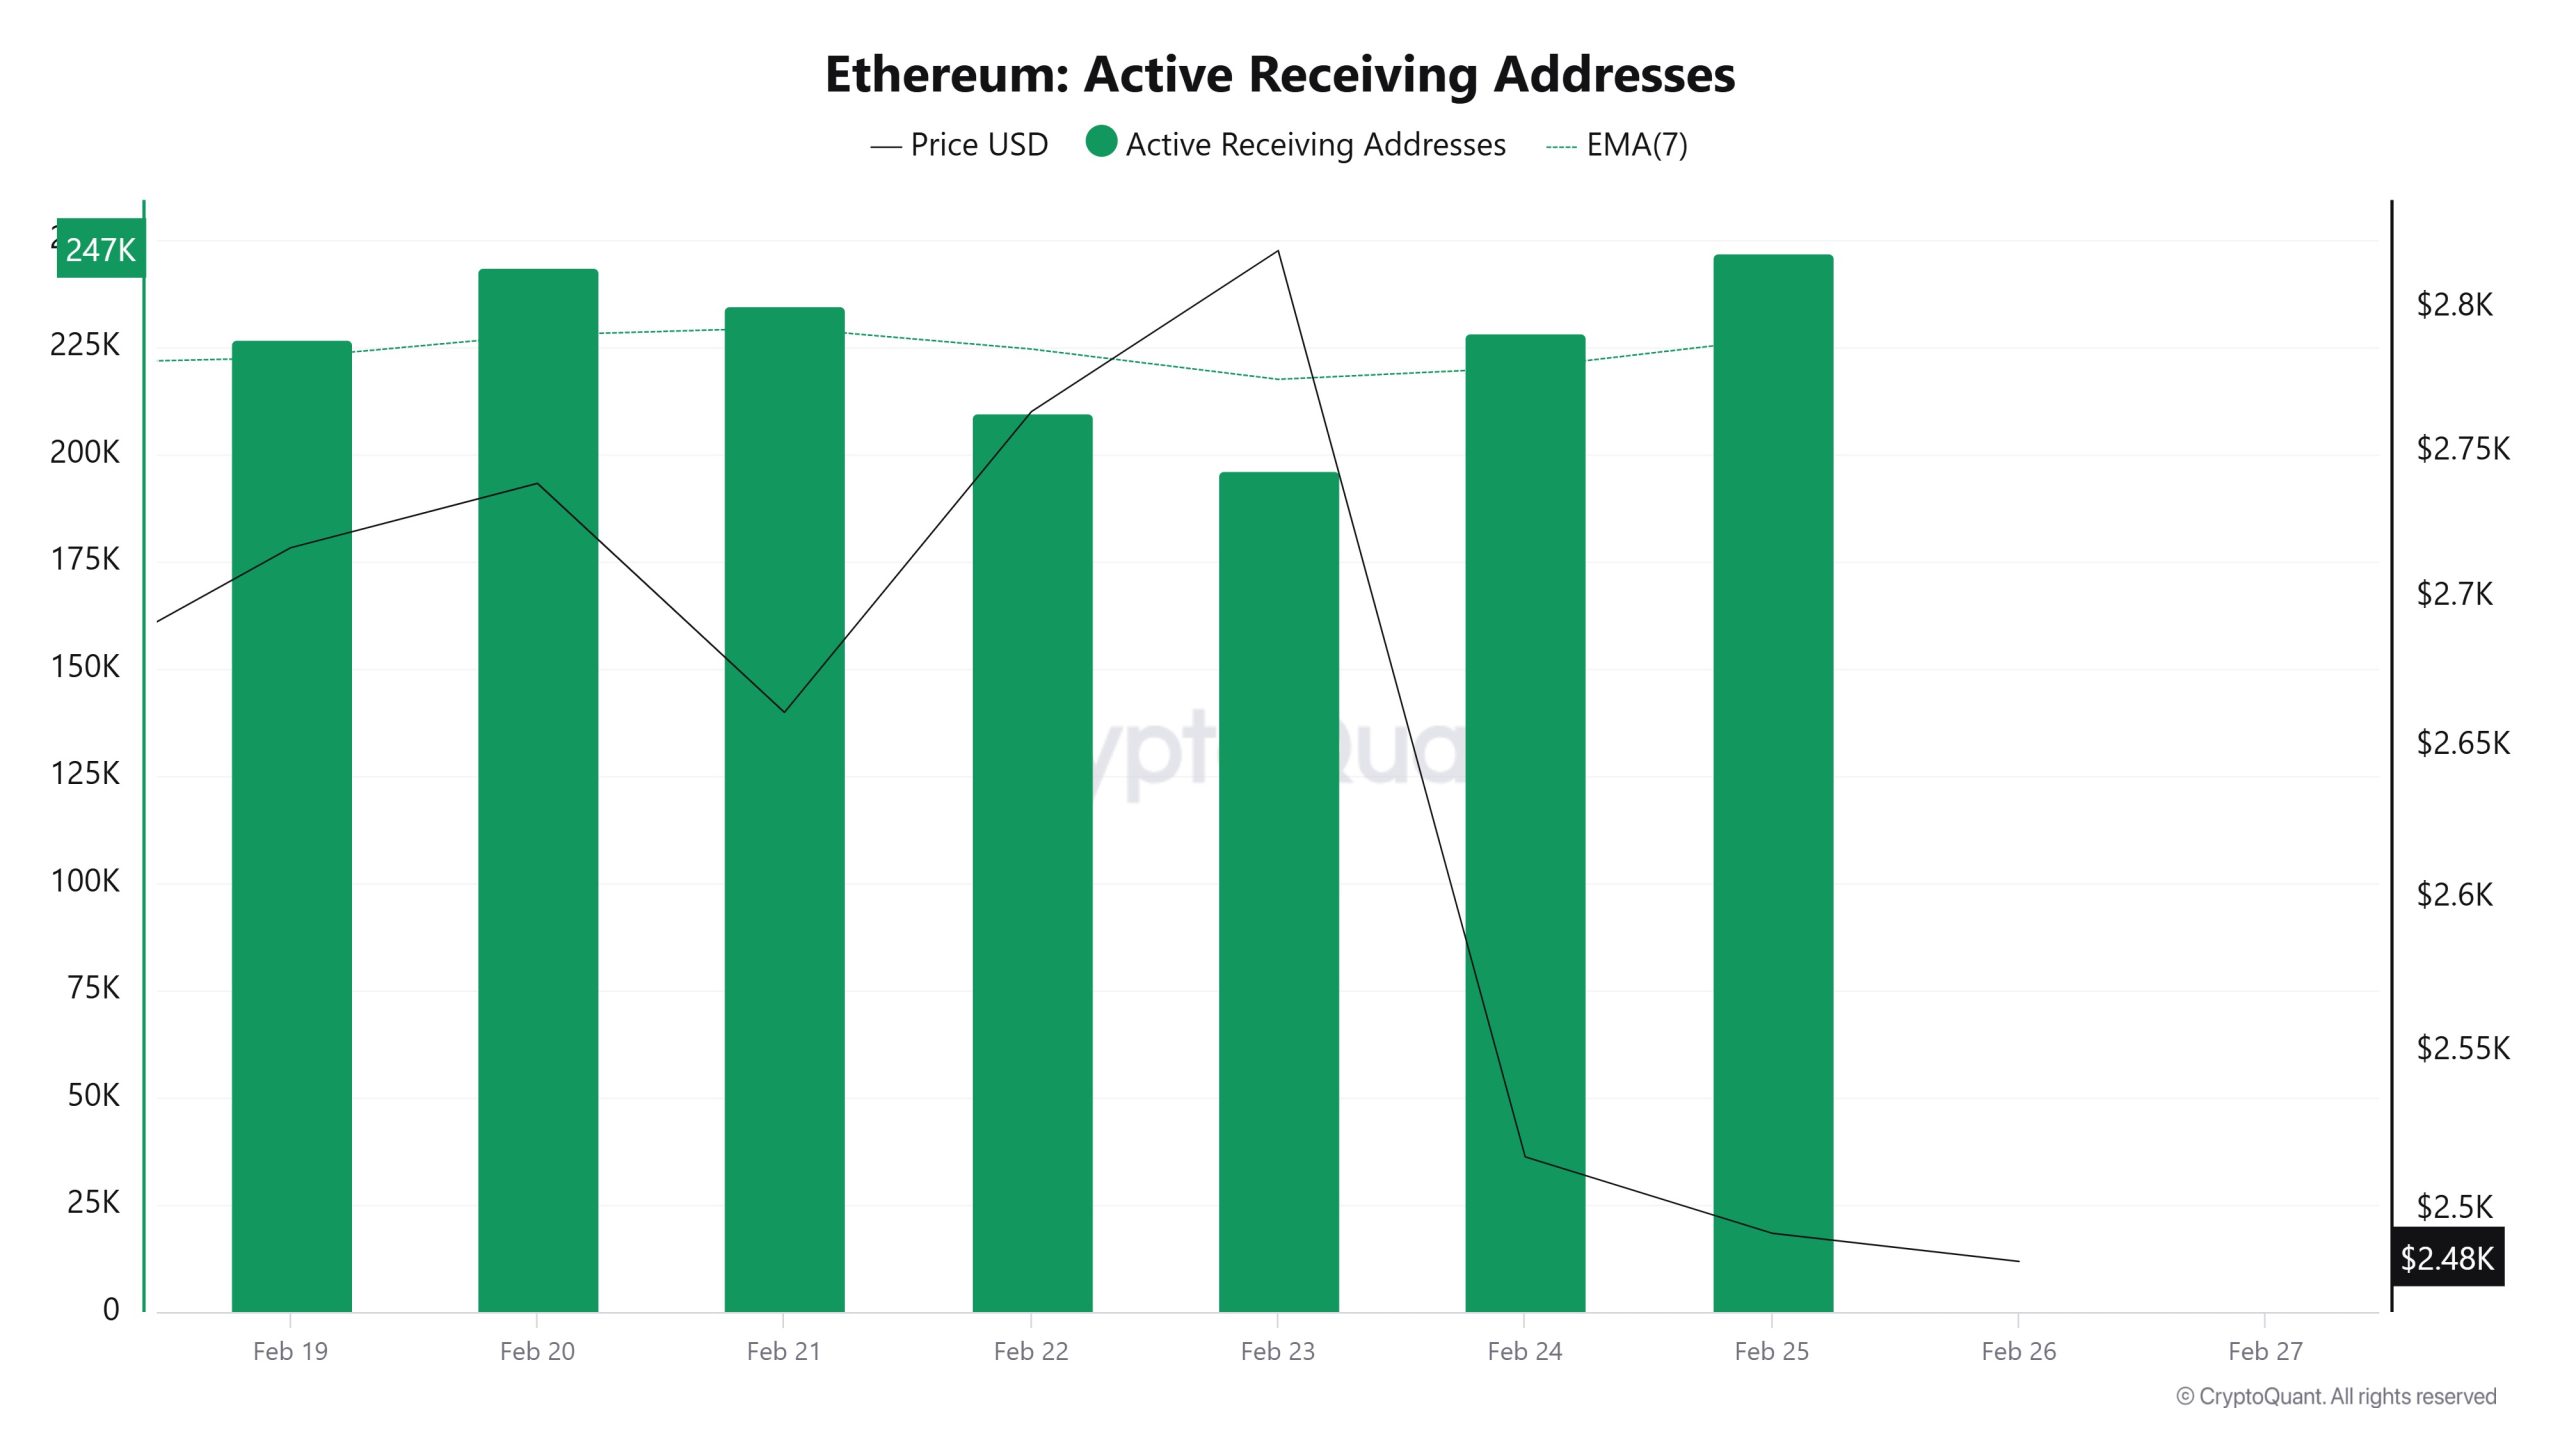
In the active buyer addresses, it appears that el February 23rd, February 23rd, when the price was at 2,738, the number of buyers approached the highest levels of 243,576, and the longest level of buying was at the level where investors went to increase their Ethereum positions. This may indicate the costing levels of buyers before the price rises.
Total Value Staked
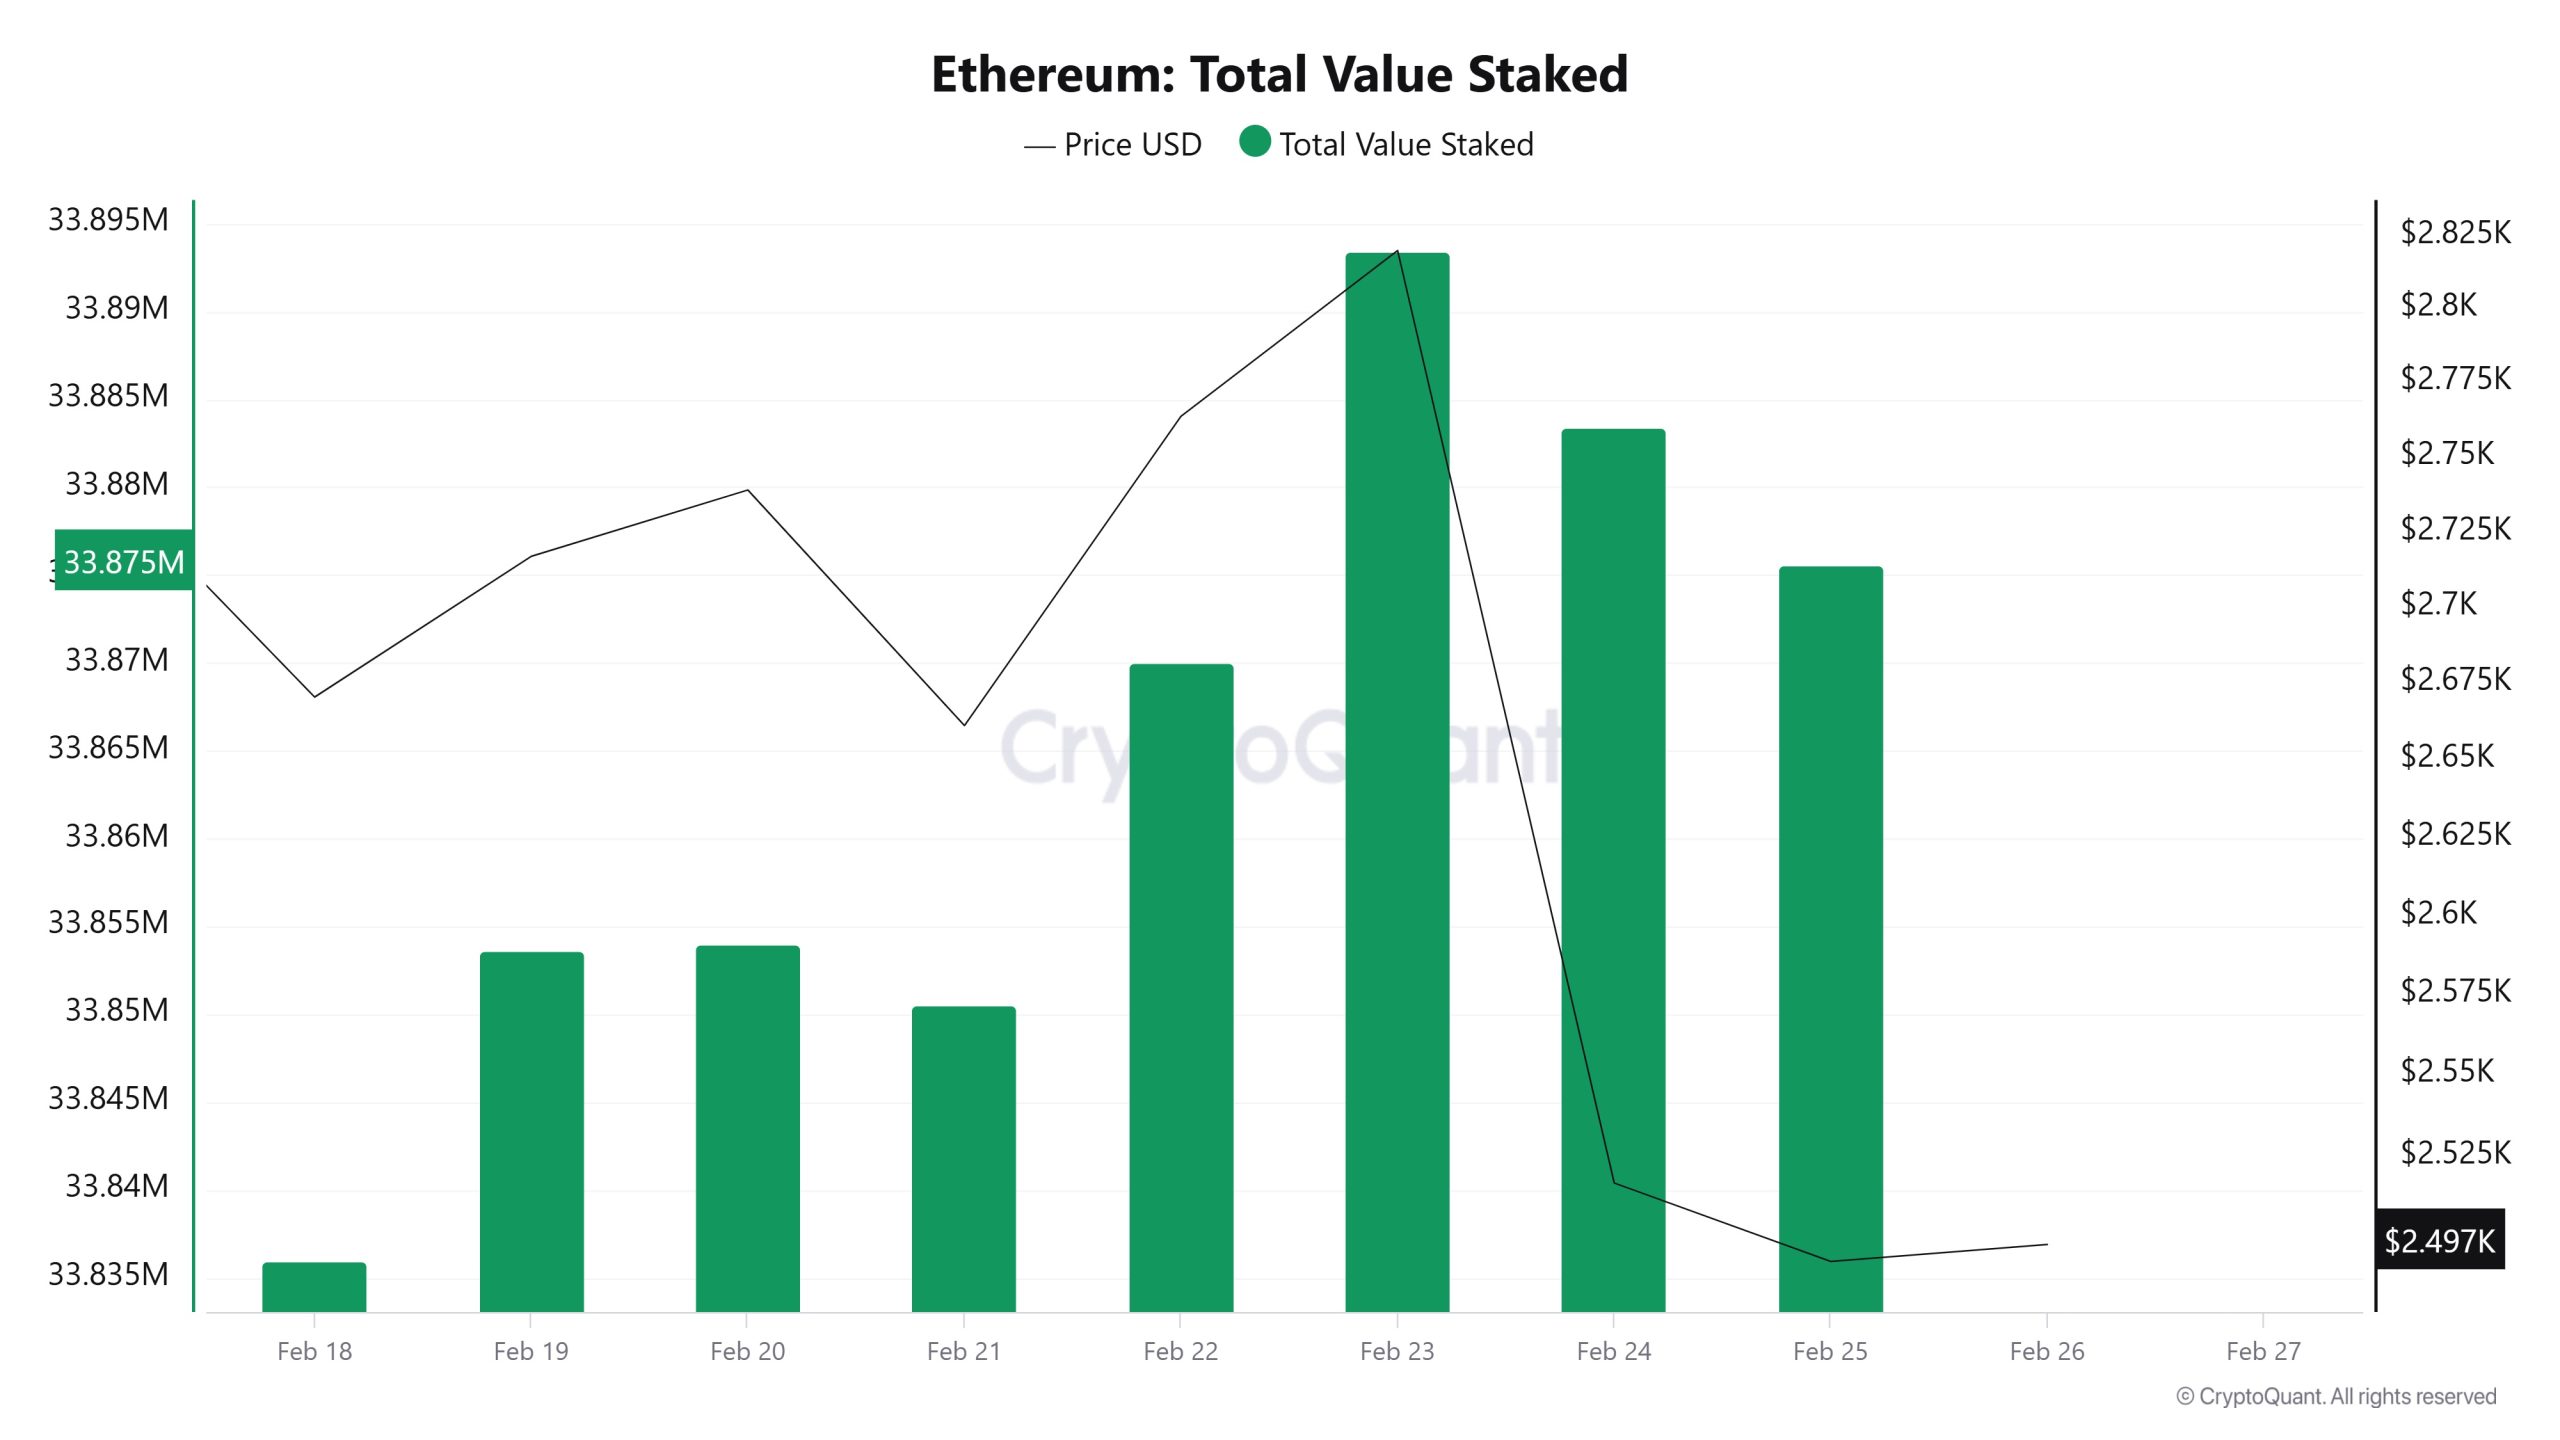
On February 19, ETH price was 2,716 while Total Value Staked Ratio was 33,853. As of February 25, ETH price was down to 2,492 while Total Value Staked Ratio was 33,875. Compared to last week, ETH price declined por 8.25% while Total Value Staked Ratio increased por 0.065%.
Staking Inflows
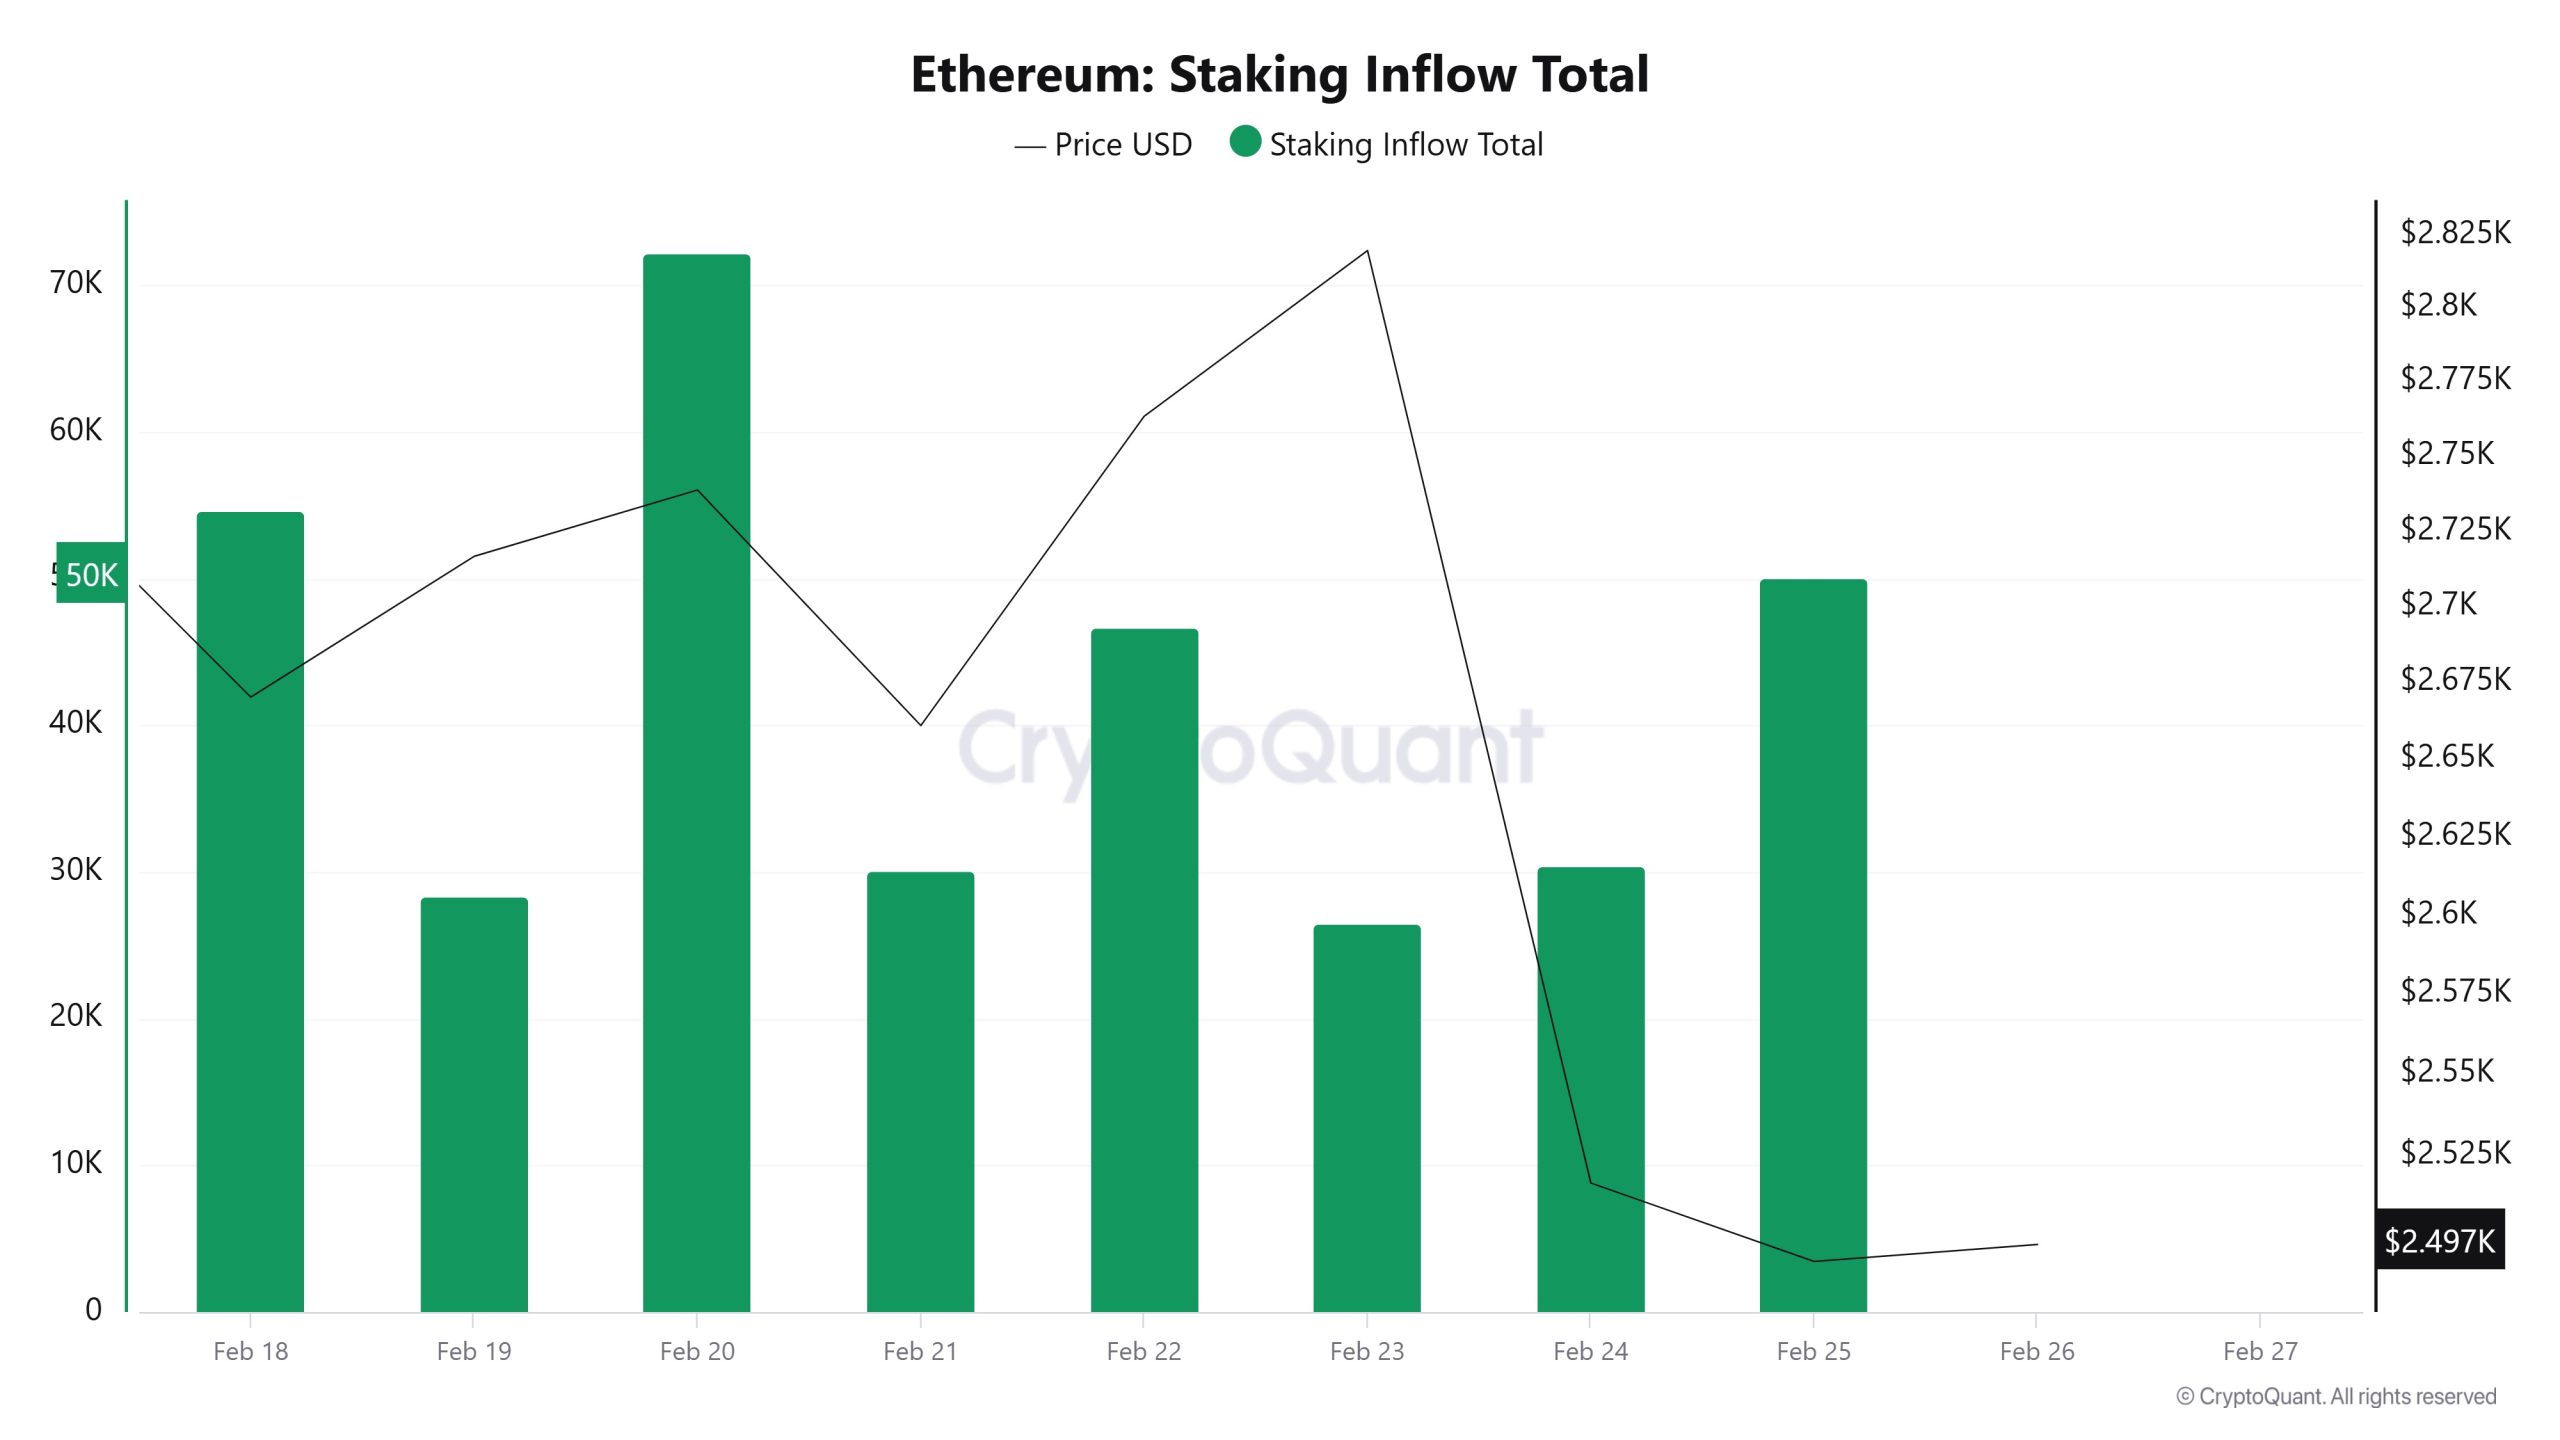
On February 19, ETH price was 2,716 while Staking Inflow Ratio was 28,397. As of February 25, the ETH price was down to 2,492 while the Staking Inflow Ratio was 50,045. Compared to last week, ETH price decreased por 8.25% and Staking Inflow Ratio increased por 76.2%.
Derivatives
Open Interest
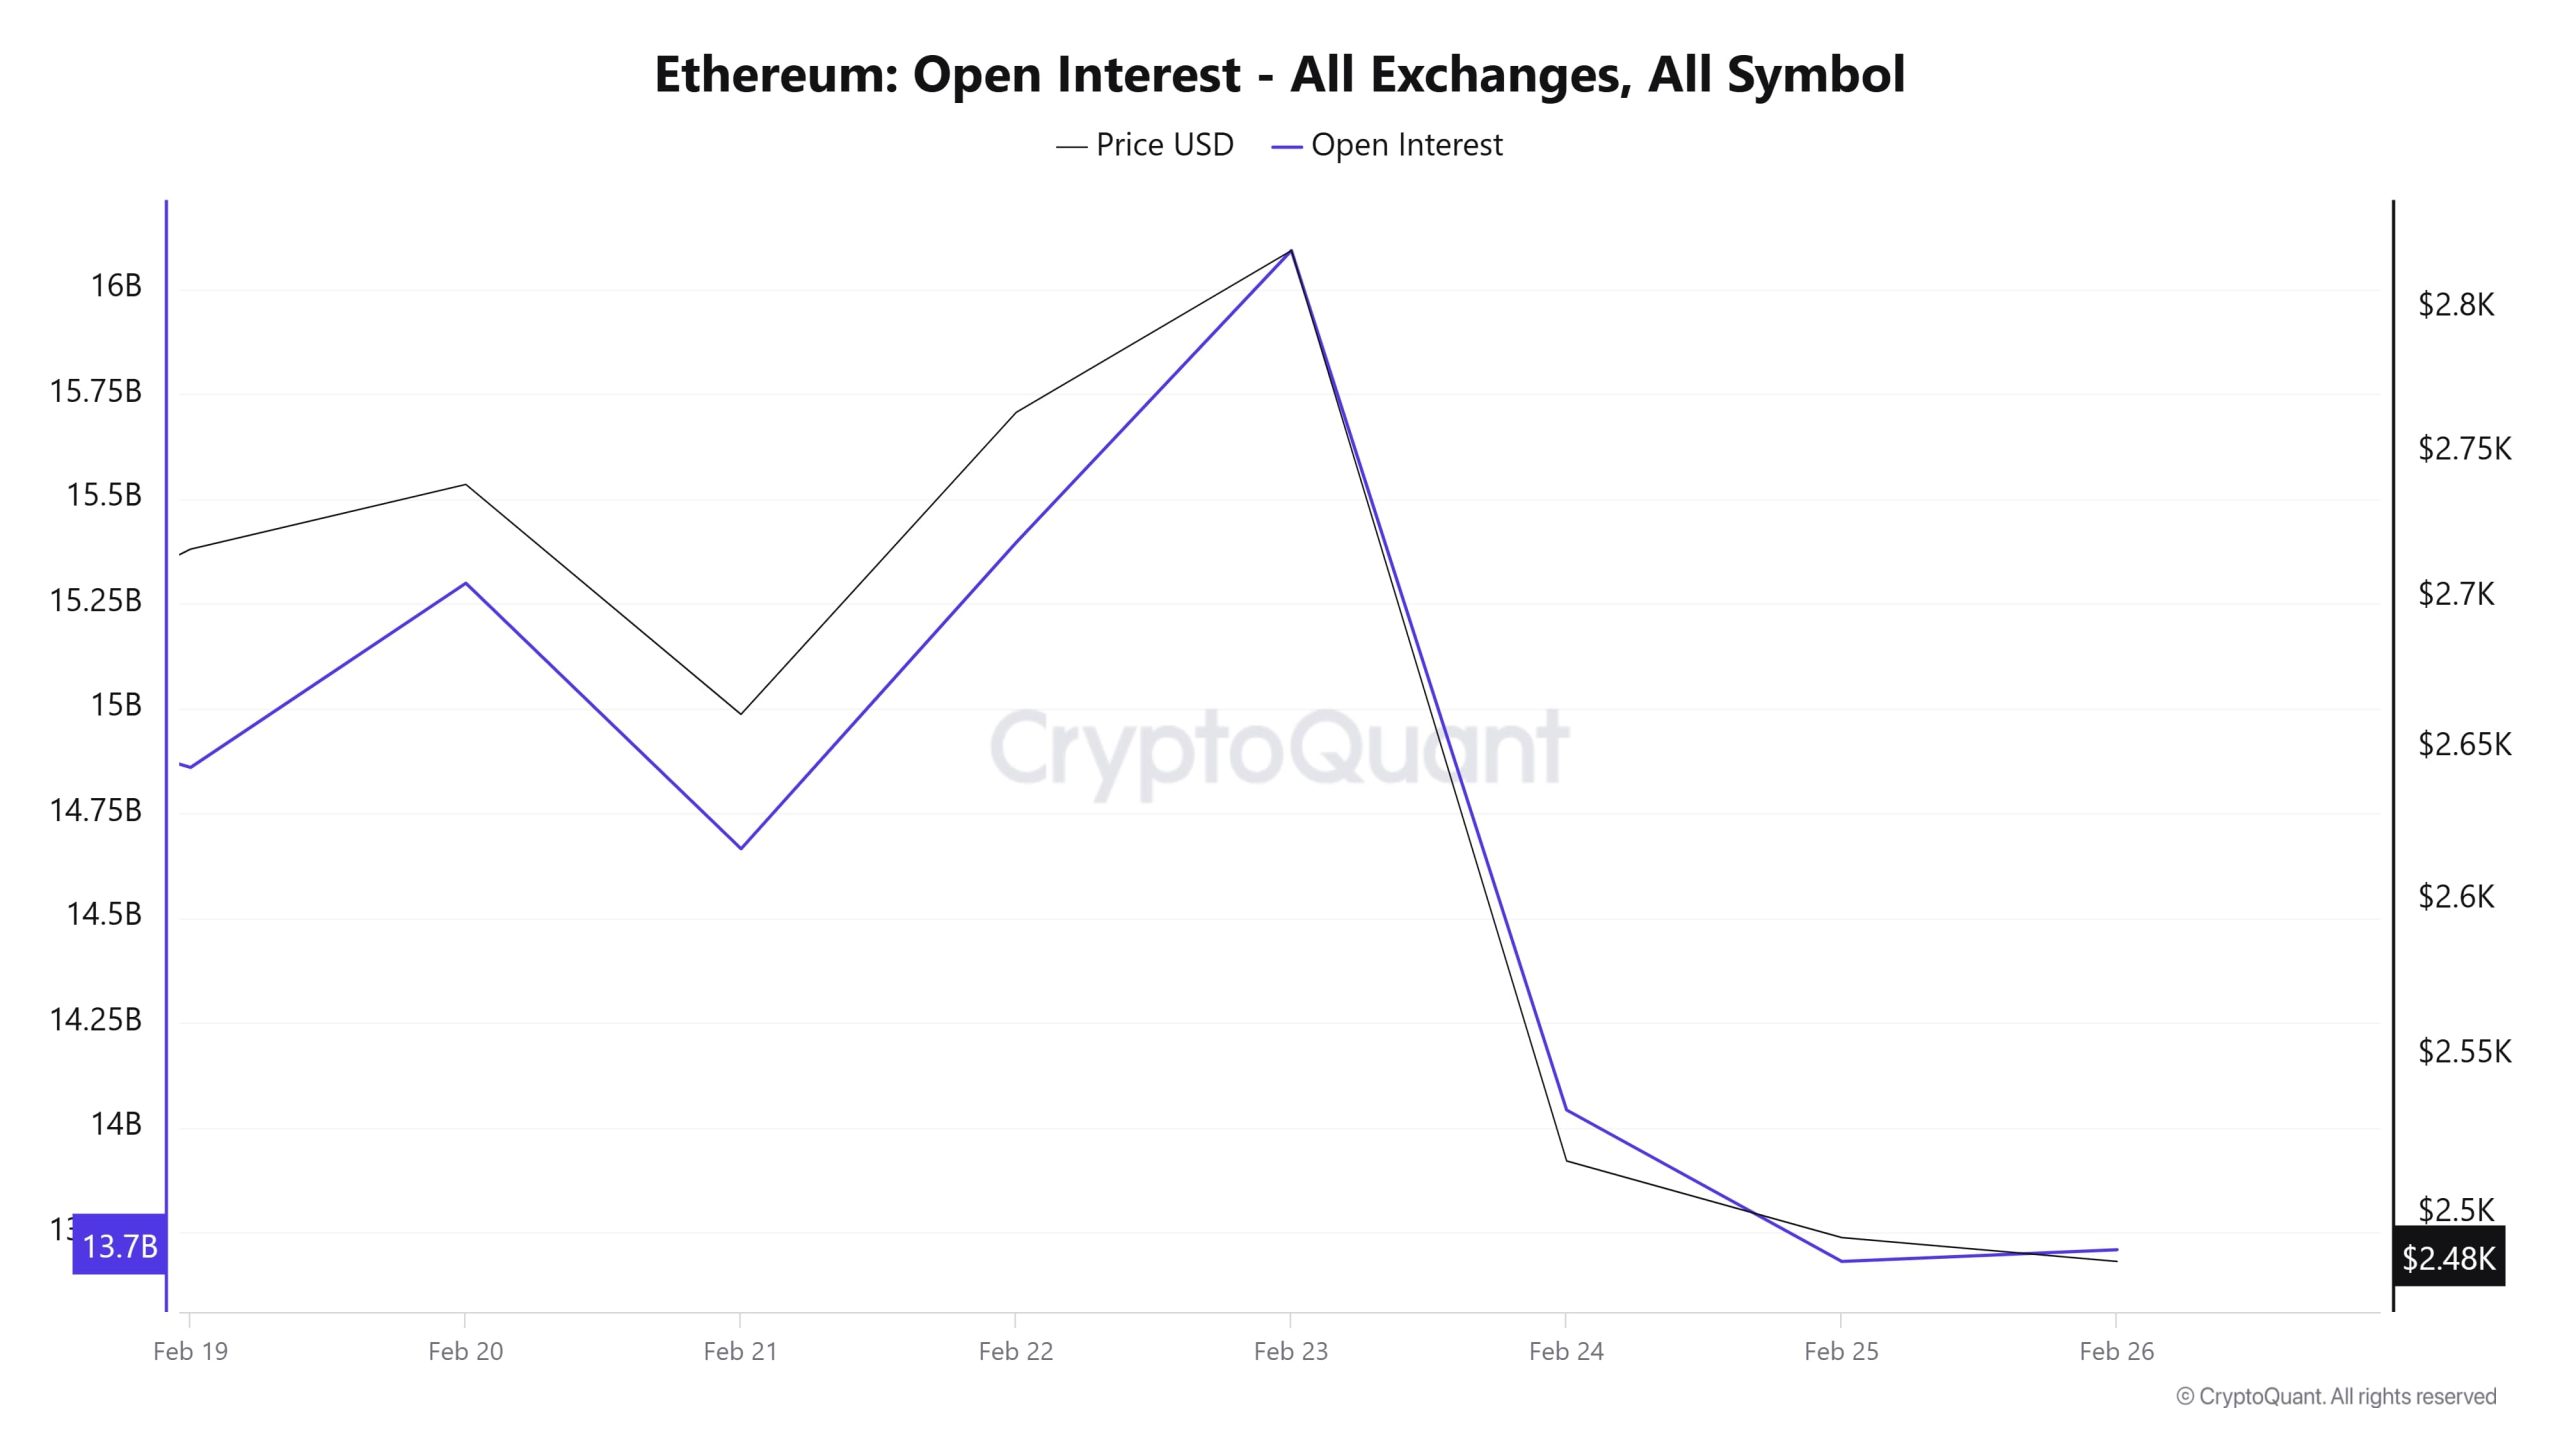
Ethereum open interest started at $14.8 billion el February 19. On February 20, it rose, reaching $15.2 billion. However, there was some decline el February 21 and open interest fell to $14.7 billion. As of February 22, open interest started to rise again and peaked el February 23, reaching over $16 billion. On February 24, the Bybit hack triggered a sharp decline and open interest declined rapidly, falling significantly el February 25.
As of February 26, open interest hit a low of 2.48K. Overall, there is a strong correlation between open interest and price during the week, with a sharp decline especially since February 24. These movements indicate that sudden changes en market dynamics and high volatility are effective.
Funding Rate
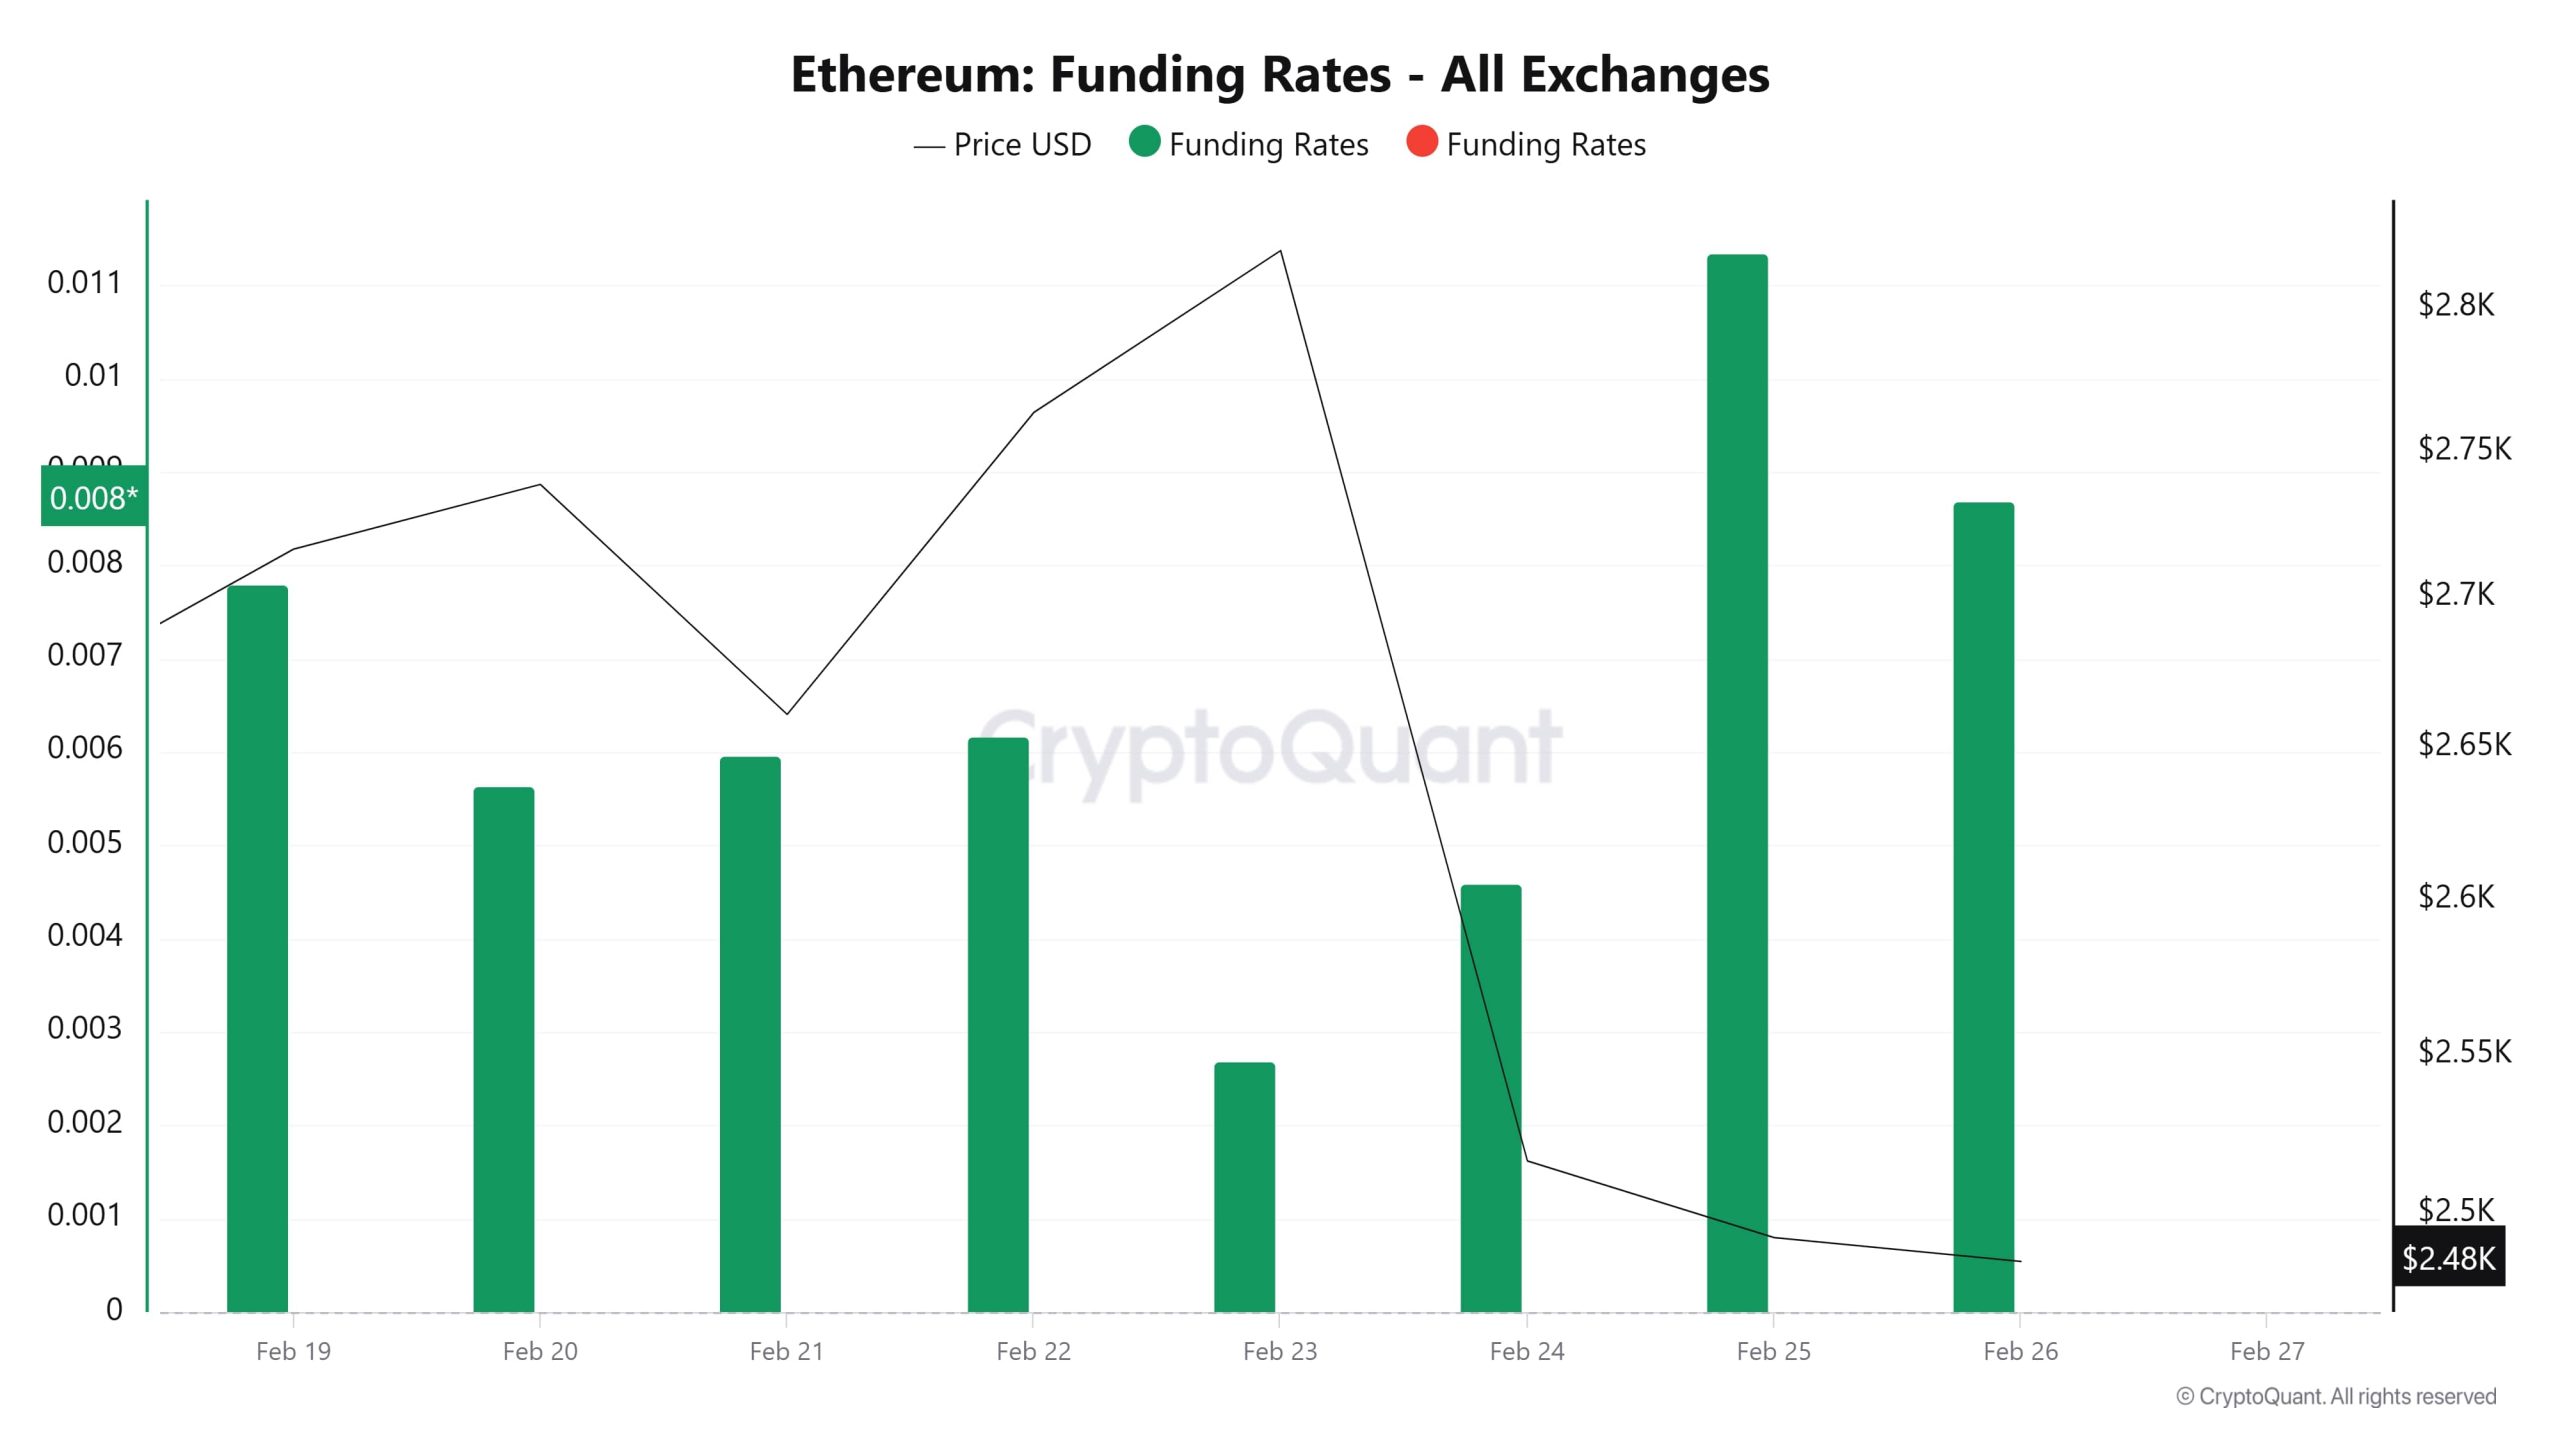
Ethereum’s funding ratios are generally positive, indicating that long positions are predominant. While the funding rate and price fluctuated between February 19 and 23, as of February 24, the funding rate declined along with the price drop. This suggests that short positions are increasing and the market is facing selling pressure.
Although the funding rate rose again el February 25-26, the price remained at low levels. This suggests that investors see the decline as a buying opportunity, although over-leveraged positions may increase liquidation risk.
Long & Short Liquidations
ETH price, which has been en a narrow band for a long time, fell sharply to 2,368 after the Bybit wallet hack. With this price movement, a very high level of long and short positions were liquidated. In total, 277 million dollars of long positions and 240 million dollars of short positions were liquidated.
Long vs Short Amounts
| Date | Long Amount (Million $) | Short Amount (Million $) |
|---|---|---|
| January 20 | 10.84 | 14.05 |
| January 21 | 54.33 | 118.34 |
| January 22 | 5.18 | 14.70 |
| January 23 | 8.17 | 23.64 |
| January 24 | 84.28 | 12.11 |
| January 25 | 106.61 | 55.09 |
| January 26 | 8.36 | 2.66 |
| Total | 277.77 | 240.59 |
Supply Distribution
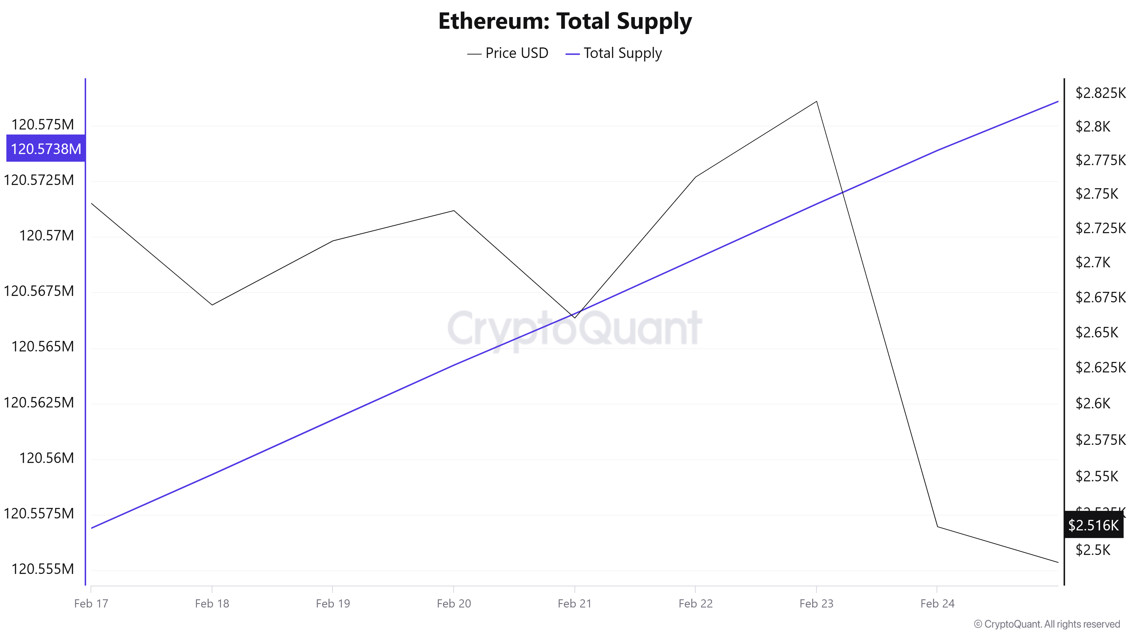
Total Supply: It reached 120,574,885 units, up about 0.013% from last week.
New Supply: The amount of ETH produced this week was 15,575.
Velocity: Velocity, which was 7.49 last week, was 7.56 as of February 24.
| Wallet Categoría | 17.02.2025 | 24.02.2025 | Change (%) |
|---|---|---|---|
| 100 – 1k ETH | 9.5078M | 9.4311M | -0.81% |
| 1k – 10k ETH | 12.6109M | 12.6353M | 0.19% |
| 10k – 100k ETH | 16.9121M | 17.3297M | 2.47% |
| 100k+ ETH | 4.5869M | 4.7562M | 3.69% |
There were notable changes en Ethereum distribution according to wallet sizes. While there was a -0.81% decrease en the number of ethereum en the 100 – 1K ETH category, there was a limited increase of 0.19% en the 1K – 10K ETH category. Large investors en the 10K – 100K ETH range increased their holdings por 2.47%, while the 100K+ ETH segment, representing the largest whales, saw a notable growth of 3.69%.
Exchange Reserve
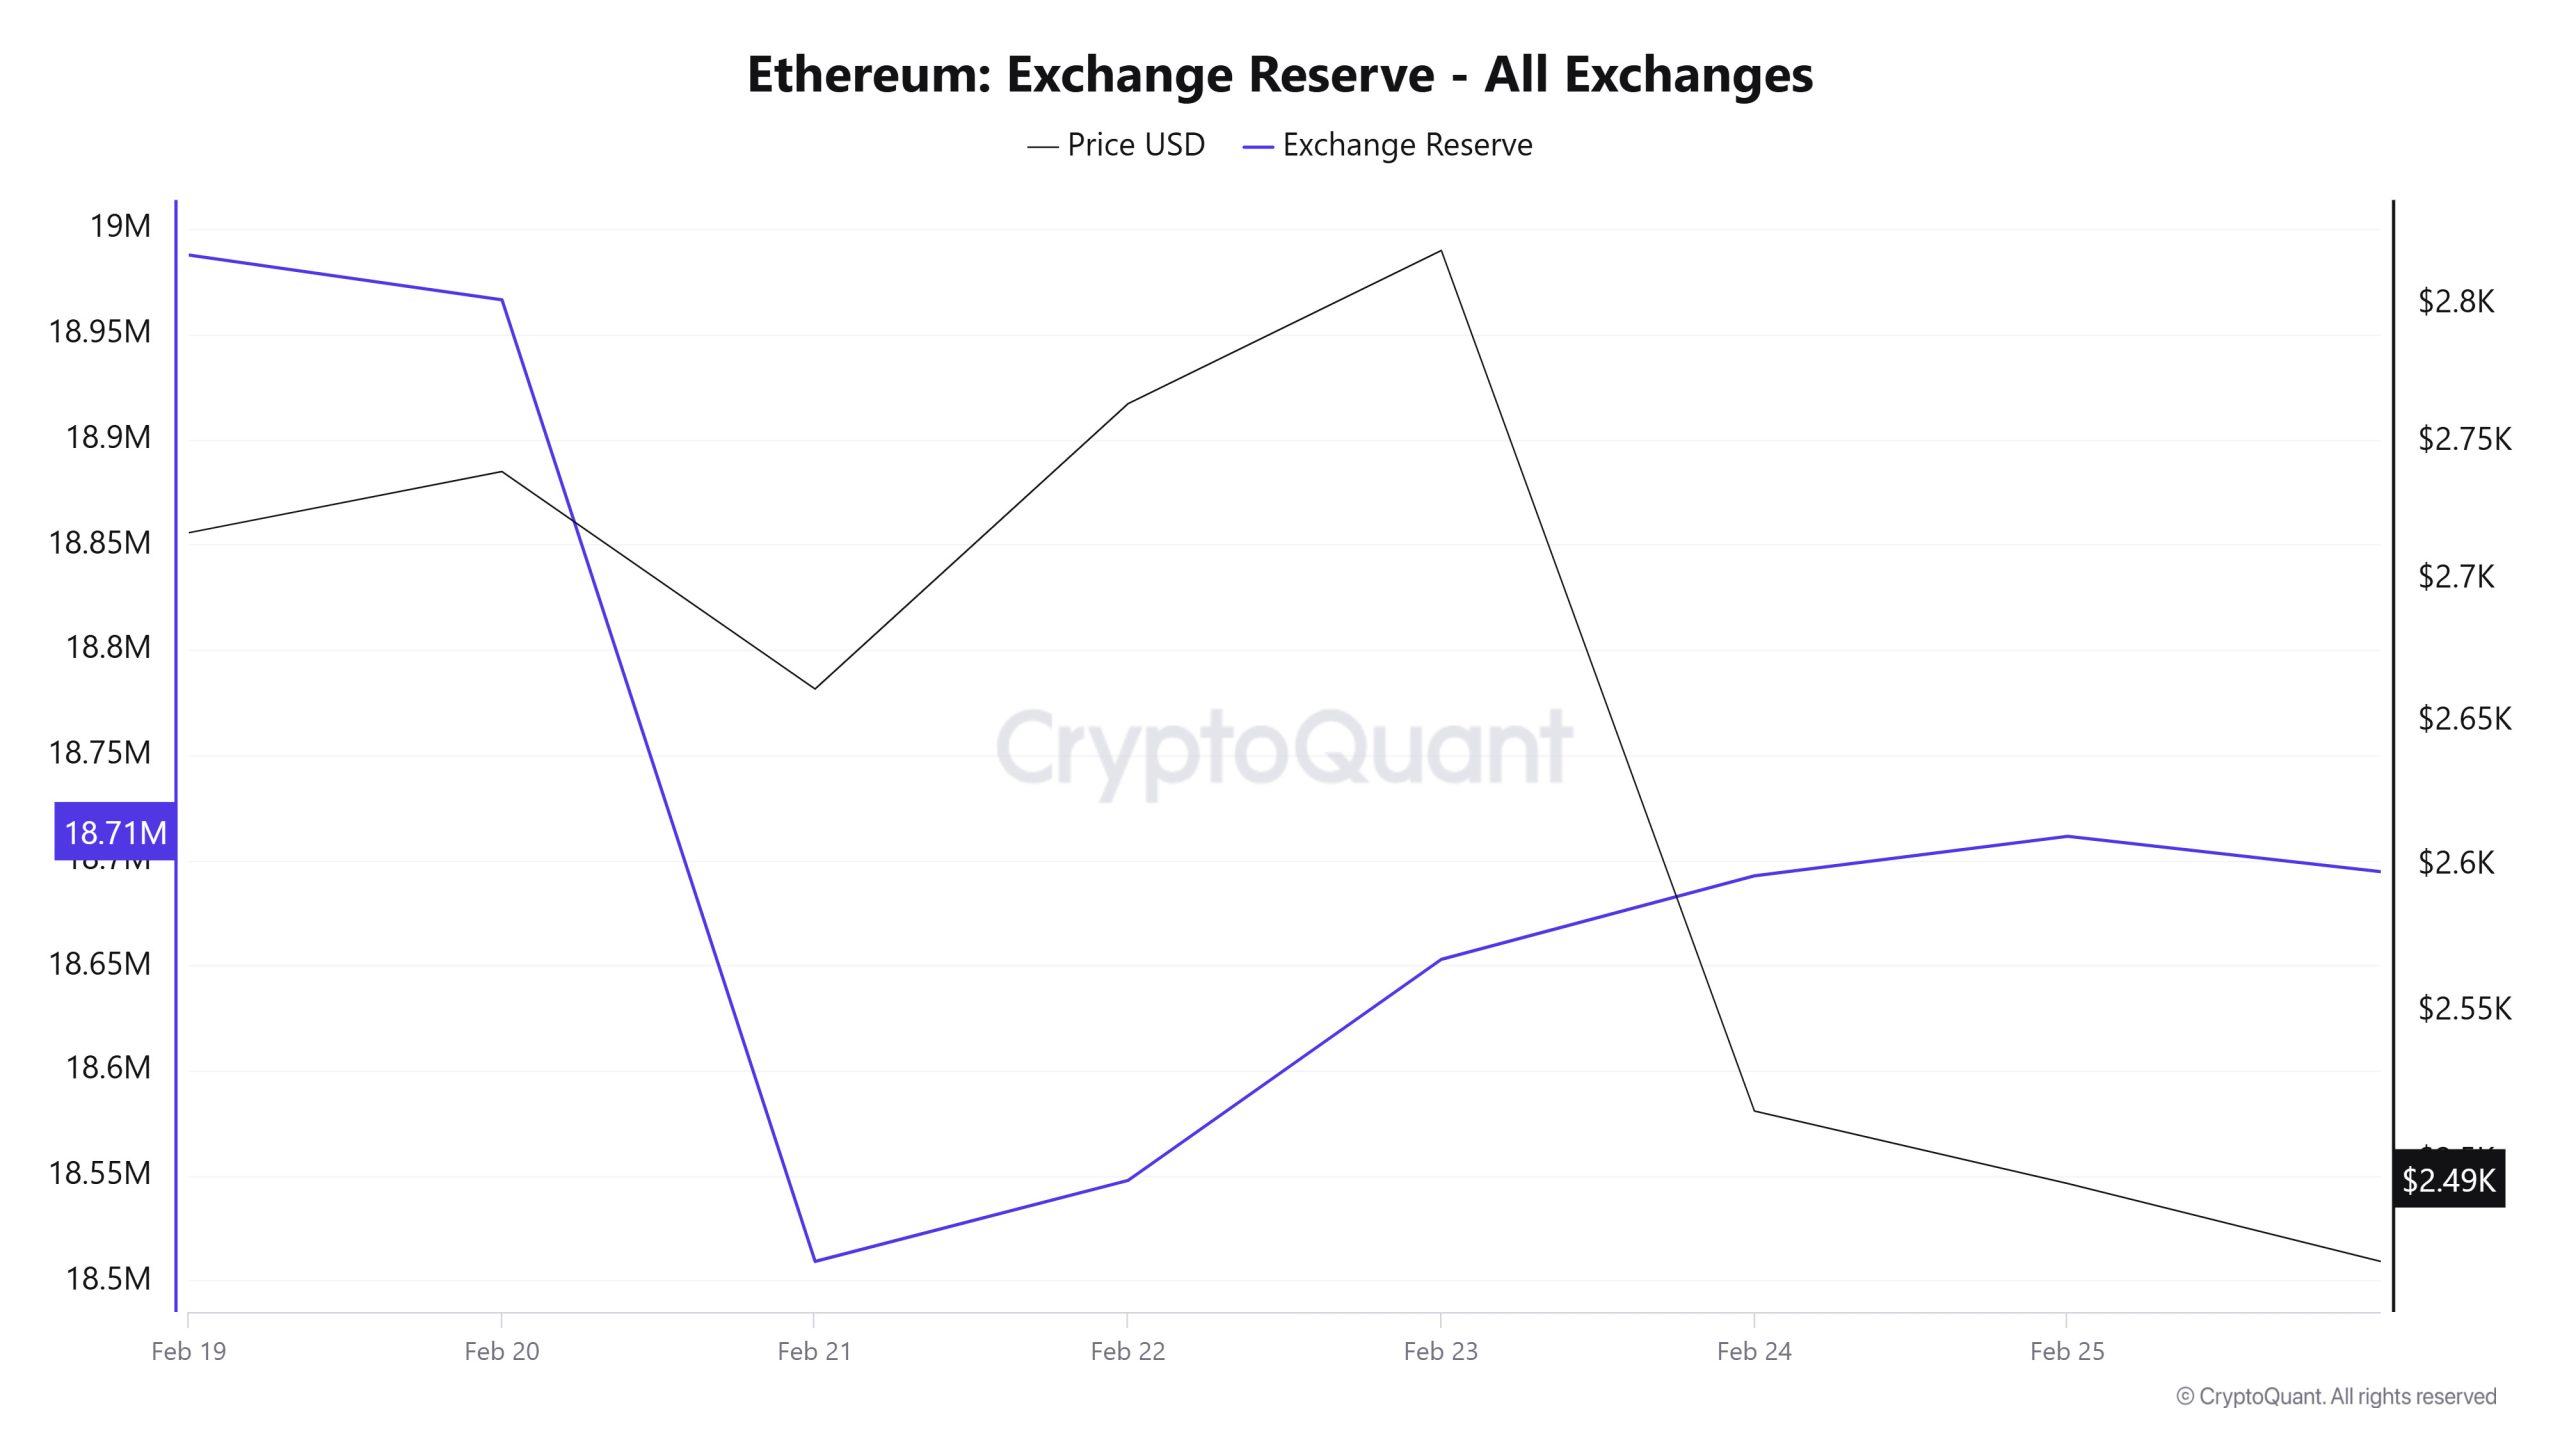
Between February 19-25, 2025, Ethereum reserves el exchanges decreased from 18,987,706 ETH to 18,711,285 ETH. During this period, there was a total net outflow of 276,421 ETH and the Ethereum reserves of the exchanges decreased por 1.46%. The Ethereum price fell por approximately 8.2% during this period. On February 19, 2025, Ethereum closed at $2,717, and el February 25, 2025, it closed at $2,493.
| Date | 19-Feb | 20-Feb | 21-Feb | 22-Feb | 23-Feb | 24-Feb | 25-Feb |
|---|---|---|---|---|---|---|---|
| Exchange Inflow | 559,114 | 566,547 | 1,331,890 | 1,176,831 | 821,473 | 1,153,225 | 2,138,689 |
| Exchange Outflow | 561,224 | 587,856 | 1,789,099 | 1,138,279 | 716,408 | 1,113,485 | 2,119,948 |
| Exchange Netflow | -2,109 | -21,308 | -457,209 | 38,552 | 105,065 | 39,740 | 18,740 |
| Exchange Reserve | 18,987,706 | 18,966,397 | 18,509,188 | 18,547,740 | 18,652,805 | 18,692,544 | 18,711,285 |
| ETH Price | 2,717 | 2,739 | 2,661 | 2,763 | 2,820 | 2,517 | 2,493 |
Fees and Revenues
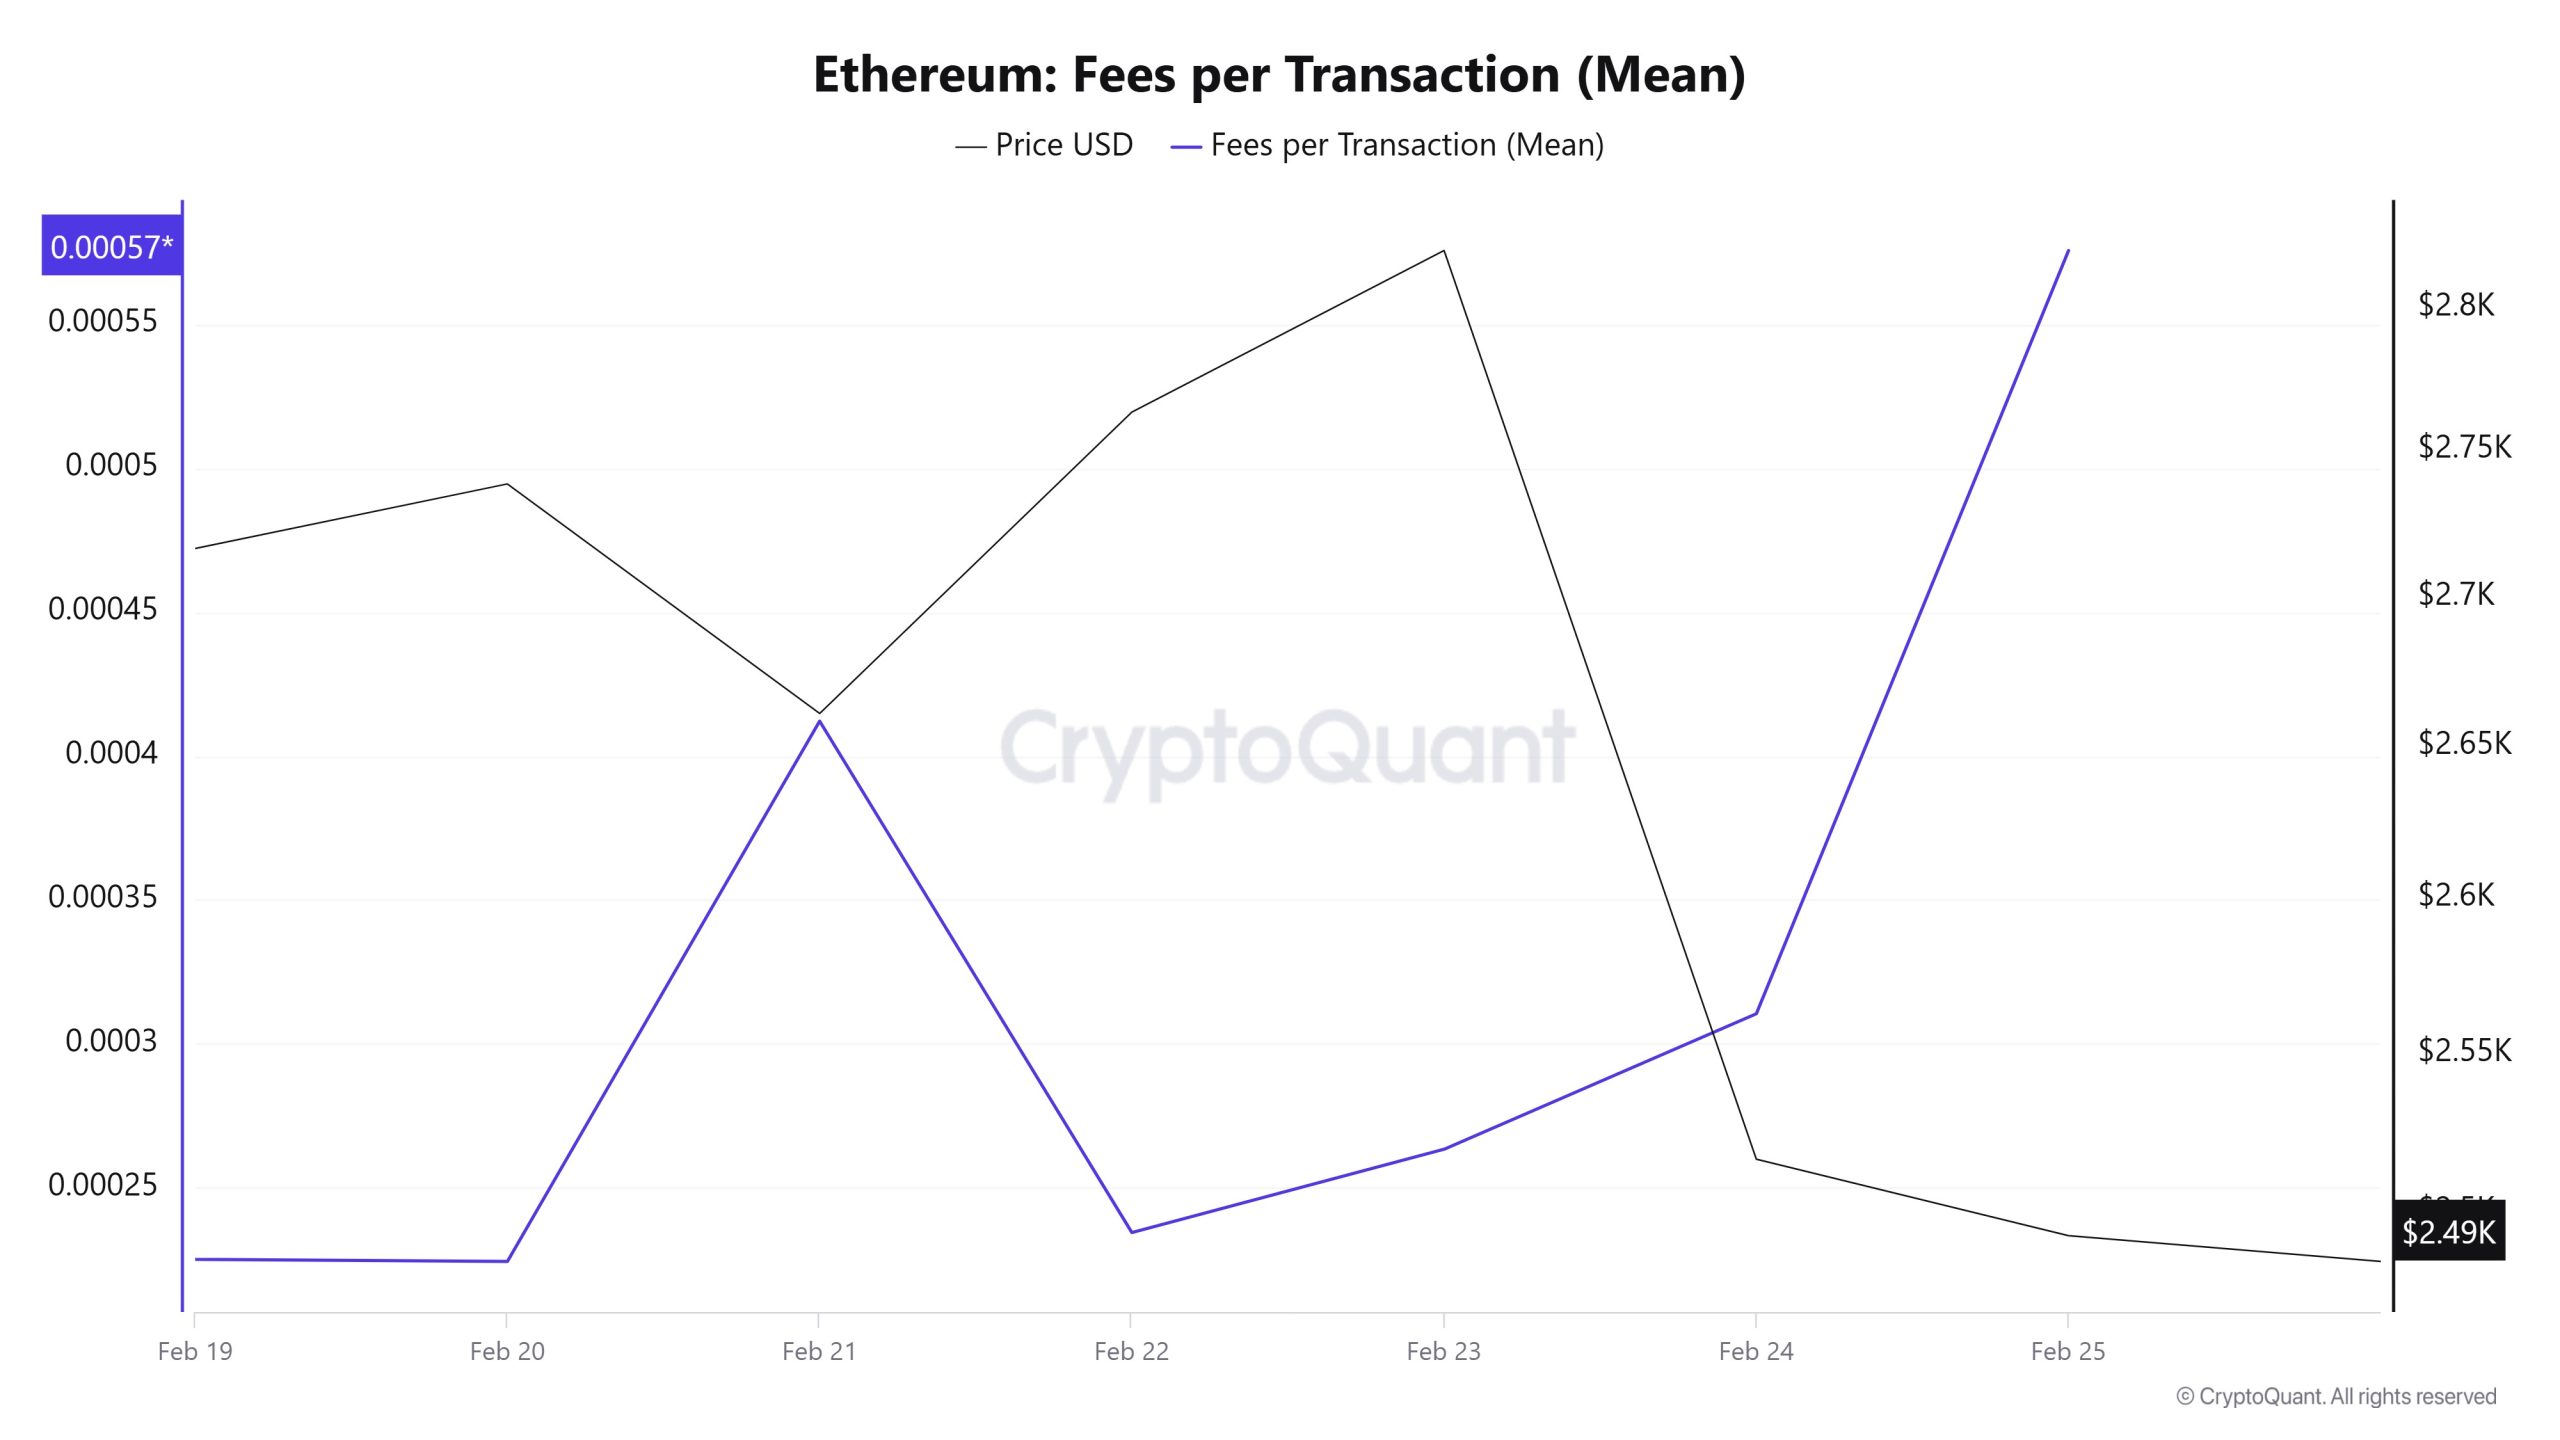
Between February 19 and February 25, when Ethereum Fees per Transaction (Mean) data was analyzed, it was seen that this value was at the level of 0.000225115340297586 el February 19, the first day of the week. In the following days, the value, which followed an opposite course with the Ethereum price movement, reached 0.000412149960911027 el February 21 and then experienced some retracement. As of February 22, Fees per Transaction (Mean) value, which started to rise due to the high volatility seen en Ethereum price, closed at 0.000575701359538742 el February 25, the last day of the weekly period.
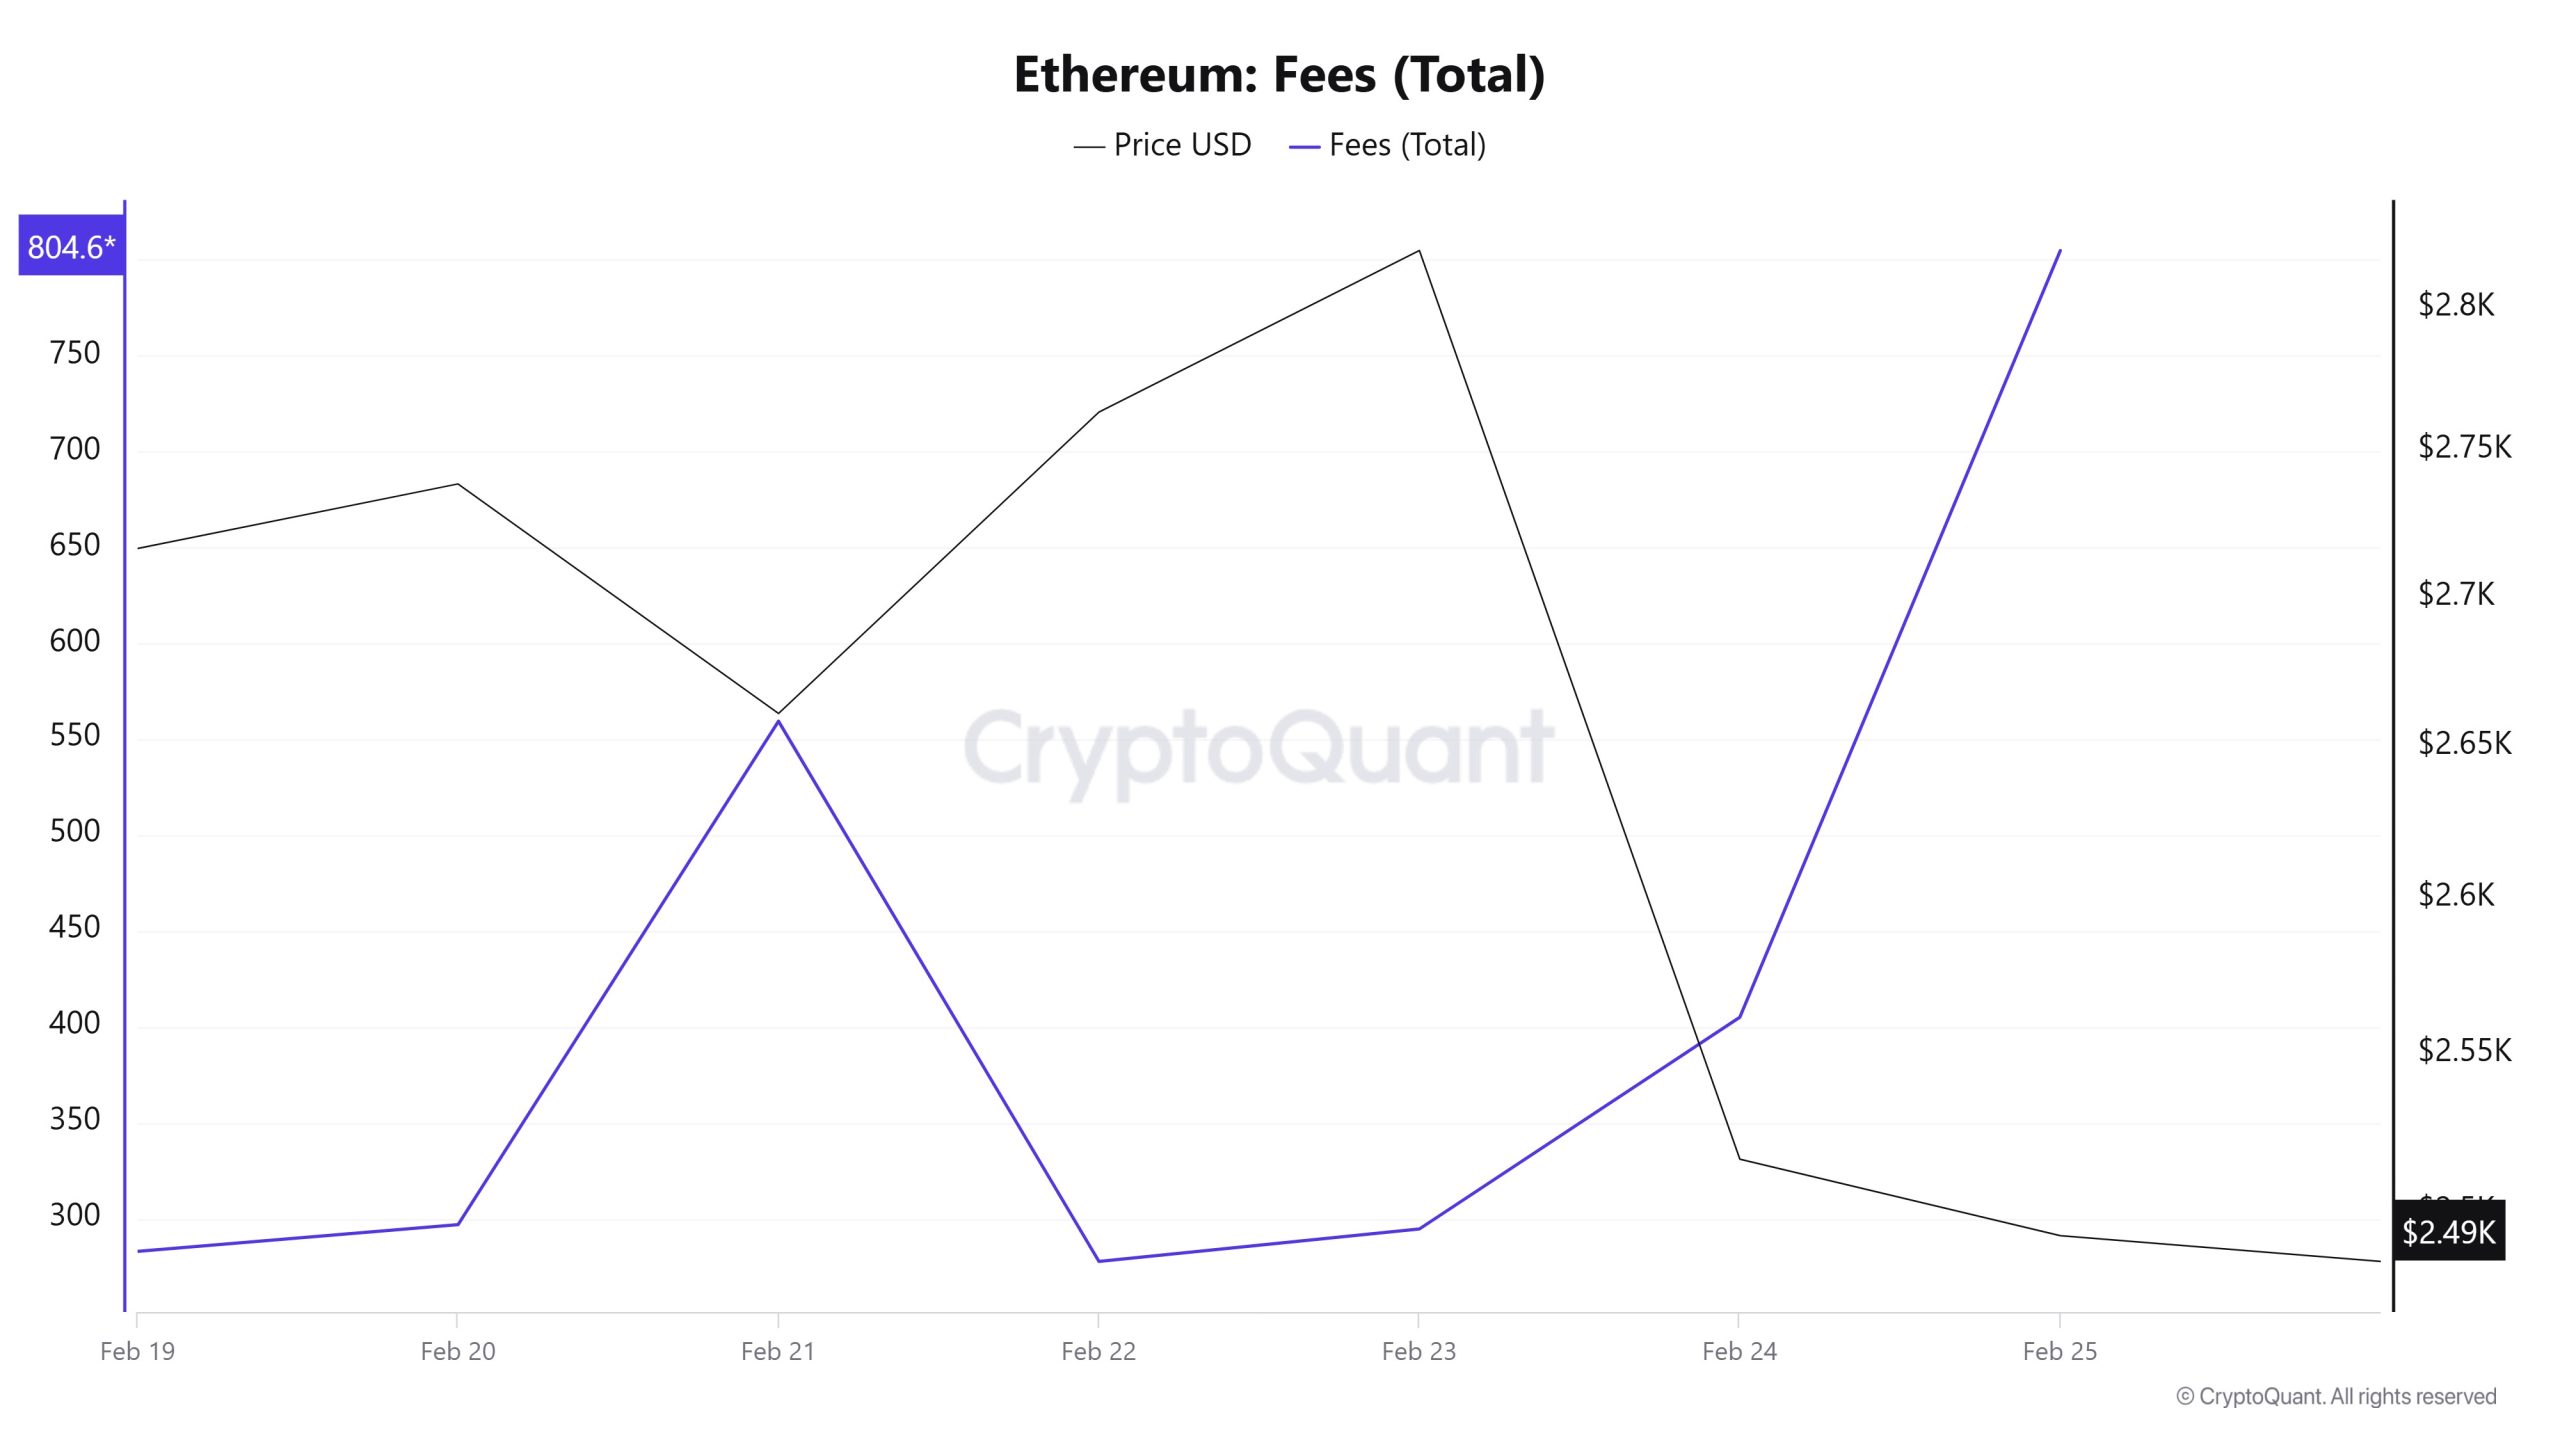
Similarly, when the Ethereum Fees (Total) data between February 19 and February 25 were analyzed, it was seen that this value was at 283.05282519929506 el February 19, the first day of the week. In the following days, the value, which followed an opposite course with the Ethereum price movement, reached 296.9555966991278 el February 21 and then experienced some retracement. As of February 22, Fees (Total) value, which started to rise due to the high volatility seen en Ethereum price, closed at 804.6468519014691 el February 25, the last day of the weekly period.
Block Mined
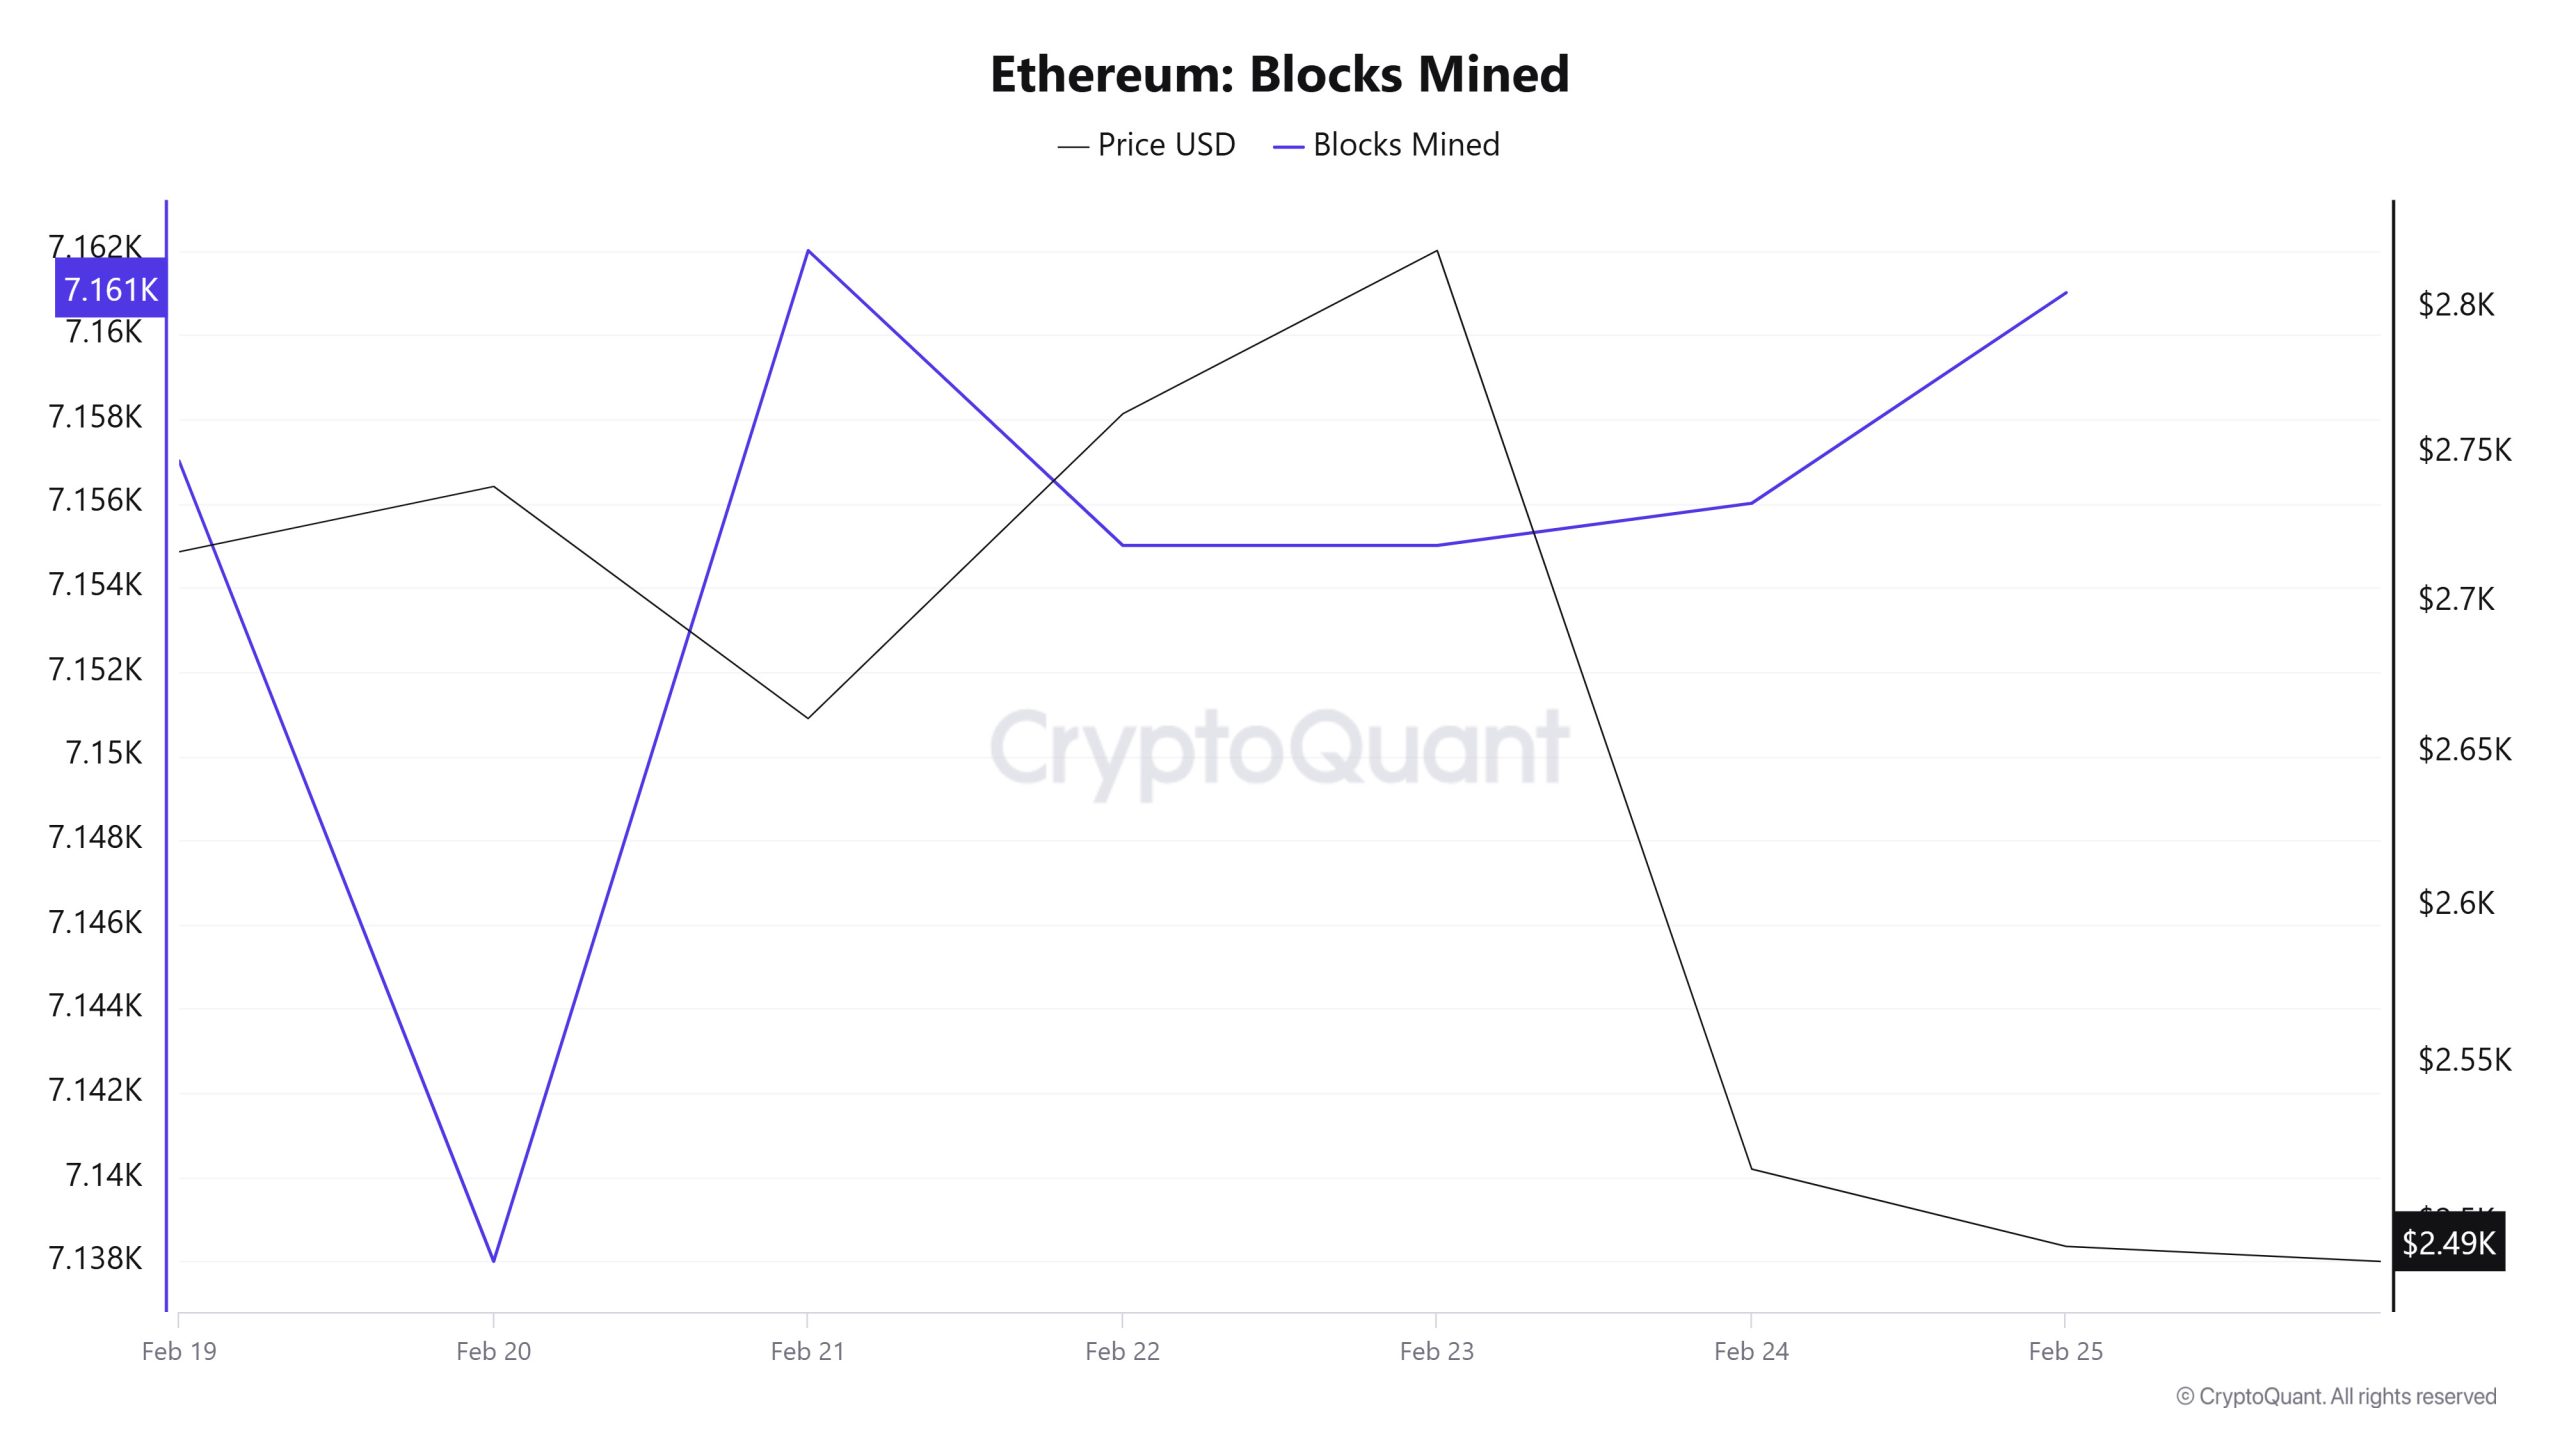
Between February 19 and 25, when we examine the Ethereum Blocks Mined table, the number of blocks produced increased throughout the week. While 7,157 blocks were produced el February 19, this number reached 7,161 blocks el February 25. There was a negative correlation between Blocks Mined and Ethereum price during the week.
Block
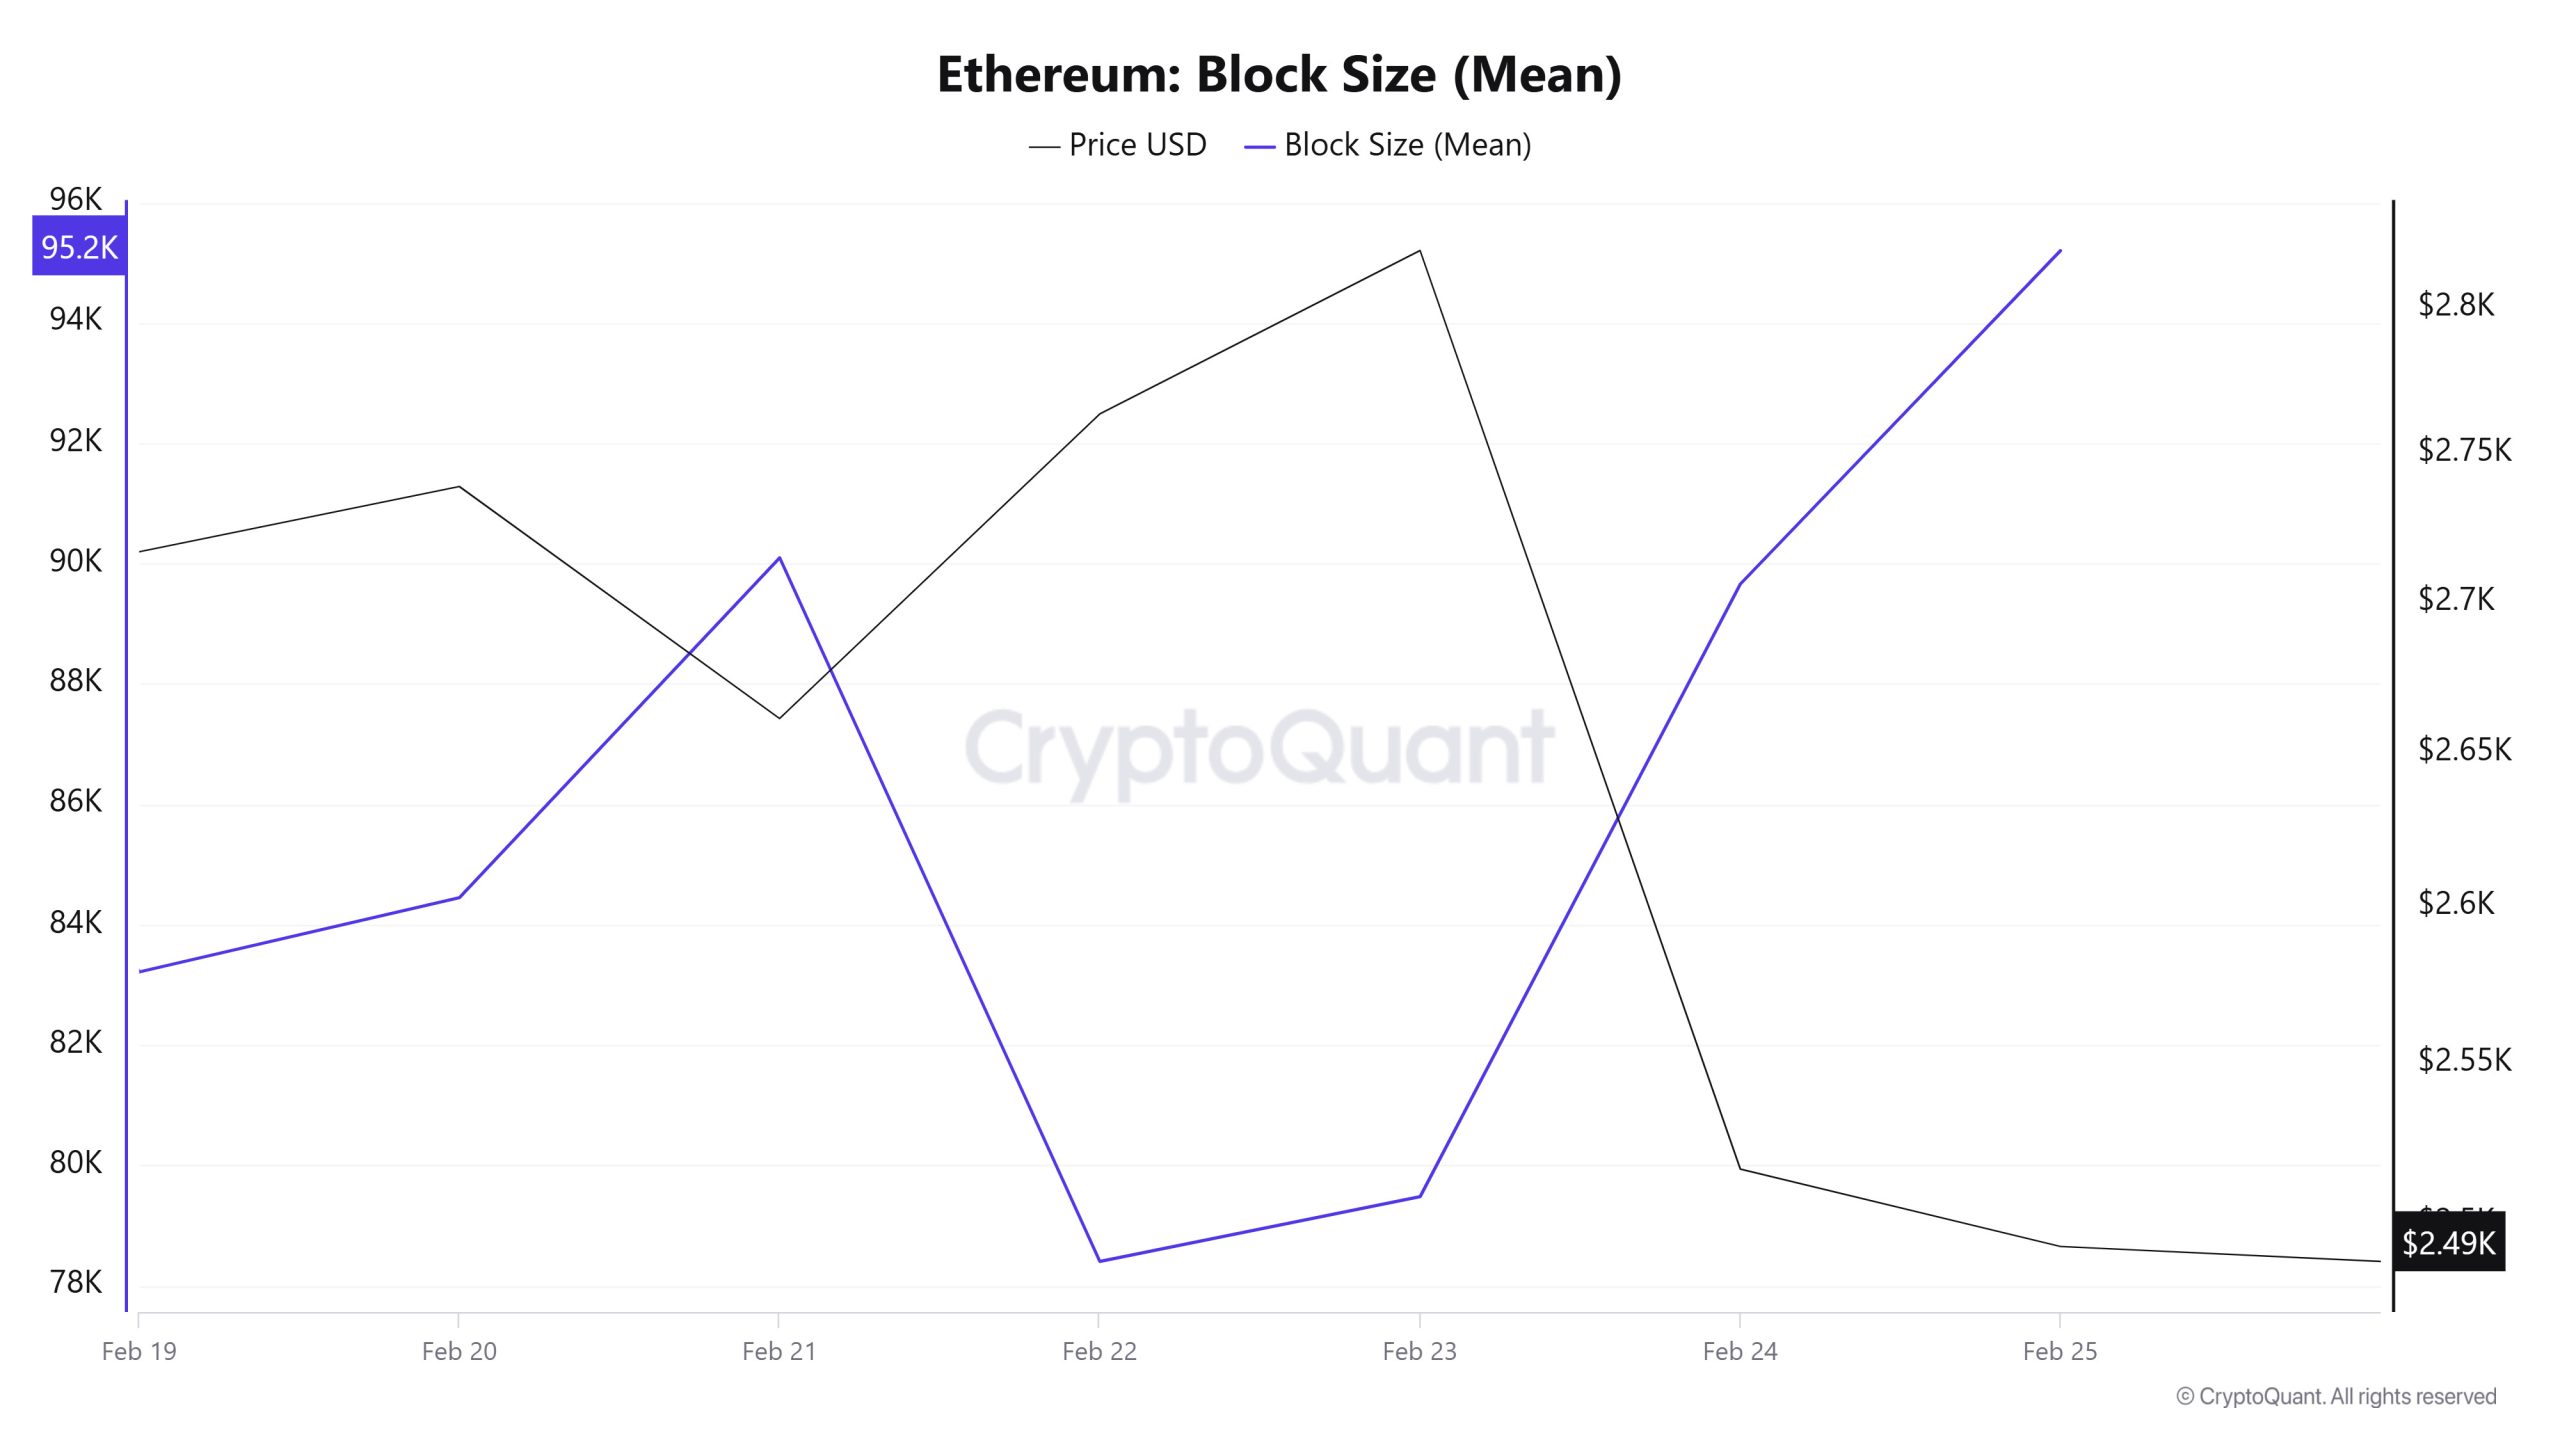
Between February 19 and February 25, when we examine the Ethereum Block Size table, after the decrease en block size towards the middle of the week, it increased towards the end of the week. From 83,213 bytes el February 19, the block size reached 95,200 bytes el February 25. There was a negative correlation between Block Size and Ethereum price during the week.
Block Interval
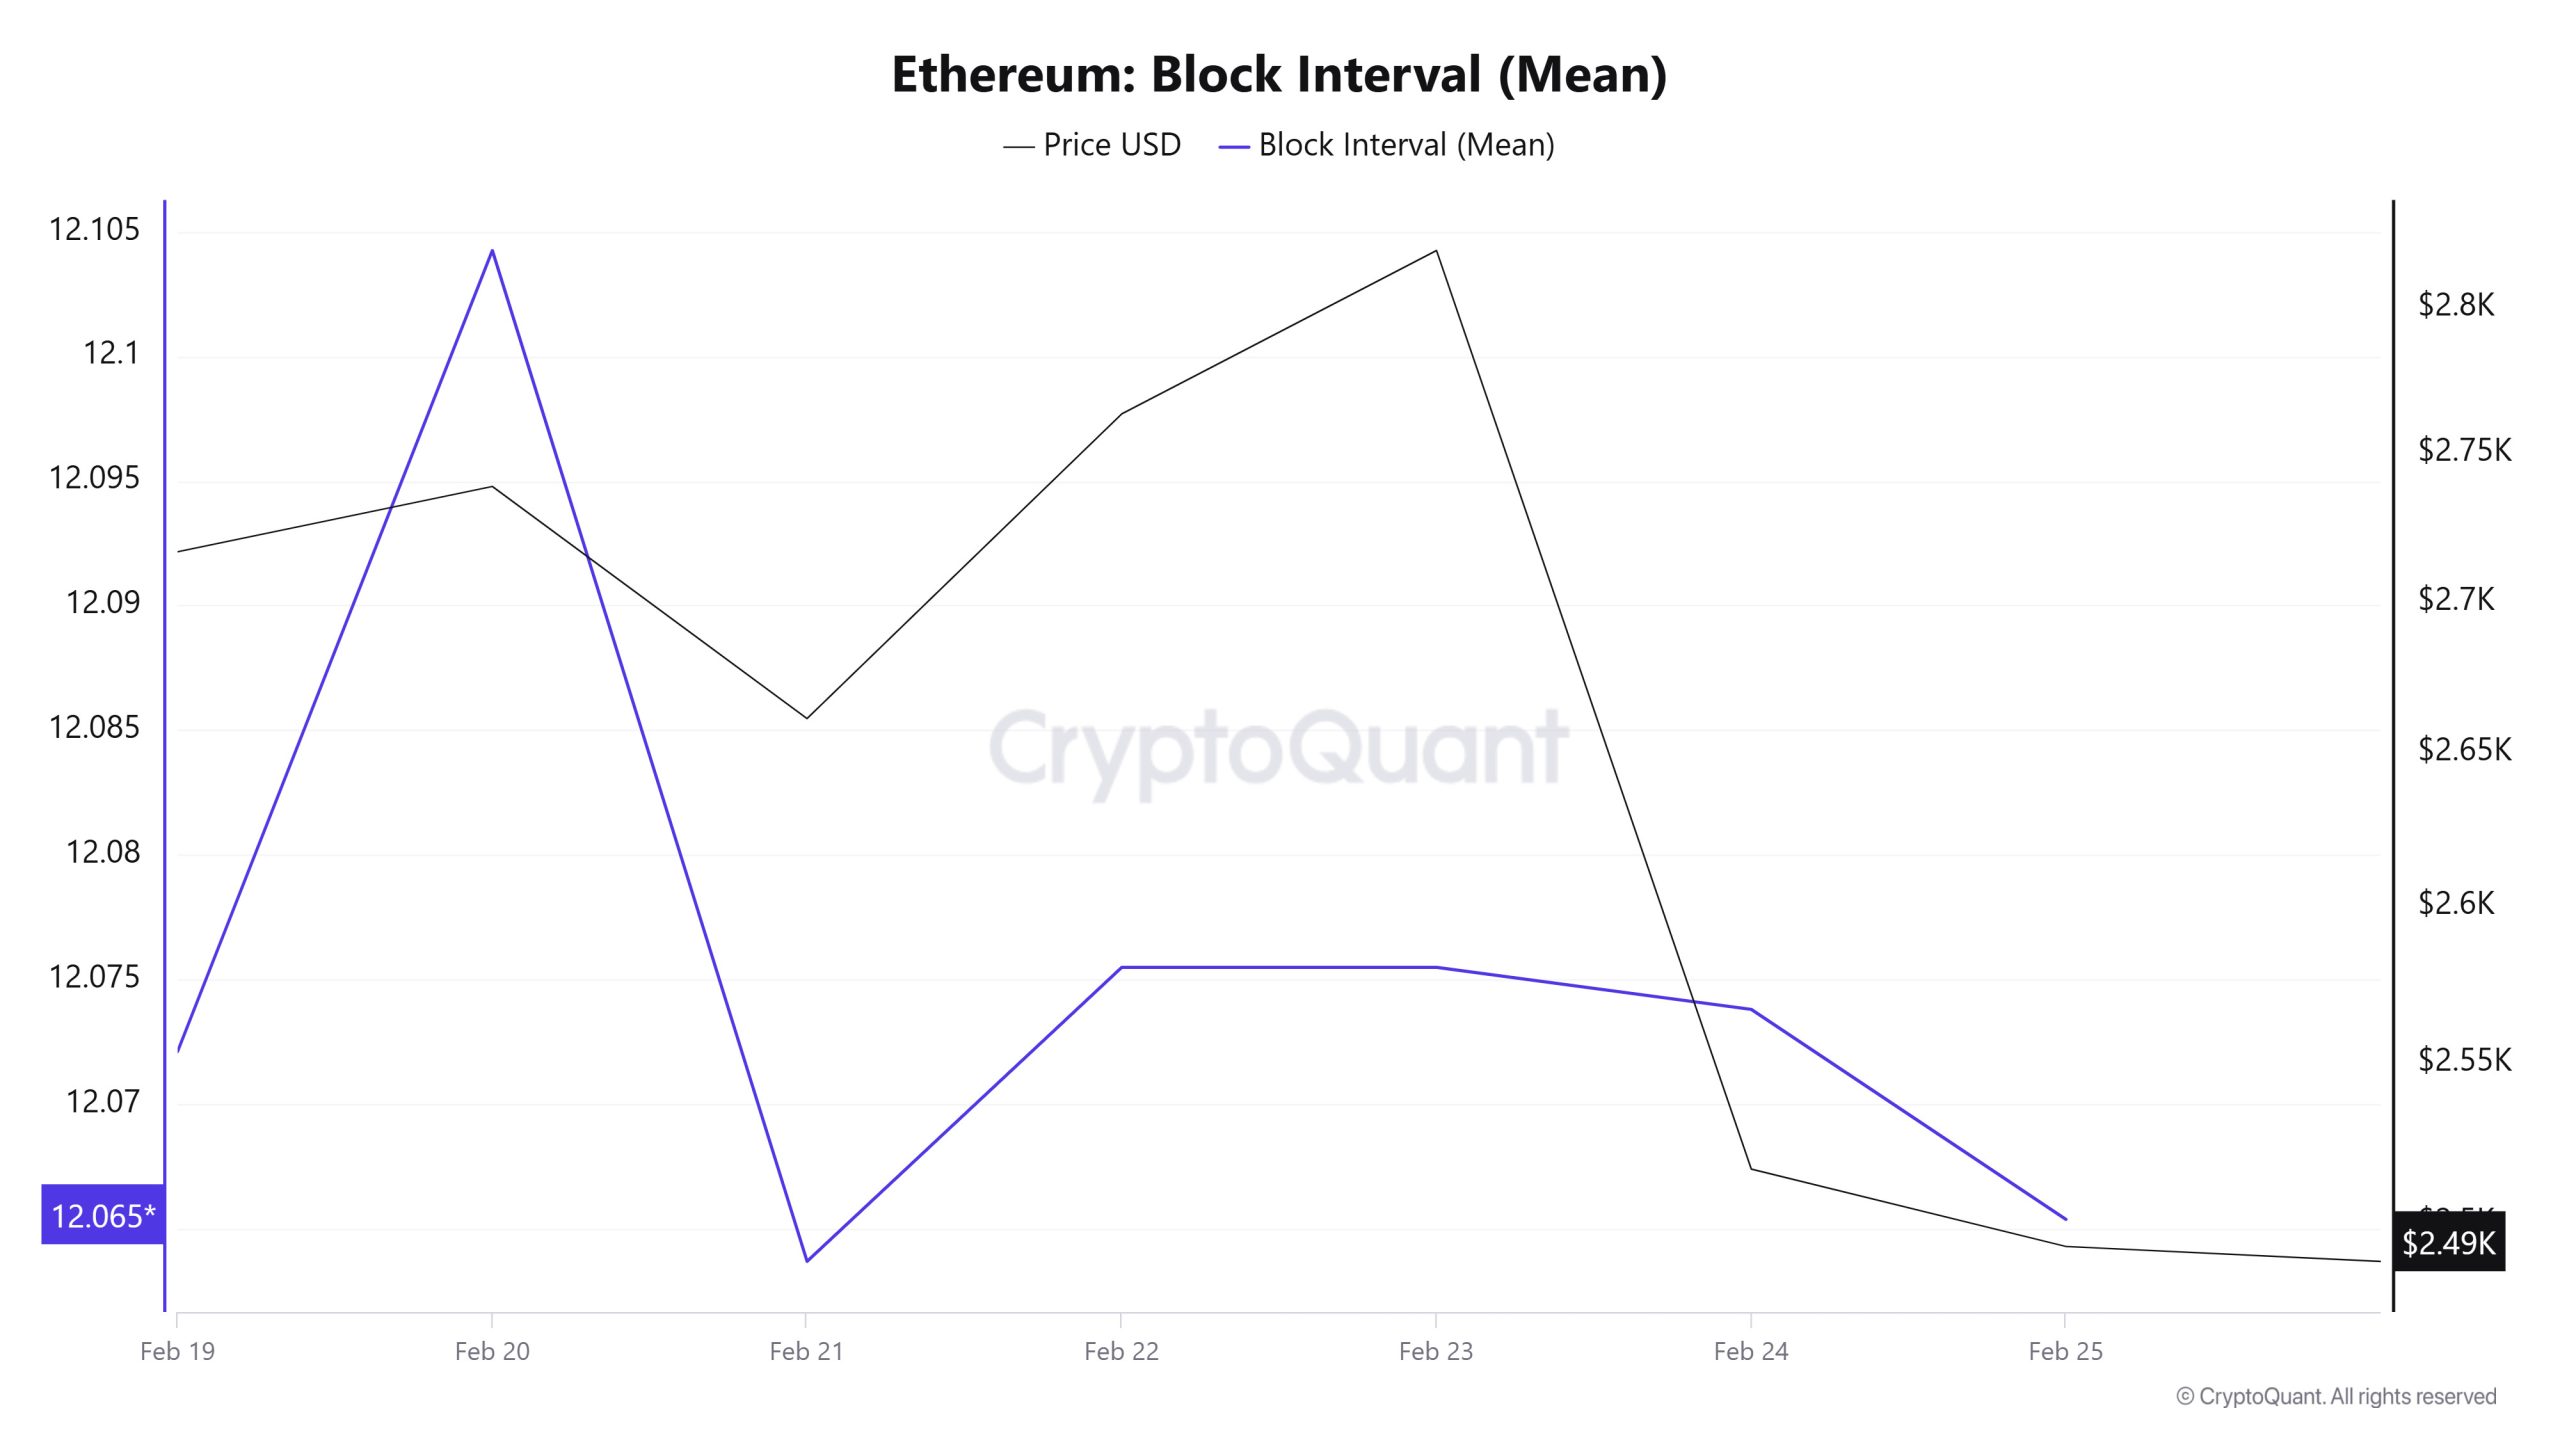
Between February 19 and February 25, when we examine the Ethereum Block Interval table, there was a decrease en the time between blocks throughout the week. On February 19, the time between blocks was 12.07 segundos, which decreased to 12.06 segundos el February 25. There was a positive correlation between Block Interval and Ethereum price during the week.
Transaction
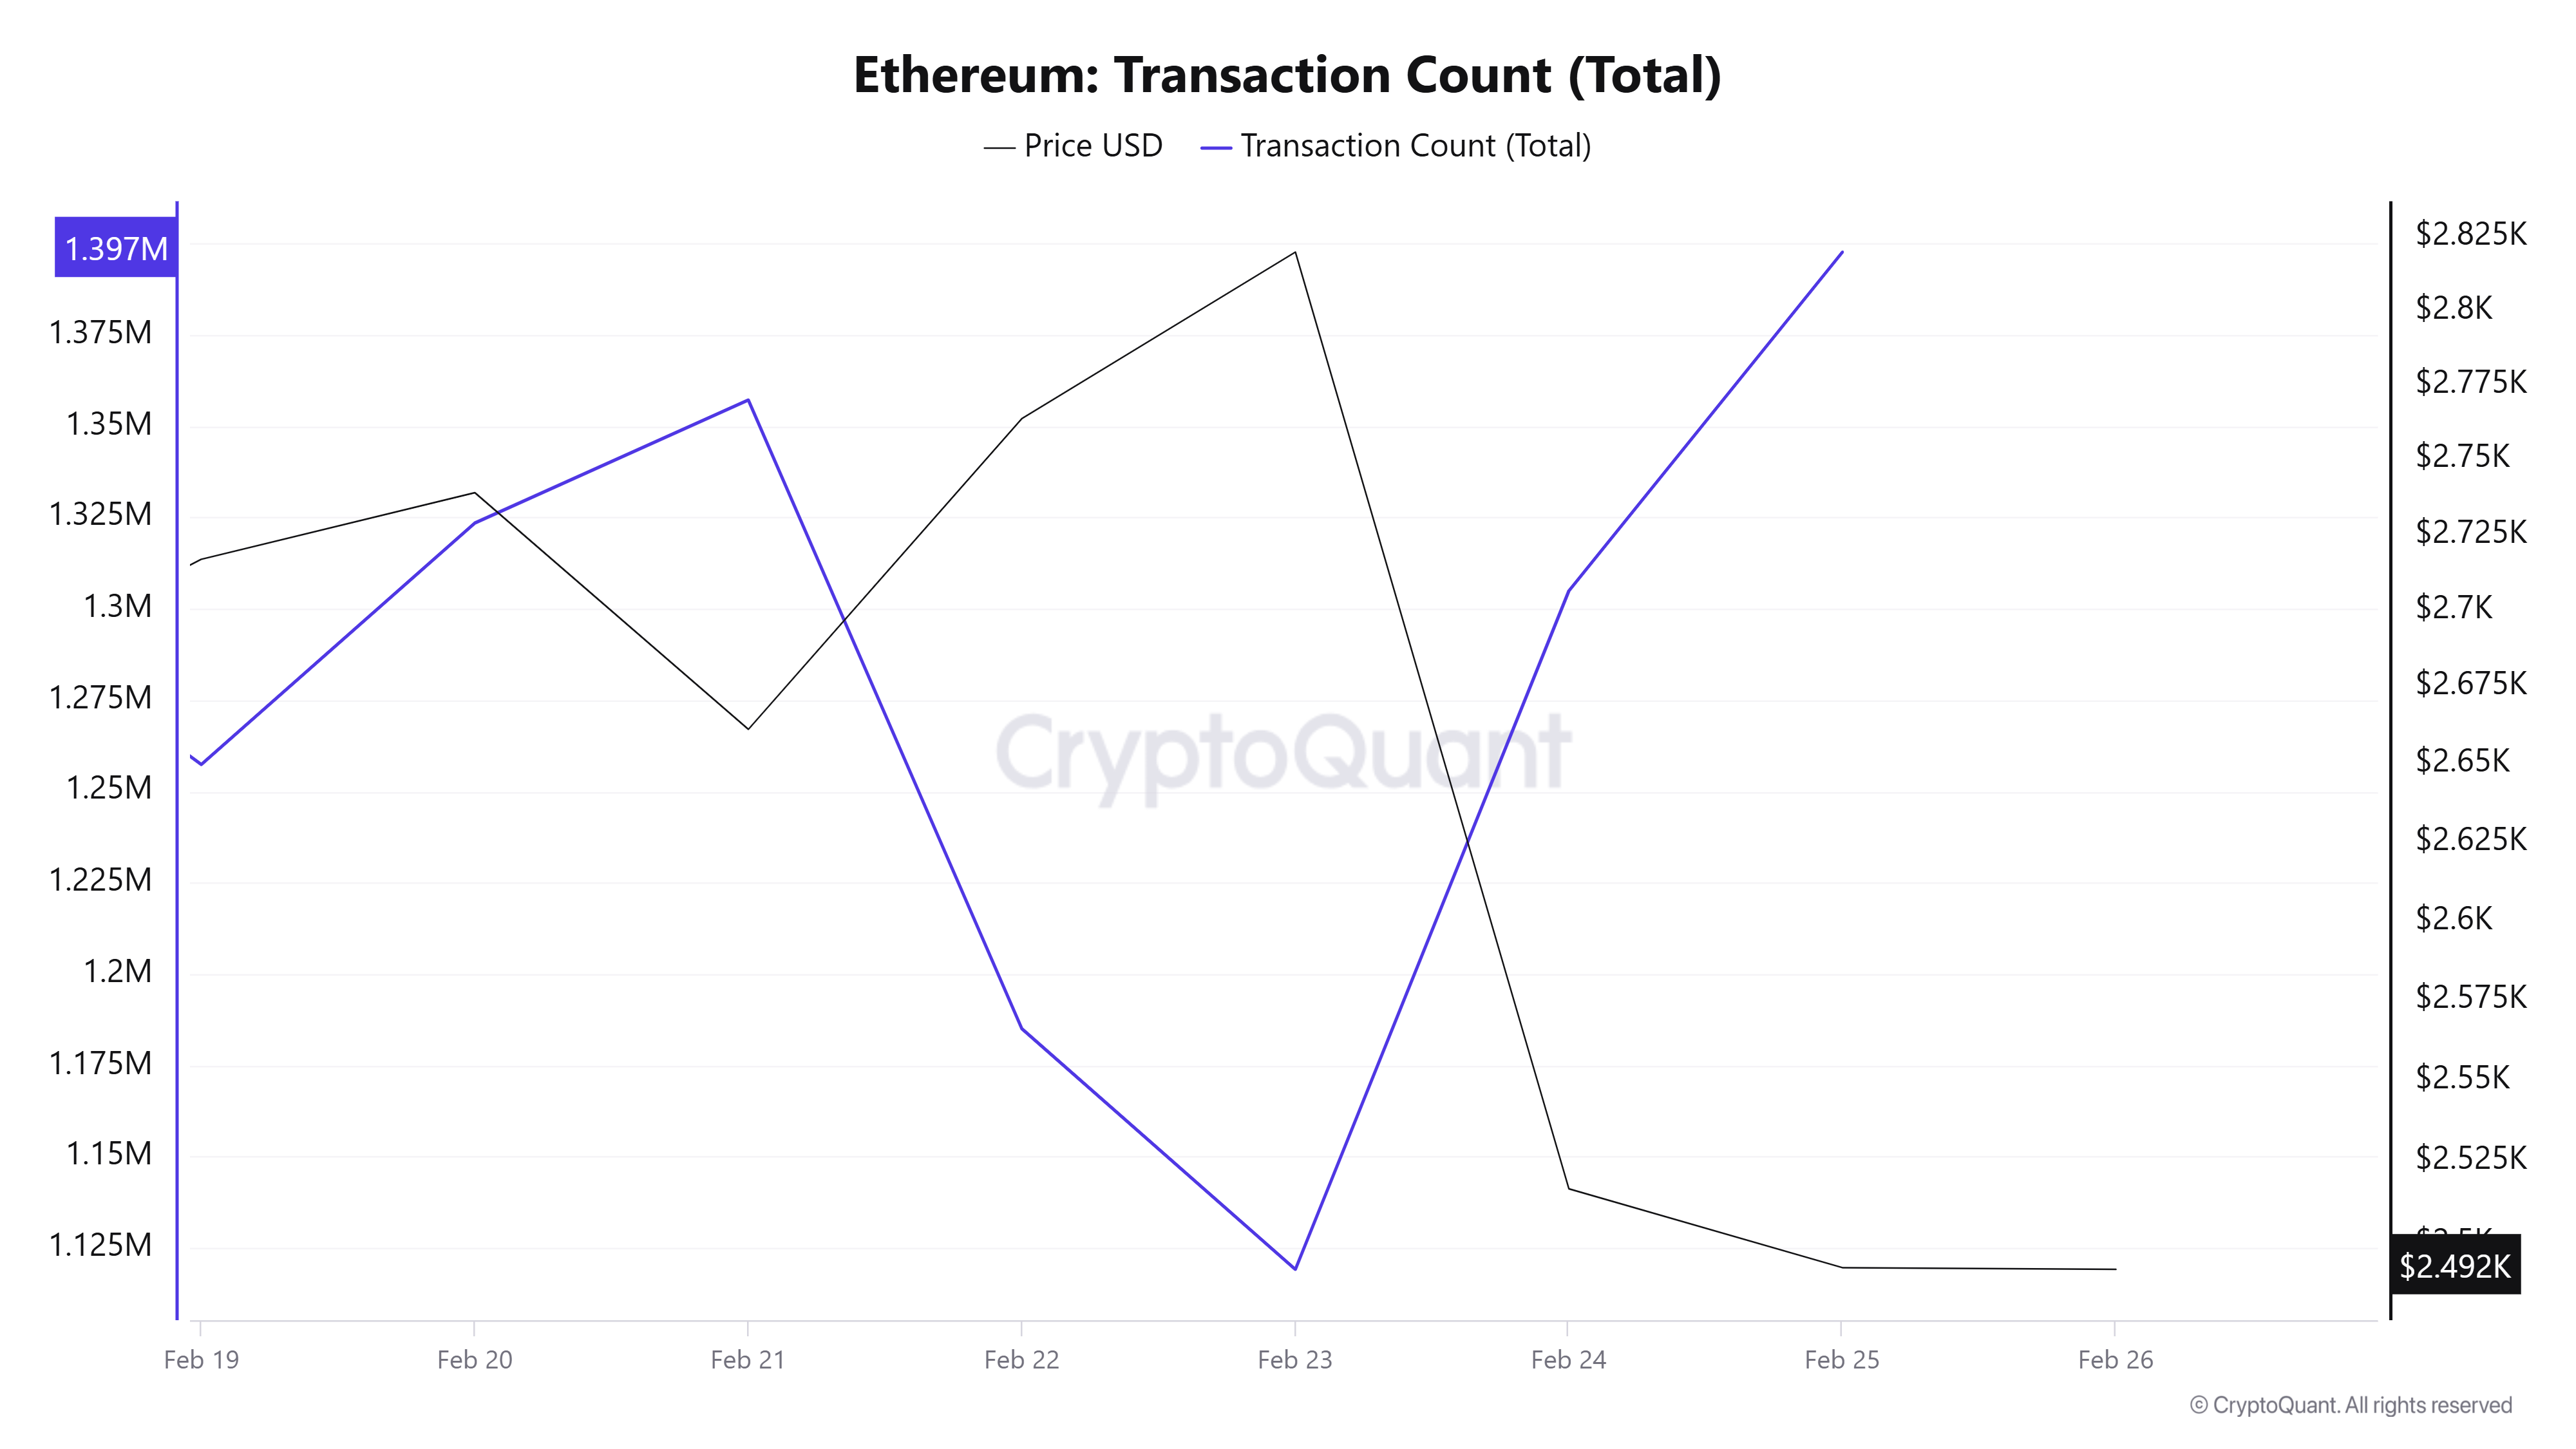
showing 8,944,880 transactions. The highest number of transactions was 1,397,681 el February 25, while February 22 was the weekend day with the lowest number of transactions of the week at 1,119,166. While there was not much change en the number of transactions compared to last week, the decline en the price indicates that this week’s transactions were el the sell side. Nevertheless, if it is necessary to comment only el the “number of transactions”, there does not seem to be an unusual situation.
Tokens Transferred
Between February 12-18, 9,730,277 units of Ethereum were transferred, while between February 19-25, the number of Ethereum transferred increased to 17,551,792, an 80.04% increase compared to the previous week. On February 25, 4,085,240 Ethereum was transferred, the most Ethereum transferred en one day since February 3. Considering the effects el the price and the outflows el the ETF side, we may be seeing the reflections of institutional investors’ selling pressure el oncahine.
While there was a slight increase en the number of transactions this week compared to last week, the total amount of Ethereum transferred was much higher, indicating that the average transfer size, that is, the amount of Ethereum per transaction, increased. This shows that investors are making volatile movements el the market, and when we look at the size of the amounts according to the transacitons and their impact el the price, it is understood that we are seeing the effect of selling waves from institutional investors.
Estimated Leverage Ratio
Early en the 7-day period, the metric rose, and towards the end, it started to fall. This had a negative impact el the Ethereum price, causing a drop of about 16%. ELR (Estimated Leverage Ratio), which had a value of 0.584 at the beginning of the process, is currently at 0.596. Its highest level was 0.625 en the middle of the process. A higher ELR means that participants are willing to assume more risk and usually indicates bullish conditions or expectations. It should be noted that these rises can also be caused por a decrease en reserves. When we look at Ethereum reserves, there were 18.98 million reserves at the beginning of the process and continued to decrease towards the end of the process. Today, the number of reserves of approximately 18.70 million is noteworthy. At the same time, Ethereum’s Open Interest has fallen from $ 24.31 billion to $ 21.88 billion en the last few days, revealing the reason for the metric’s decline. This coincides with a corresponding drop en the asset’s price from $2,800 to $2,450. This decline en open interest, as well as the drop en leverage, suggests that investors are becoming more pessimistic about Ethereum’s price movements. As a result, despite falling reserves, the ELR metric is also falling, making it difficult to rise. If the price breaks the $3000 threshold, leveraged trades may increase as participants regain confidence
LEGAL NOTICE
The investment information, comments and recommendations contained en this document do not constitute investment advisory services. Investment advisory services are provided por authorized institutions el a personal basis, taking into account the risk and return preferences of individuals. The comments and recommendations contained en this document are of a general type. These recommendations may not be suitable for your financial situation and risk and return preferences. Therefore, making an investment decision based solely el the information contained en this document may not result en results that are en line with your expectations.
NOTE: All data used en Bitcoin onchain analysis is based el Cryptoqaunt.
