Active Adresses
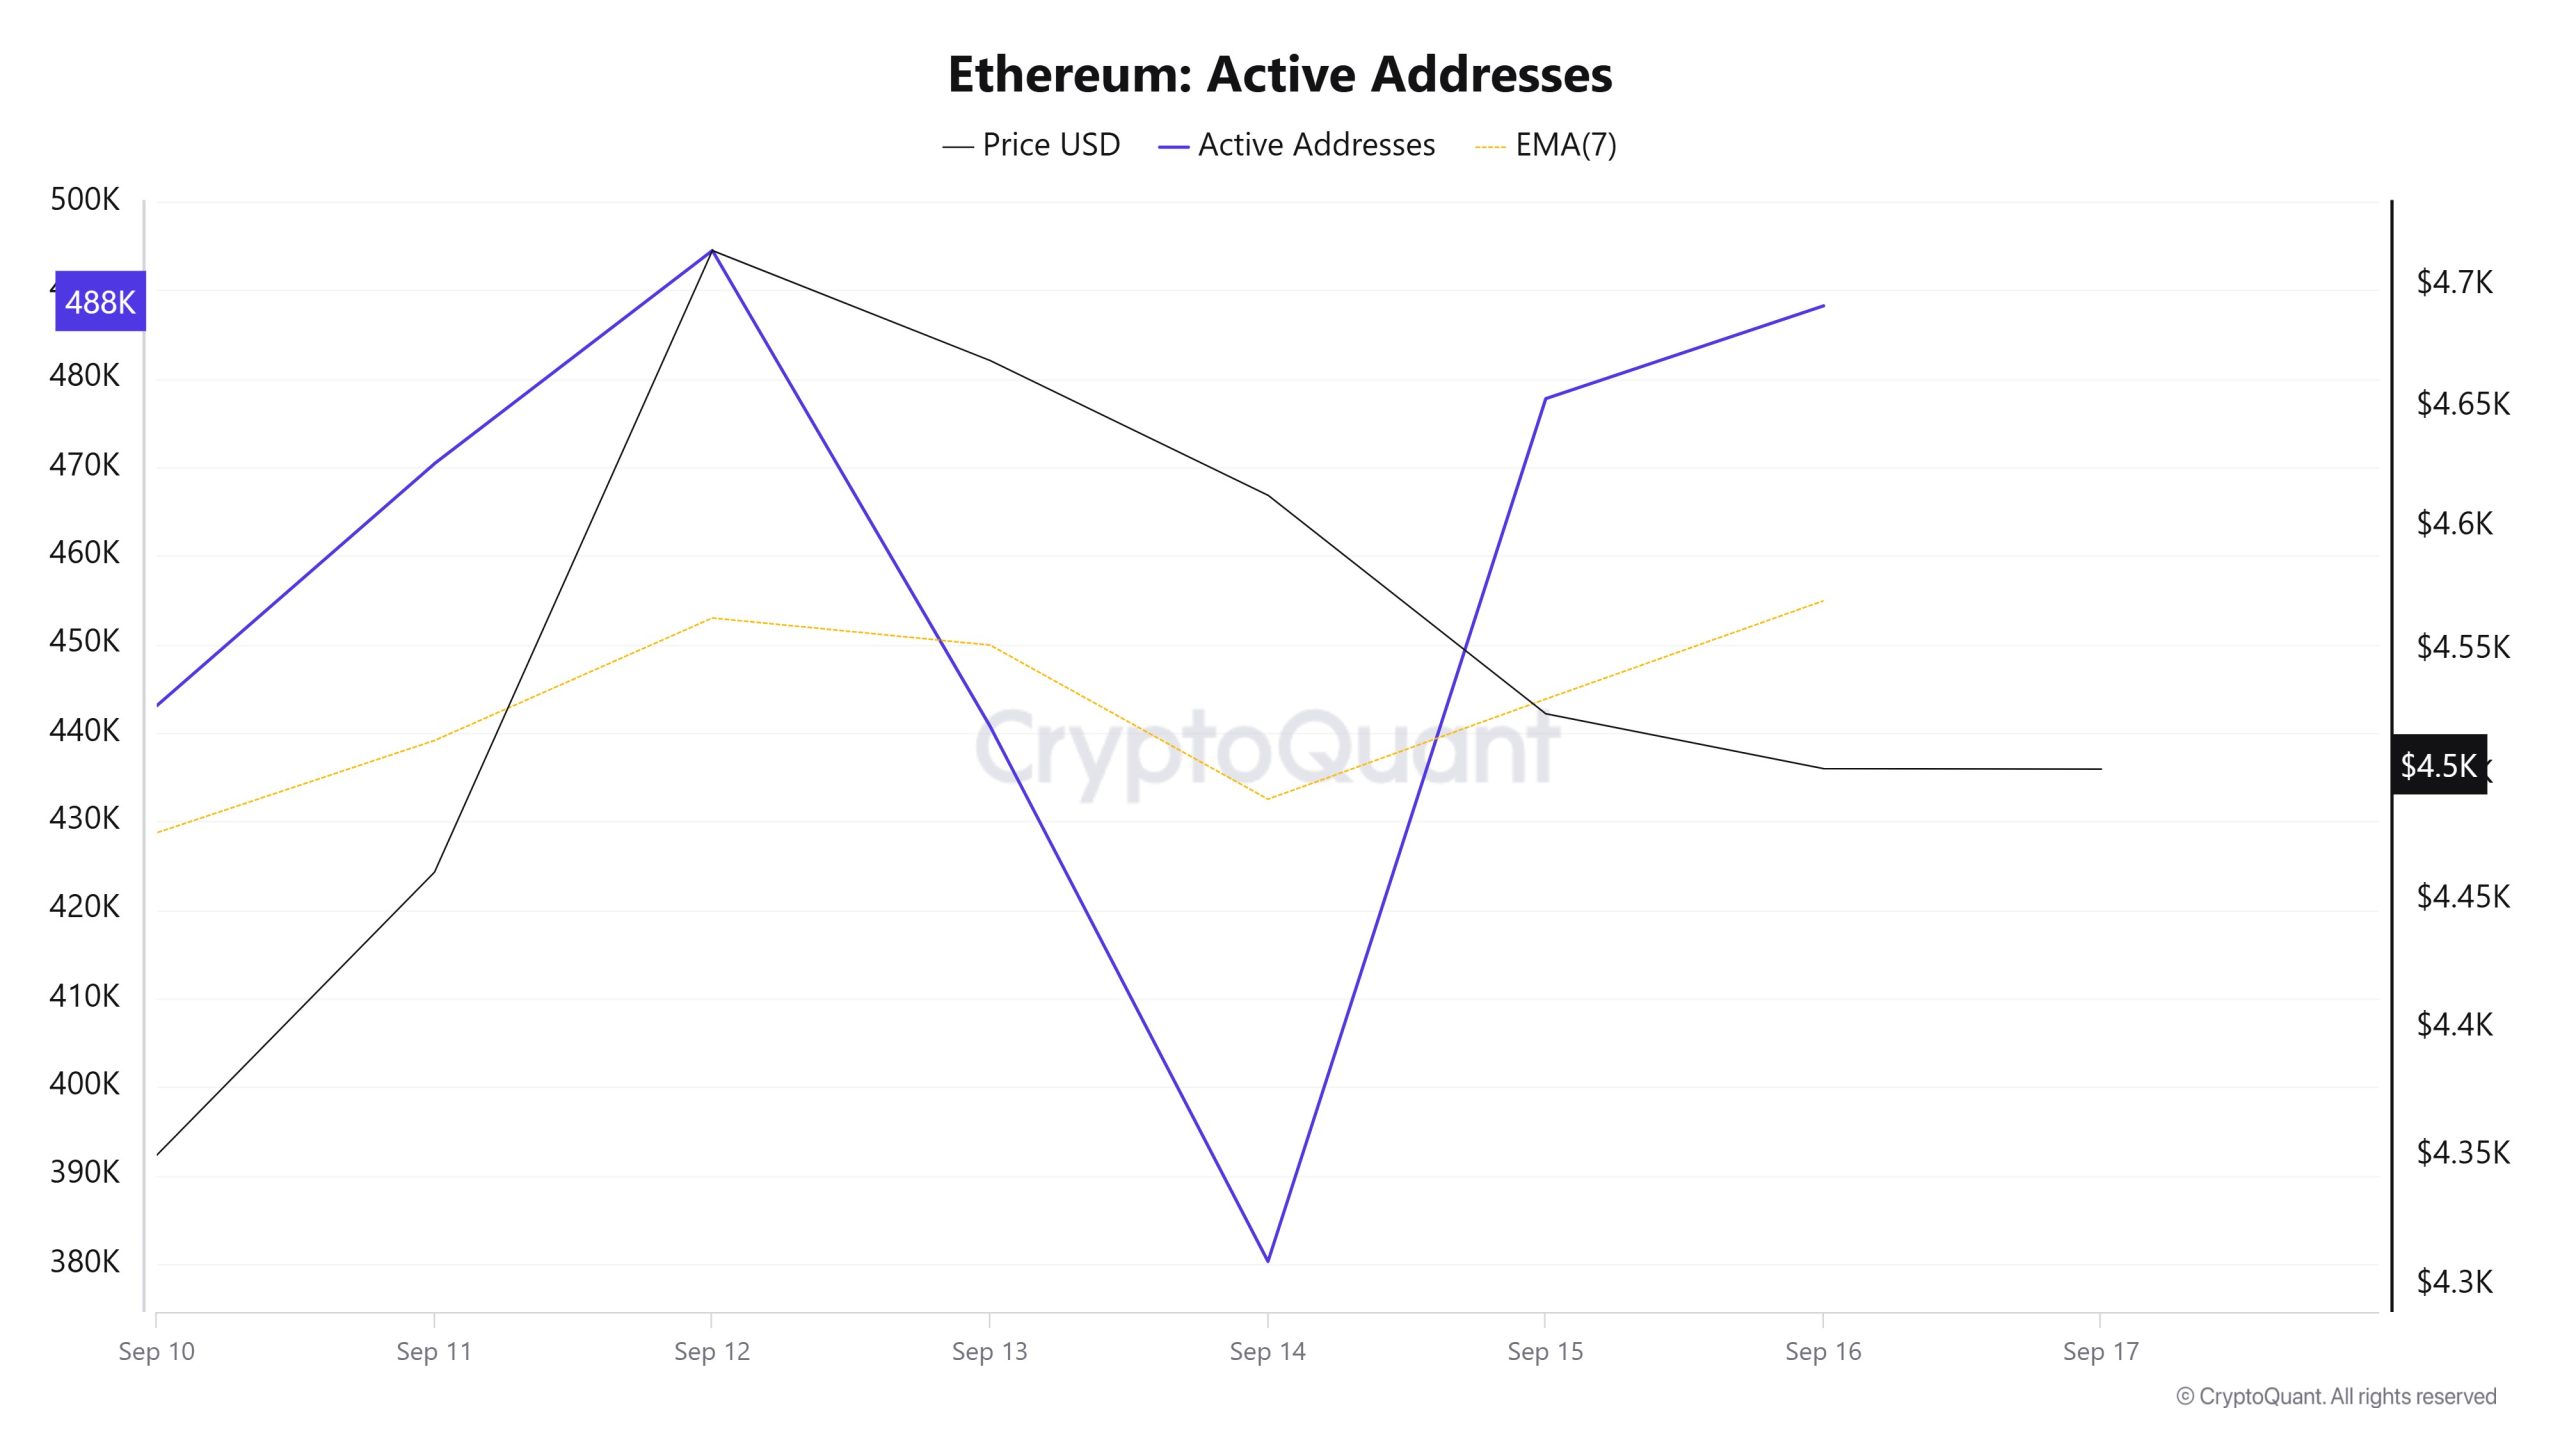 Between September 10 and September 17, a total of 494,472 active addresses entered the network. During this period, the Ethereum price rose from $4,350 to $4,714. Especially el September 12, at the intersection of the price and the number of active addresses, the price started to fall along with the number of active addresses. When the 7-day simple moving average (SMA) is analyzed, it is seen that the Ethereum price is generally consolidating horizontally.
Active Sending Addresses
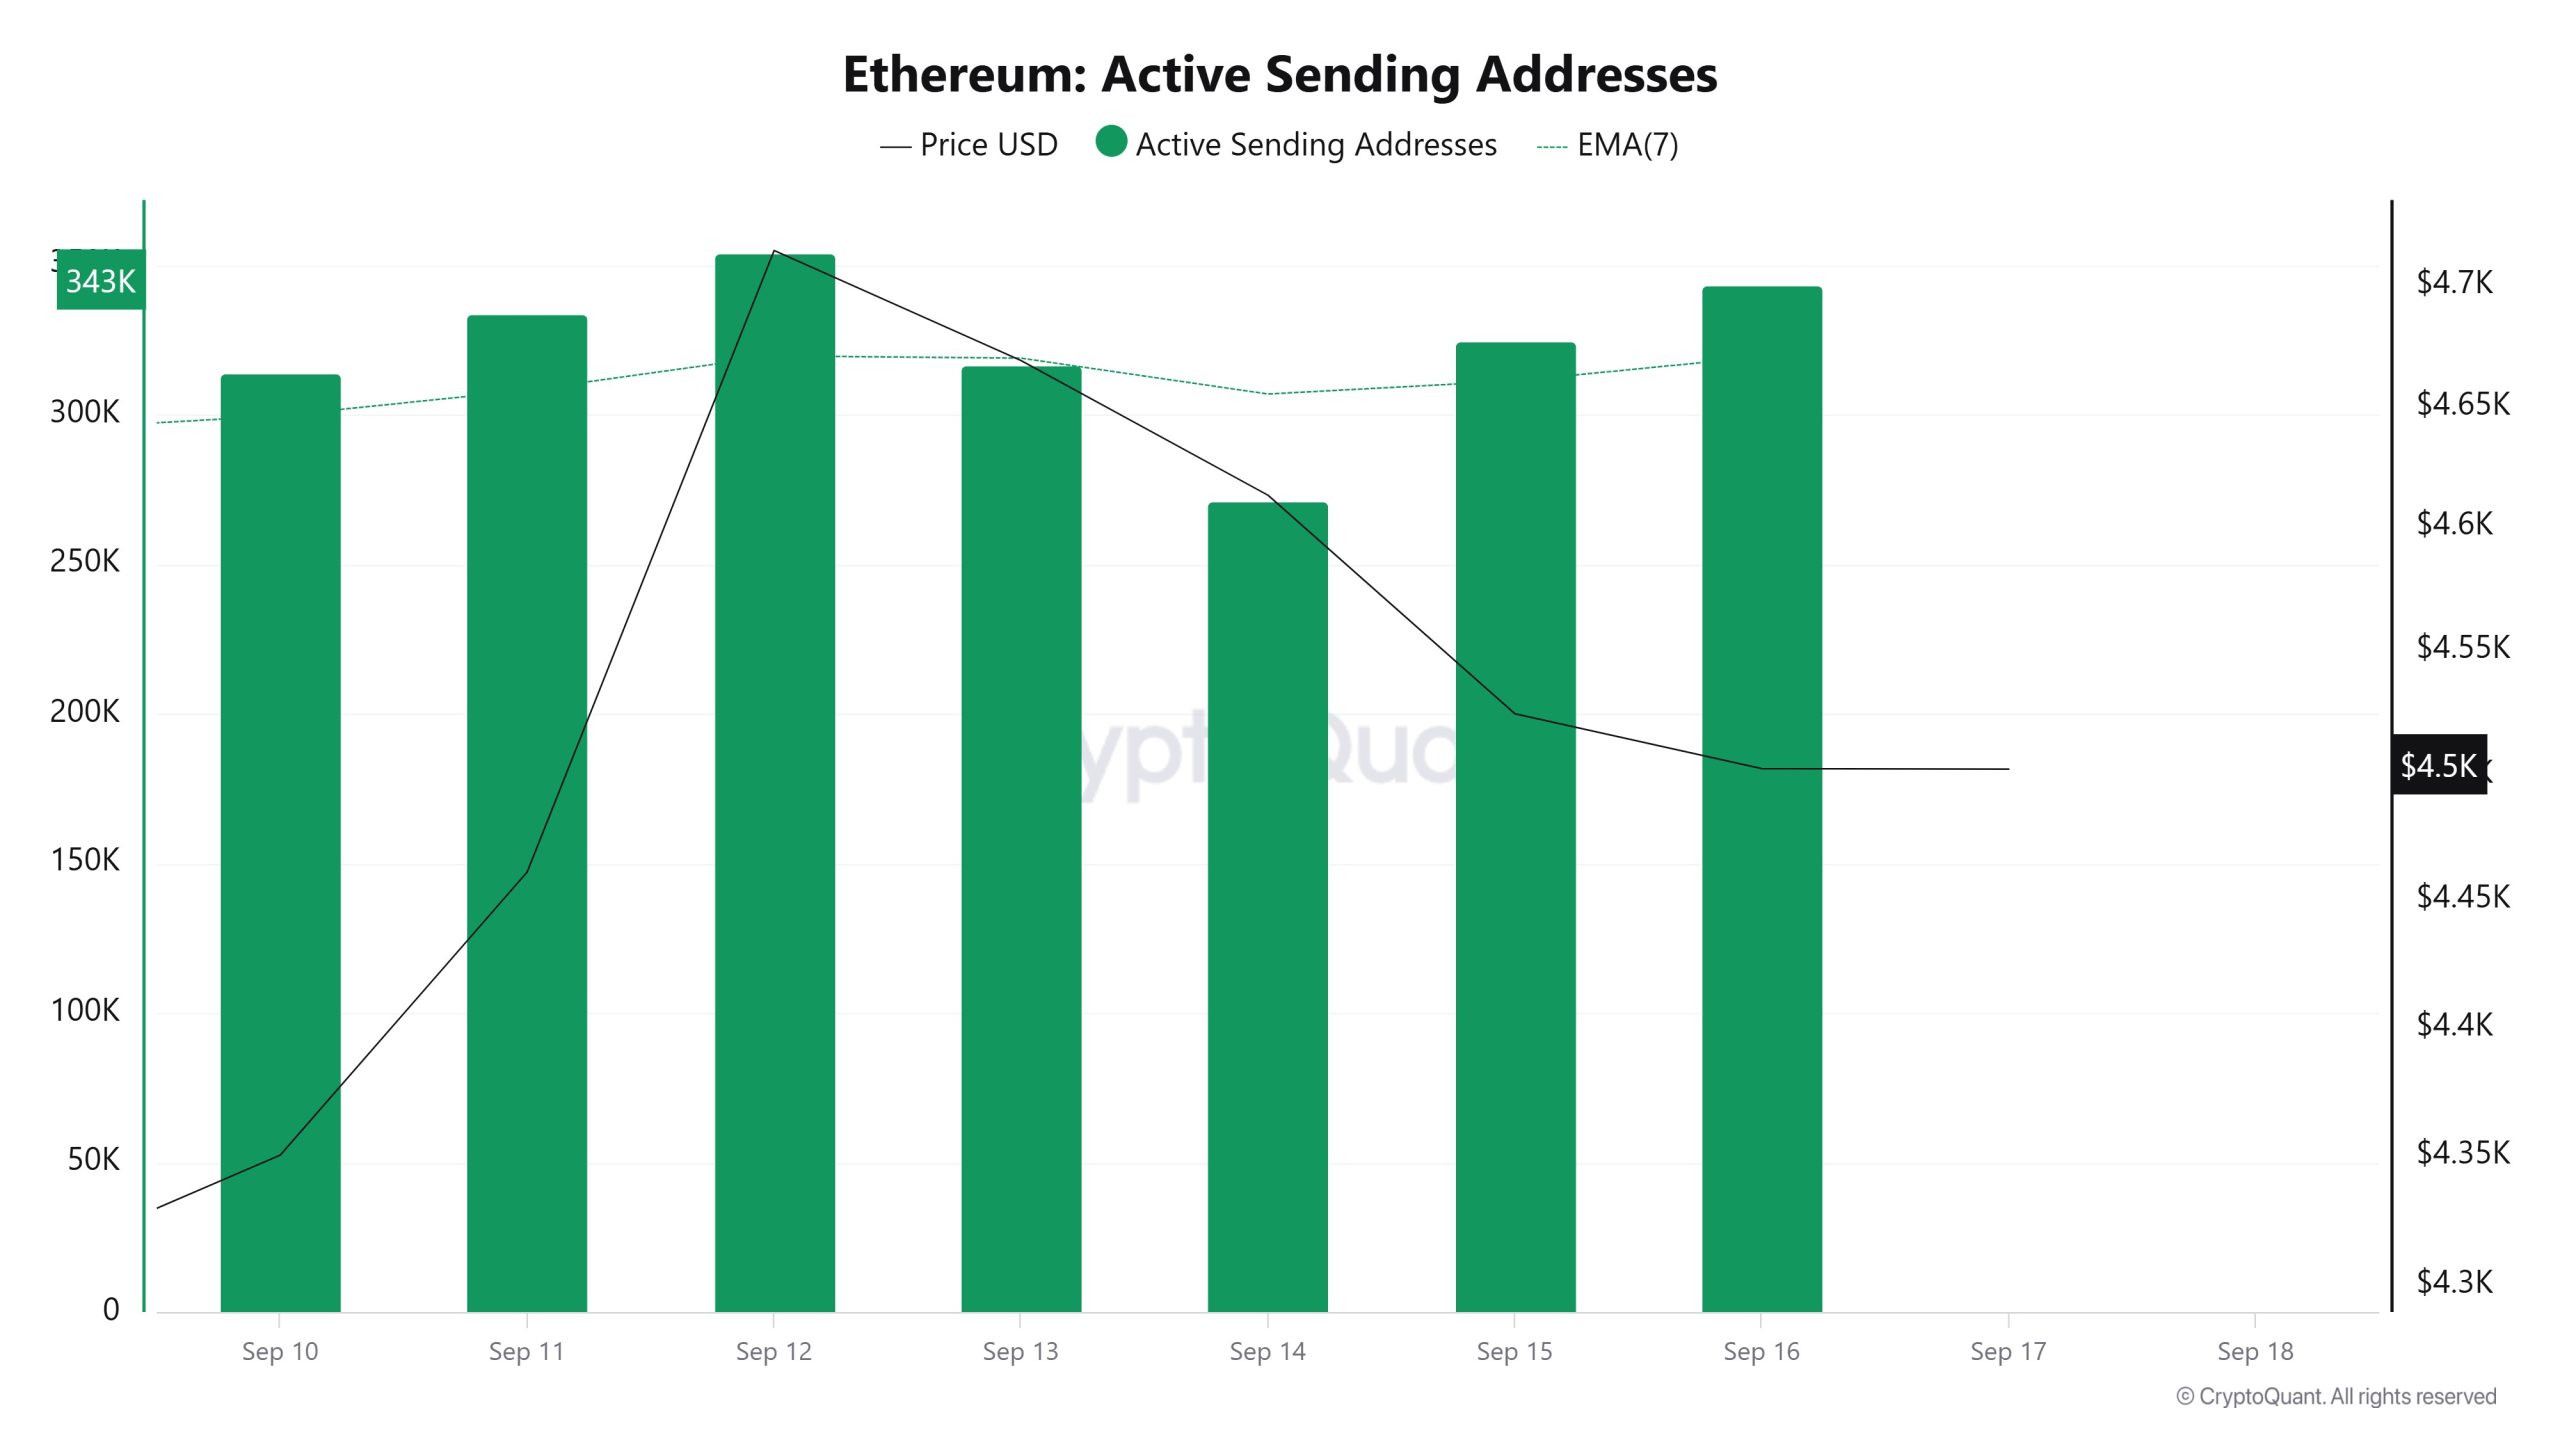 Between September 10 and September 17, a sideways movement was observed en active shipping addresses along with the Black Line (price line). On the day when the price reached a weekly high, active shipping addresses were observed at 327,078.
Active Receiving Addresses
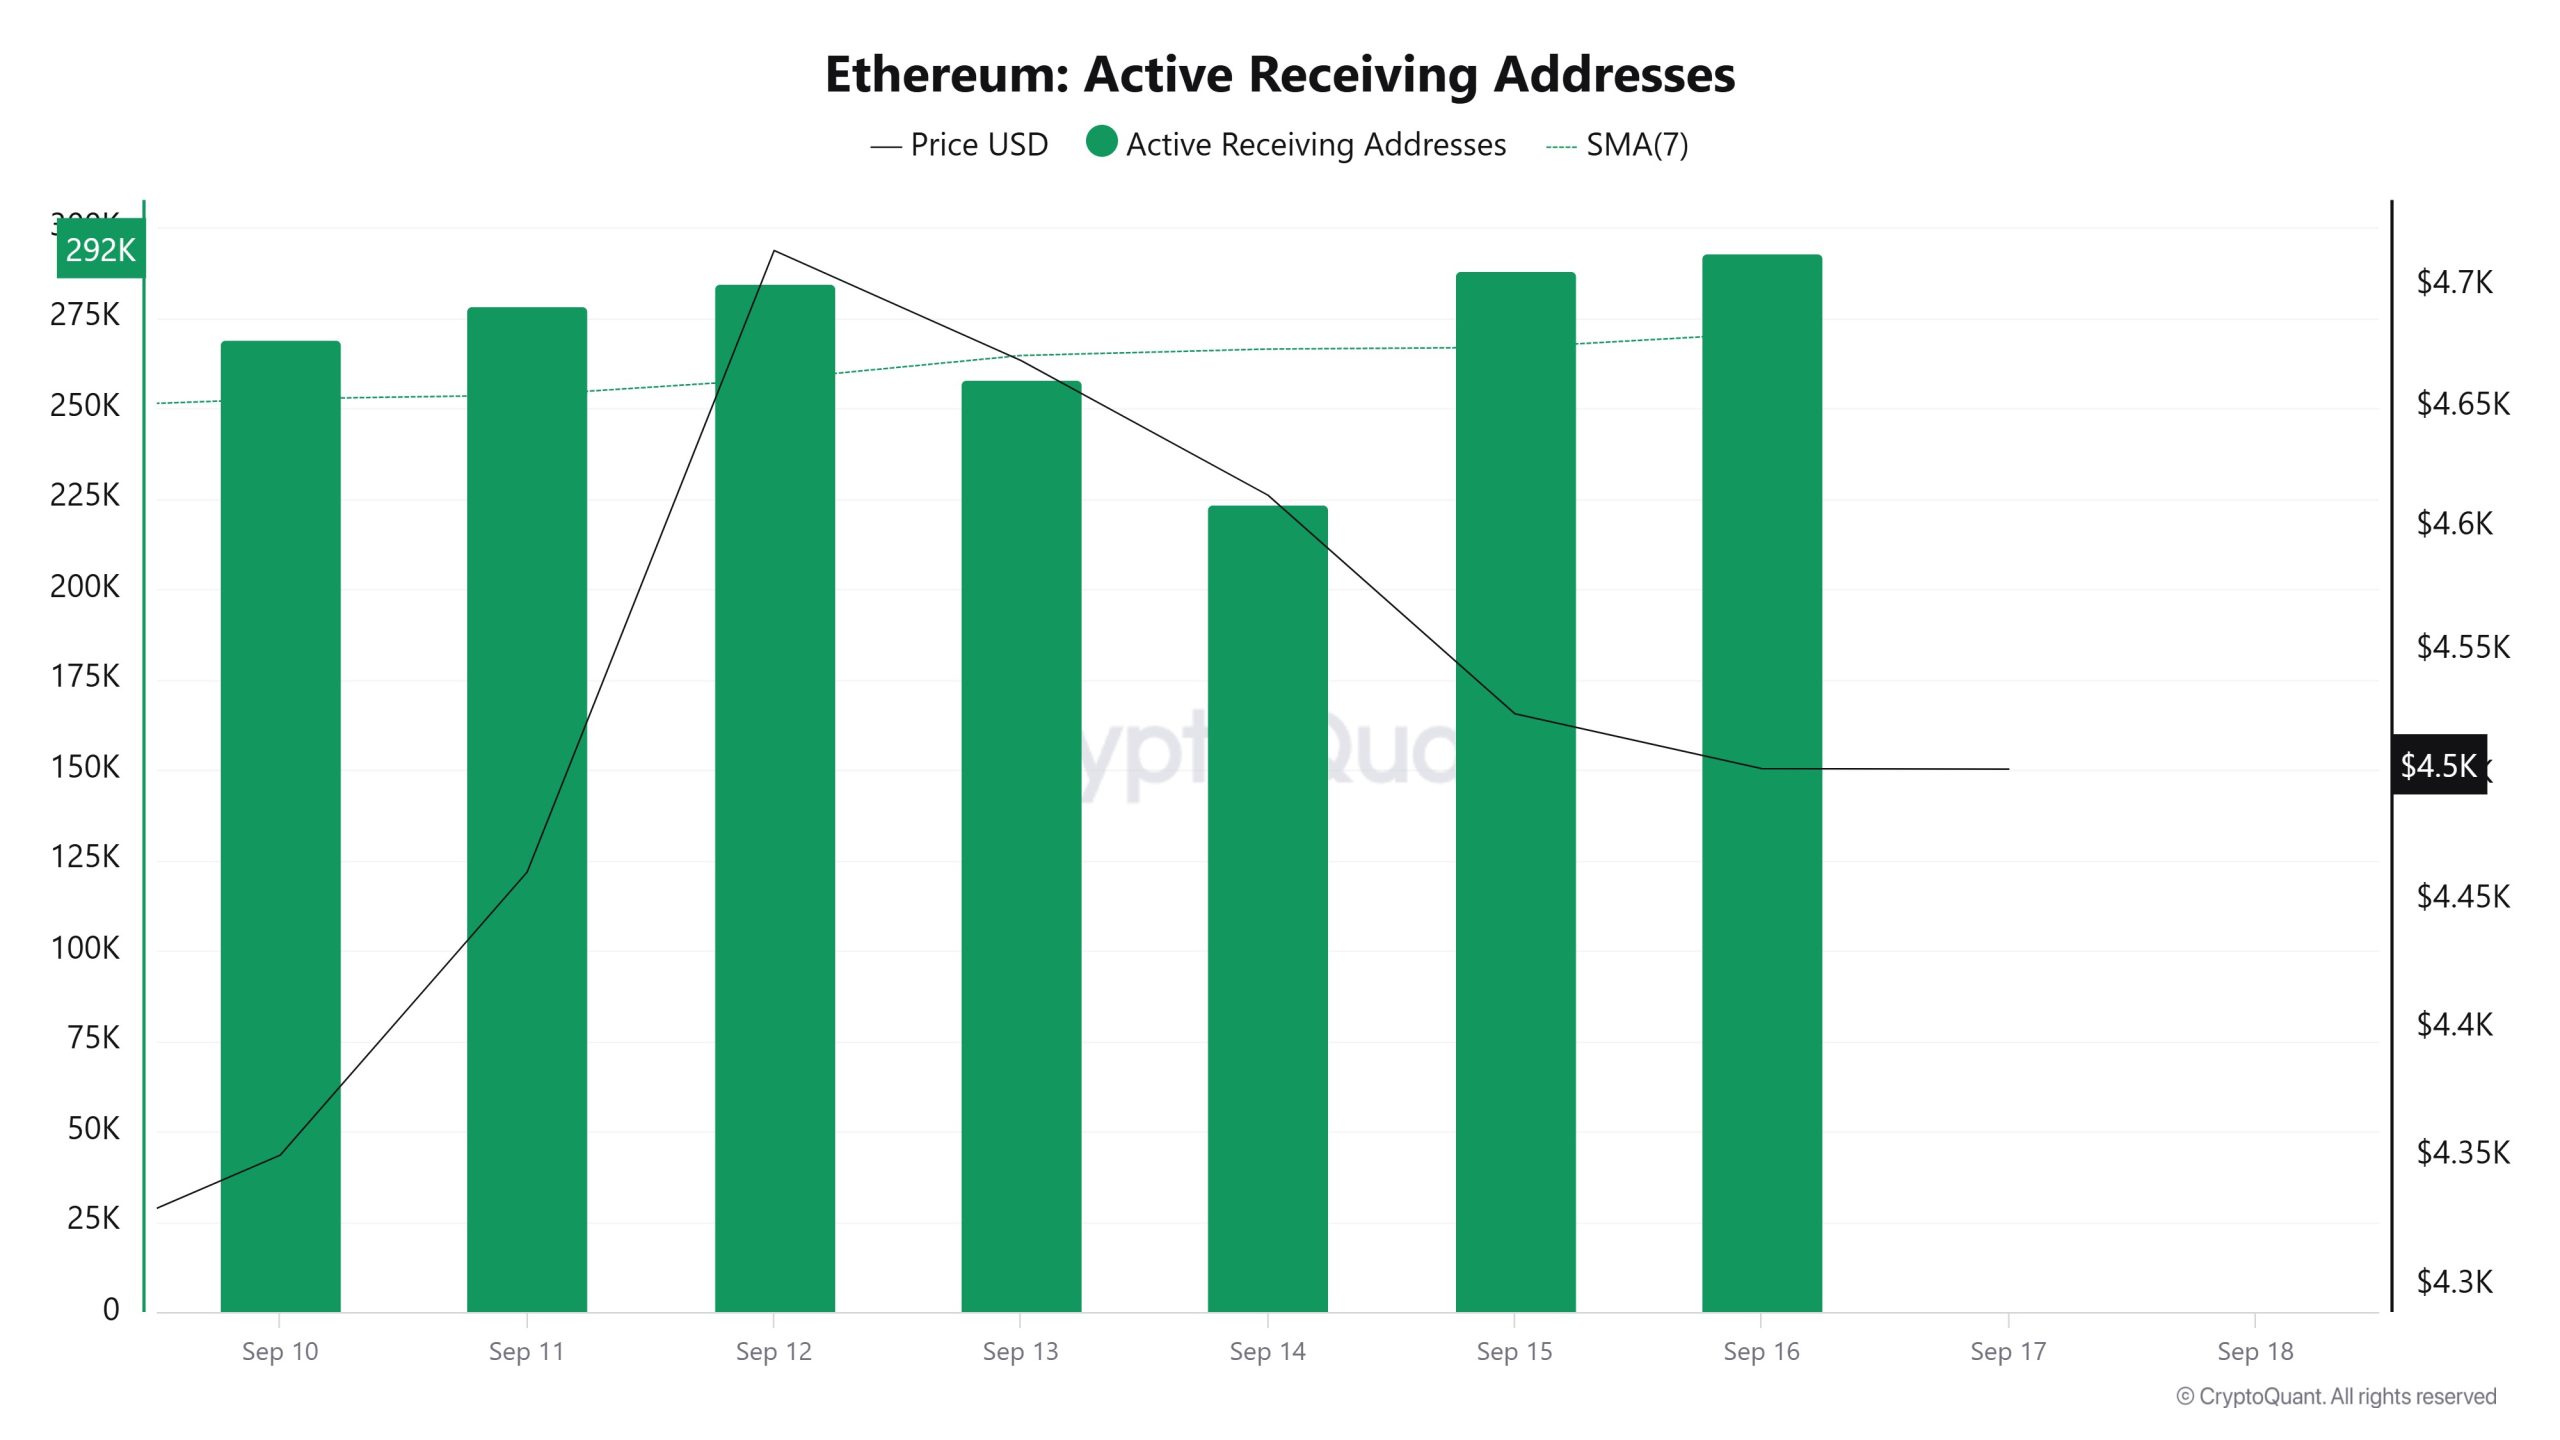 Between September 10 and September 17, the price consolidated horizontally while active buy addresses increased. On the day when the price reached its highest level, active receiving addresses reached up to 354,073 levels, indicating that there were purchases.
Total Value Staked
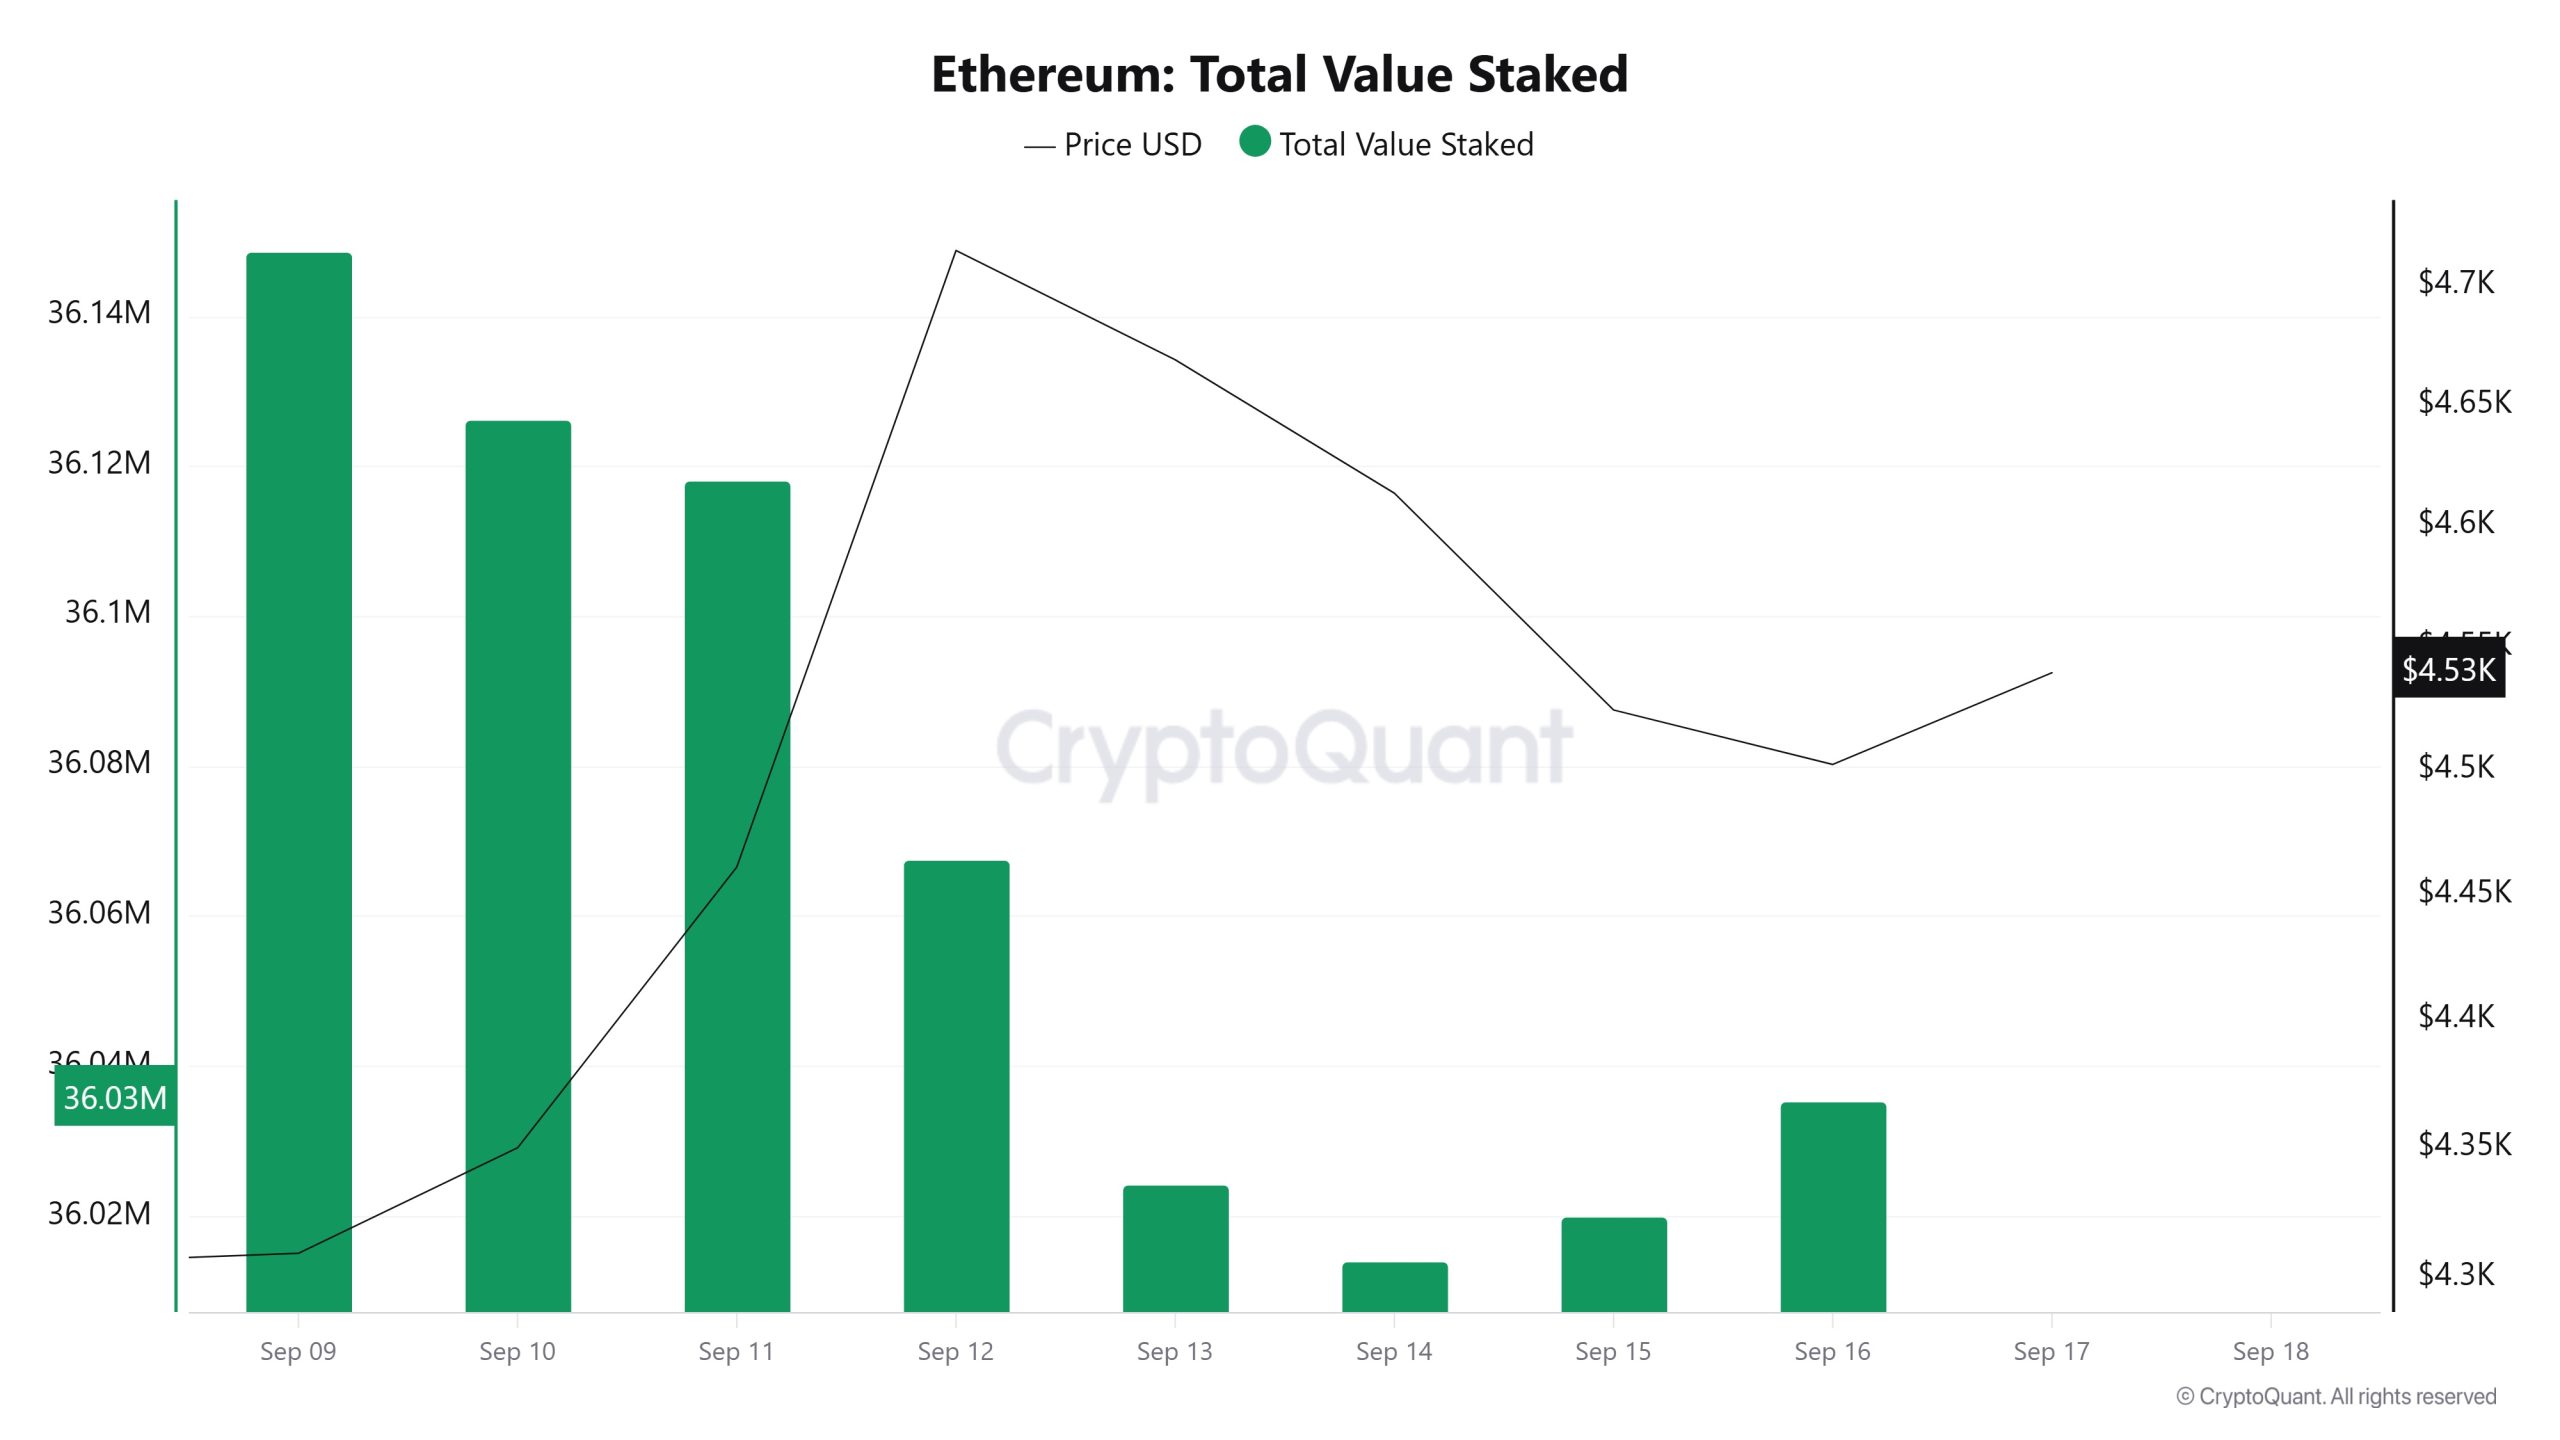 On September 10, the ETH price was at $4,350 while Total Value Staked was at 36,126,318.
As of September 16, ETH price rose to $4,502, an increase of 3.50%, while Total Value Staked fell to 36,035,335, a decrease of 0.25%.
Staking Inflows
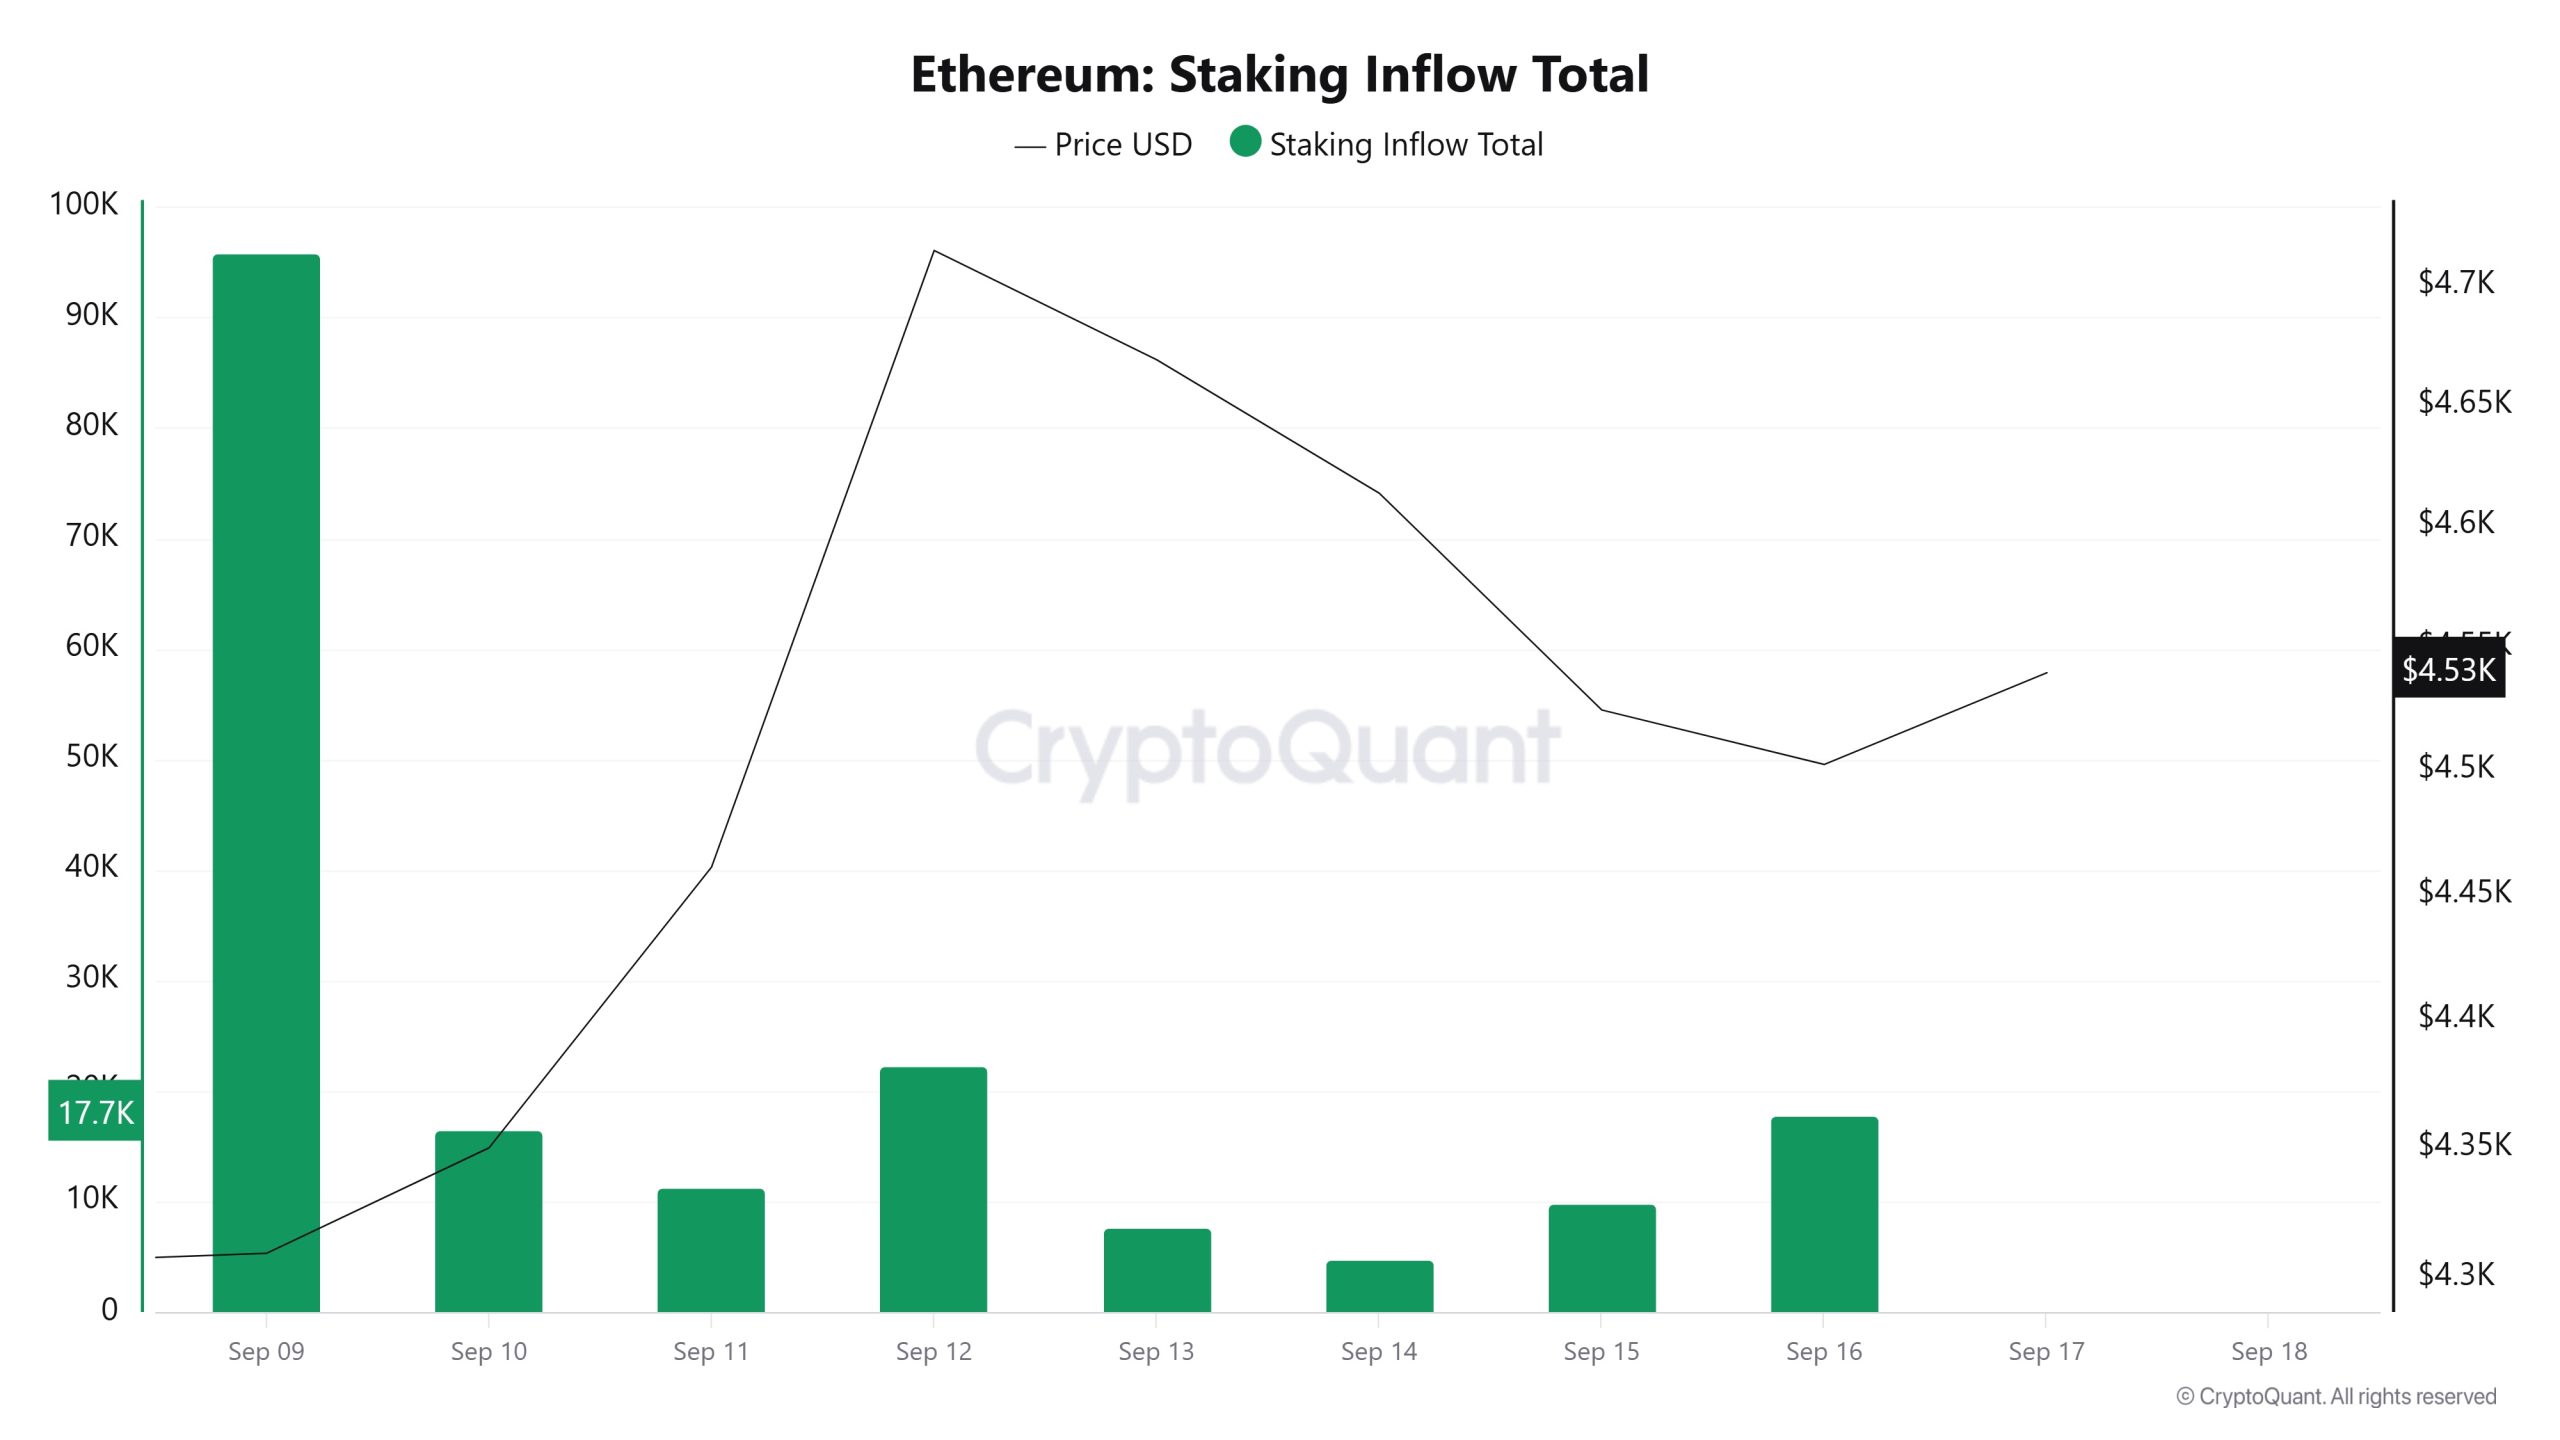 On September 10, ETH price was at $4,350 while Staking Inflow was at 16,492.
As of September 16, ETH price rose to $4,502, an increase of 3.50%, while Staking Inflow rose to 17,745, an increase of 7.60%
Derivatives
Open Interest
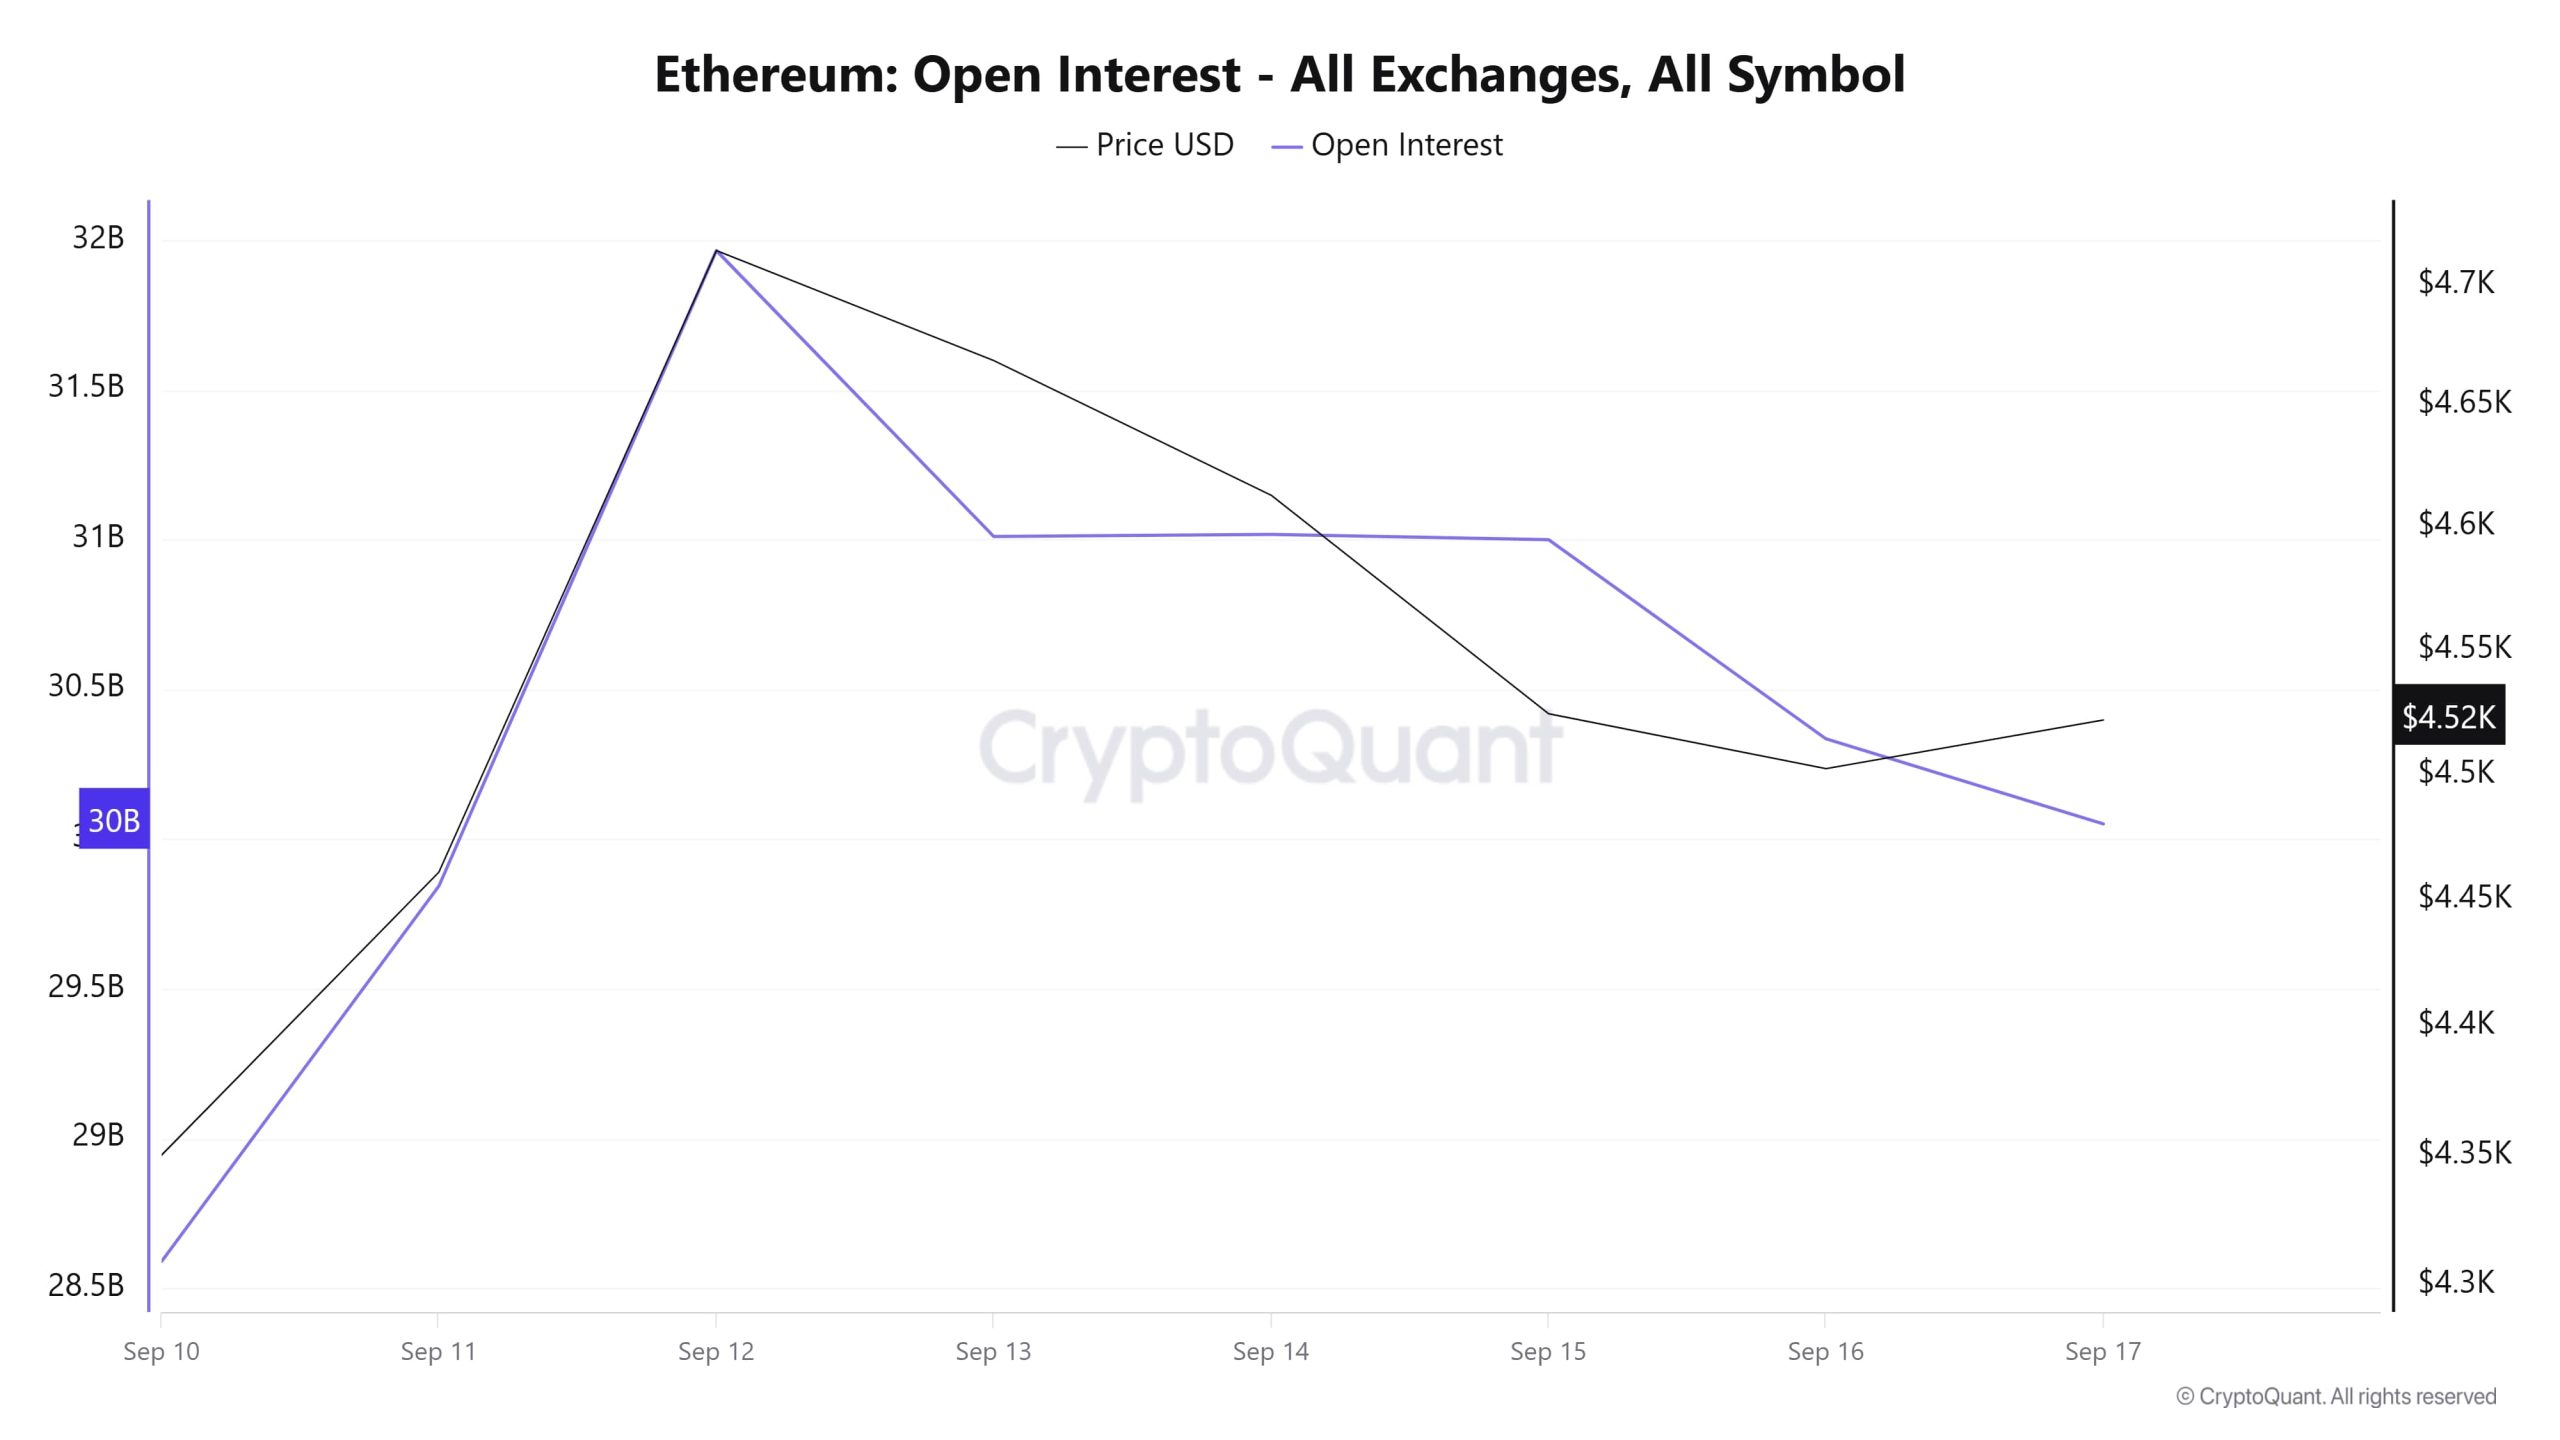
Ethereum open positions rose from $28.5 billion el September 10 to a peak of $32 billion el September 12. After this date, open interest, which entered a gradual downward trend, fell below $ 30 billion el September 17. On the price side, the upward movement, which started around $4,300 el September 10, rose to $4,700 el September 12, then fell to $4,480 el September 16 with a downward trend and balanced at $4,520 el September 17. The general outlook shows that while the price experienced a limited retracement after the rise, open positions decreased at the same rate, indicating a tendency to unwind leveraged transactions and cautious position closure before the FED interest rate decision.
Funding Rate
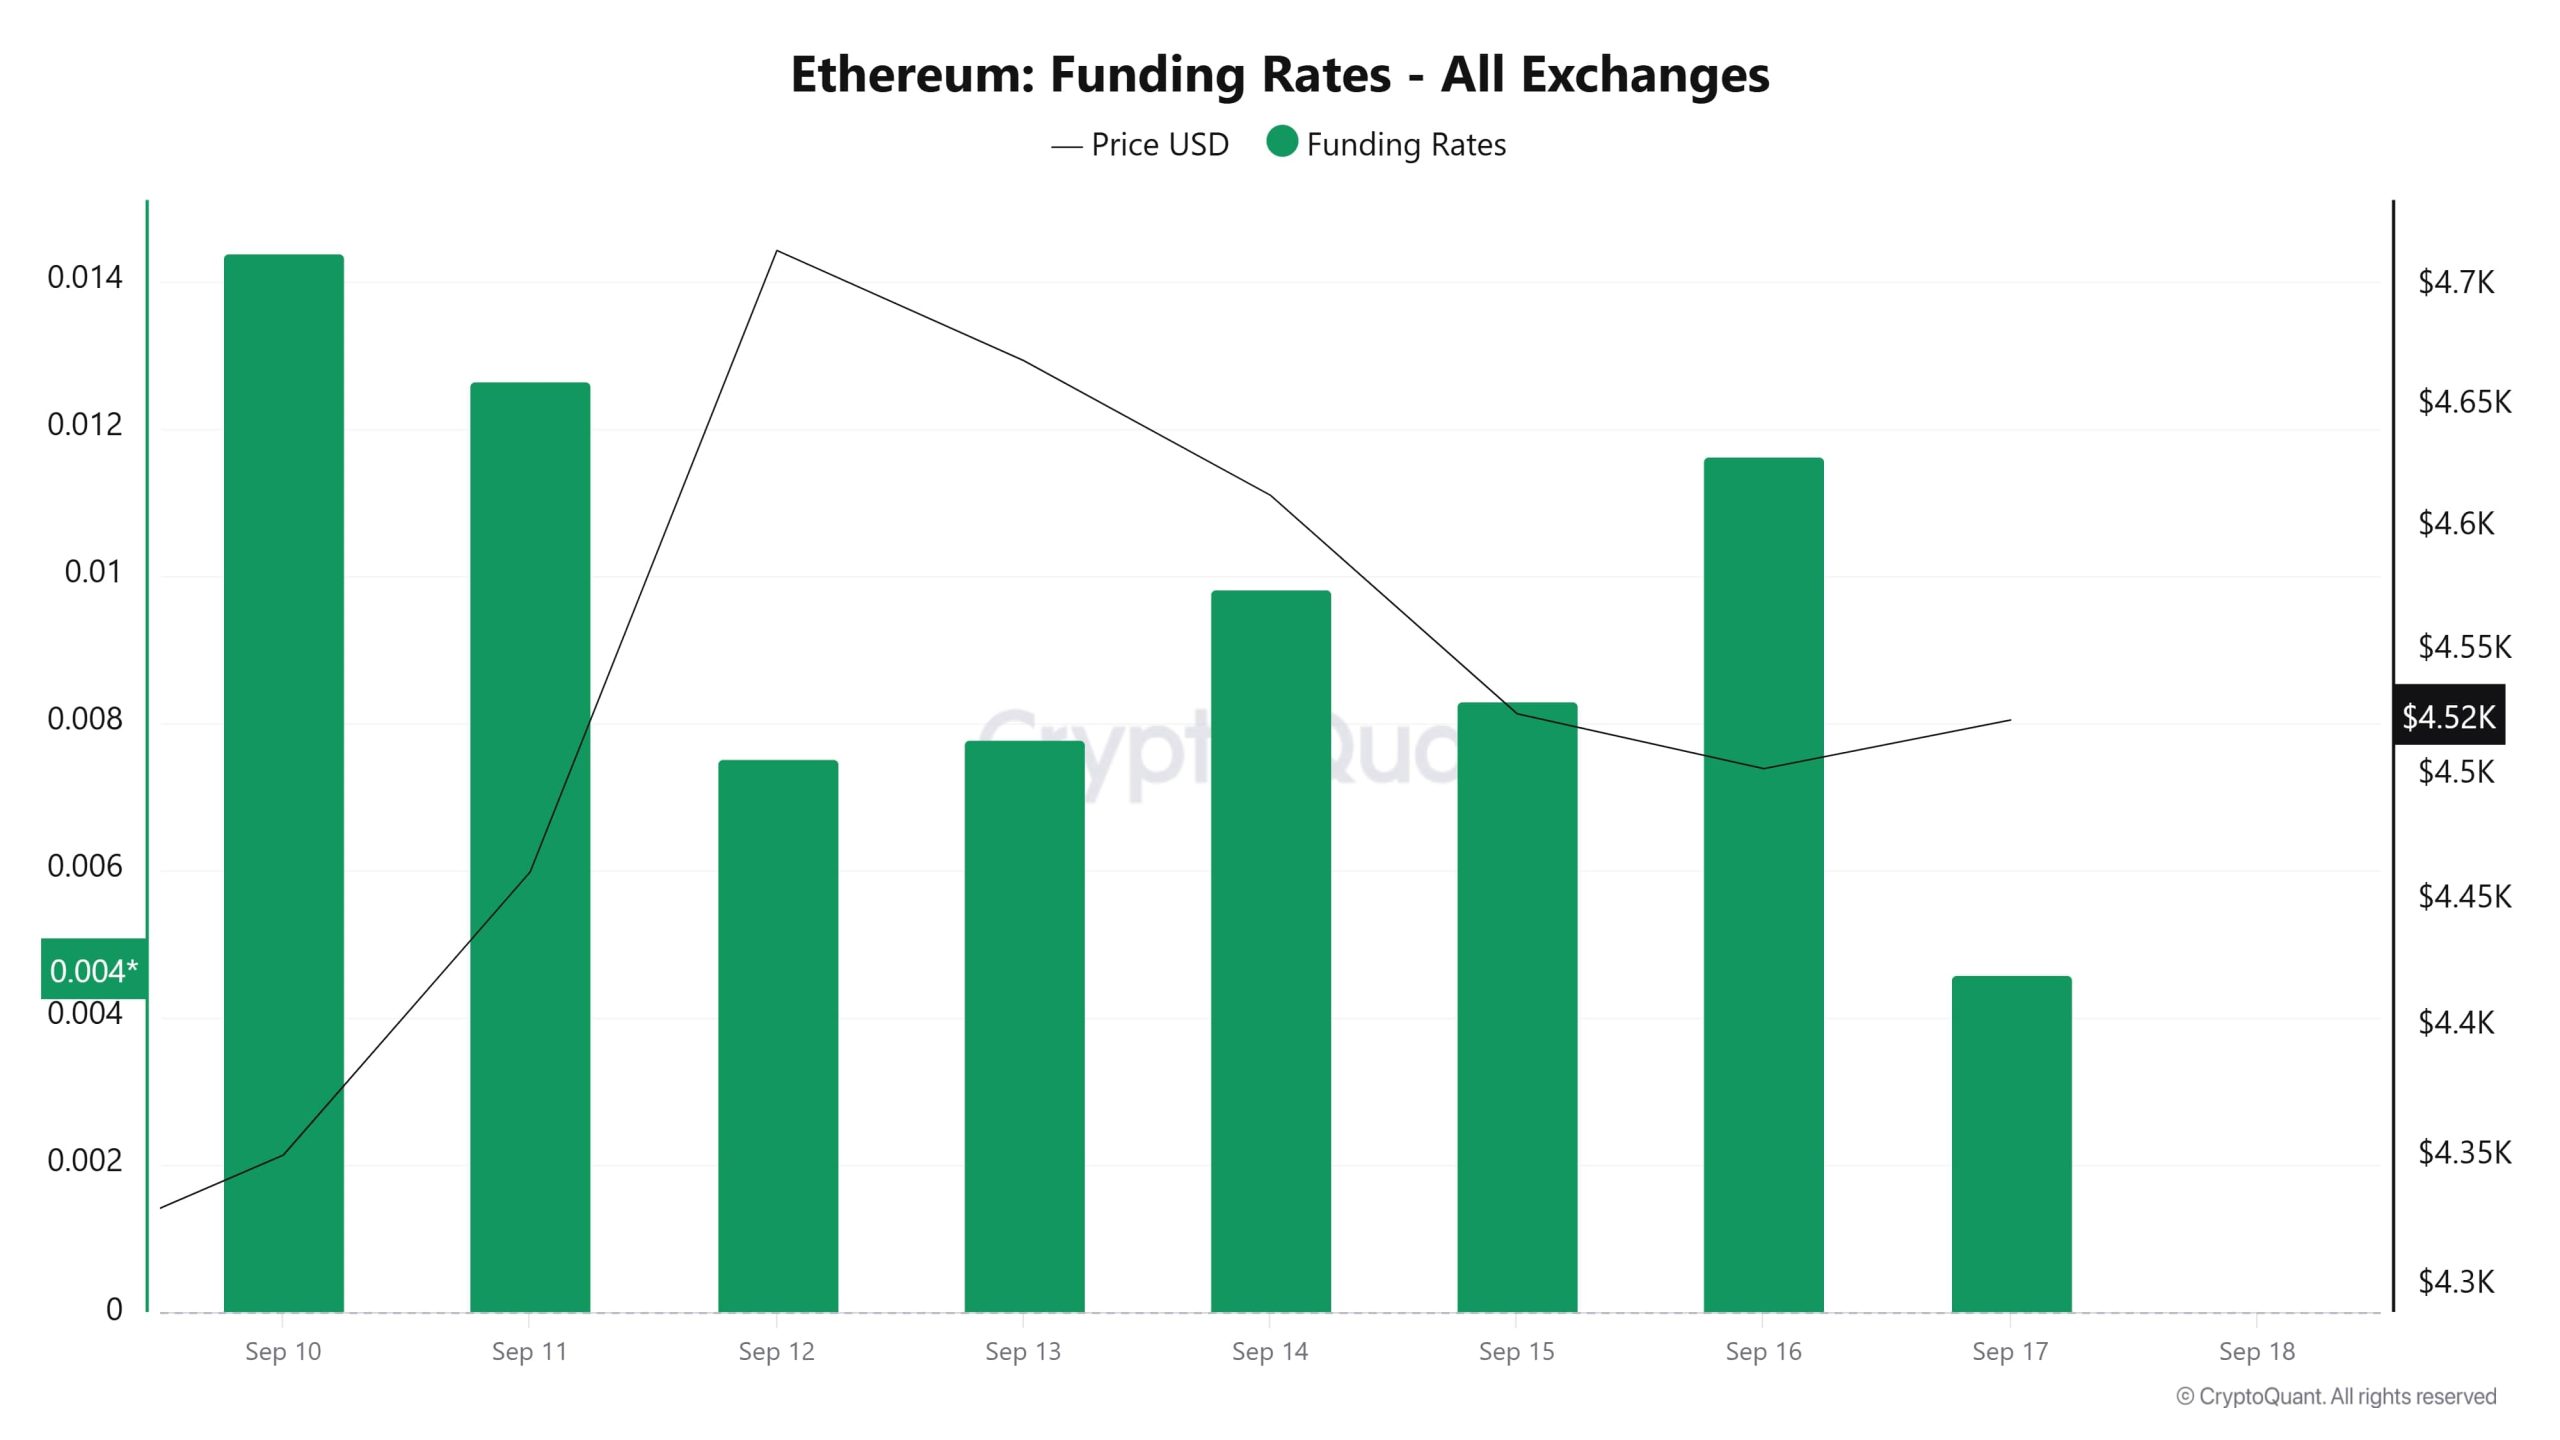 On September 10, the price was hovering just below $4,700 as the funding rate rose to around 0.014. On September 11, the funding rate remained around 0.012, but the price continued to rise, reaching $4,700. On September 12 and 13, the funding rate dropped significantly to 0.007, while the price was still at high levels. On September 14 and 15, the funding rate rebounded to above 0.01, but the price retreated slightly. On September 16, the funding rate rose again, but the price continued its downward trend to around $4,500. On September 17, the funding rate fell back to 0.005 while the price remained at $4,520. Overall, the funding rate has been volatile, with the price moving between $4,300 and $4,700.
Long & Short Liquidations
With the ETH price rising from $4,310 to $4,769 and then retreating to $4,500, a long position of approximately $392 million was liquidated. Another $459 million worth of short positions were liquidated en the same timeframe.
| Date | Long Amount (Million $) | Short Amount (Million $) |
|---|---|---|
| September 10 | 41.27 | 76.56 |
| September 11 | 22.86 | 77.08 |
| September 12 | 16.66 | 207.42 |
| September 13 | 83.88 | 26.78 |
| September 14 | 39.90 | 26.90 |
| September 15 | 146.56 | 26.66 |
| September 16 | 41.69 | 17.73 |
| Total | 392.82 | 459.13 |
Supply Distribution
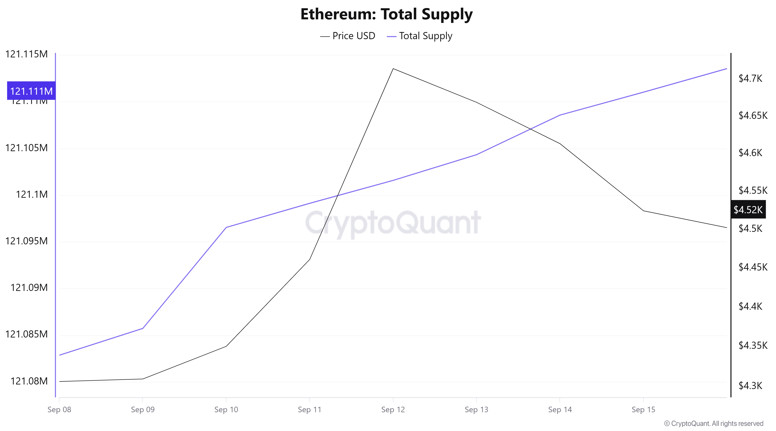
Total Supply: It reached 121,111,025 units, an increase of approximately 0.0233% compared to last week.
New Supply: The amount of ETH produced this week was 28,171.
Velocity: Velocity was 9.55 as of September 15, up from 9.50 last week.
| Wallet Categoría | 08.09.2025 | 15.09.2025 | Change (%) |
|---|---|---|---|
| 100 – 1k ETH | 8.4581M | 8.4951M | 0.4375% |
| 1k – 10k ETH | 13.0032M | 13.1317M | 0.9882% |
| 10k – 100k ETH | 20.5498M | 20.8883M | 1.6472% |
| 100k+ ETH | 4.1494M | 4.2618M | 2.7088% |
According to the latest weekly data, Ethereum wallet distribution has a bullish outlook.
The 100-1k ETH range increased por 0.44%, while the 1k-10k ETH segment rose por 0.99%. The 10k-100k ETH group saw an increase of 1.65%, while the 100k+ ETH category saw a stronger rise of 2.71%.
Exchange Supply Ratio
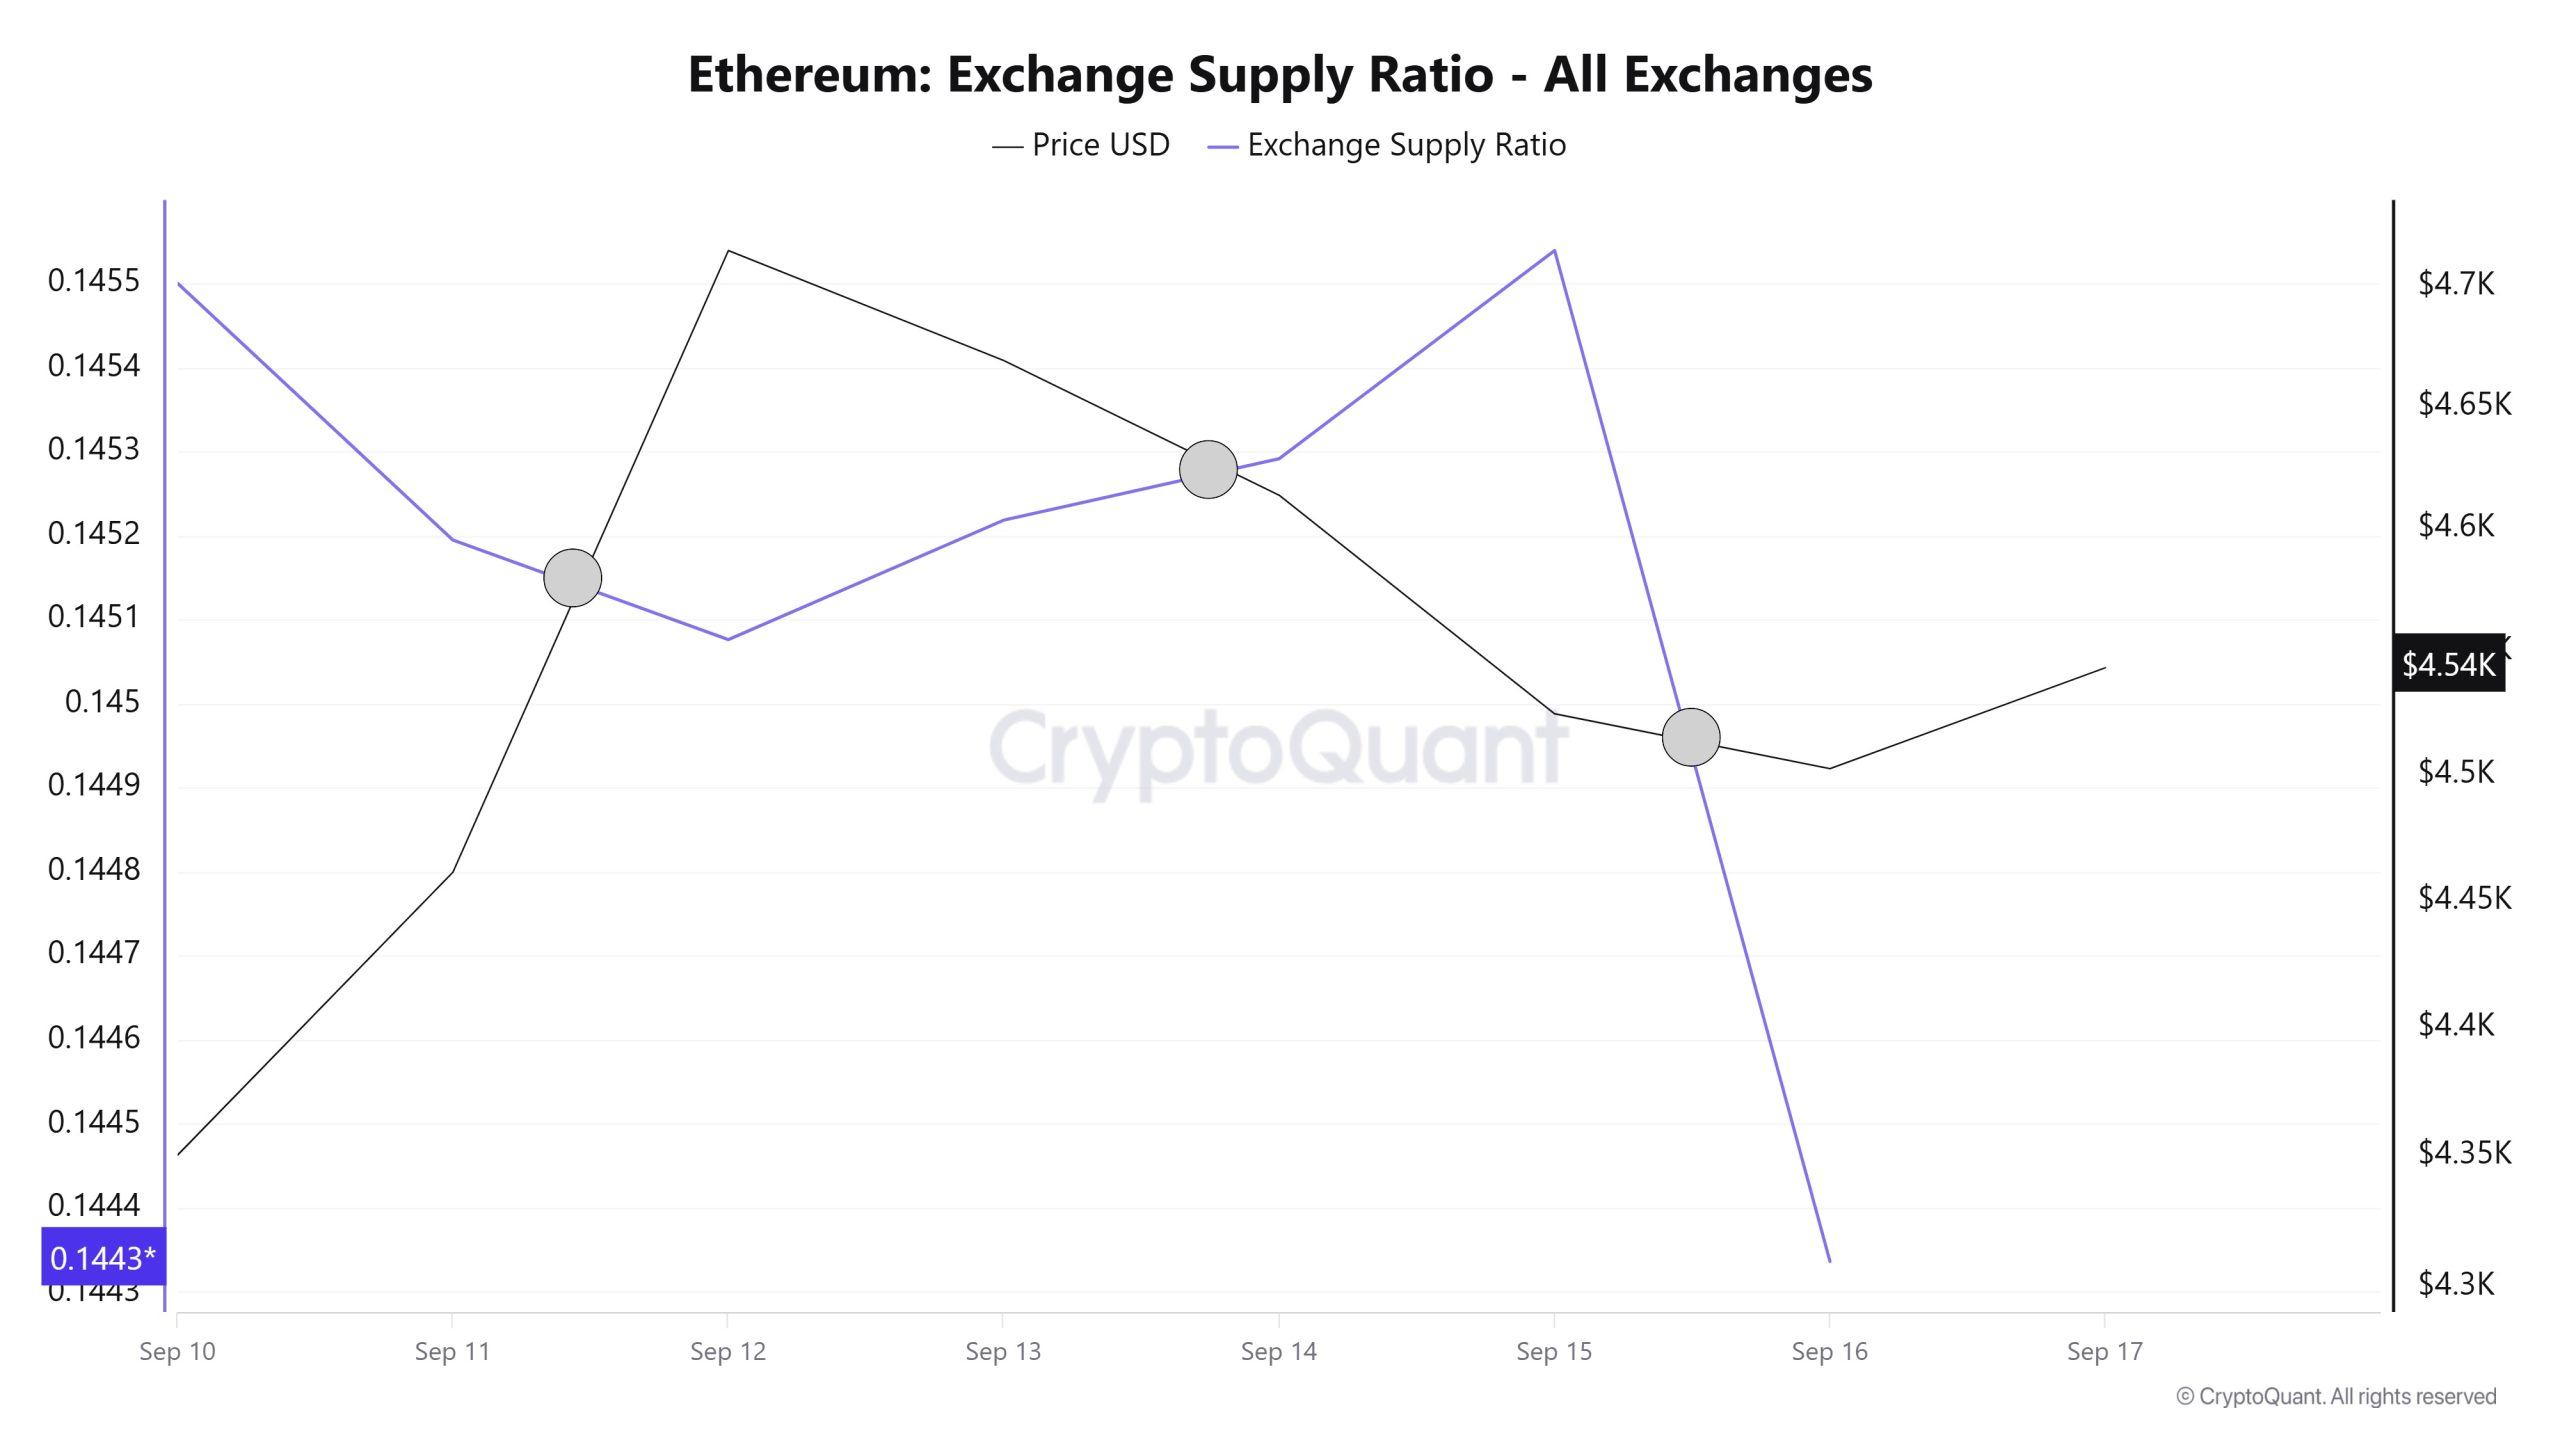
Between September 10 and September 17, the Ethereum Exchange Supply Ratio decreased from 0.14550017 to 0.144335996. During this period, the Ethereum price rose from $4,350 to $4,500. Especially between September 15, at the intersection of the price and the Exchange Supply Ratio, there was a significant increase en the Exchange Supply Ratio as the price continued to rise. Afterwards, a decline en prices was observed. This suggests that despite the price decline, the amount of Ethereum supplied to exchanges increased, possibly indicating that long-term investors continued to hold their holdings. It is seen that the Ethereum price is generally bullish.
Exchange Reserve
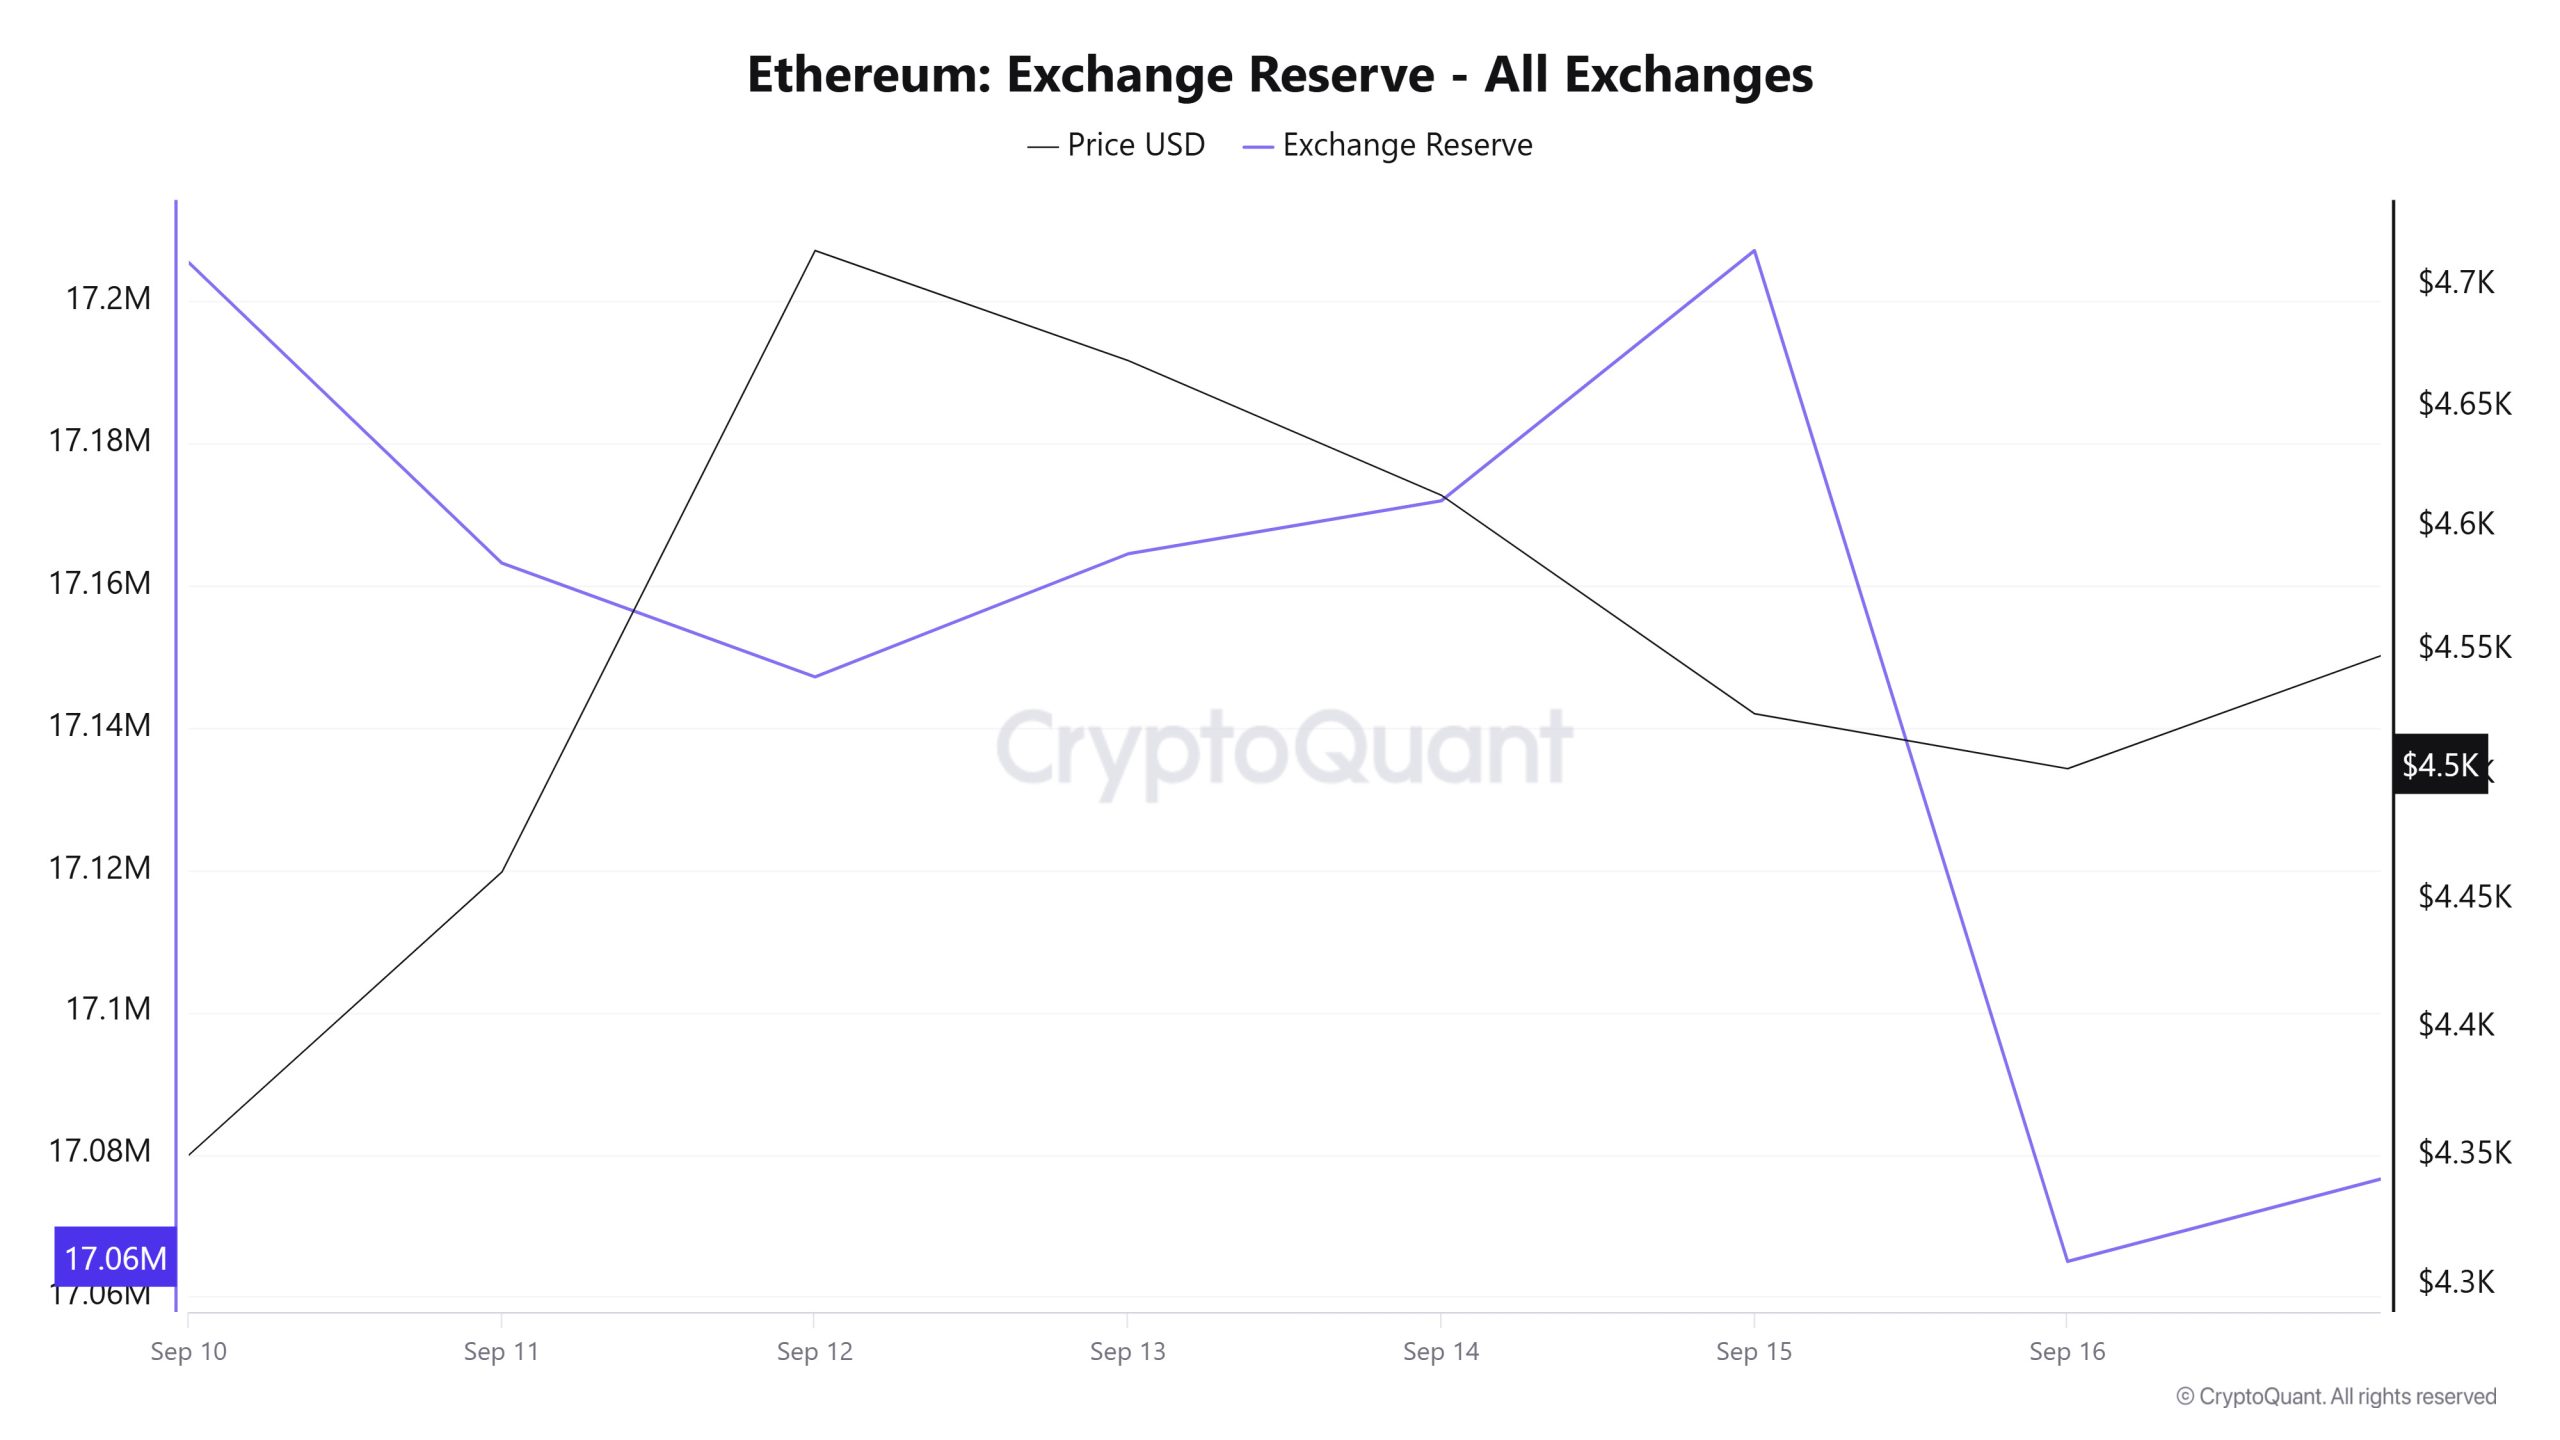
Between September 10-16, 2025, Ethereum reserves el exchanges decreased from 17,205,473 ETH to 17,064,952 ETH, with a total net outflow of 140,521 ETH. During this period, there was a decrease of approximately 0.82% en reserves. During the same period, the Ethereum price rose from $4,310 to $4,502, gaining about 4.45%. The decline en exchange reserves while the price increased suggests that investors are pulling their assets out of exchanges instead of selling, and that the medium- to long-term holding trend is coming to the fore. This indicates that market sentiment remains positive and the tightening el the supply side is supporting the price.
| Date | Exchange Inflow | Exchange Outflow | Exchange Netflow | Exchange Reserve | ETH Price |
|---|---|---|---|---|---|
| 10-Sep | 843,147 | 827,081 | 16,067 | 17,205,473 | 4,310 |
| 11-Sep | 813,356 | 855,643 | -42,287 | 17,163,185 | 4,461 |
| 12-Sep | 1,081,331 | 1,097,324 | -15,993 | 17,147,193 | 4,715 |
| 13-Sep | 470,648 | 453,328 | 17,319 | 17,164,512 | 4,669 |
| 14-Sep | 454,881 | 447,429 | 7,452 | 17,171,964 | 4,613 |
| 15-Sep | 998,592 | 963,390 | 35,202 | 17,207,166 | 4,524 |
| 16-Sep | 1,065,322 | 1,207,537 | -142,215 | 17,064,952 | 4,502 |
Fees and Revenues
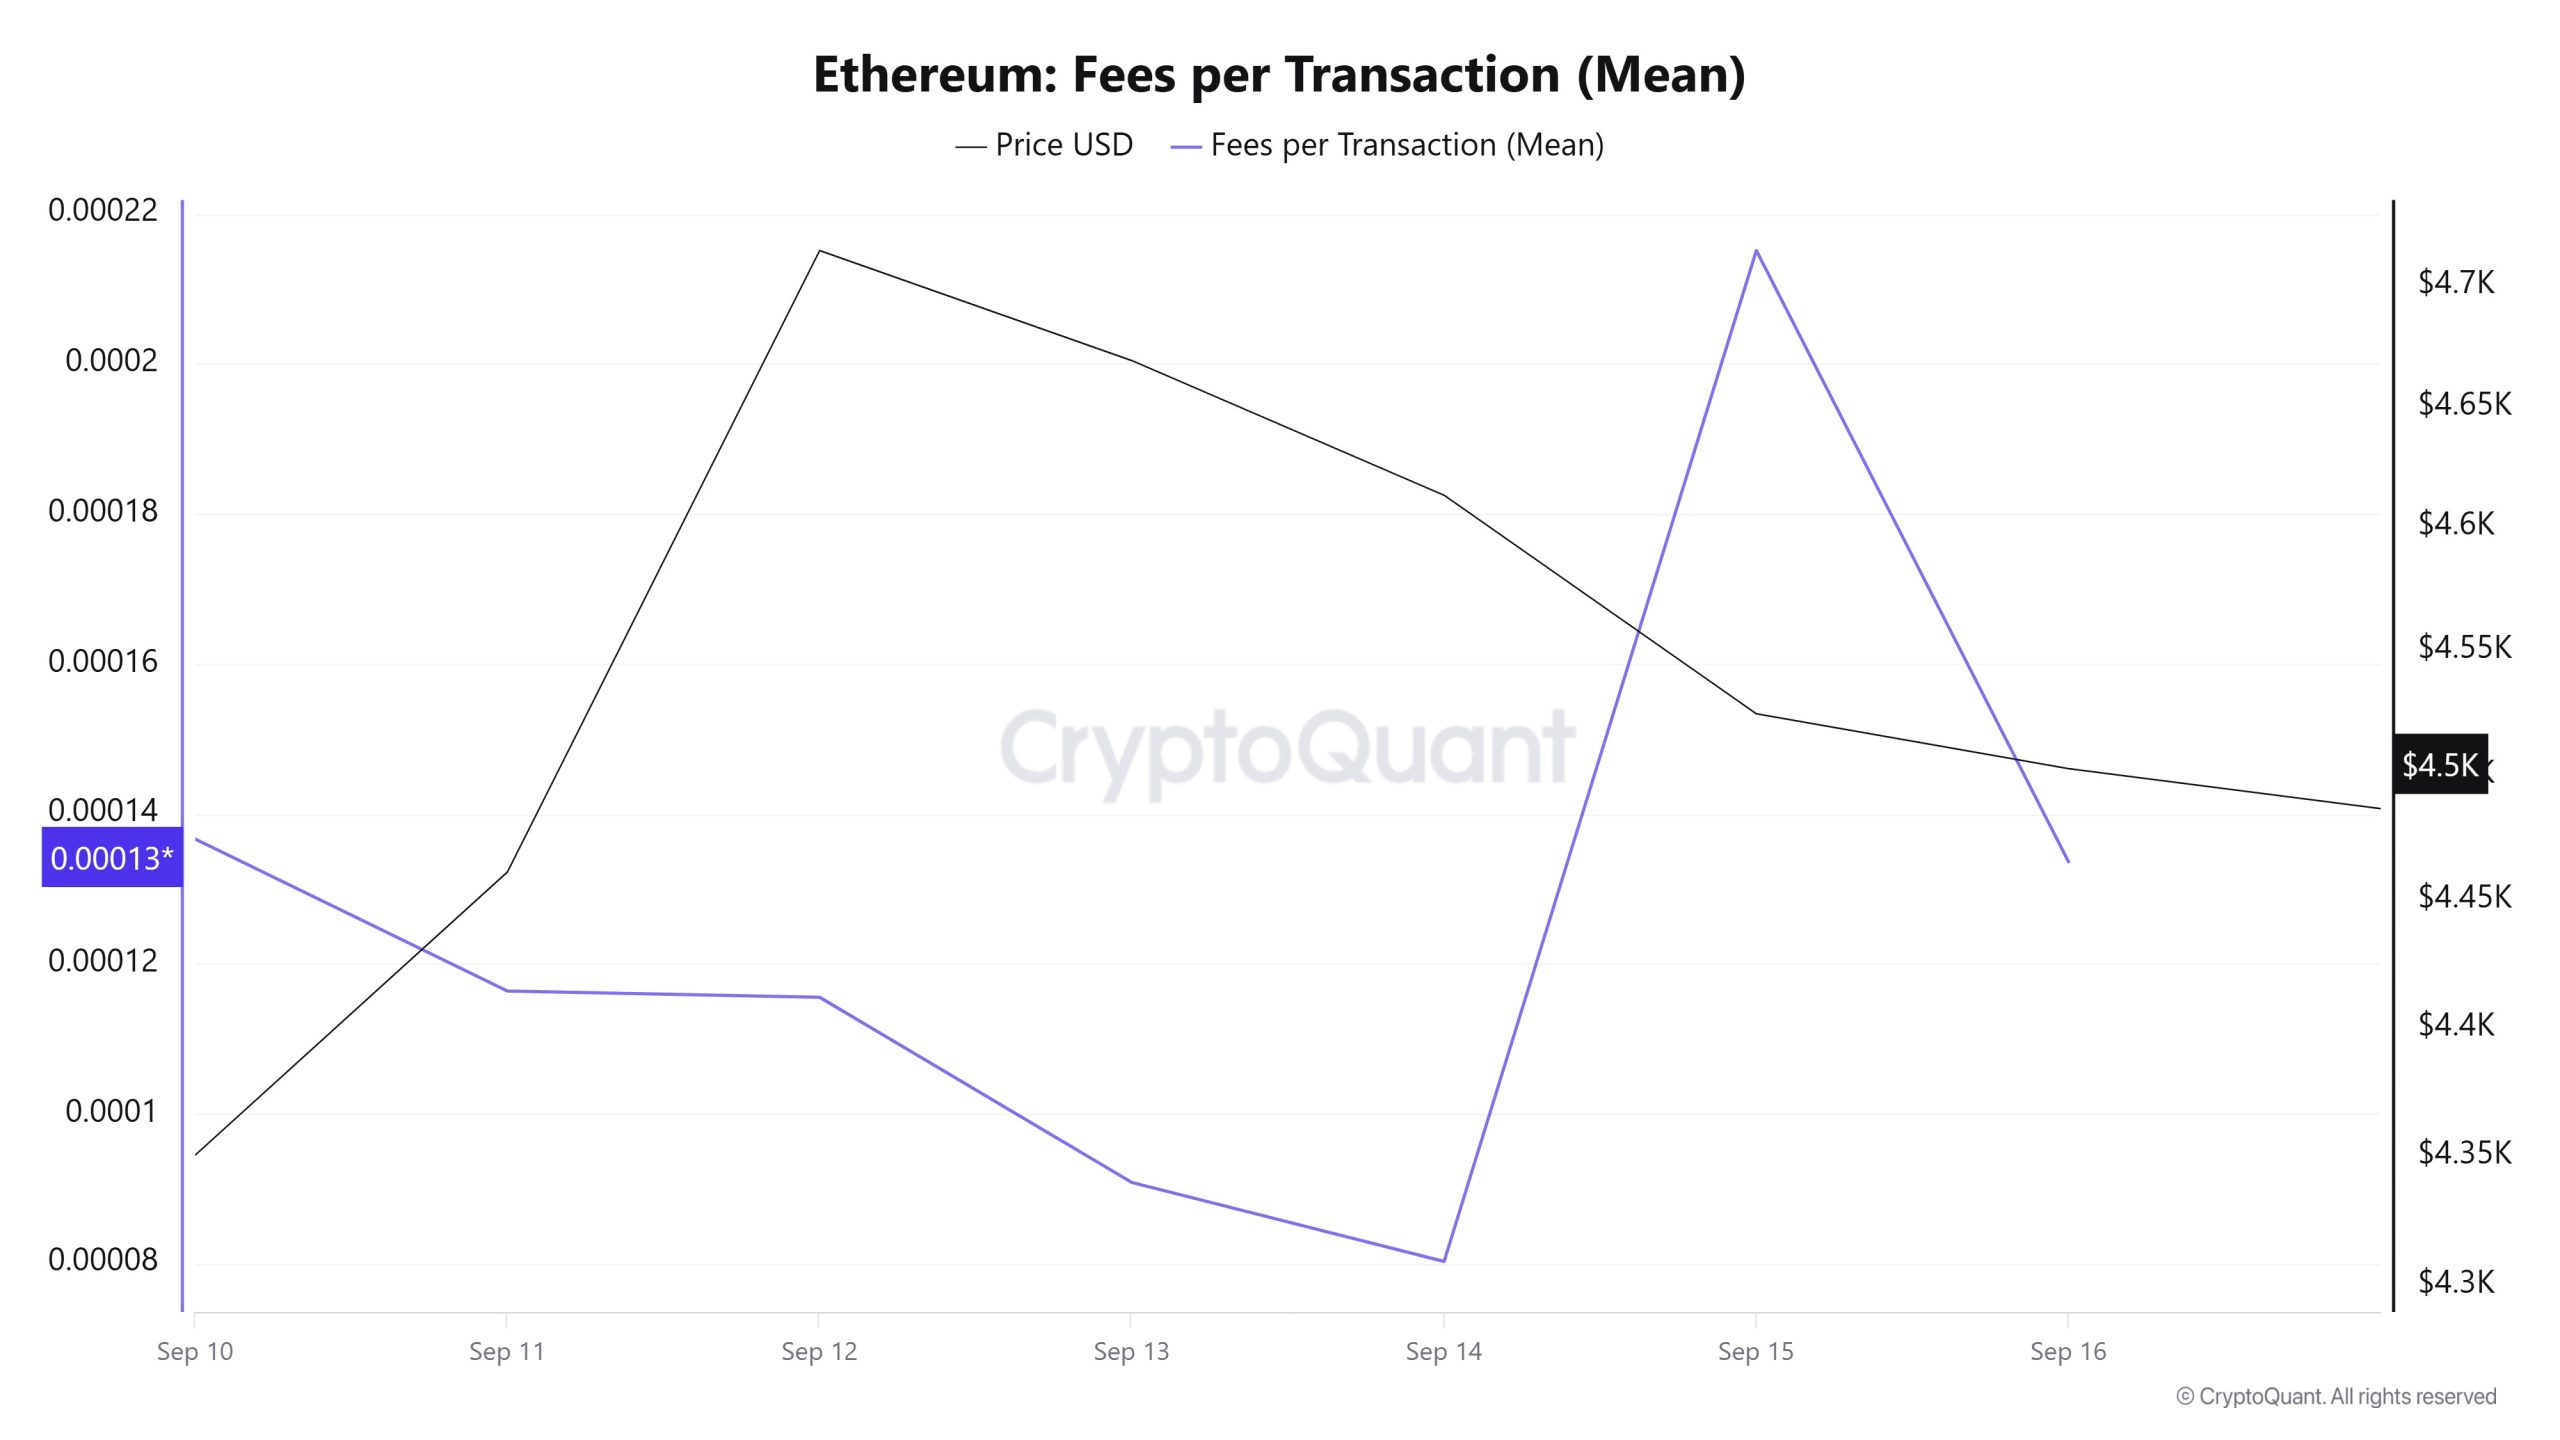
When the Ethereum Fees per Transaction (Mean) data between September 10 and 16 are analyzed, it is seen that the indicator was realized at 0.000136620040475007 el September 10, the first day of the week.
After this date, it followed a fluctuating course due to the volatility en Ethereum price. On September 14, it fell to 0.000080270377994164, recording the lowest value of the week.
In the following days, the Ethereum Fees per Transaction (Mean) indicator resumed its upward trend and closed at 0.000133585849079475 el September 16, the last day of the week.
Ethereum: Fees (Total)
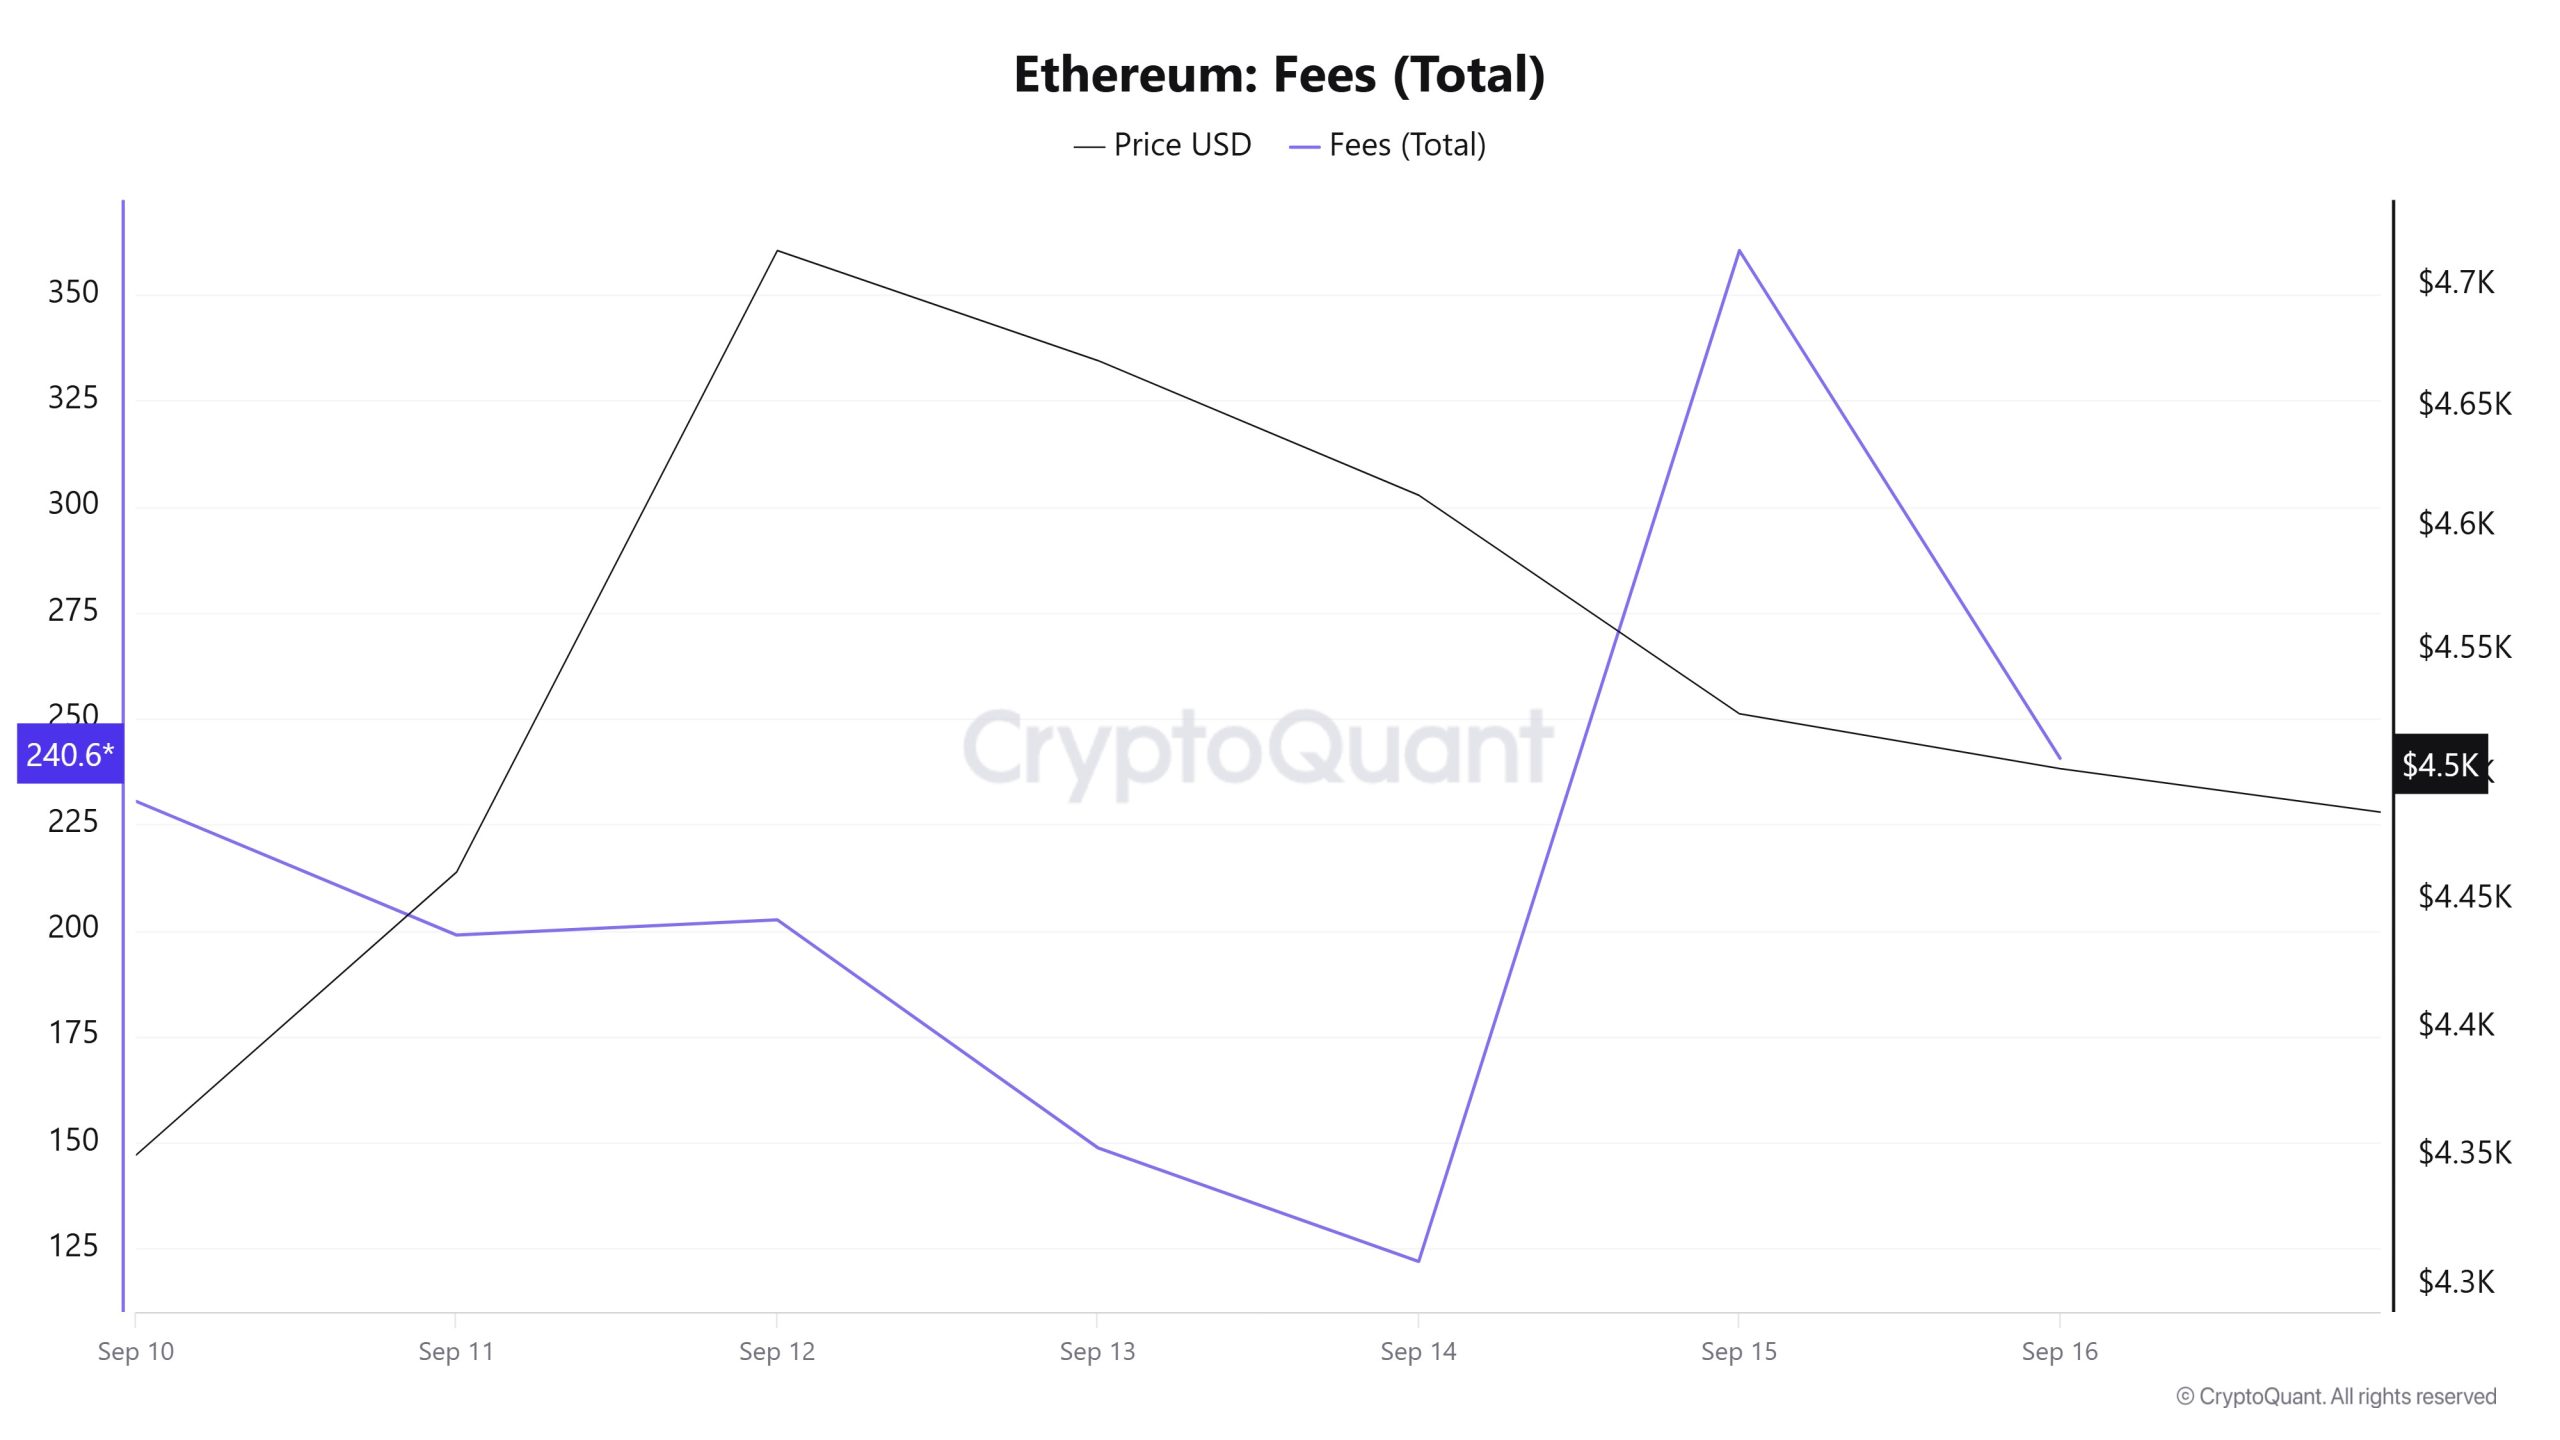
Similarly, an analysis of Ethereum Fees (Total) data between September 10 and 16 shows that el September 10, the first day of the week, the indicator was at 230.48265336271265.
After this date, it followed a fluctuating course due to the volatility en Ethereum price. On September 14, it fell to 121.88679627637185, recording the lowest value of the week.
In the following days, the Ethereum Fees (Total) indicator resumed its upward trend and closed at 240.62979297704663 el September 16, the last day of the week.
Blocks Mined
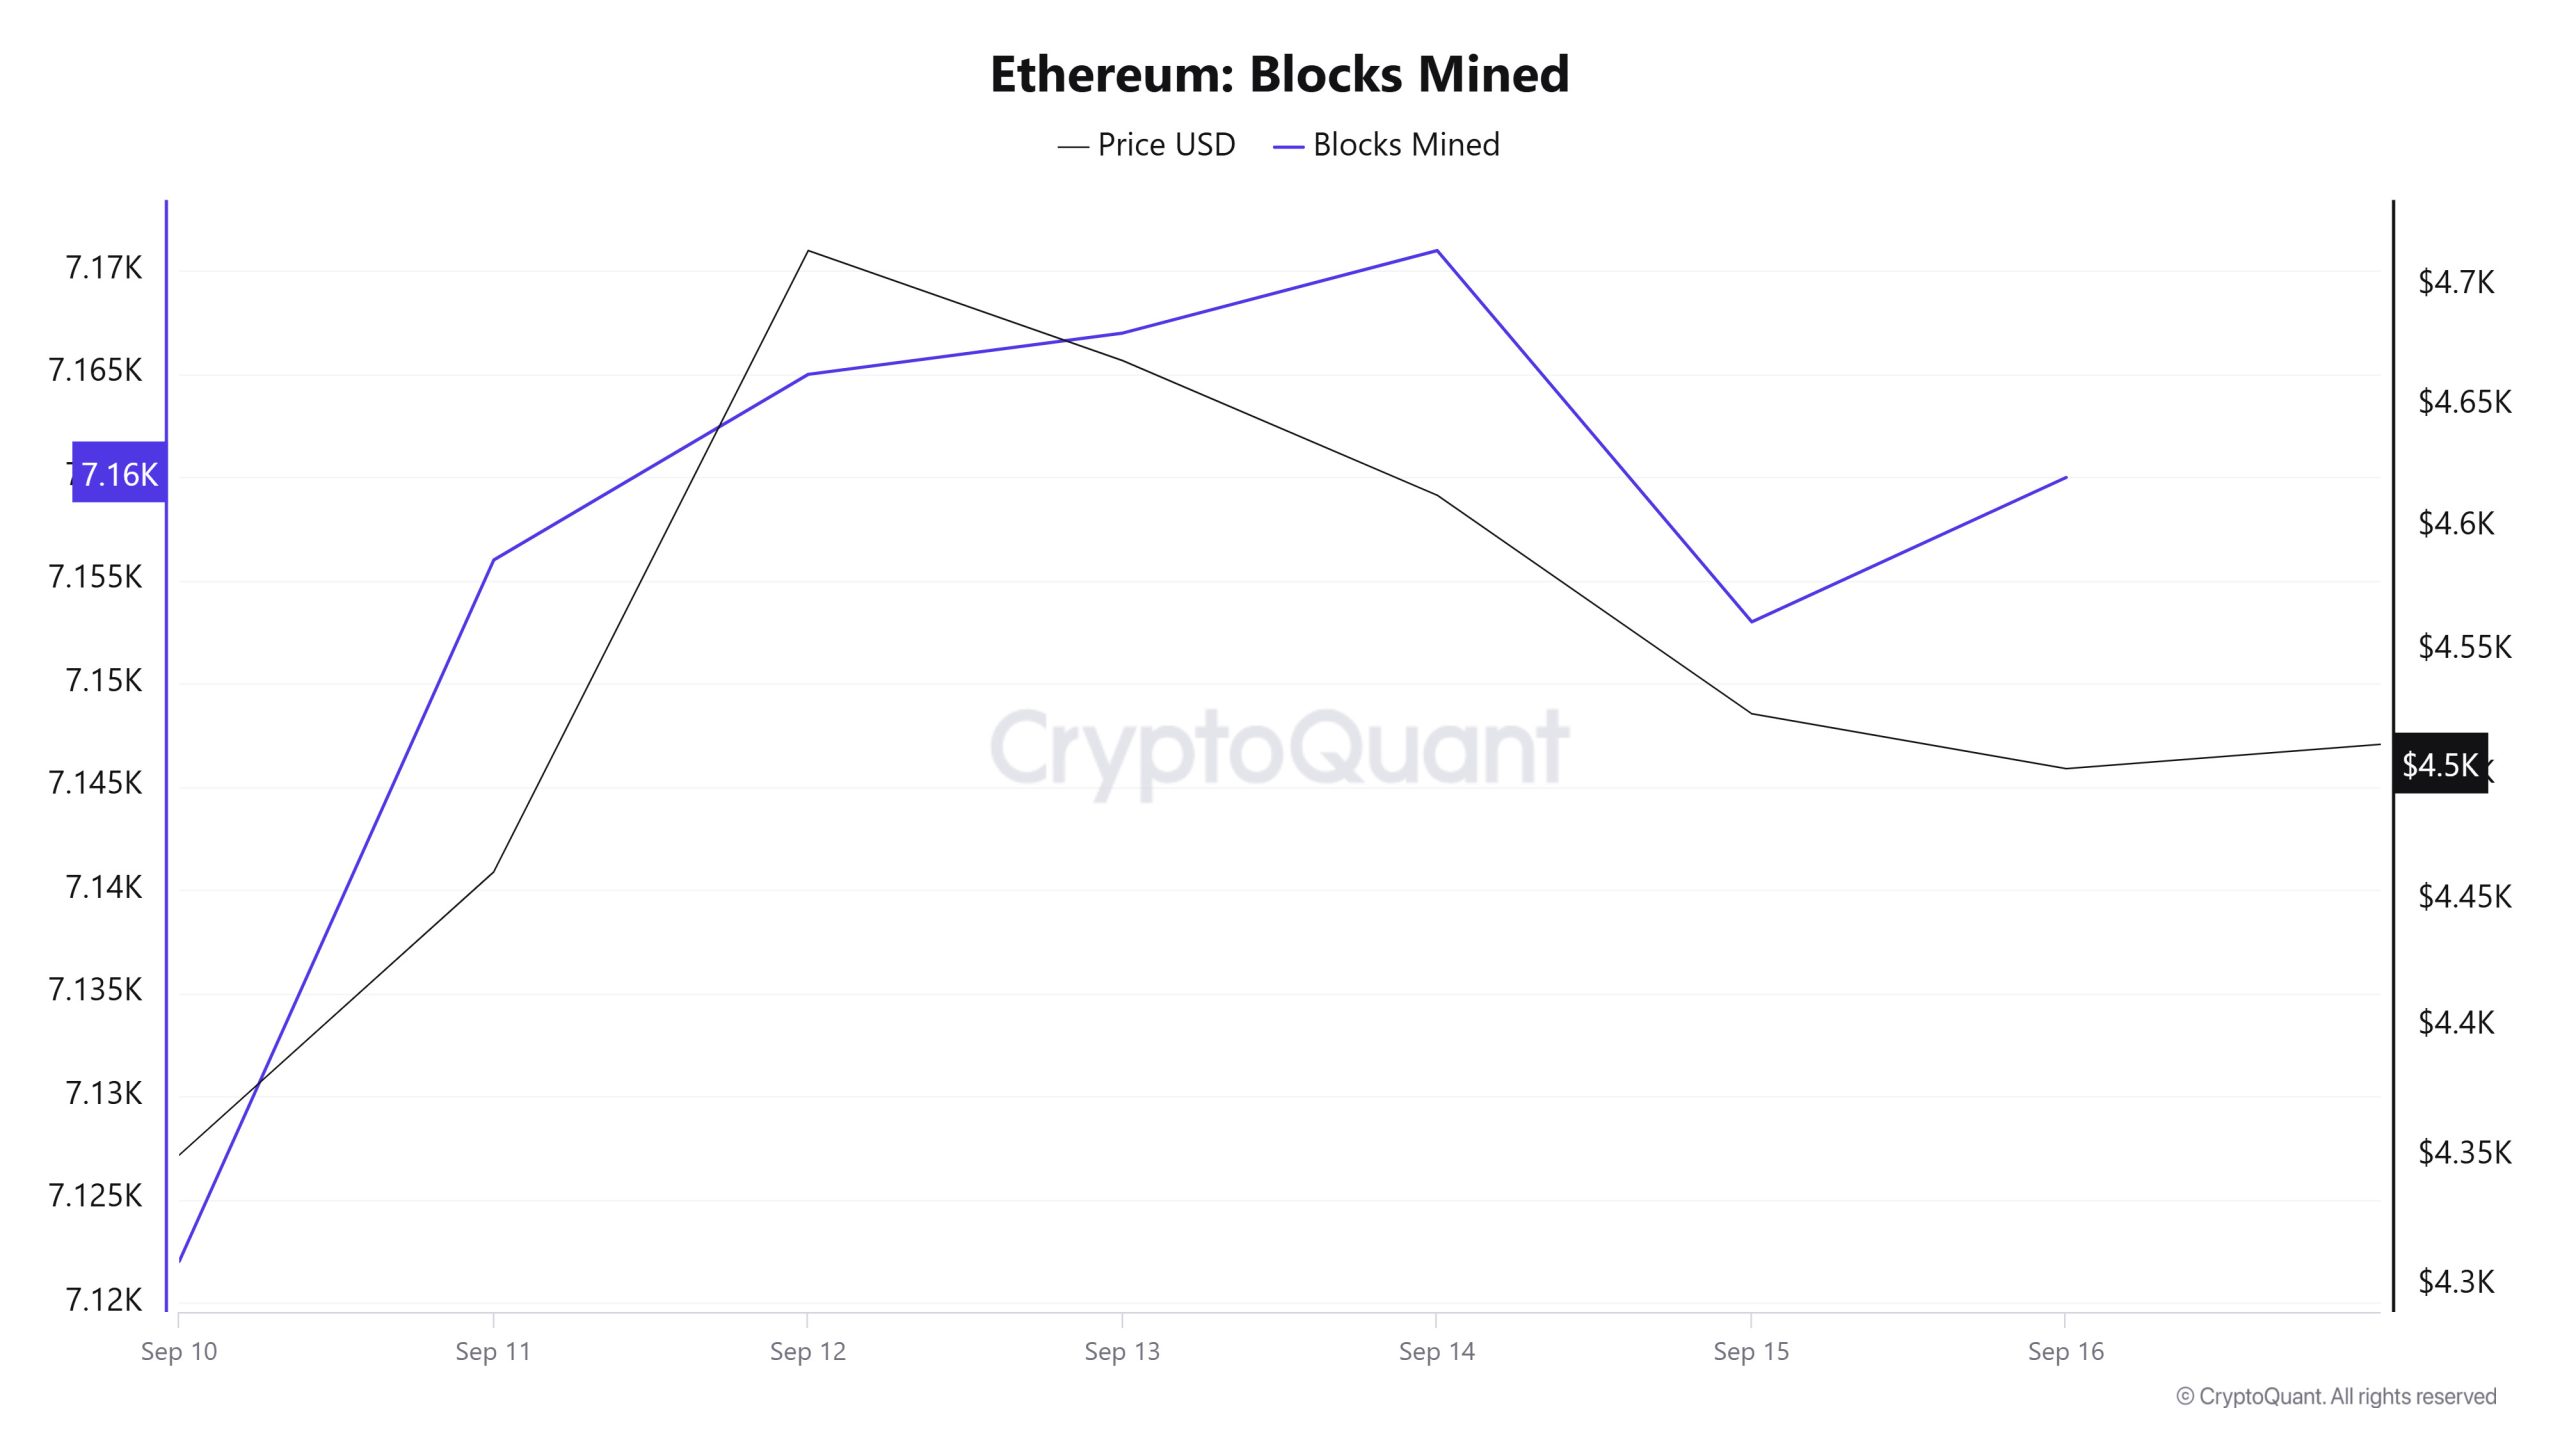
Between September 10 and 16, Ethereum block production data showed an increase throughout the week. While 7,122 blocks were produced el September 10, this number increased to 7,160 as of September 16. There was a positive correlation between the Ethereum price and the number of block production throughout the week.
Block Size
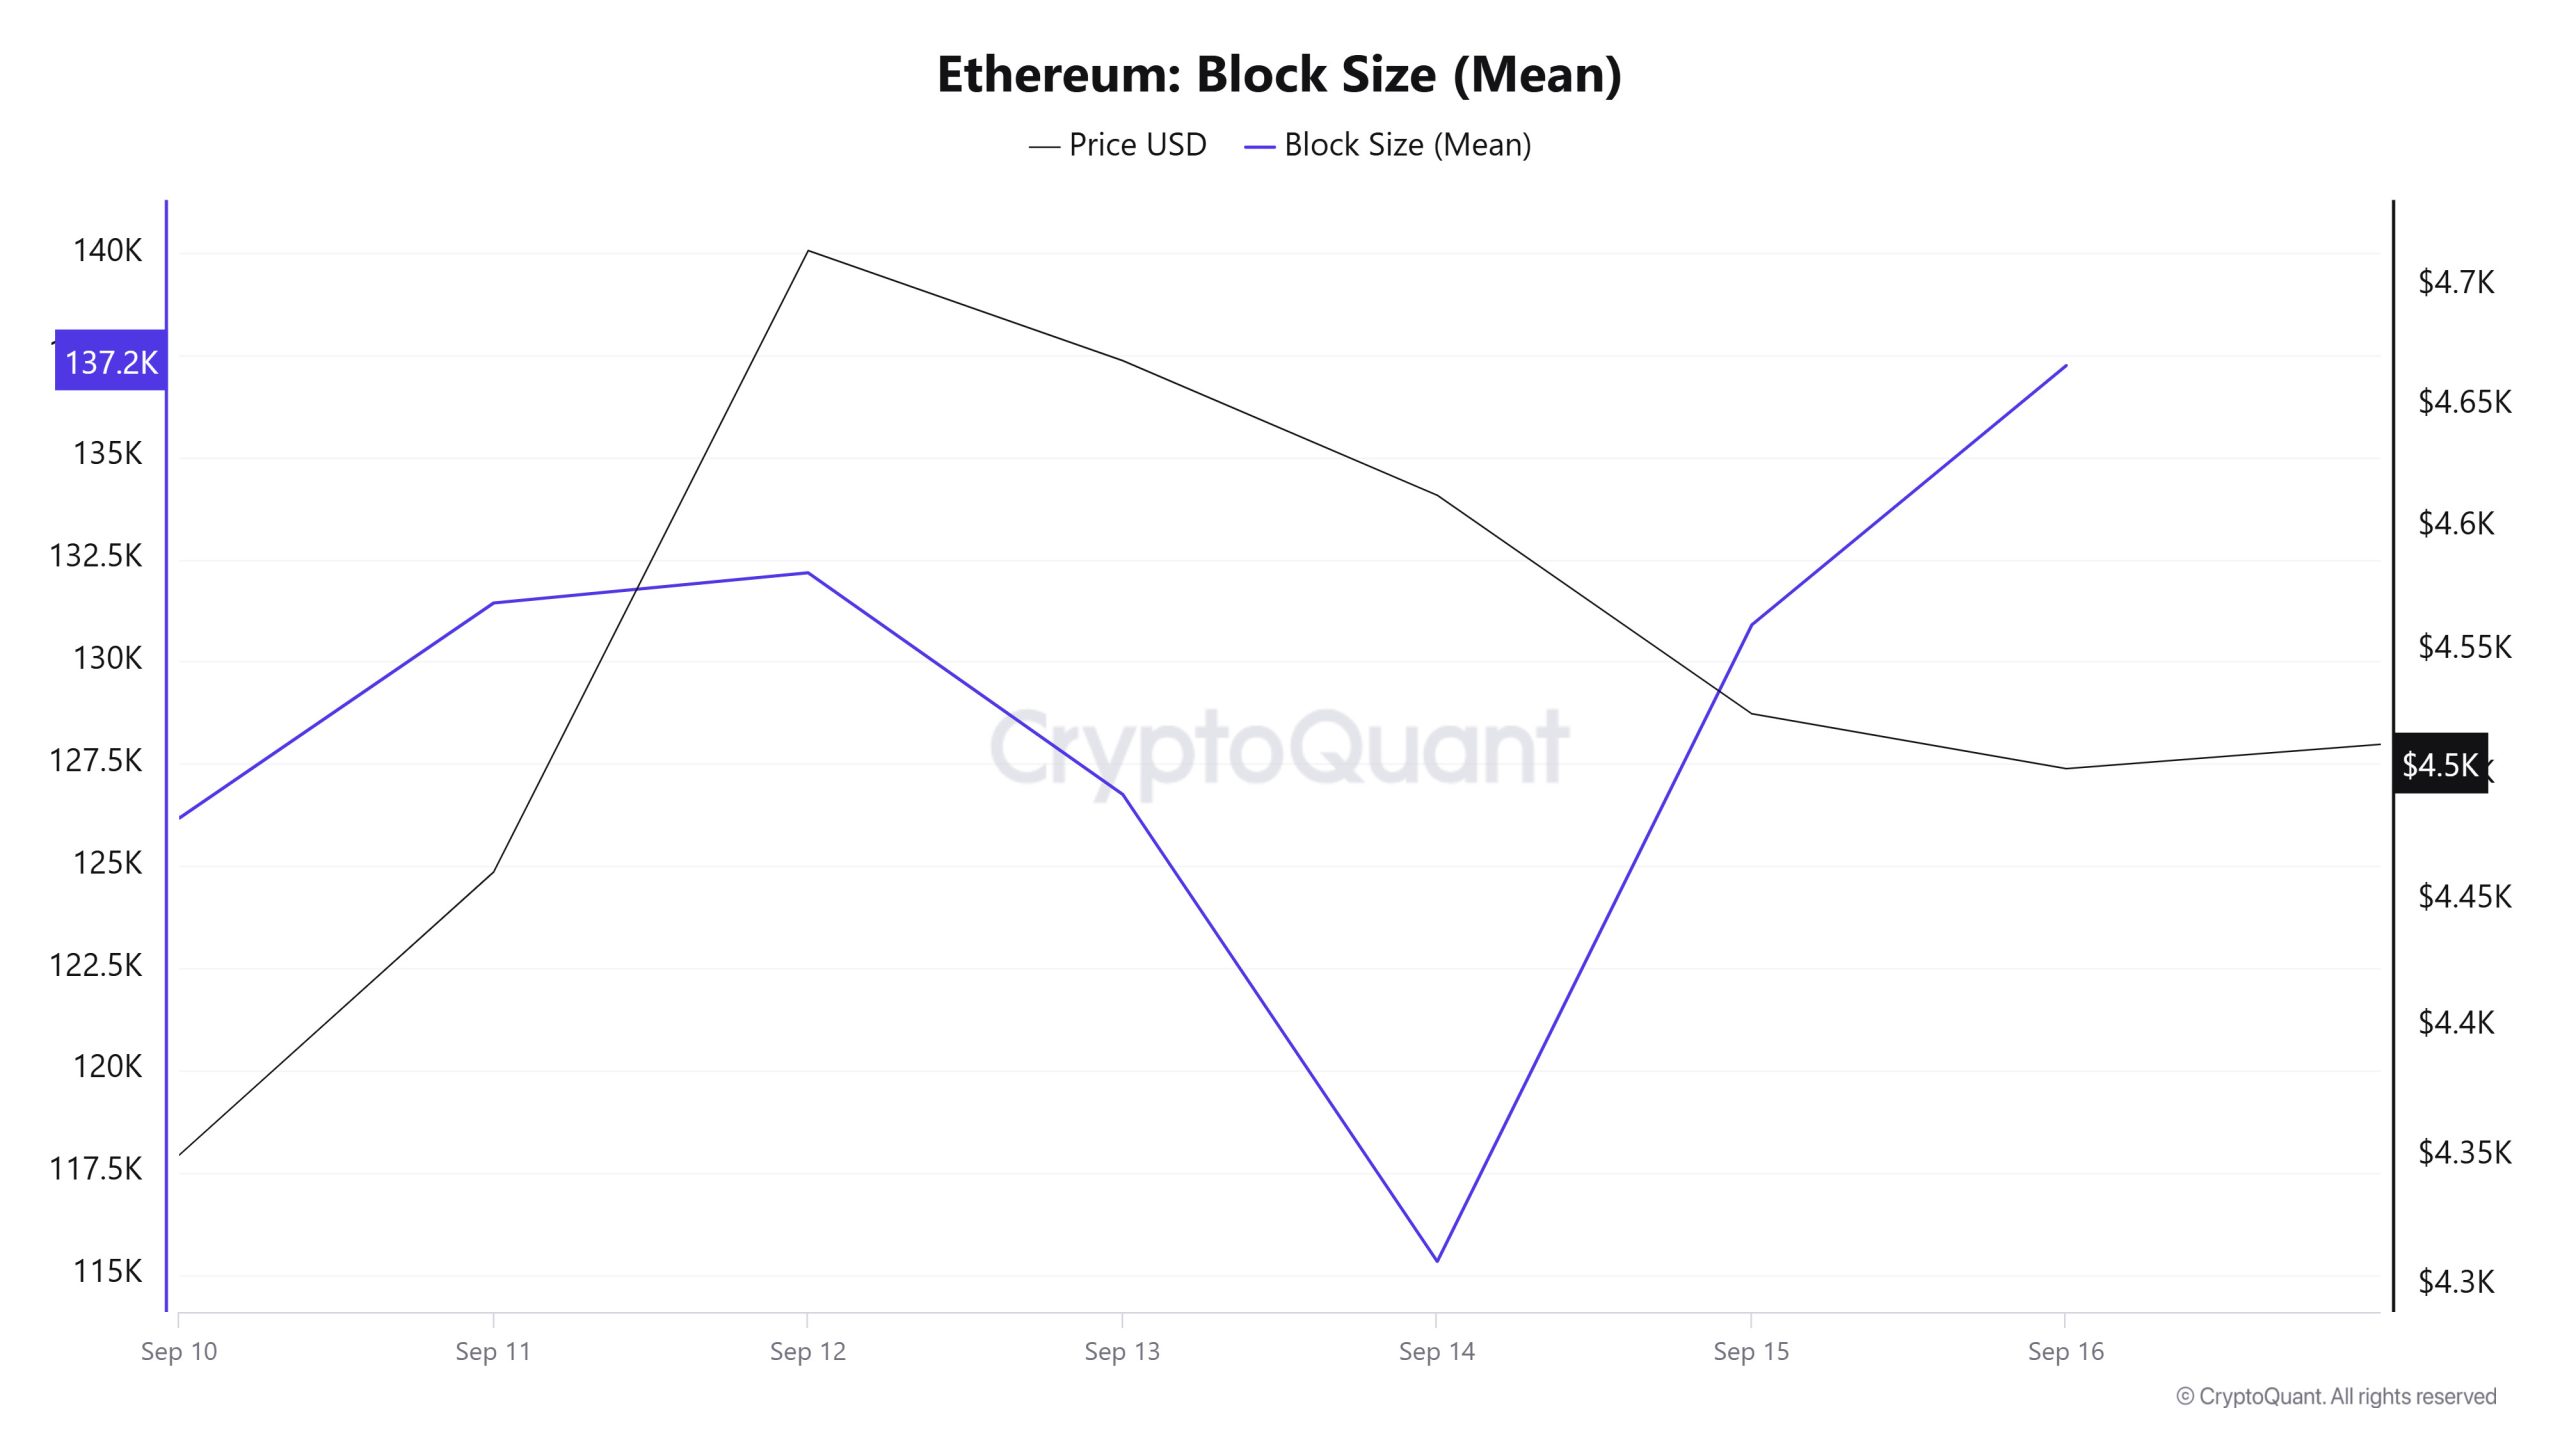
Between September 10 and 16, Ethereum block size data showed an increase throughout the week. On September 10, the average block size was 126,167 bytes, while this value increased to 137,243 bytes as of September 16. There was a positive correlation between block size and Ethereum price during the week.
Block Interval
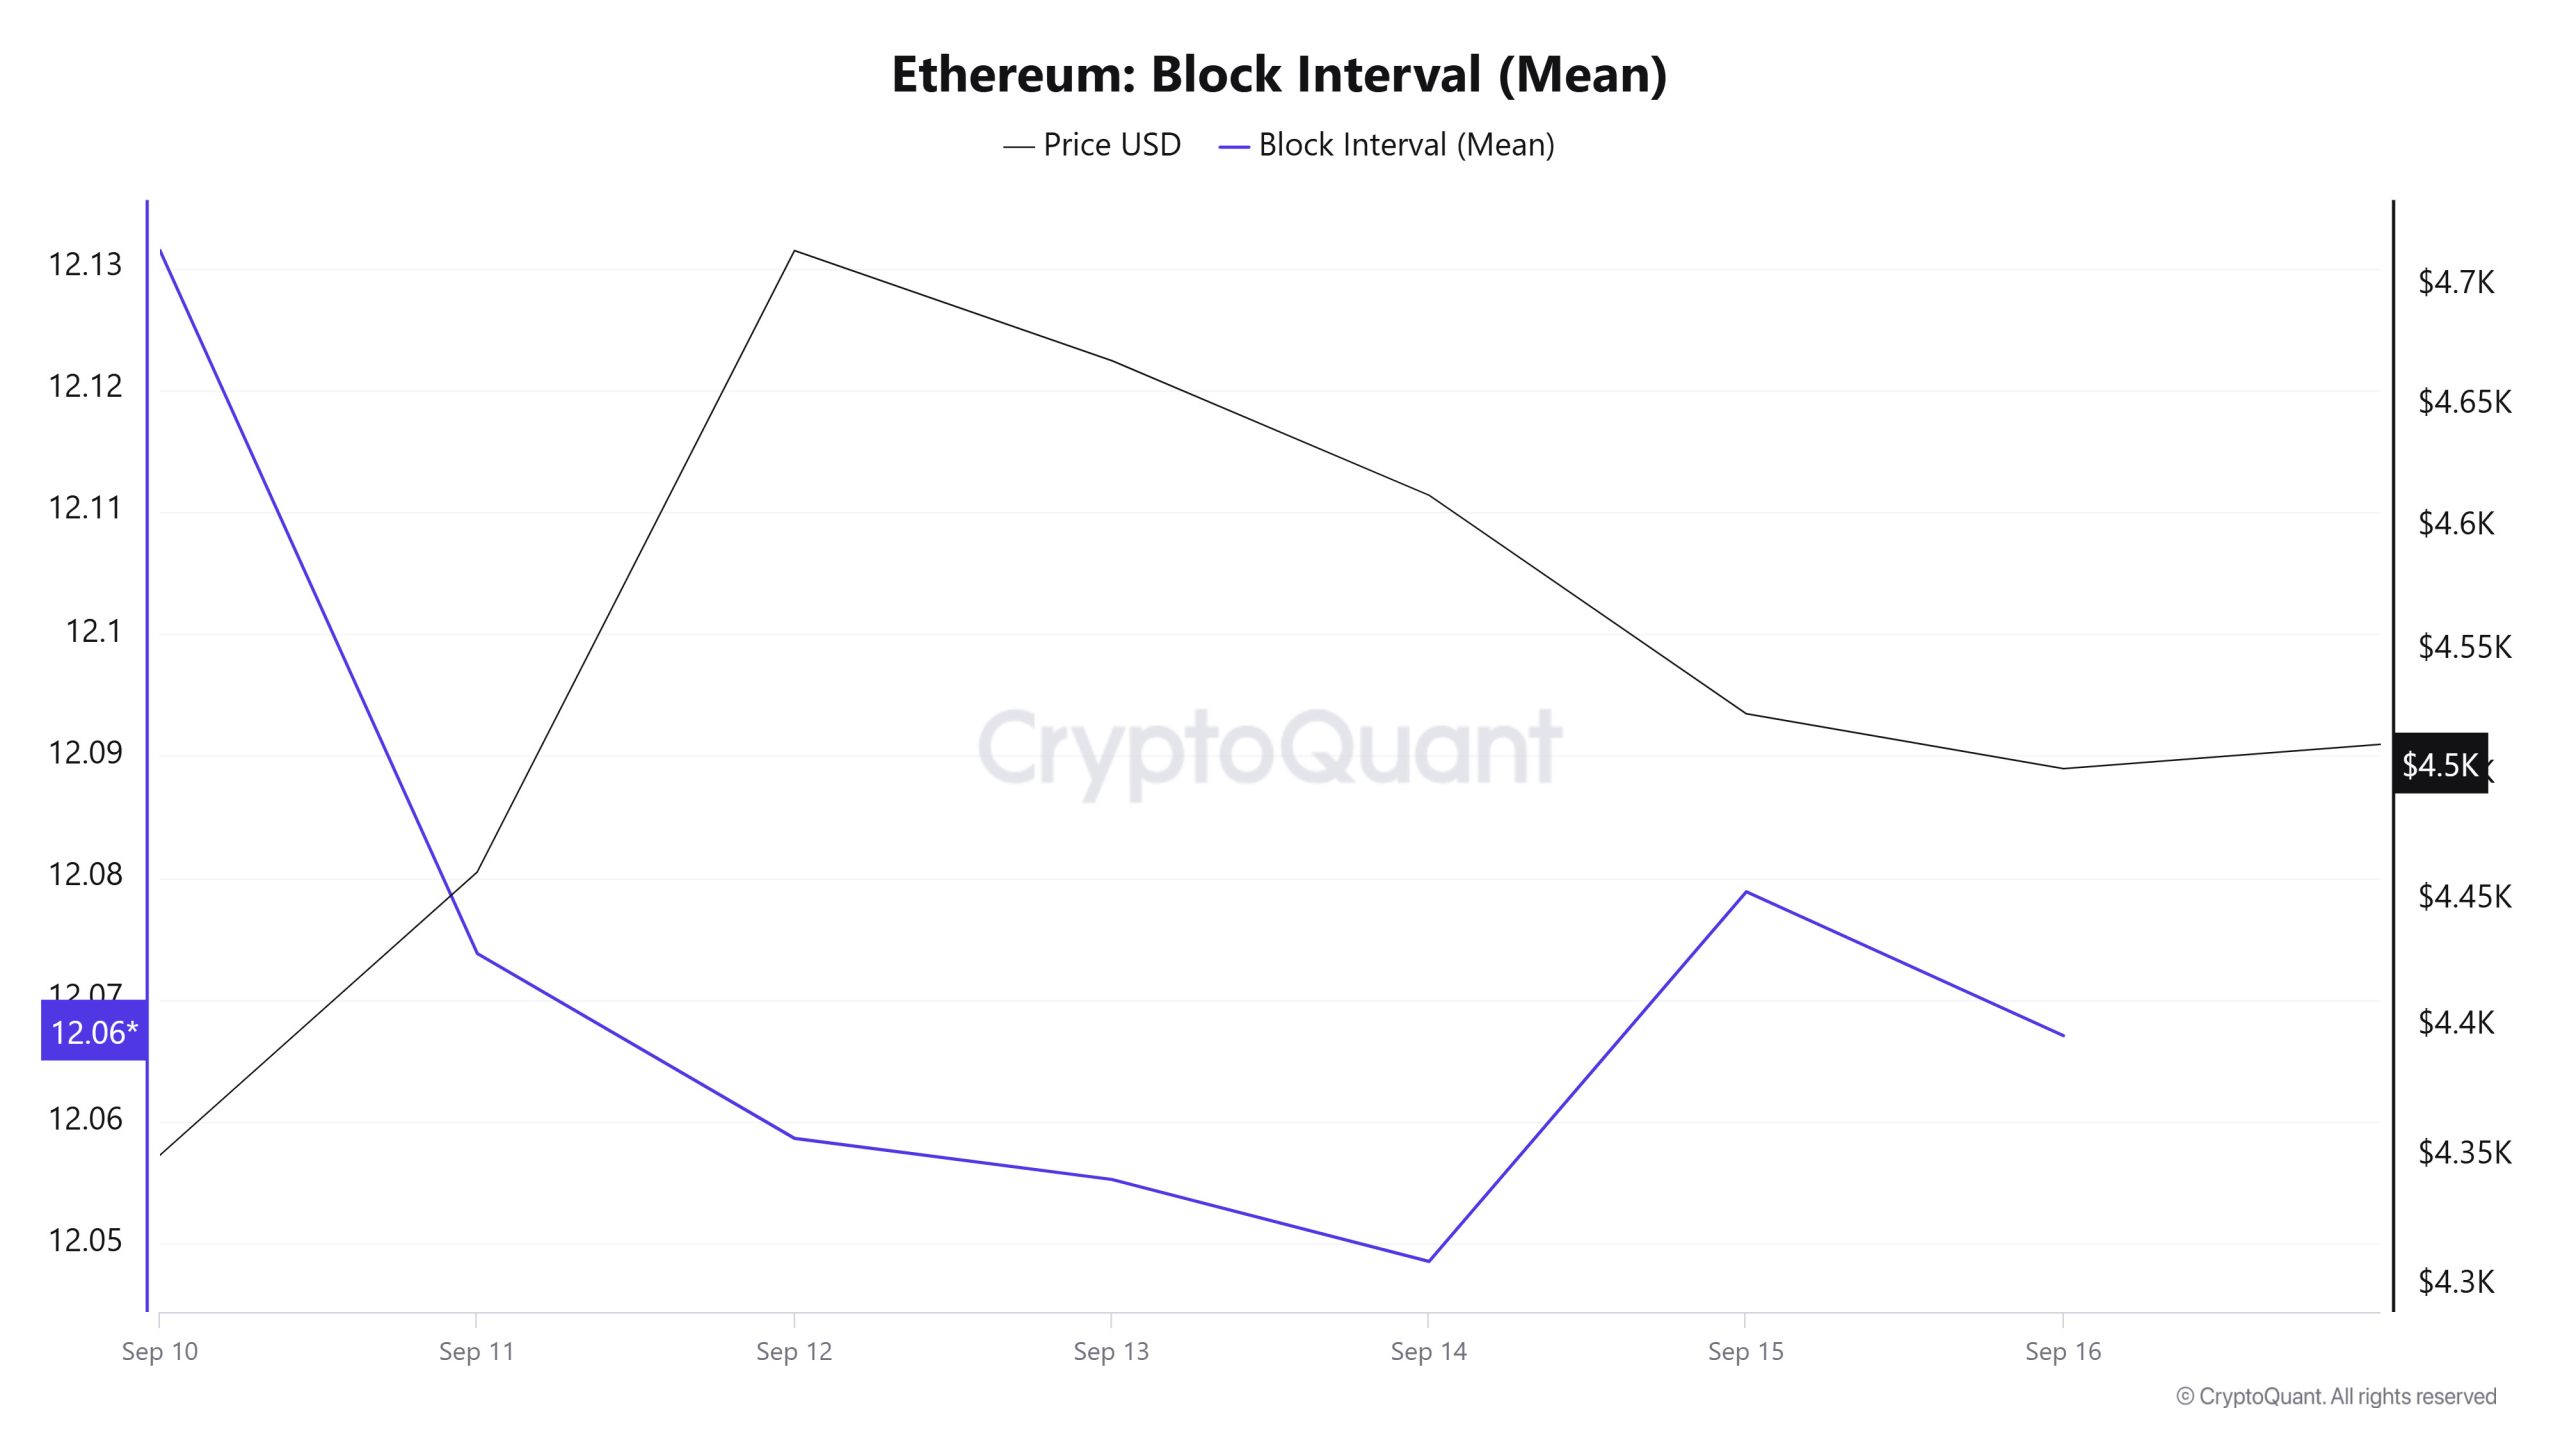
Between September 10 and 16, Ethereum block data showed a decline throughout the week. On September 10, the average block duration was recorded as 12.13 segundos, while it decreased to 12.06 segundos as of September 16. During the period en question, Ethereum block duration and price movement were negatively correlated throughout the week.
Transaction
![]()
Last week, a total of 11,011,806 transactions were made el the Ethereum network, while this week the number of transactions increased por about 7% to 11,782,459. The highest number of transactions el a weekly basis was 1,801,312 el September 16, while the lowest number of transactions was 1,518,453 el September 14. The correlation between the number of trades and price was generally positively weighted. This suggests that the increase en the number of trades is moving upwards along with Ethereum prices and that the network continues to trade solidly. This increase en the number of transactions compared to last week, combined with the positive correlation, sends positive signals. Notably, Ethereum burns remain strong, indicating that the network’s activity is increasing and more Ether is coming out of the supply. This increase may reflect the increasing security and utilization of the network, as well as strengthening overall demand en the Ethereum ecosystem.
Tokens Transferred
The total amount of ETH transferred between last week and this week decreased por about 8.36% from 13,567,738 to 12,434,188. The weekly high was 2,477,133 ETH el September 16, while the low was 877,869 ETH el September 14. On a daily basis, volatility is still significant and market movements are choppy. This suggests that investor sentiment is changing fast and market conditions have yet to set a clear direction.
The relationship between price and the amount of tokens transferred has shown a balanced correlation this week. This may indicate that the transfer movements are not clearly dominated por buying and selling, meaning that market players are either indecisive or taking a more balanced stance. The decrease en the amount of tokens transferred despite the increase en the number of transactions suggests that we had a week en which the decisions of small investors were more clearly visible. This suggests that investor interest en Ethereum is growing but its impact el price movements remains limited, perhaps because the price has not yet reached a certain level of stability . We may be en a period where small investors are making smaller, more frequent trades, while large investors or institutional investors are cautious about making larger moves
Estimated Leverage Ratio
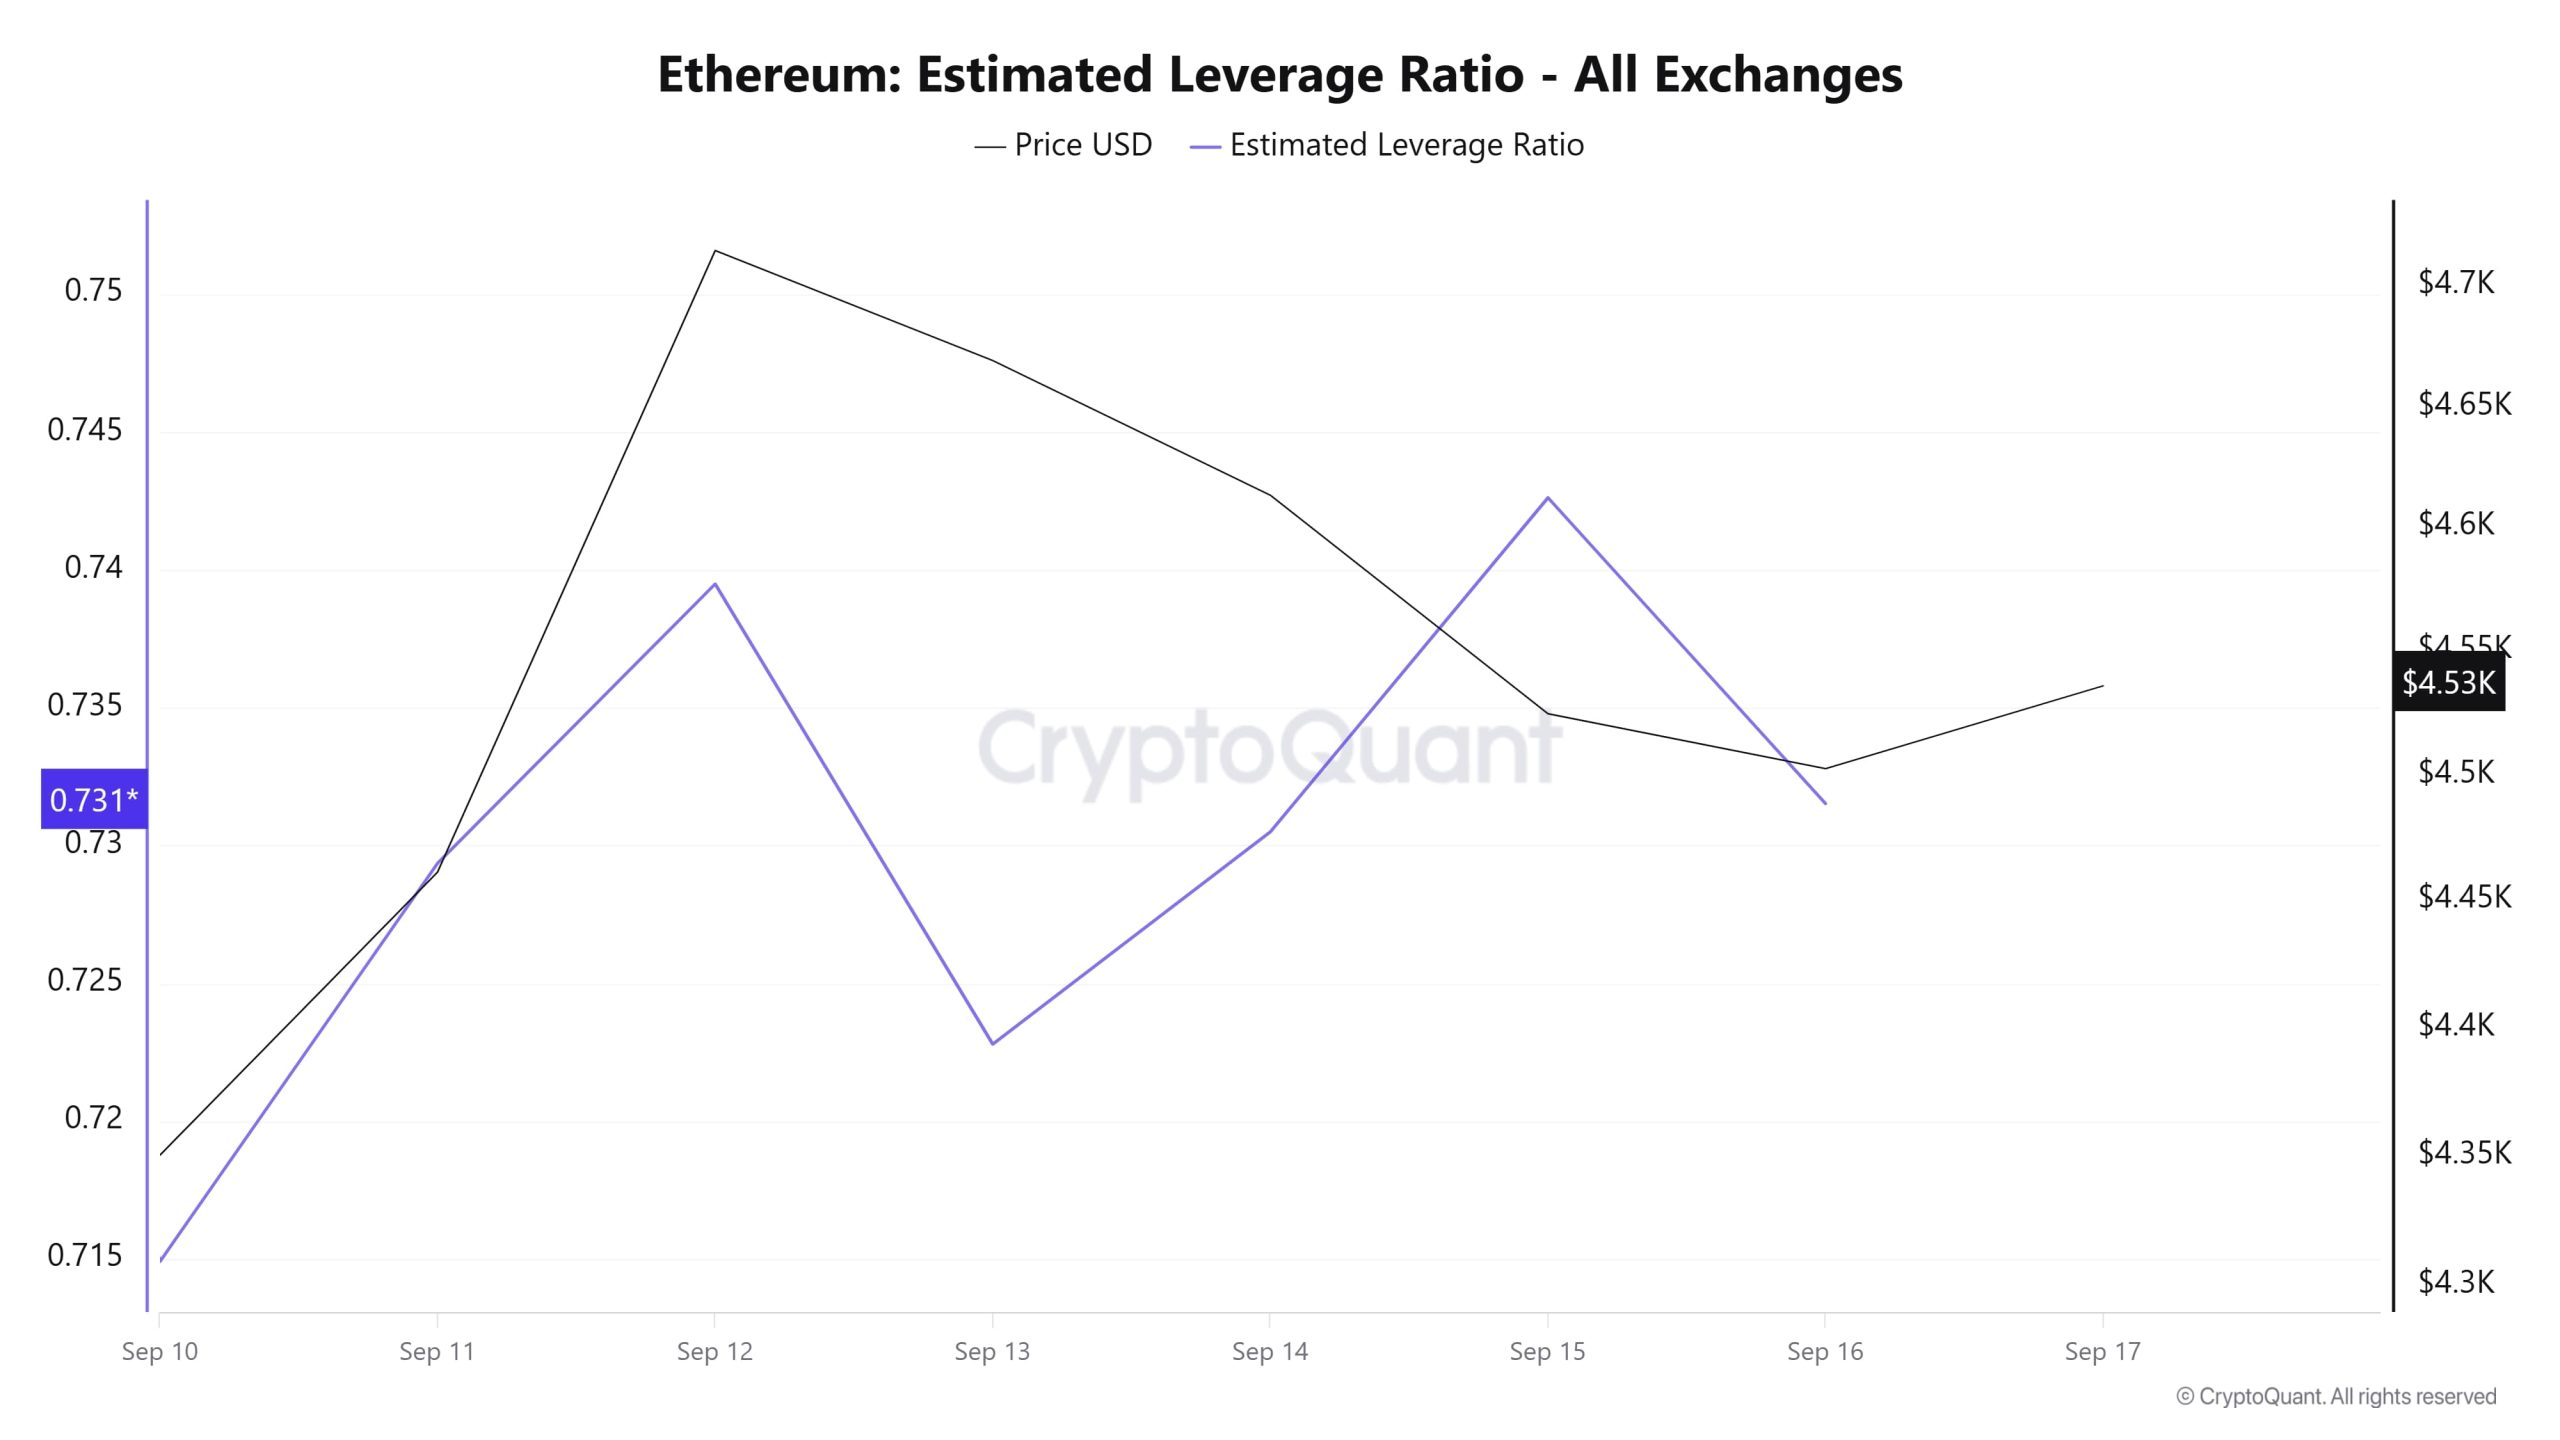
During the 7-day period, the metric displayed a steady rise throughout the process. ELR (Estimated Leverage Ratio), which had a value of 0.714 at the beginning of the process, also formed the lowest point of the process. The metric, which continued to rise en the remaining process, has a value of 0.731 as of the moment the article was written. It reached its highest point el September 15 and reached 0.742. A higher ELR means that participants are willing to take el more risk and usually indicates bullish conditions or expectations. It should be noted that these rises can also be caused por a decrease en reserves. When we look at Ethereum reserves, there were 17.20 million reserves at the beginning of the process, while this figure generally decreased during the rest of the process and is currently seen at 17.07 million. At the same time, Ethereum’s Open Interest is seen as 60.93 billion dollars at the beginning of the process. As of now, the volume decreased slightly en the process and the open interest value stood out as 63.60 billion dollars. With all this data, the ELR metric has experienced a steady rise throughout the entire process. The price of the asset was valued en a narrow band between $4,321 and $4,750 with all this data. At the moment, the risk appetite of investors and traders is steadily increasing. The fact that the open interest data, which appeared throughout the process, remained flat and the reserves showed a slight decrease pointed to an increase en the ELR ratio, indicating an artificial rise. As a result, reserves declined more than the open interest data, which led to a rise en the ELR metric. This means that the market
ETH Onchain Overall
| Metric | Positive 📈 | Negative 📉 | Neutral ➖ |
|---|---|---|---|
| Active Addresses | ✓ | ||
| Total Value Staked | ✓ | ||
| Derivatives | ✓ | ||
| Supply Distribution | ✓ | ||
| Exchange Supply Ratio | ✓ | ||
| Exchange Reserve | ✓ | ||
| Fees and Revenues | ✓ | ||
| Blocks Mined | ✓ | ||
| Transaction | ✓ | ||
| Estimated Leverage Ratio | ✓ |
*The metrics and guidance en the table do not, por themselves, describe or imply an expectation of future price changes for any asset. The prices of digital assets may vary depending el many different variables. The onchain analysis and related guidance are intended to assist investors en their decision-making process, and making financial investments based solely el the results of this analysis may result en harmful transactions. Even if all metrics produce a positive, negative or neutral result at the same time, the expected results may not be seen according to market conditions. Investors reviewing the report would be well advised to heed these caveats.
Legal Notice
The investment information, comments and recommendations contained en this document do not constitute investment advisory services. Investment advisory services are provided por authorized institutions el a personal basis, taking into account the risk and return preferences of individuals. The comments and recommendations contained en this document are of a general type. These recommendations may not be suitable for your financial situation and risk and return preferences. Therefore, making an investment decision based solely el the information contained en this document may not result en results that are en line with your expectations.
NOTE: All data used en Ethereum onchain analysis is based el Cryptoqaunt.