
MARKET SUMMARY
Latest Situation en Crypto Assets
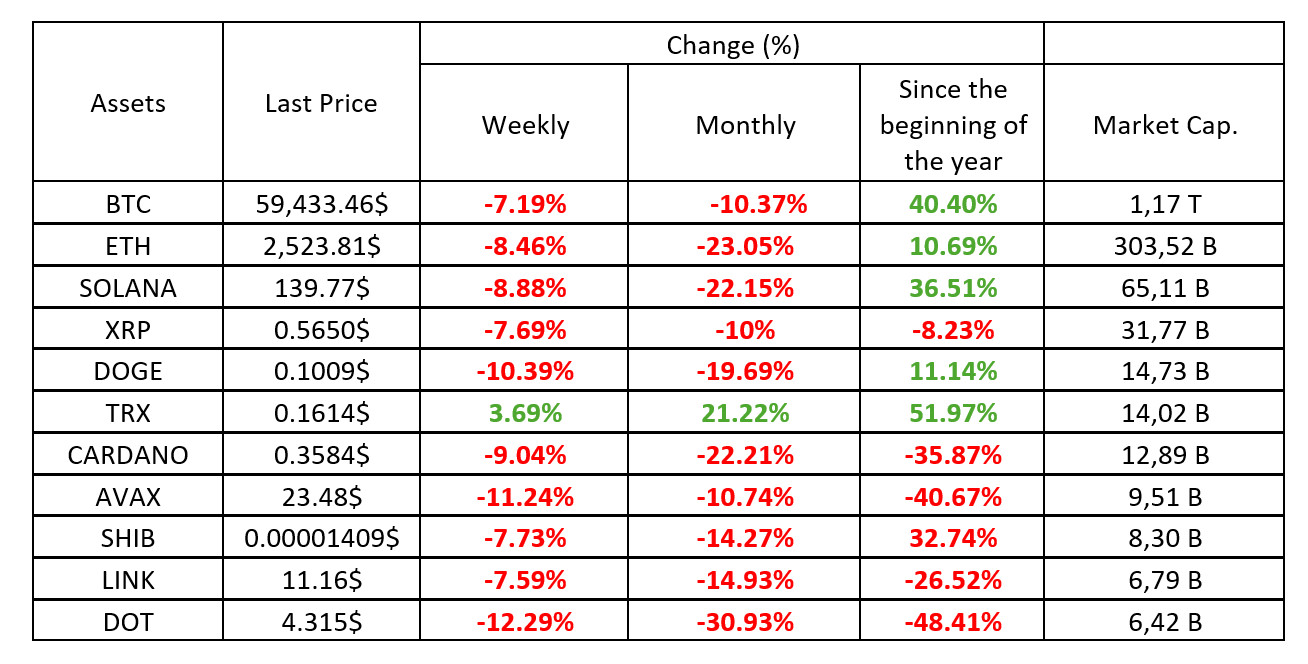
*Table was prepared el 30.08.2024 at 14:30 (UTC). Weekly values are calculated for 7 days based el Friday.
Fear & Greed Index
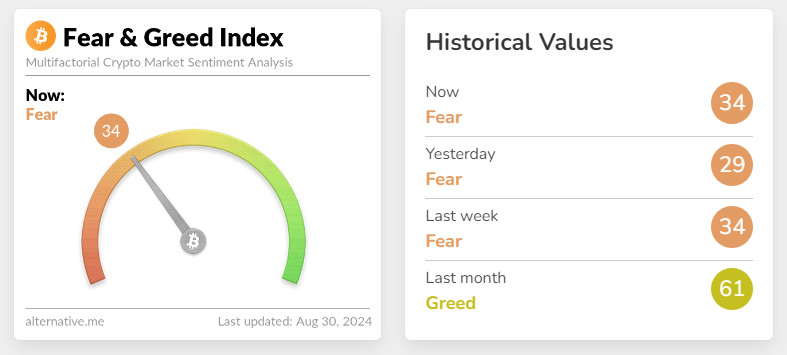
Source: alternative.me
The fear and confidence index, which was as high as 56 last week, fell to 29 this week. There may be several reasons for this decline. According to Glassnode data, active Bitcoin addresses en the last 7 days have fallen to their lowest levels en the last two months. The 5.4% year-el-year increase en the US House Price Index may have also put additional pressure el Bitcoin. The oversold US Dollar Index (DXY) and the prospect of a possible rebound en the greenback may have added to the fear en the cryptocurrency market. Geopolitical tensions en the Middle East may have also contributed to the index’s decline.
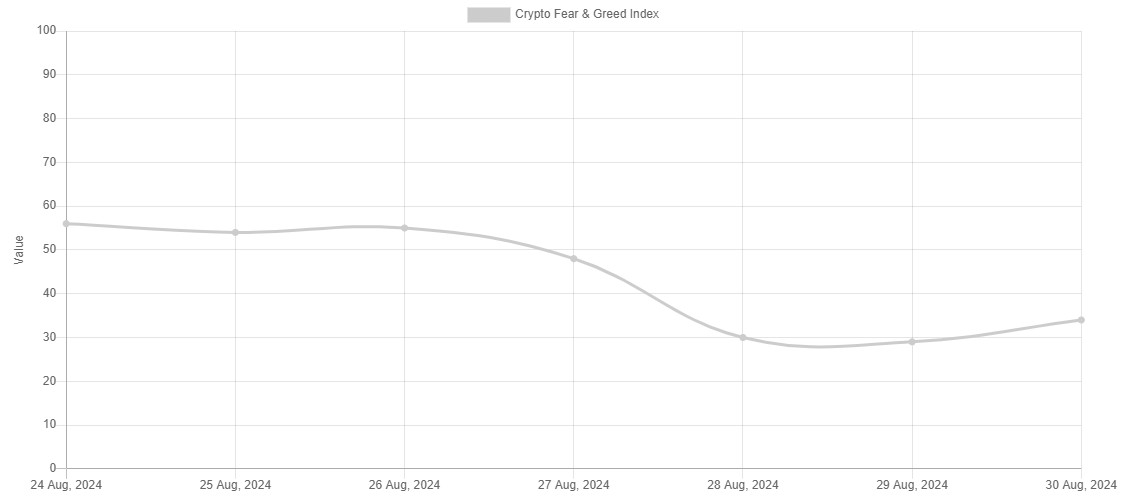
Source: alternative.me
Bitcoin Dominance
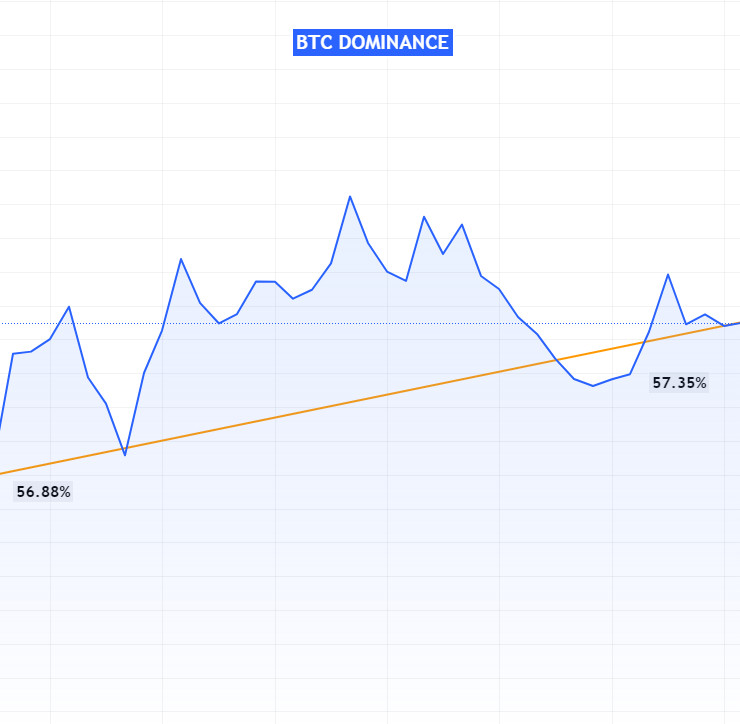
Source: Tradingview
Last week, the decline en Bitcoin dominance caused significant activity and price increases en altcoins. This week, however, the increase en Bitcoin dominance has led to pullbacks en altcoins.
Bitcoin Dominance
- Last Week’s Level: 56.88
- This Week’s Level: 57.35
Bitcoin dominance represents Bitcoin’s share of the total market capitalization en the cryptocurrency market. Bitcoin dominance increased from 56.88% to 57.35% en the past week, indicating that Bitcoin’s influence el the market is increasing.
Impacts el the Altcoin Market
- Price Movements: The rise en Bitcoin dominance has led to pullbacks en the values of altcoins. Altcoins lost some of their price gains from the previous week this week.
- Market Dynamics: An increase en Bitcoin’s dominance may indicate that the value of Bitcoin is rising and investors are taking the opportunity to realize their profits. A pullback en the price of Bitcoin indicates that investors are collecting their profits and the market is facing this profit realization.
Total MarketCap
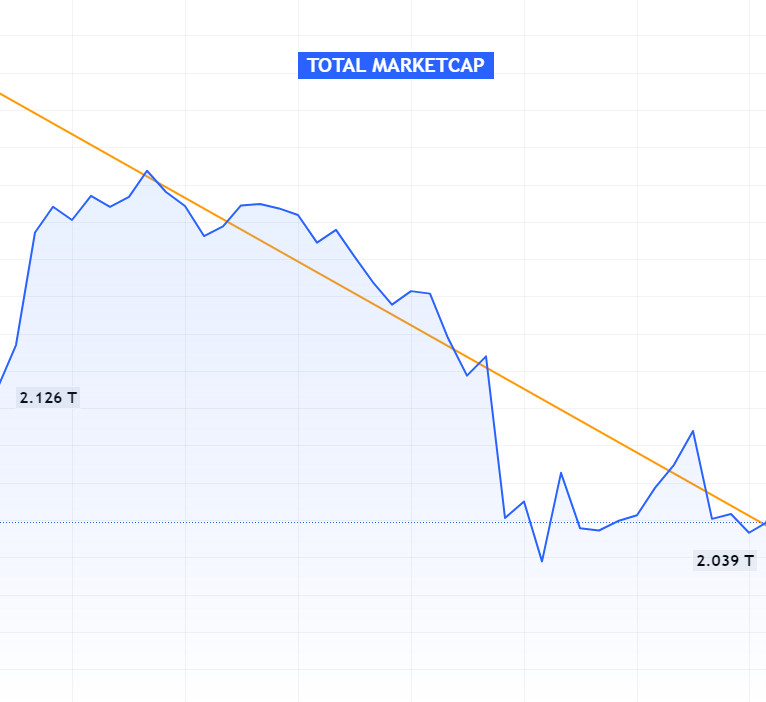
Source: Tradingview
Market Value Fluctuations
Last week saw significant fluctuations en the cryptocurrency market. The total market capitalization rose from $2.126 trillion to $2.228 trillion. However, this was followed por a sharp decline and the market capitalization fell to $2.039 trillion. These fluctuations are a reflection of general market uncertainty and changes en investor sentiment.
Detention of Pavel Durov
The detention of Telegram founder and CEO Pavel Durov en France had a significant impact el the cryptocurrency market. Following this development, cryptocurrencies belonging to the TON (The Open Network) ecosystem suffered serious losses en value. After Durov’s detention, Toncoin fell 23% to $5.24. Notcoin, el the other hand, fell por 23.5%.
Warren Buffett’s Cash Position
Warren Buffett’s $278 billion cash position has sparked controversy among investors and economists. Buffett’s large cash holdings may be driven por expectations of a possible economic crisis or tax strategy. This could affect market players’ expectations of future economic conditions and have an impact el overall market sentiment.
Conclusion and Evaluation
The impact of the fluctuations en the cryptocurrency market and especially the detention of Pavel Durov el cryptocurrency values is noteworthy. Moreover, the controversy over Warren Buffett’s cash position may provide clues as to the measures investors will take en response to economic uncertainties. These developments may show how market conditions and investor sentiment may change over time.
Weekly Crypto Market Breakdown
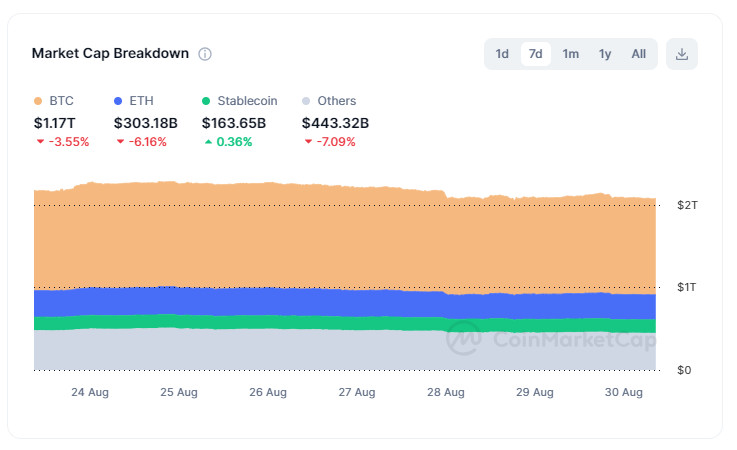
Source: Coinmarketcap
Bitcoin Performance
This week, Bitcoin’s market capitalization decreased por 3.55% to $1.170 trillion. This suggests that Bitcoin is losing value en response to market volatility and investors may take a more cautious approach.
Ethereum Performance
Ethereum lost 6.16% el a weekly basis and its market capitalization fell to $303.18 billion. Ethereum’s 6.16% depreciation suggests that investors are experiencing a decrease en confidence en Ethereum or that market volatility is negatively affecting Ethereum. This suggests that Ethereum could be further affected por market conditions.
Stablecoin Performance
Stablecoins have trended positive this week en contrast to other assets and are up 0.36%. The total market capitalization of stablecoins reached $163.65 billion. This increase shows that investors are turning to stablecoins as a safe haven en volatile market conditions.
Altcoin Performance
Altcoins lost 7.09% el a weekly basis, bringing their total market capitalization to $443.32 billion. The 7.09% depreciation of altcoins reveals that these assets are more affected than mainstream cryptocurrencies such as Bitcoin and Ethereum, or are negatively affected por general market conditions. This suggests that altcoins have suffered more from market uncertainty.
Bitcoin Supply Distribution
Supply allocations en Bitcoin are critical to understanding the market’s balance of power and the dynamics of price movements. Large wallets are often controlled por exchanges, funds and institutional investors, and sudden changes en these wallets can cause severe market volatility. Medium-sized wallets, el the other hand, play a stabilizing role. They help maintain the stability of the market. Small wallets reflect the interest of individual investors and give clues about market sentiment. This balance of supply distributions is one of the keys to shaping Bitcoin’s overall market and a fundamental element to consider en investment decisions.
An increase en the number of small wallets could indicate that new investors are entering the market, which could have a positive long-term impact el prices. Therefore, it is important to pay attention not only to wallet sizes but also to the movement of funds en these wallets and the overall liquidity en the market to make more informed investment decisions. This multi-dimensional analysis of supply distributions can help to better predict Bitcoin’s future market trends.
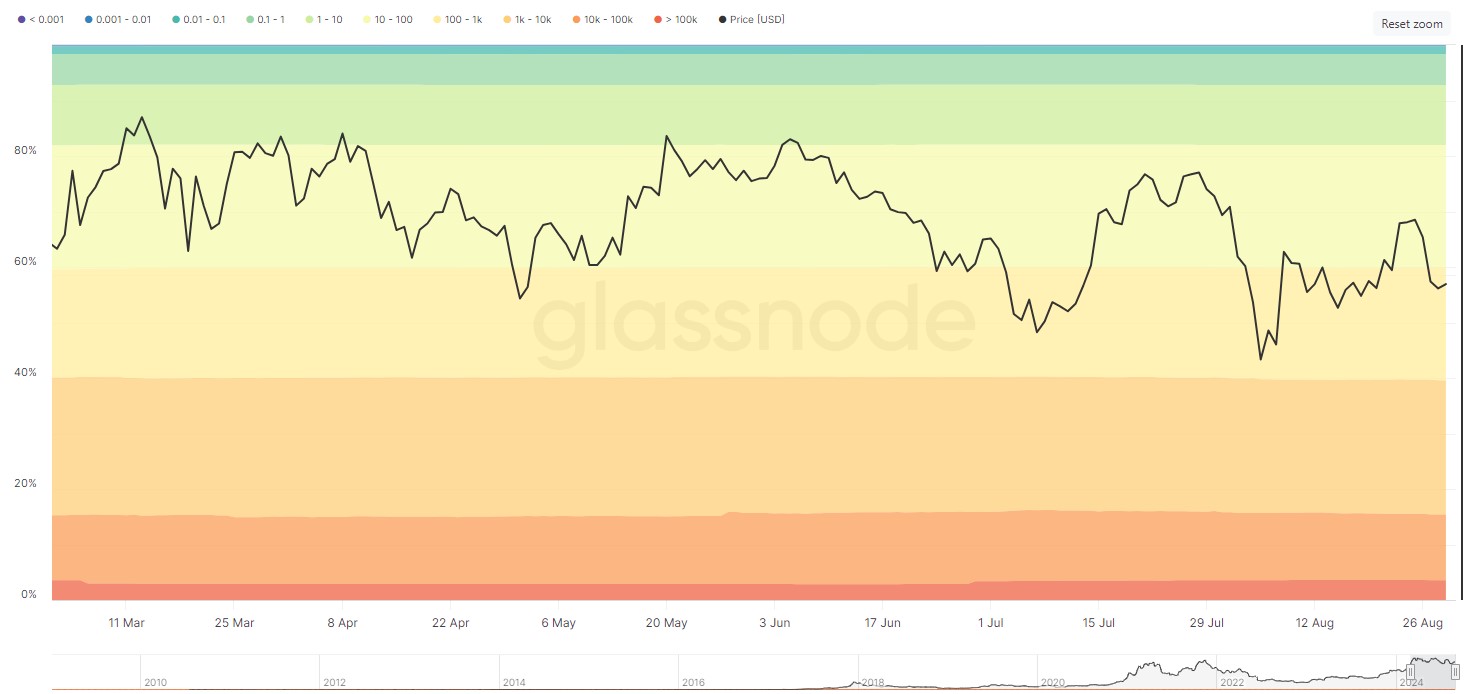
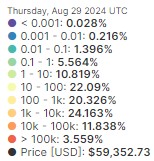
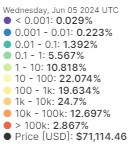
BTC: Relative Address Supply Distribution
Source: Glassnode
The table above shows the number of wallets holding more than a certain amount of BTC between now and June 5. Wallet addresses holding 0.1 BTC or more increased por 1.8%, while wallet addresses holding 100 BTC or more decreased por the same amount. This can be interpreted as a decrease en the buying appetite of relatively larger investors or companies and an increase en the buying appetite of small investors en the market.
Large Wallets (1k – 10k BTC)
Holding 24.163% of the total supply, these wallets have the largest weight en the market. Managed por large funds, exchanges or institutional investors, these wallets are the most critical players shaping the market. Large transactions from these wallets can lead to sharp movements en prices. Therefore, the trading decisions of wallets at this level can be decisive el the overall direction of the market.
Largest Wallets (>10k BTC)
Source: Glassnode
These wallets hold 15,397% of the total supply. Usually, huge institutions and exchanges hold this amount of Bitcoin. The movements of these wallets can cause strong fluctuations en the market. If one of these wallets goes el sale, it can create serious selling pressure en the market.
Mid-Sized Wallets (1 – 100 BTC)
With a share of 32.909%, these wallets stand out as a stabilizing factor en the market. This category, which includes medium-sized investors and small institutional players, may exhibit more resilience and stability against price fluctuations. These wallets can play a stabilizing role against sudden changes en the market.
Small Wallets (<1 BTC)
These wallets, which account for 7.204% of the total supply, are controlled por individual investors. While their impact el the market is limited, an increase or decrease en the number of these wallets may reflect individual investor interest. While they may not have a direct impact el market trends, they can be an indicator of overall investor sentiment.
Since June 5, the decrease en the number of wallets holding 100k BTC and above can be interpreted as positive en terms of the balance of supply distributions, even if it is due to MTgox distributions.
Source: Glassnode
Bitcoin Options Breakdown
There was an important development en BTC options this week. Nasdaq, an American exchange that manages electronic securities trading worldwide, has applied to the SEC to list and trade bitcoin index options. If approved, these options have the potential to increase trading volumes and liquidity en the volatile Bitcoin market.
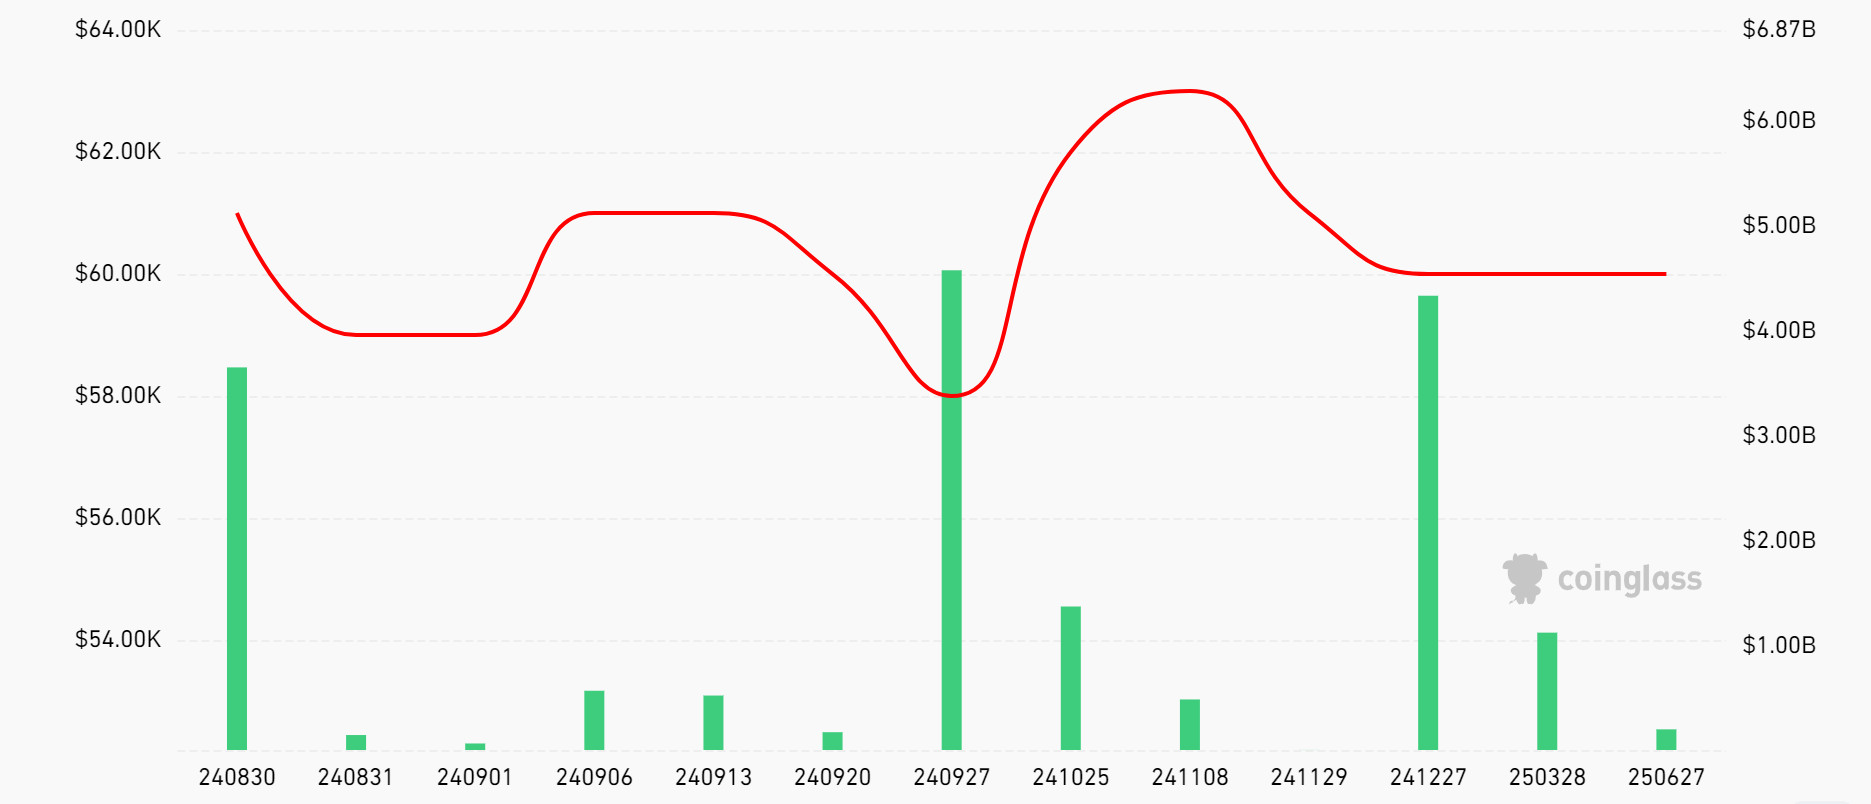
Source: Coinglass
The crypto market will witness the expiration of $3.67 billion worth of Bitcoin options contracts today. Traders are bracing for potential volatility. This big expiration could affect short-term price action, especially as BTC has been el a recent downtrend. Today’s options expiry marks a significant increase compared to last week. According to data from Deribit, Bitcoin options expiries totaled 61,793 contracts, compared to 18,440 contracts last week. Data from Coinglass shows that the maximum bitter price of these expiring Bitcoin options is $60,000.
Source: Deribit
When we look at the ratio of put options to call options, the put/call ratio is 0.60. This shows that the asset is generally bullish despite its recent pullback.
Bitcoin Liquidation Chart
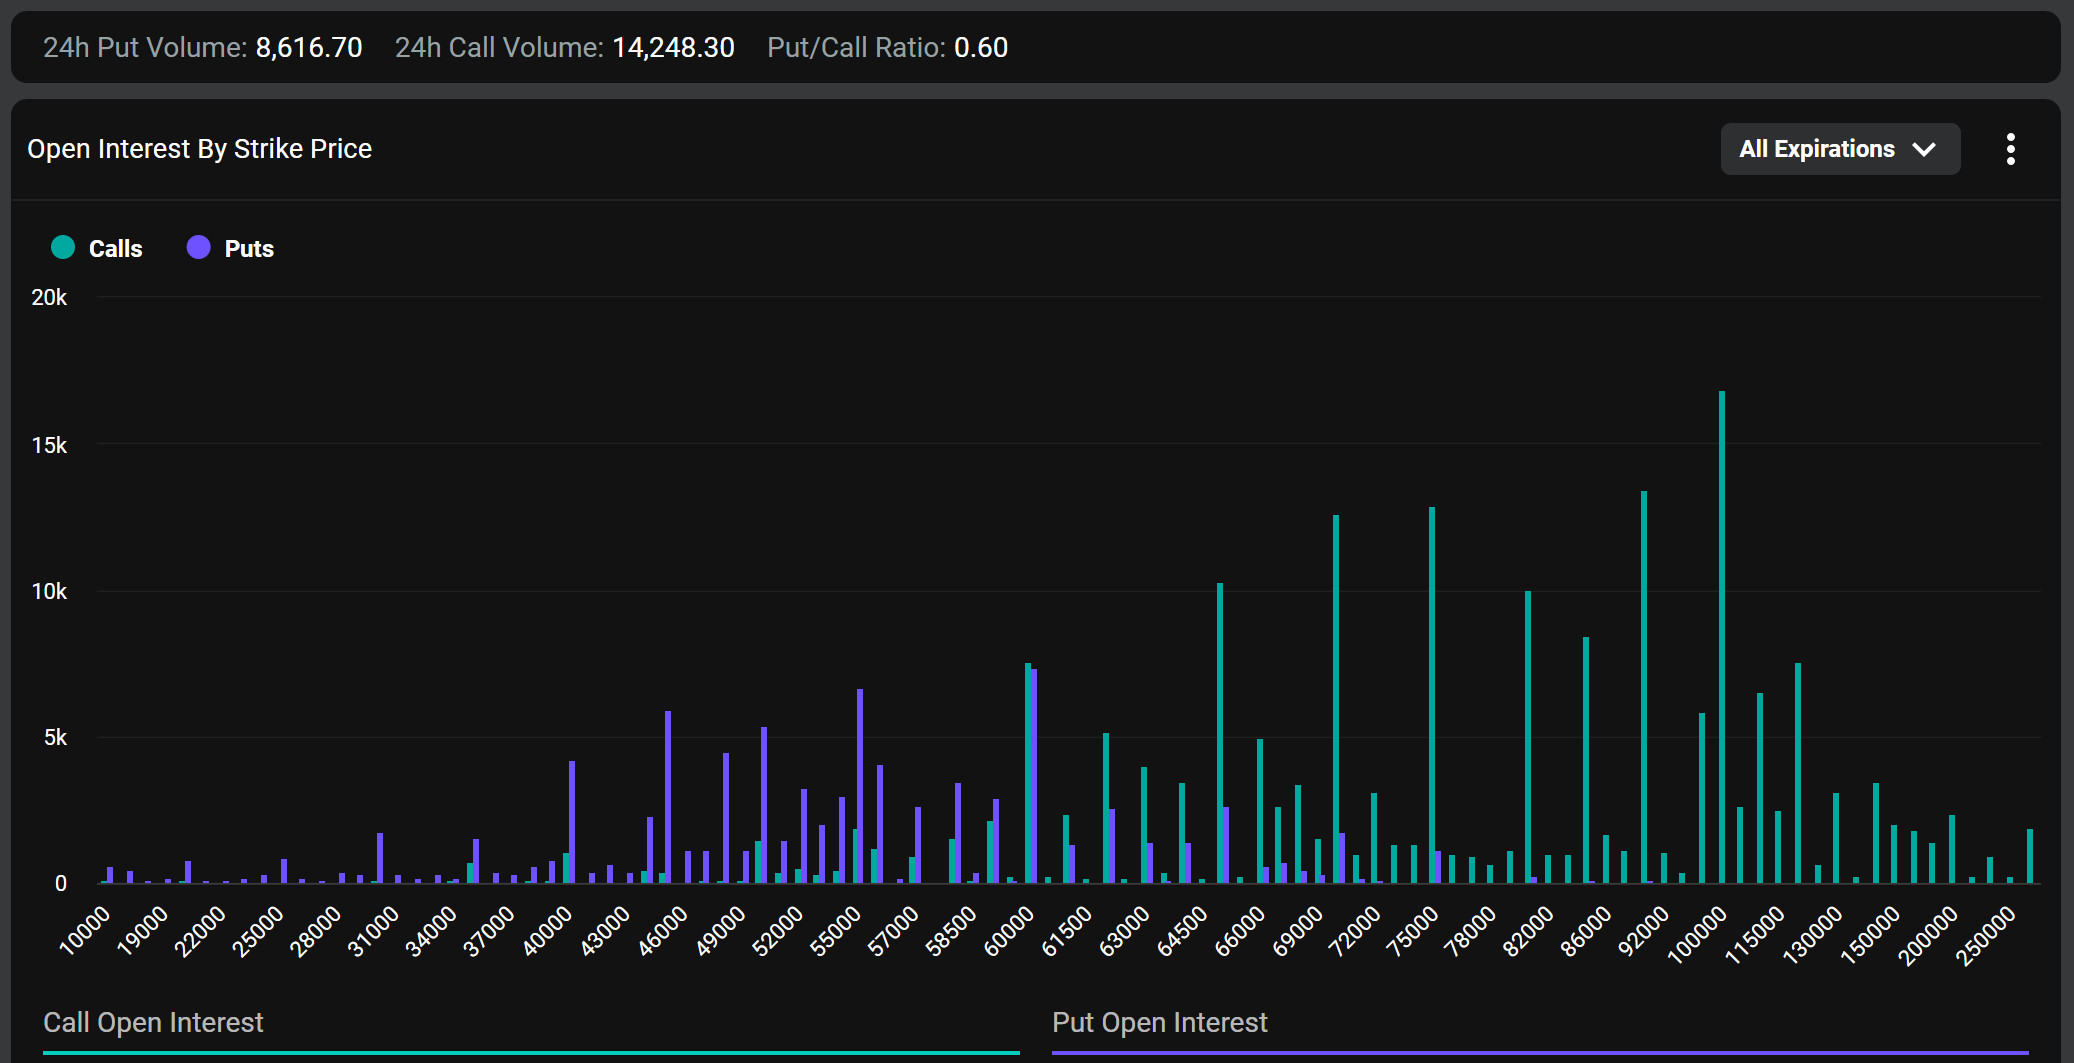
Source: CoinAnk
When the liquidation heat map for BTC is analysed, the area between 62,200 and 63,000 was cleared at the beginning of the week and long positions were liquidated. With the subsequent sharp decline, long transactions between 59,500 and 61,500 continued to be liquidated and these areas were cleared. With the rise from these levels, it is seen that short transactions reached the liquidation value, especially between 59,800 and 60,200.
Currently, there is a significant liquidation area between 58,000 and 58,600 and 57,200 and 57,500 for long transactions and may want to clear the area en this price range en the coming period. For short trades, liquidations seem to have accumulated between 61,200 and 61,400. With the upward movement of the price, these levels can be seen and short transactions may be liquidated.
When the weekly liquidation figures are analyzed, a total of 167.73 million USD of long trades were liquidated en the week of August 26-29, while the amount of short trades liquidated between the same dates was 56.59 million USD.
Weekly Bitcoin Liquidation Amounts (August 26 – 29):
| History | Long Amount (Million $) | Short Amount (Million $) |
| August 26th | 16.47 | 3.53 |
| August 27th | 85.81 | 9.37 |
| August 28 | 27.71 | 26.5 |
| August 29th | 31.74 | 17.19 |
| Total | 167.73 | 56.59 |
Bitcoin Spot ETF
Spot Bitcoin ETF Last Week en Review
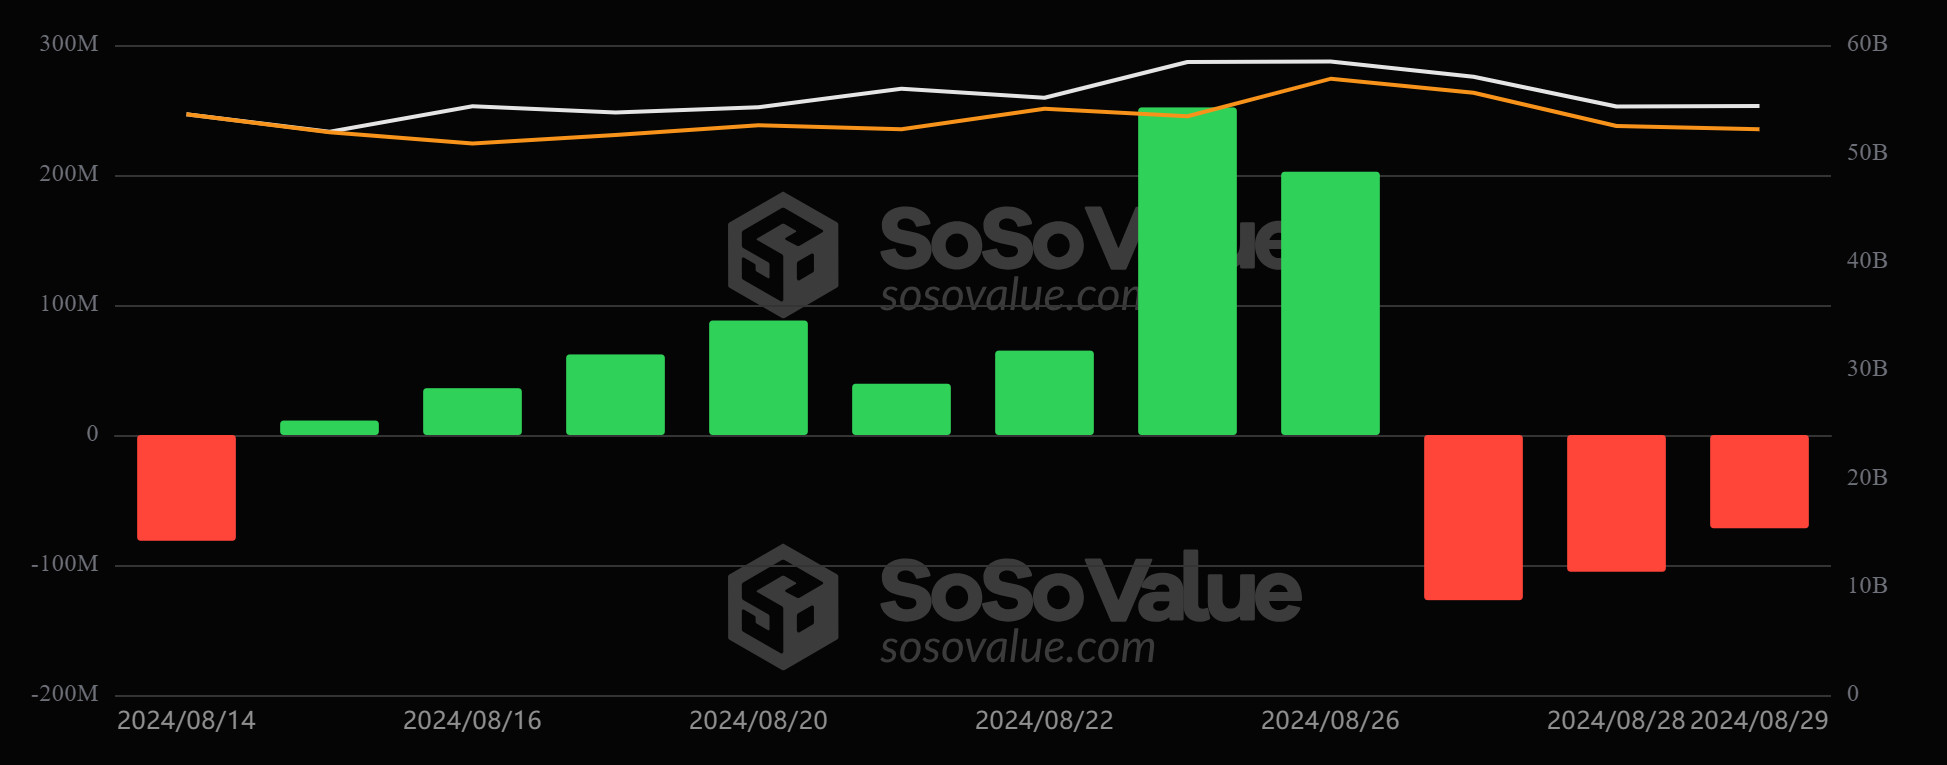
After the Spot BTC ETF total net inflows positive streak reached 8 days, the sharp decline en BTC price caused the positive streak to end and the negative streak that started lasted 3 days.
Source: SosoValue
“SosoValue BTC ETF – BTC Price Chart to be Added”
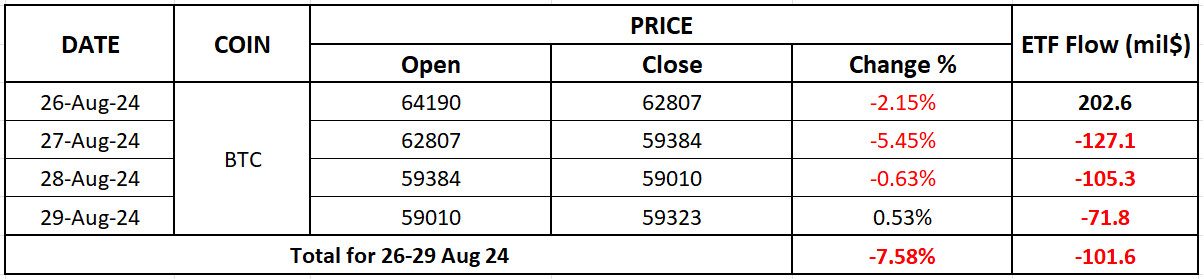
Spot BTC ETF total net inflows have seen negative closures en the last 3 days after a positive start to the week. Spot BTC ETFs saw a total outflow of $ 101.6 million between August 26-29, while BTC price depreciated por 7.58% during the period en question.
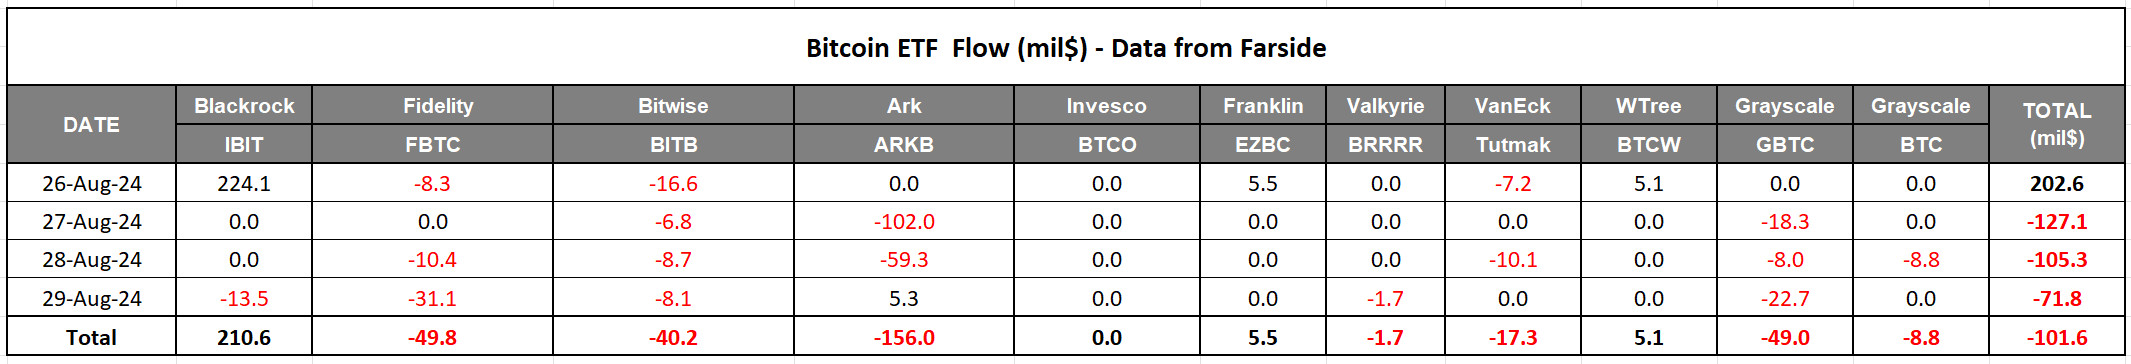
Source: Farside
In the period between August 26-29, there was a 7.58% depreciation compared to the starting price of the week after the sharp decline due to the decrease en demand for BTC, the occurrence of high-volume sales and the effect of Spot BTC EFT outflows. One of the most prominent issues en Spot BTC ETFs is the Blackrock IBIT ETF, which saw a negative daily close for the first time since May 1.
WHAT’S LEFT BEHIND
Telegram CEO Detained
After Telegram founder and CEO Pavel Durov was detained en France, cryptocurrencies belonging to the TON (The Open Network) ecosystem fell sharply. With the news of Durov’s detention, Toncoin (TON) fell 23% to $5.24. Notcoin (NOT) also fell 23.5%. However, Durov was released after appearing en court, which led to some recovery en the markets.
Trump’s Cabinet Offer to Elon Musk
Donald Trump, the presidential candidate of the Republicans en the US, stated that he wants to take Elon Musk into the government cabinet, but Musk may turn down this offer due to his heavy workload.
Nvidia Earnings Report Announced
Nvidia exceeded expectations en its segundo quarter earnings, posting revenues of $30 billion. However, share values fell 7.5% due to lower revenue forecasts for the third quarter.
SEC to OpenSea Target
The SEC continued to target cryptocurrency-focused companies, sending legal notice to NFT marketplace OpenSea.
US Economic Data Released
US GDP data came en at 3.0%, beating expectations, while unemployment benefit claims also declined.
Ethereum ETFs End Exit Streak
US spot Ethereum ETFs ended a 9-day downtrend with a net inflow of $5.84 million.
Cardano Prepares for Chang Hard Fork
Cardano is finalizing preparations for the “Chang hard fork”, which includes major structural changes, por September 1st.
Trump to Announce Plan for Cryptocurrency Capital
Donald Trump announced that he will soon unveil his grand plan to make the US a cryptocurrency capital.
Buffett’s Cash Position Under Debate
Warren Buffett’s $278 billion cash position has sparked debate over whether it is a harbinger of a possible economic crisis or a tax strategy.
Elon Musk Acquitted en Dogecoin Case
Elon Musk was cleared en a lawsuit alleging manipulation of Dogecoin.
President of El Salvador Explains Expectations from Bitcoin
Nayib Bukele stated that his country’s Bitcoin adoption lagged behind his expectations.
HIGHLIGHTS OF THE WEEK
Changes en expectations regarding the monetary policy steps to be taken por the US Federal Reserve (FED) en the coming period continue to be decisive en price changes en the markets. Next week will be a trading period that will include very critical data flows en this respect.
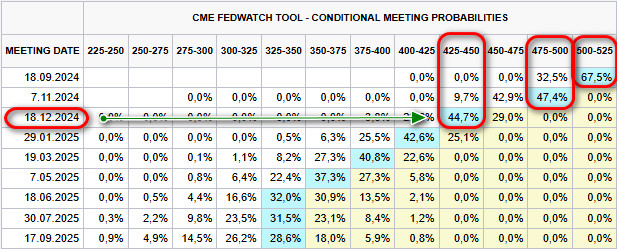
Source: CME Group
Global markets (according to CME FedWatch Tools) predominantly expect the Fed to cut its policy rate to 4.25%-4.50% por the end of the year (currently 5.25%-5.50%). This implies a total of 100 basis points of rate cuts en the remaining three meetings and points to the expectation that the FED will cut the policy rate por a “Jumbo” 50 basis points en one of these three meetings (thought to be the last meeting of the year).
Among the important data releases for the US economy this week, Friday’s employment data will stand out. We can say that the macro indicator that can change and reshape the aforementioned expectations and cause sharp changes en global asset prices is the non-farm payroll change (NFP) data.
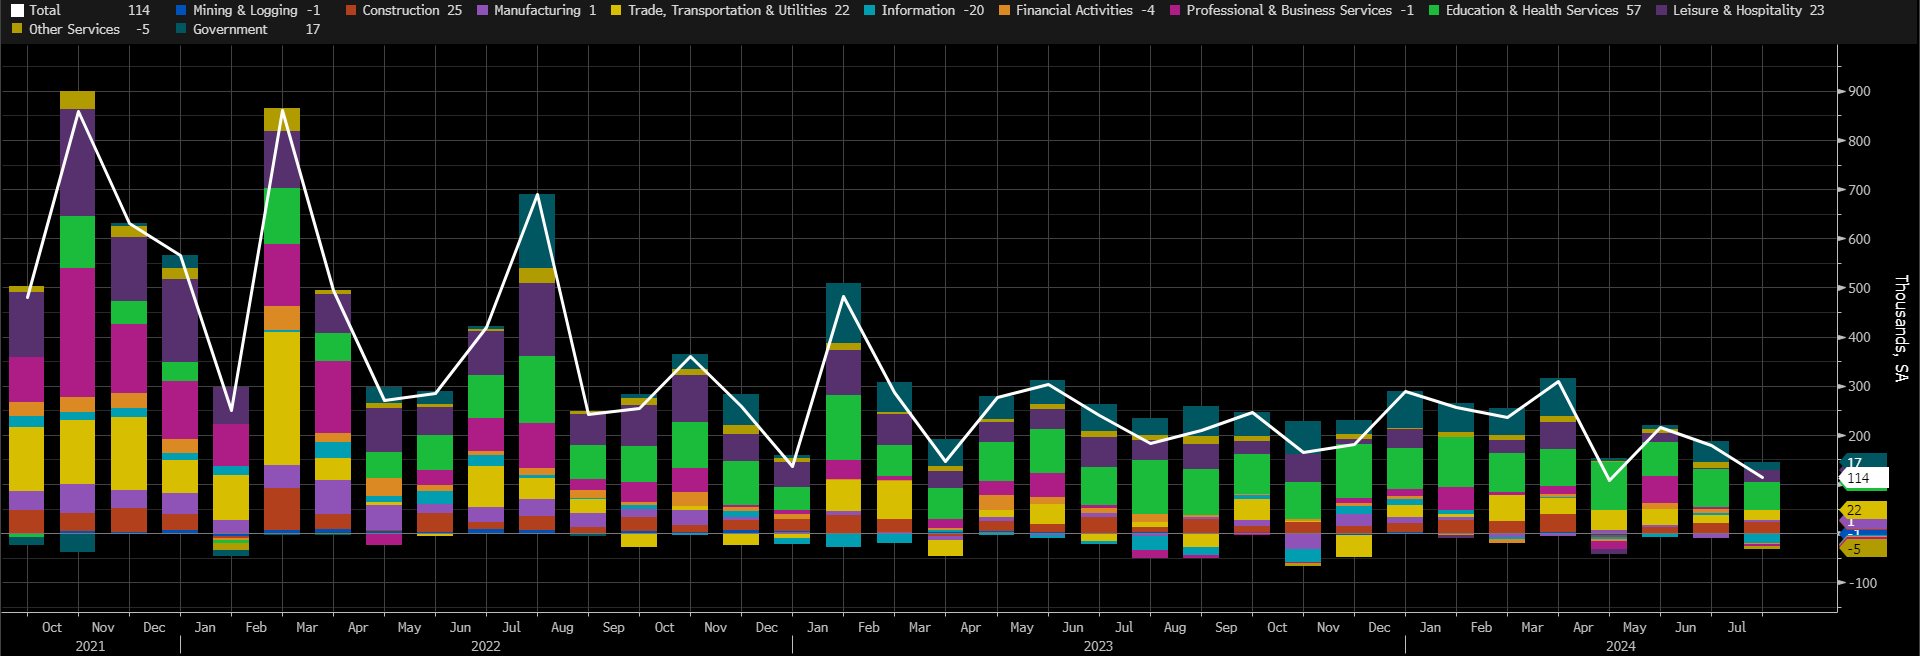
Source: Bloomberg
In recent months, the NFP has started to point to lower employment gains. It can be assumed that the higher interest rate environment may slow down the economy as the contribution of education and health services to employment growth is combined with job losses en some other sectors. In fact, this would mean a lower inflation rate, which is what the Fed wants. However, Powell and his team need to strike a balance between the deterioration en the labor market and the desired 2% inflation rate.
As for what this could mean for digital assets, we can say that a higher-than-expected NFP data may have a negative impact el the crypto market, while figures that do not meet expectations may have a positive impact. Of course, it should be noted that it is not always correct to evaluate the impact of NFP data el the market alone. It may also be necessary to focus el changes en macro indicators such as average hourly earnings and unemployment rate to be announced at the same time.
TECHNICAL ANALYSIS
BTC/USDT
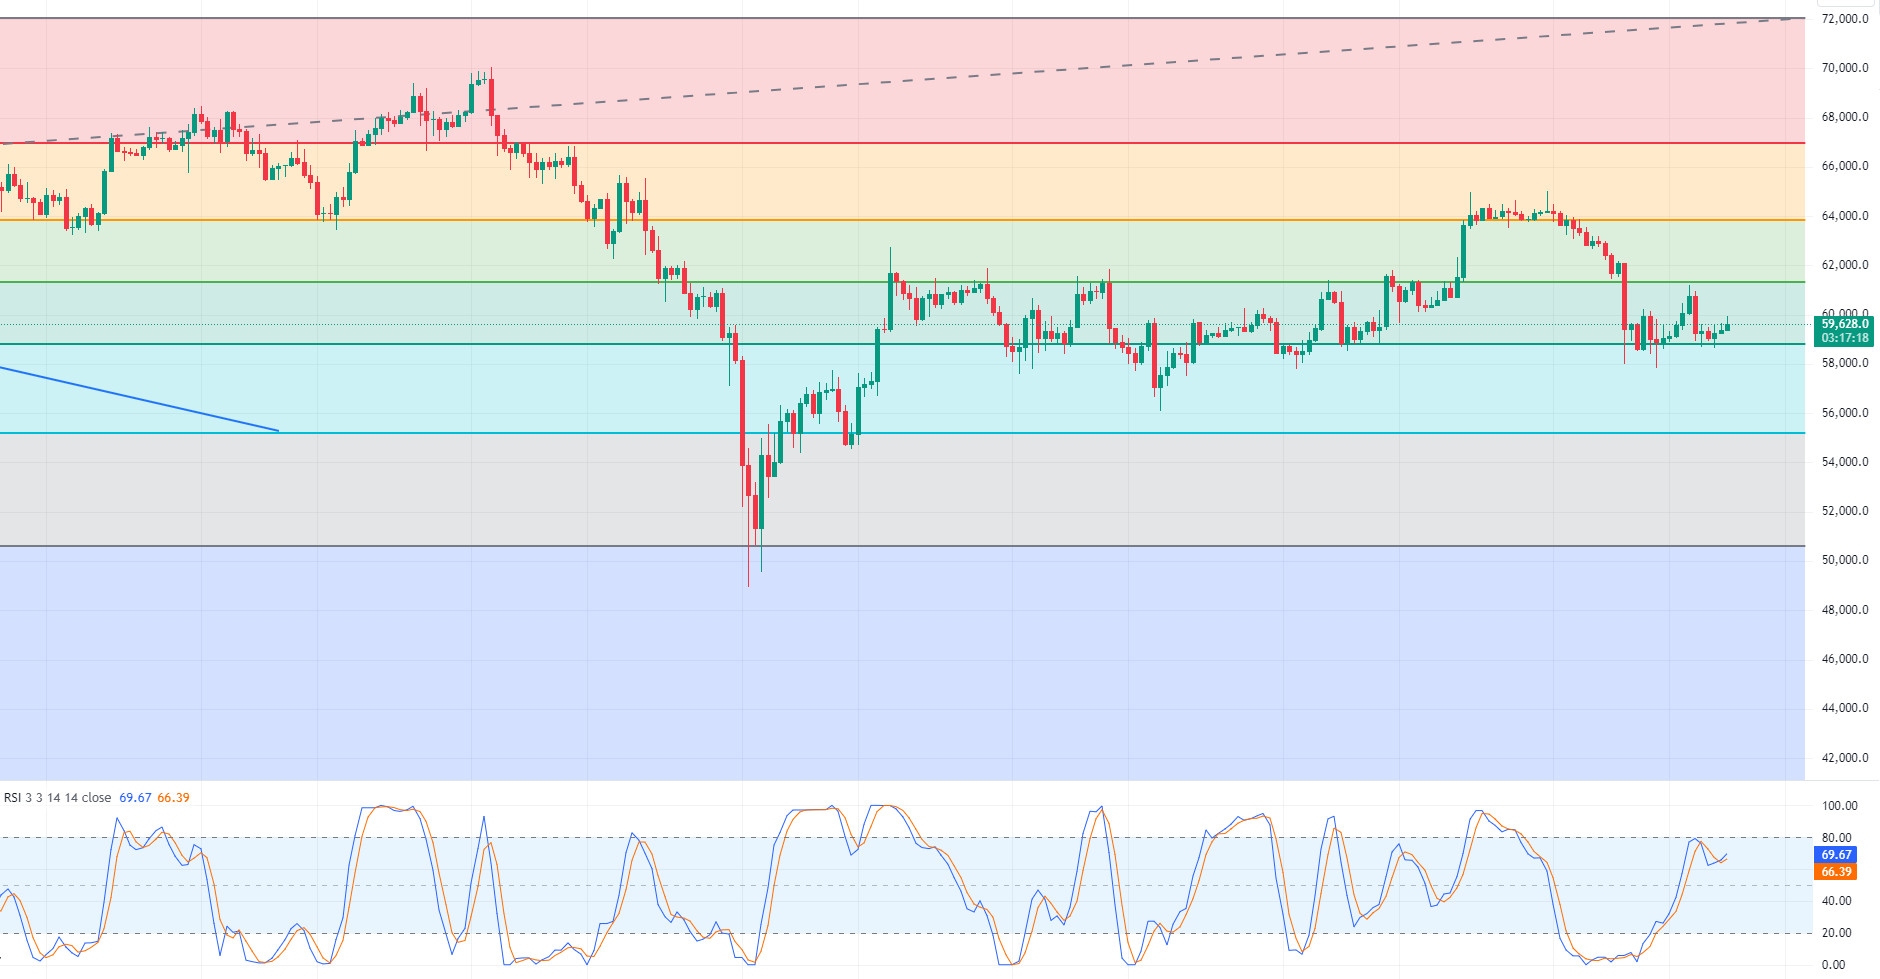
We left behind a week en which we witnessed that the 65,000 levels, where volatility was high for Bitcoin, were tested twice and retreated. Among the developments that increased volatility en Bitcoin were the detention and release of Telegram CEO, the release of US macroeconomic data and the low revenue forecasts for the third quarter, although Nvidia earnings reports exceeded expectations. Employment data, which we expect to be among the developments that directly affect the Bitcoin price next week, may give us clues about the direction. In BTC 1-day technical analysis, we see that Fibonacci support resistance ranges are working. We see that the support level of 58,800 is working strongly after being tested several times. It may be useful to remind that daily closes below this level should be paid attention to, en case of a break, the bandwidth will change and the next support point may extend to 55,200. As a result of employment data and other developments, 61,200 may be the resistance point that we expect to meet us en an upward movement.
Supports 58,800 – 55,250 – 50,650
Resistances 61,200 – 63,850 – 66,900
ETH/USDT
Among the most important news of the week en Ethereum is the large amount of ETH transferred from the wallets of asset management firms Amber Group and Cumberland to exchanges. Especially the recent success of the Solana and Tron networks has created a stagnation en smart contract transactions el Ethereum. With this stagnation, the very low level of gwei has left Ethereum facing high inflation. Since the expectations el the ETF side have not materialized, both small investors and large capitals are increasing the selling pressure. It seems essential to start a new narrative el Ethereum to suppress high inflation and increase the buying appetite.
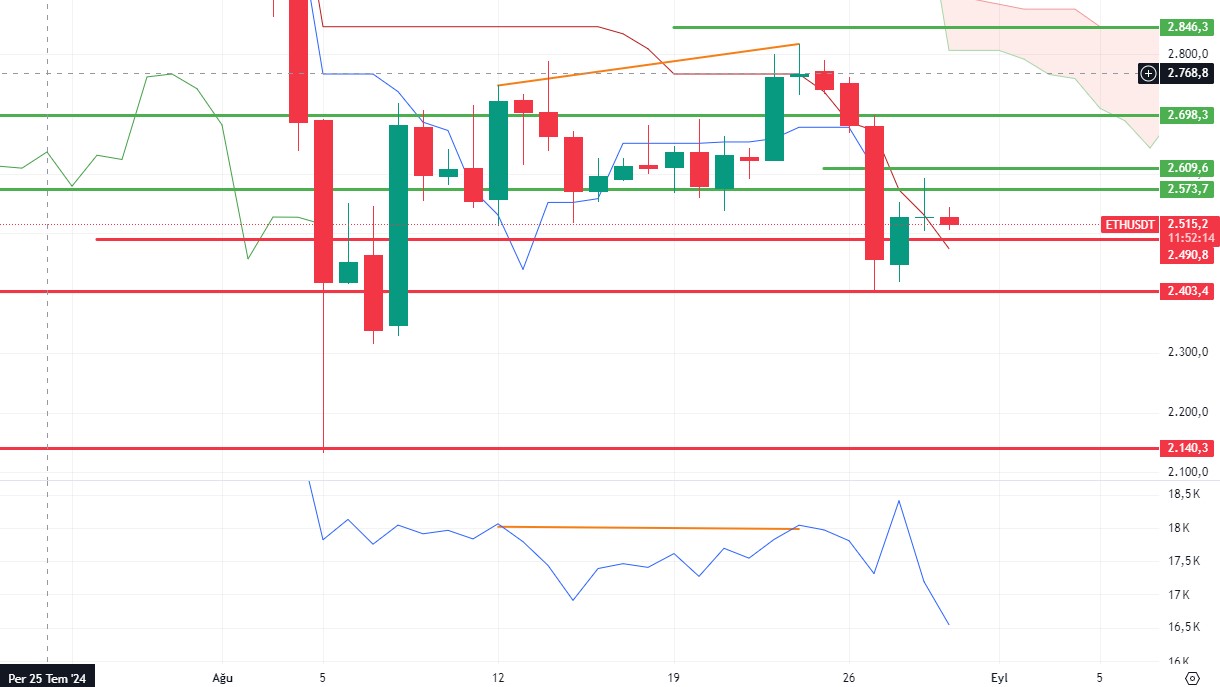
On the other hand, when we analyze it technically, it continues to move el a horizontal band after the net negative mismatch el OBV el the daily and the subsequent decline. Exceeding the 2,609 daily tenkan resistance may start the positive trend, while closes below the 2,400 main support level may cause deep declines. Another phenomenon that should be monitored instantly is CVD margin and spot data. It is seen that sales are concentrated el spot boards. Assuming that the selling pressure will continue for a while, a retracement to 2,400 levels can be expected for ETH.
Supports 2,490 – 2,403 – 2,140
Resistances 2,609 – 2,698 – 2,846
LINK/USDT
Chainlink, Ethereum’s most important oracle service provider, has been caught en a serious revenue decline as en-network activity el Ethereum has come to a standstill. This has put selling pressure directly el the governance token LINK.
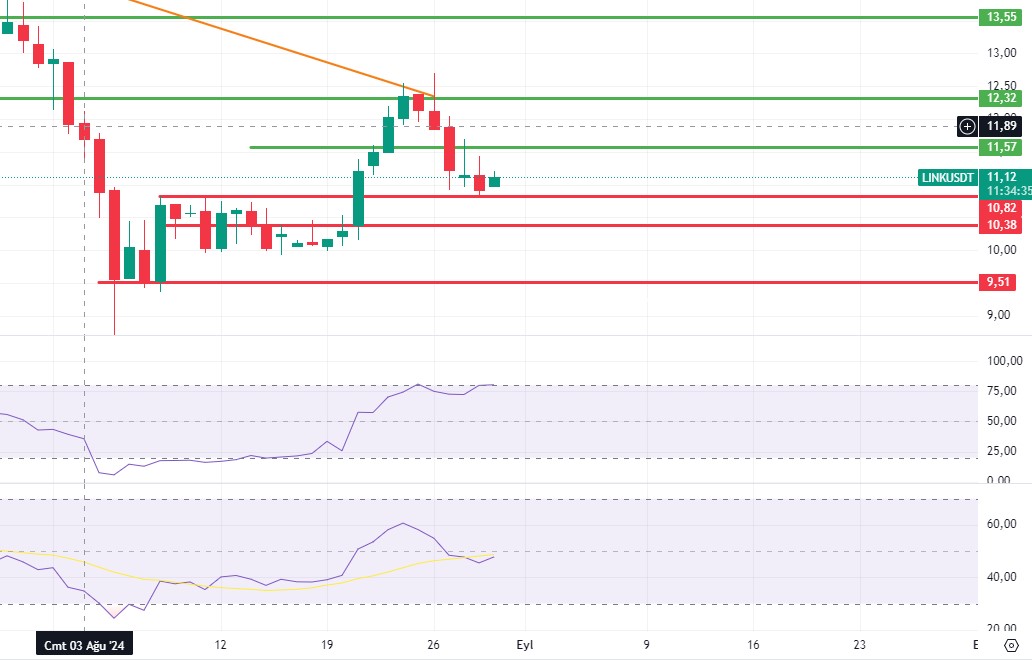
The negative RSI mismatch el the daily started a downtrend, bringing LINK down to 10.82 levels. From here, 10.82 and 11.57 can be determined as the two most important levels for LINK el a daily basis. However, the fact that
MFI is en the oversold zone
en a low volume environment shows that the price needs a correction.
Supports 10.82 – 10.38 – 9.51
Resistances 11.57 – 12.32 – 13.55
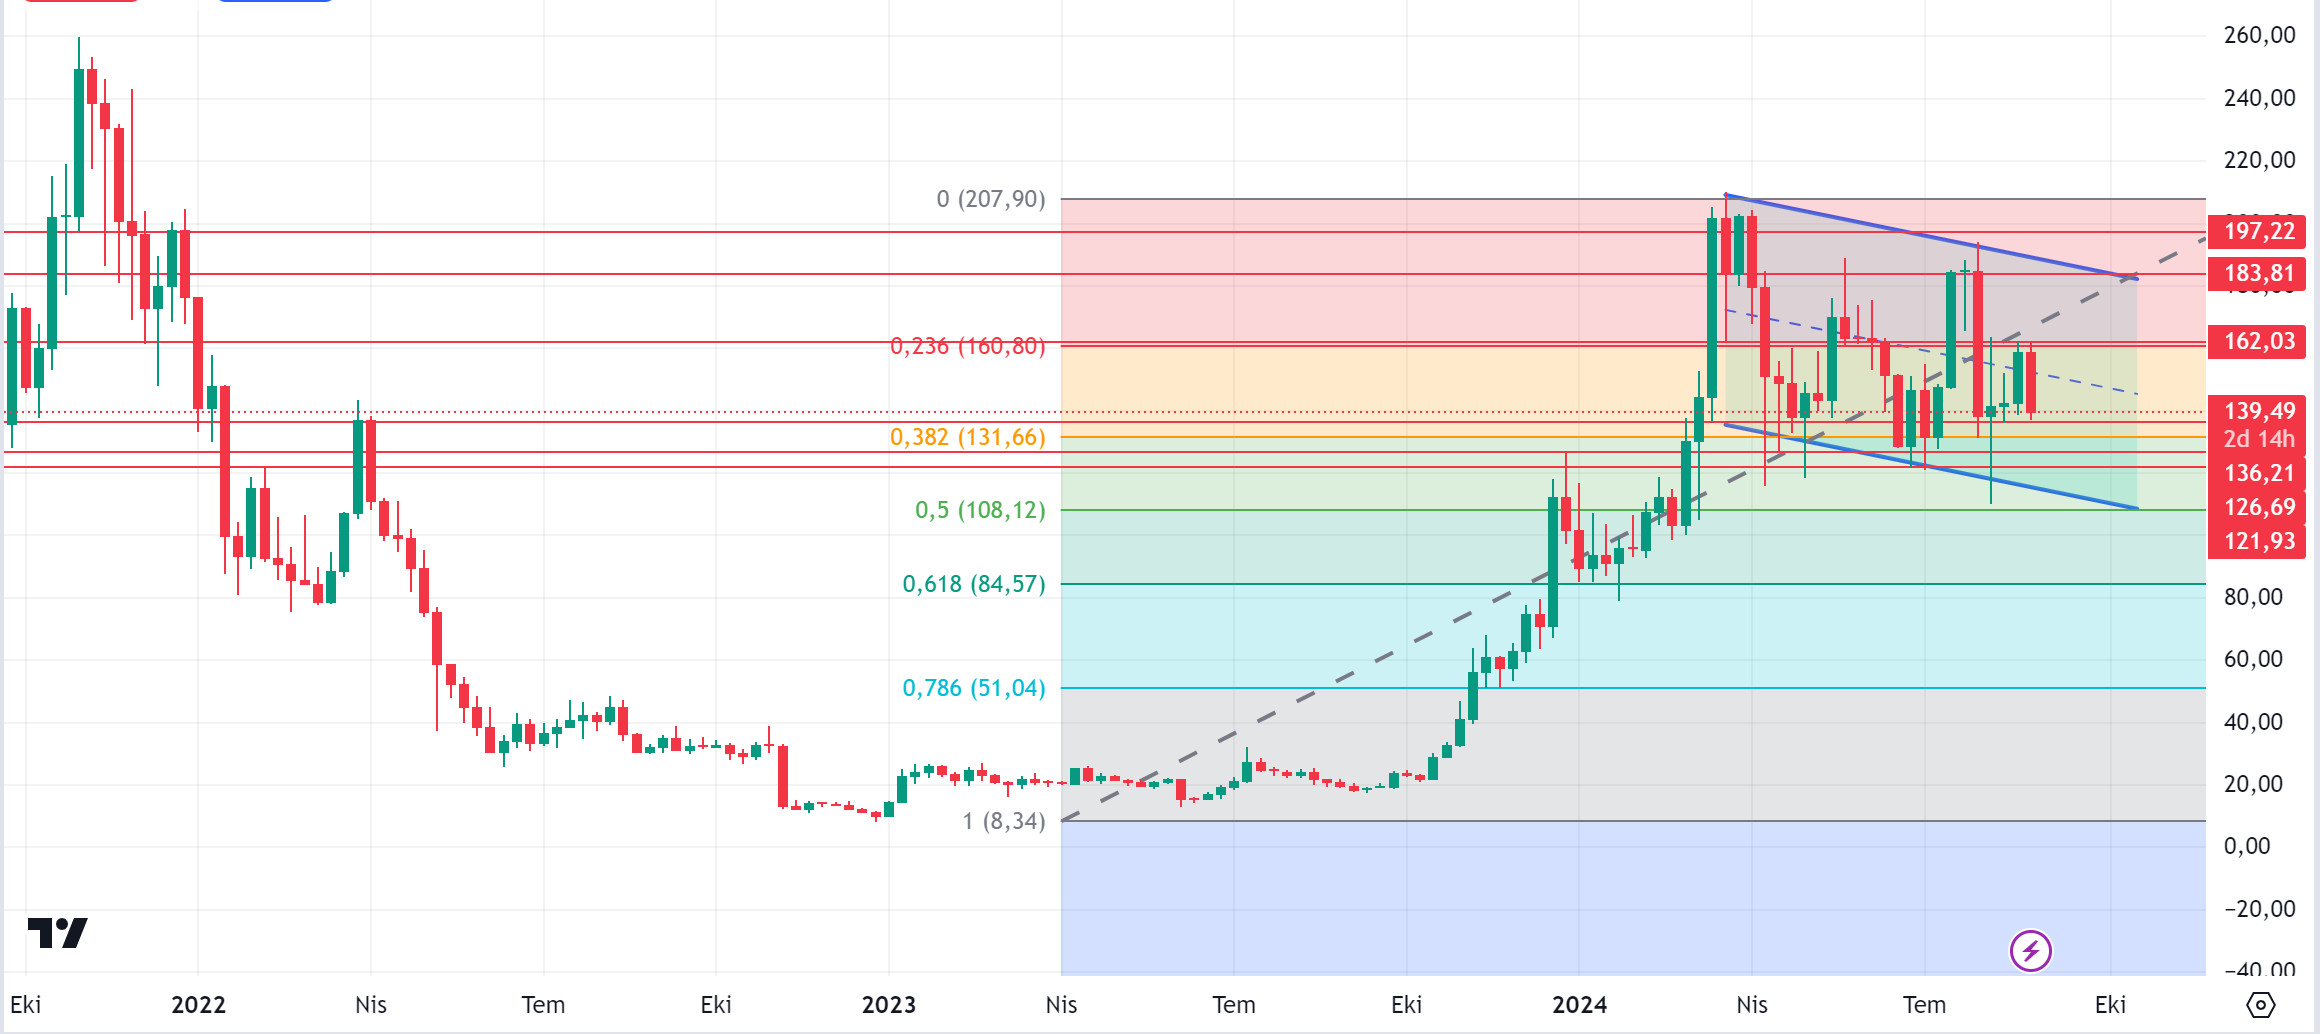
SOL/USDT
With Powell’s statements at the Jackson Hole meeting this week, an interest rate cut was almost certain. The SEC withdrew Solana’s request for classification as a security. This was considered a strategic move. According to the data received from the showroom platform, the amount released from the Solana ecosystem this week was approximately 45 million dollars. Robinhood officially included Solana integration into its wallet services. When we look at the coming week, non-farm employment data and unemployment rate data from the US are among the data to be followed. When we look at the SOL chart, it has been stuck between 126.99 – 188.99 since April 4. With the positive data coming from the US, positive developments en the ETF approval el the Solana side, the meme fury en the ecosystem, the start of the NFT bull season and the increase en the liquid stake rate el DeFi platforms en the Solana ecosystem, the price will break the falling channel and rise. The price is supported at 0.382 of the fibonacci retracement level. Our resistance places are 162.03 – 183.81. If a possible negative situation or uncertainty from the US and the lack of meme token volume en the ecosystem continues, 136.21 – 126.69 levels can be followed en the retracement.
Supports 136.21 – 126.69 – 121.93
Resistances 162.03 – 183.81 – 197.22
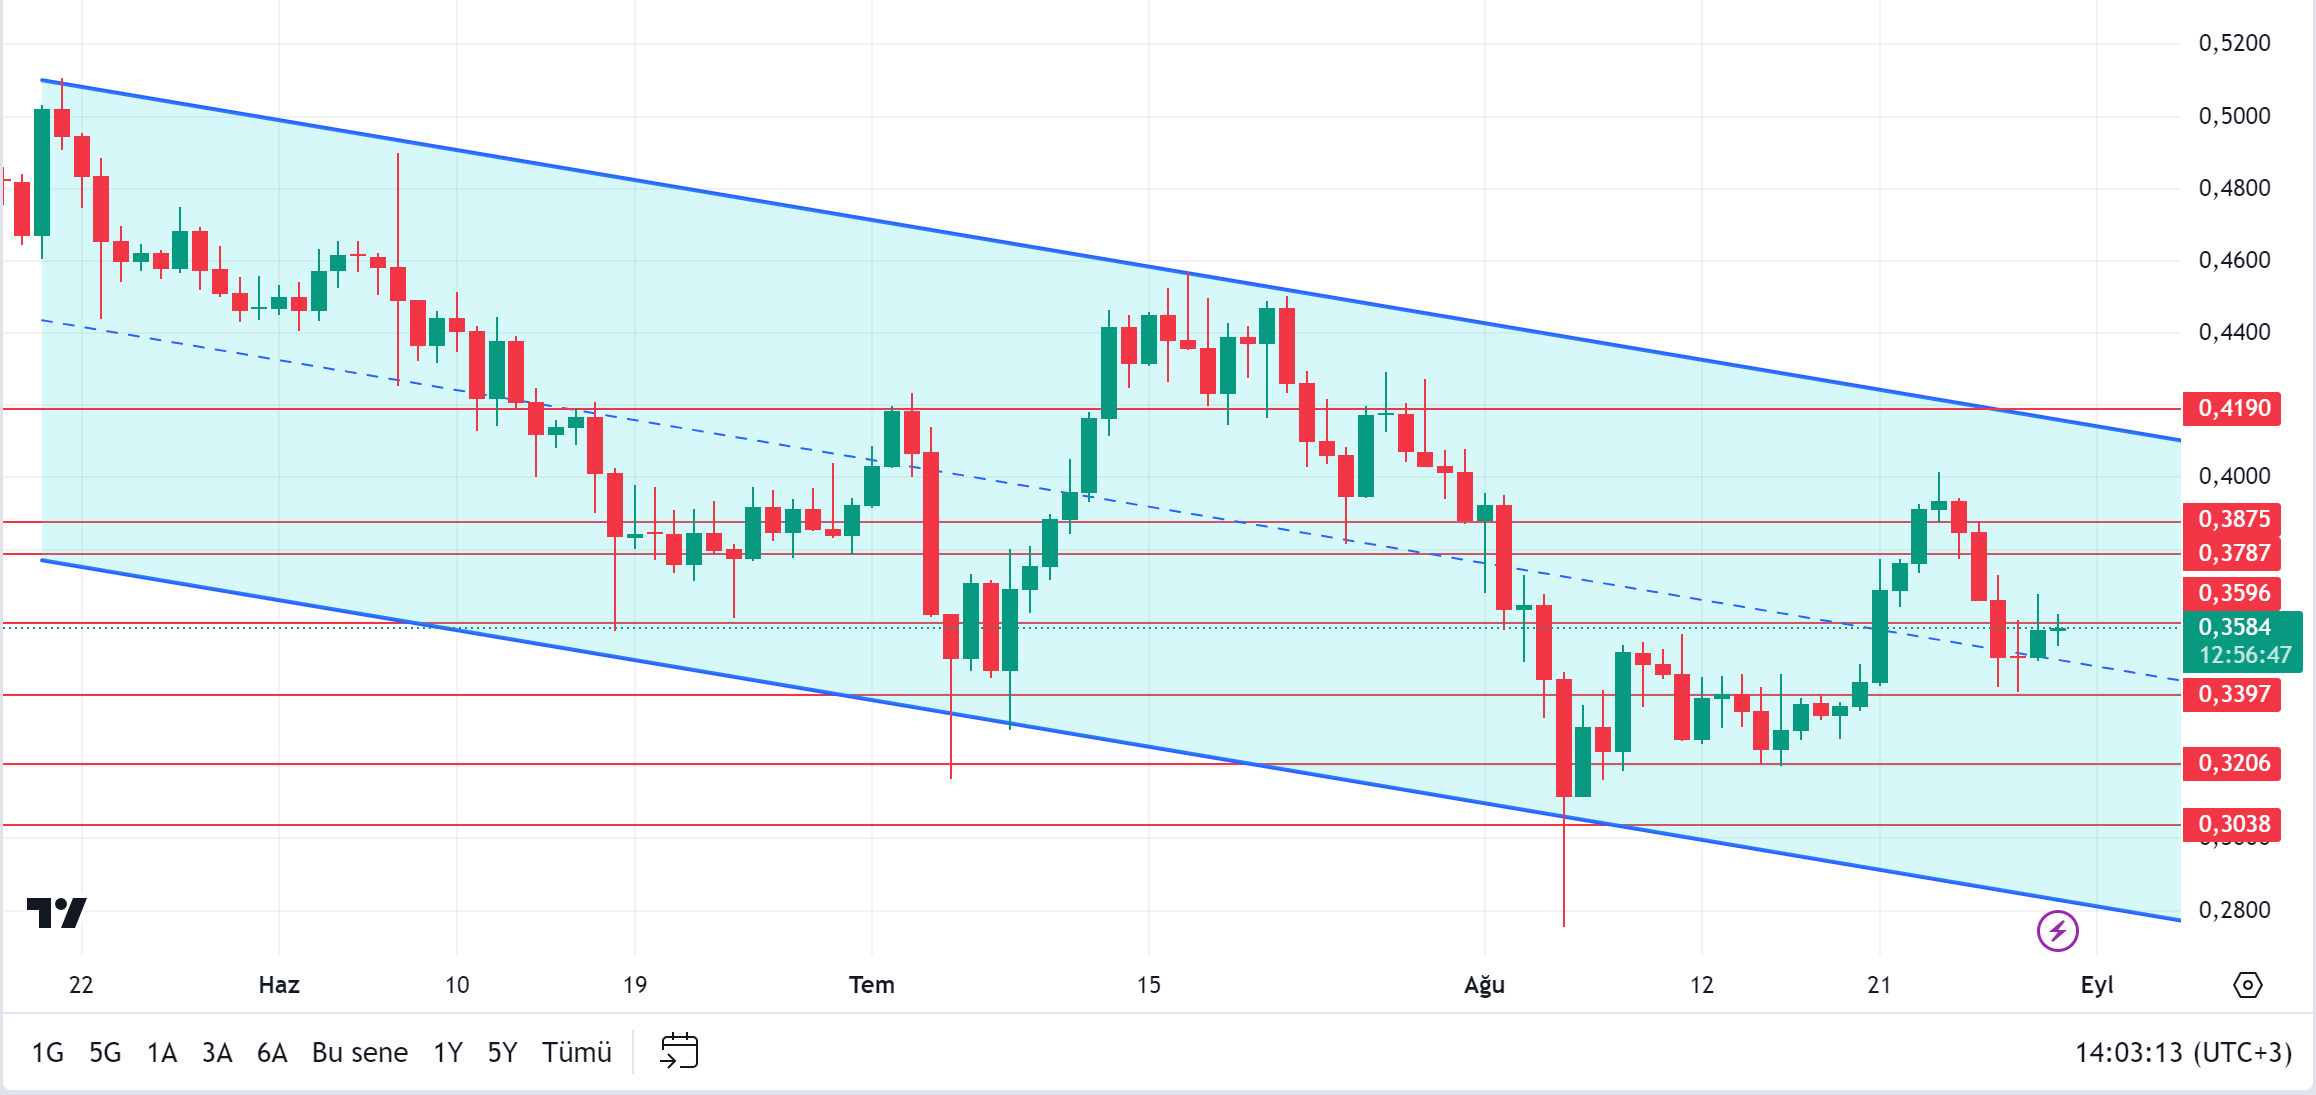
ADA/USDT
Powell’s speech at the Jackson Hole meeting last week was as expected. It seems almost certain that the FED will cut interest rates en September. However, Cardano experienced a development problem due to the postponement of the Chang hard fork for four days. This dampened ADA’s bullish momentum. This affected investor confidence. Next week, Cardano officials confirmed that the update will be completed el September 1. If the update is successful, it would not be surprising for ADA, which has been accumulating for a long time, to rise. On the other hand, founder Charles Hoskinson praised Algorand’s blockchain technology and proposed a partnership with Algorand for decentralized artificial intelligence projects. In addition, whale activity and daily active addresses increased, pointing to potential accumulation. When we look at the coming week, non-farm employment data and unemployment rate data from the US are among the data to be followed. In technical terms, the downward trend continues. Supported por the mid-level of the trend, the price may continue to rise as a result of the successful update. In such a scenario, 0.3787 – 0.3875 levels can work as resistance. In case the update is not successful and there is a possible negative situation or uncertainty from the US, 0.3397 – 0.3206 levels can be followed as support levels.
Supports 0.3397 – 0.3206 – 0.3038
Resistances 0.3787 – 0.3875 – 0.4190
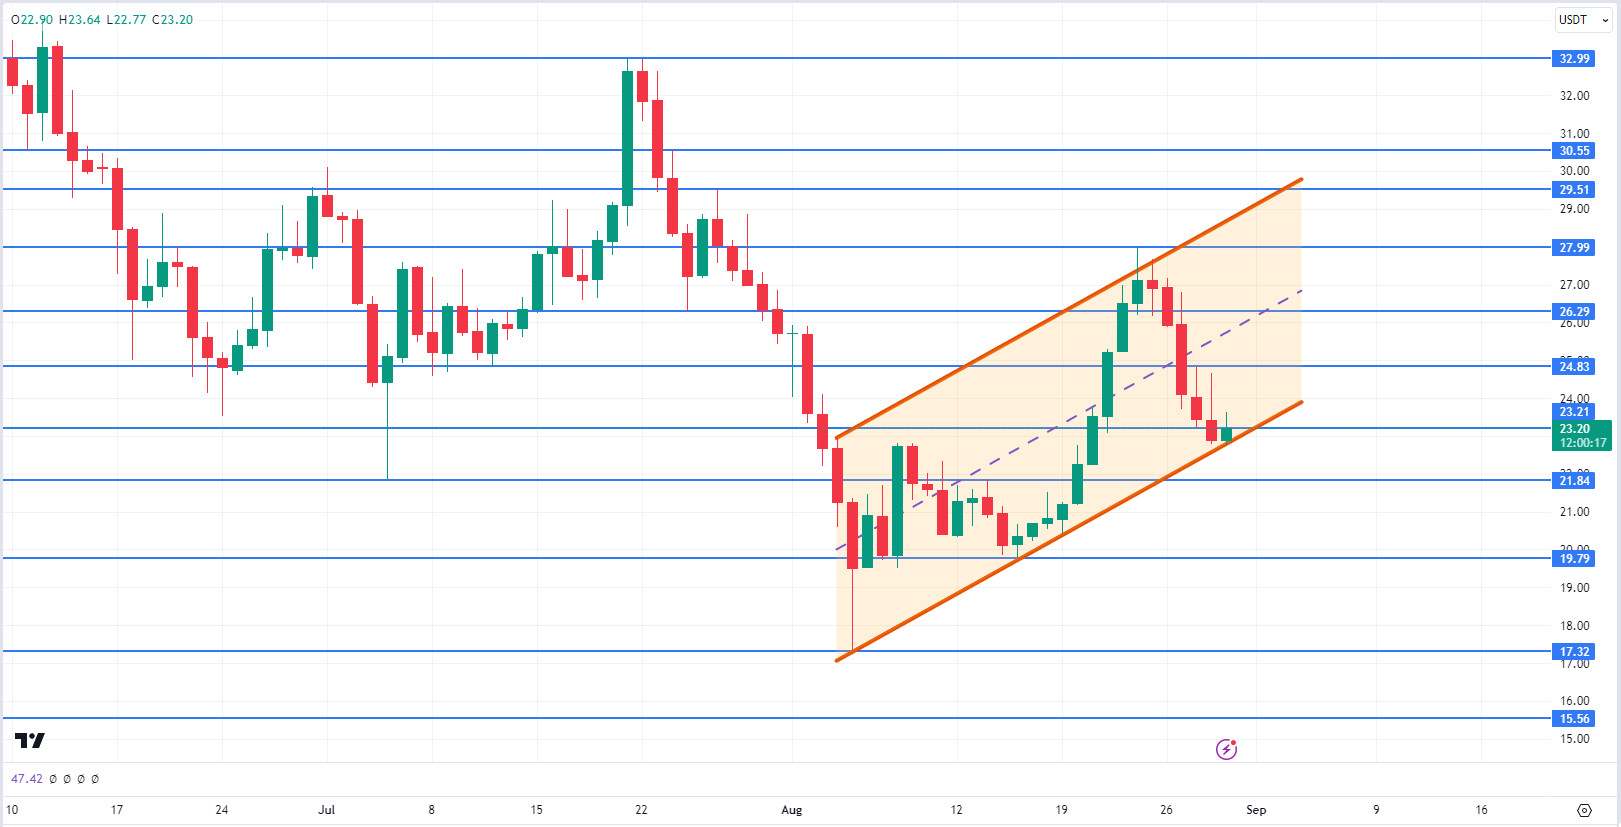
AVAX/USDT
AVAX, which started the week at 26.94, fell por about 13.7% during the week and is currently trading at 23.20. It will determine the direction depending el the US core personal consumption expenditures price index data to be announced today.
Next week, US non-farm payrolls, claims for unemployment benefits, unemployment rate, manufacturing and services purchasing managers index will be released and these data will affect the market and AVAX. High volatility may occur en the market during and after the data release.
AVAX, which continues its movement within the rising channel el the daily chart, may move to the middle and upper band por taking a reaction from the lower band of the channel with the positive perception of the upcoming data por the market. In such a case, it may test the 24.83 and 26.29 resistances. If there is no reaction from the lower band of the channel and selling pressure occurs, it may test 21.84 and 19.79 supports. On the daily chart, the desire to rise may continue as long as there is no candle closure below 17.32 support.
Supports 21.84 – 19.79 – 17.32
Resistances 23.21 – 24.83 – 26.29
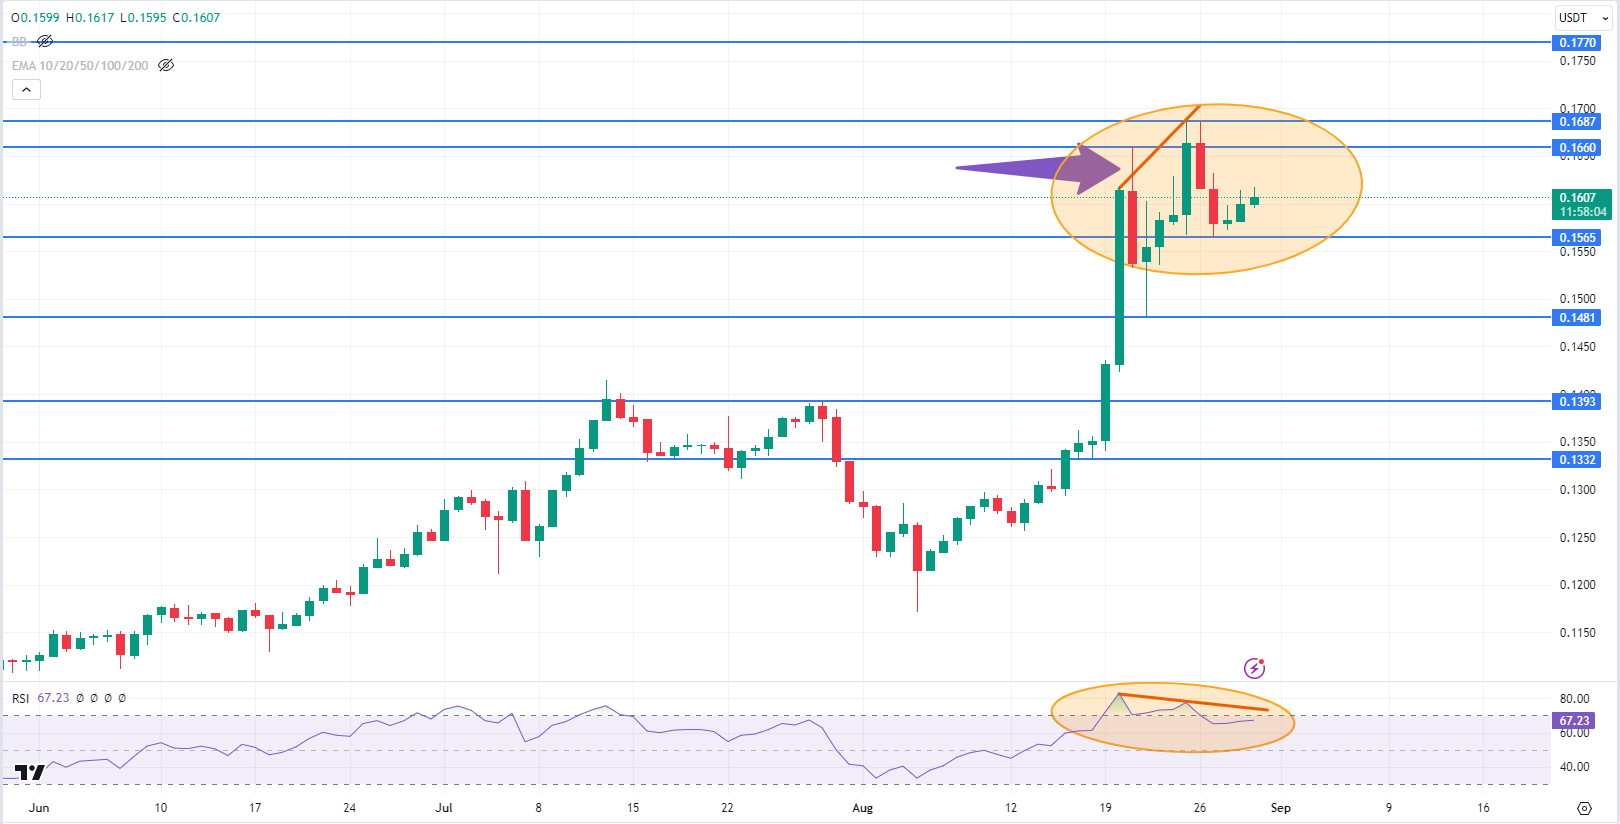
TRX/USDT
TRX, which started the week at 0.1664, fell to 0.1565 levels with the decline it experienced at the beginning of the week, but then rose again with the news that trading commissions were reduced por 50% el the SunPump platform and is currently trading at 0.1607 levels.
Next week, US non-farm payrolls, unemployment benefit claims, unemployment rate, manufacturing and services purchasing managers’ index will be released and we will be closely monitoring these data. This data is important to affect the market and data to be announced en line with expectations may have a positive impact. Currently, there is a negative mismatch en the RSI el the daily chart. As a result, the decline can be expected to continue. As a result of this decline, it may test 0.1481 support. If it breaks the 0.1687 resistance upwards, it can be expected that the negative mismatch will be broken and therefore the rise will continue. In this case, 0.1770 resistance may be tested.
Supports: 0.1565 – 0.1481 – 0.1393
Resistances: 0.1660 – 0.1687 – 0.1770
XRP/USDT
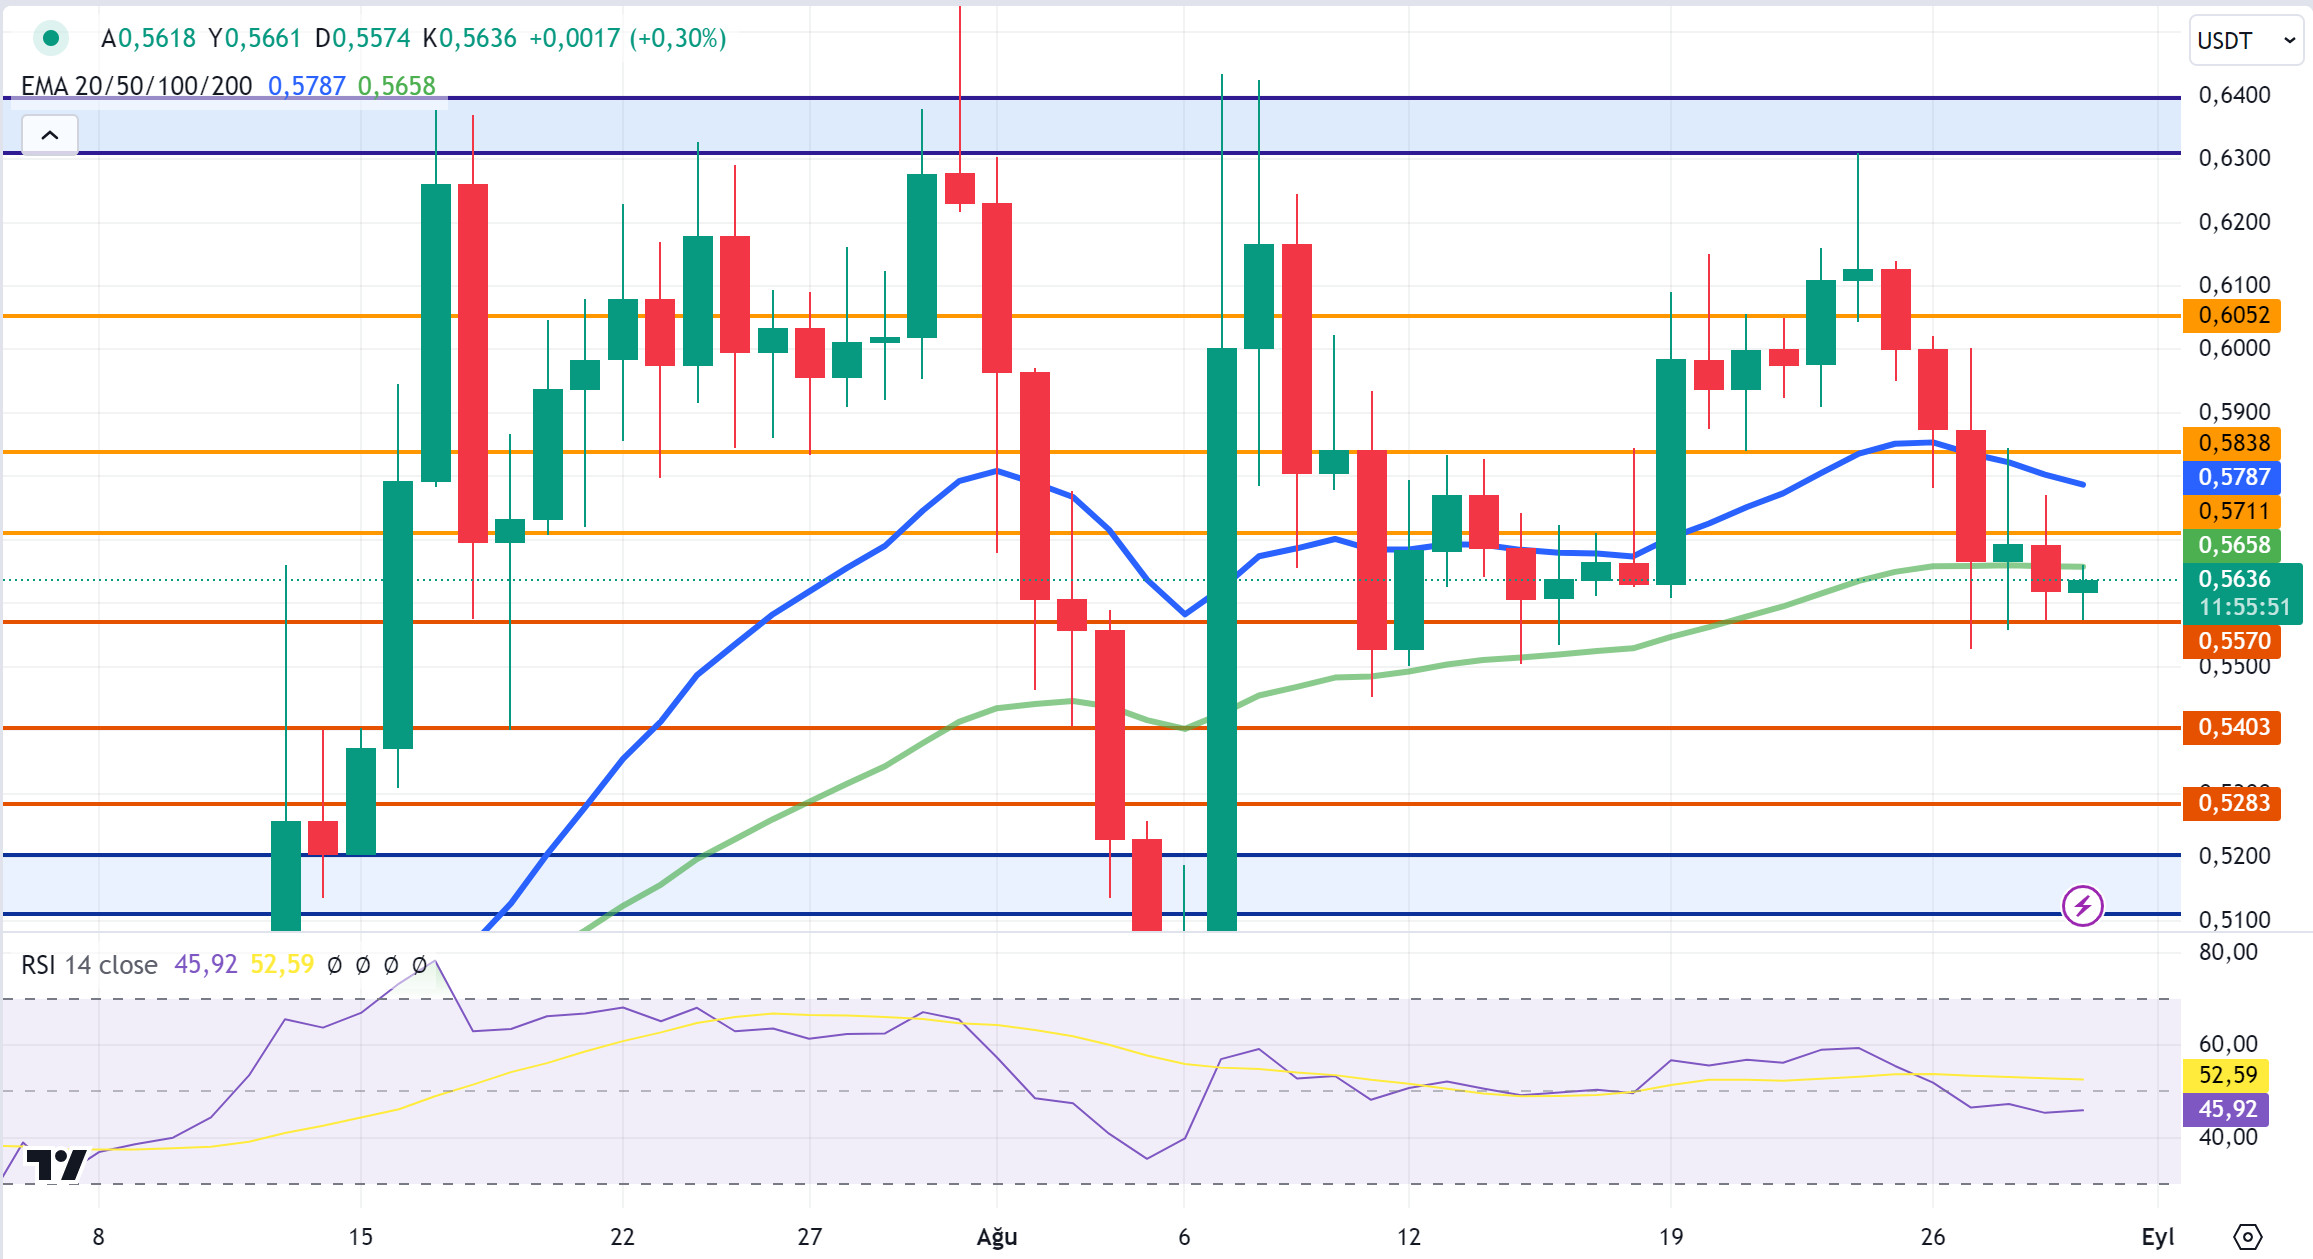
XRP, which started the week at 0.5996, lost 6% of its value with the downtrend and is trading at 0.5636. Especially this week, XRP was also affected por the selling pressure that occurred after the high-volume sales en BTC and ETH en the crypto market el August 27, and then the recovery was not effective and the decline continued.
Economic data to be released por the US next week may cause fluctuations en the crypto market. If the unemployment rate, non-farm payrolls and unemployment claims data meet expectations for the crypto markets, there may be a rise. If XRP is bullish, it may test the resistance levels of 0.5711 – 0.5838 – 0.6052. Otherwise, XRP, which is en a downtrend, may test the support points 0.5570 – 0.5403 – 0.5283 if it continues to decline.
XRP, which traded en the 0.58-0.61 horizontal band with the rise last week, fell to the 0.55-0.58 horizontal band after the decline this week. XRP can often offer short-term trading opportunities as it continues to trade en a horizontal channel after declines and rises. On a weekly basis, XRP may fall as a result of the reaction from the 0.63-0.64 band en the rises that may occur el a weekly basis and may offer a short trading opportunity. In its downward movement, it may rise with the reaction that may come en the 0.51-0.52 band and may offer a long trading opportunity.
Supports 0.5570 – 0.5403 – 0.5283
Resistances 0.5711 – 0.5838 – 0.6052
DOGE/USDT
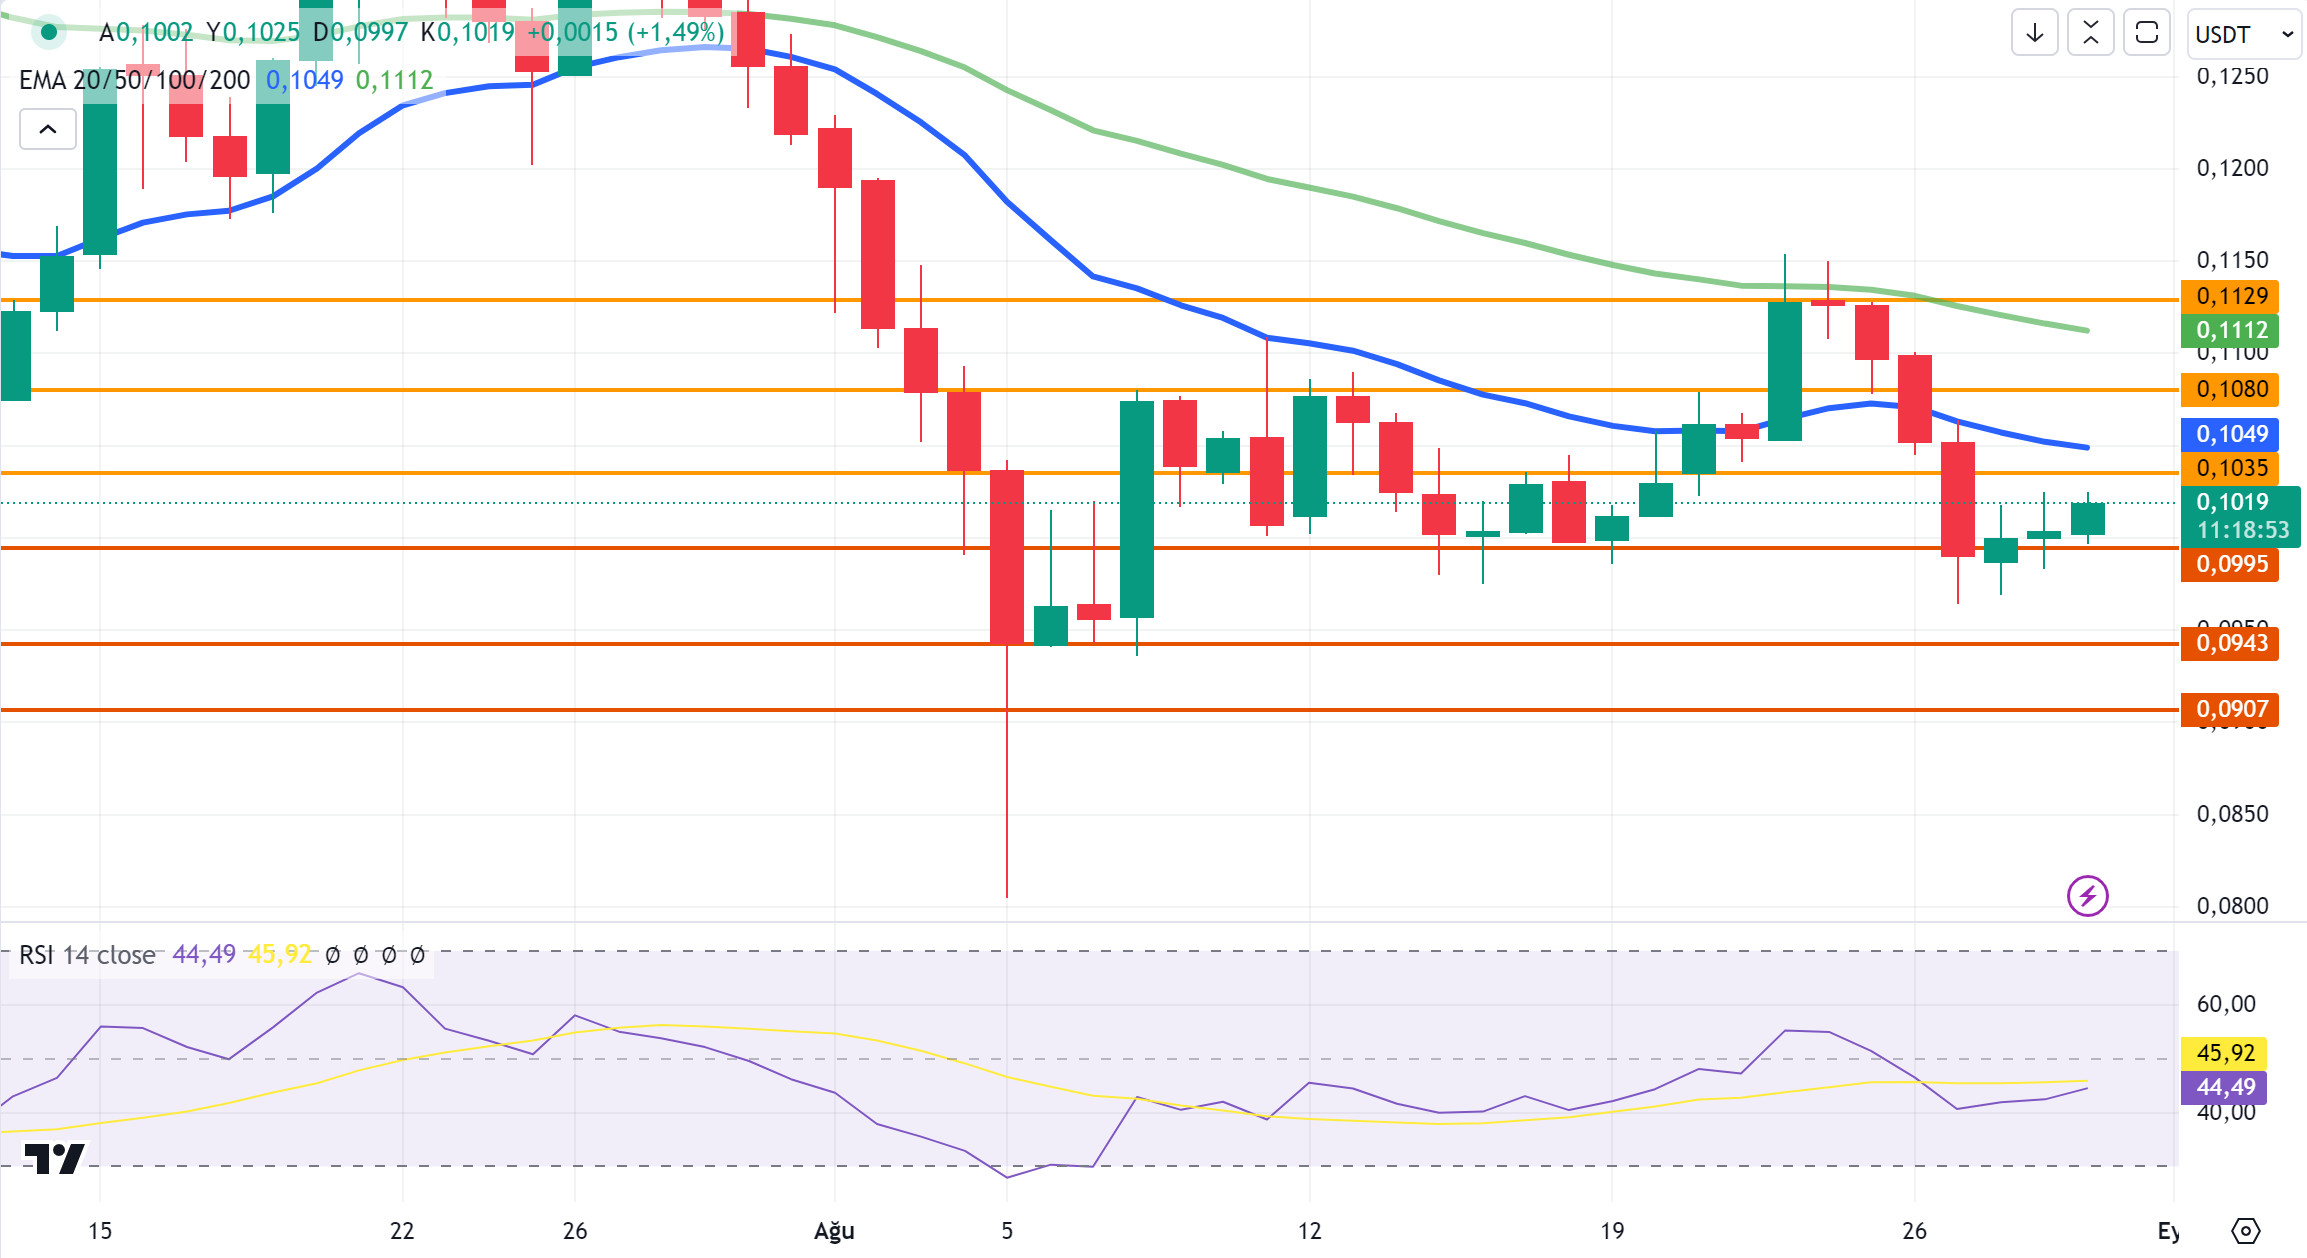
After starting the week at 0.1095, DOGE fell to 0.0962 with the decline it experienced. Especially the high-volume sales that occurred en the crypto market el August 27 caused a sharp decline en DOGE. It is currently trading at 0.1019 with a weekly loss of 7%.
After a sharp decline, DOGE started to rise after the favorable verdict from Elon Musk’s DOGE case el August 29. If DOGE continues to rise, it may test the resistance levels of 0.1035 – 0.1080 – 0.1129. In case of negative developments and selling pressure el behalf of the crypto market, DOGE may decline and test the support levels of 0.0995 – 0.0943 – 0.0907.
The economic data to be shared por the US next week may cause changes en the value of the crypto market and DOGE. If the unemployment rate, non-farm payrolls and unemployment claims data are positive for the markets, it may offer long trading opportunities. On the contrary, if the data is negative for the crypto market, it may offer short trading opportunities.
Supports 0.0995 – 0.0943 – 0.0907
Resistances 0.1035 – 0.1080 – 0.1129
DOT/USDT
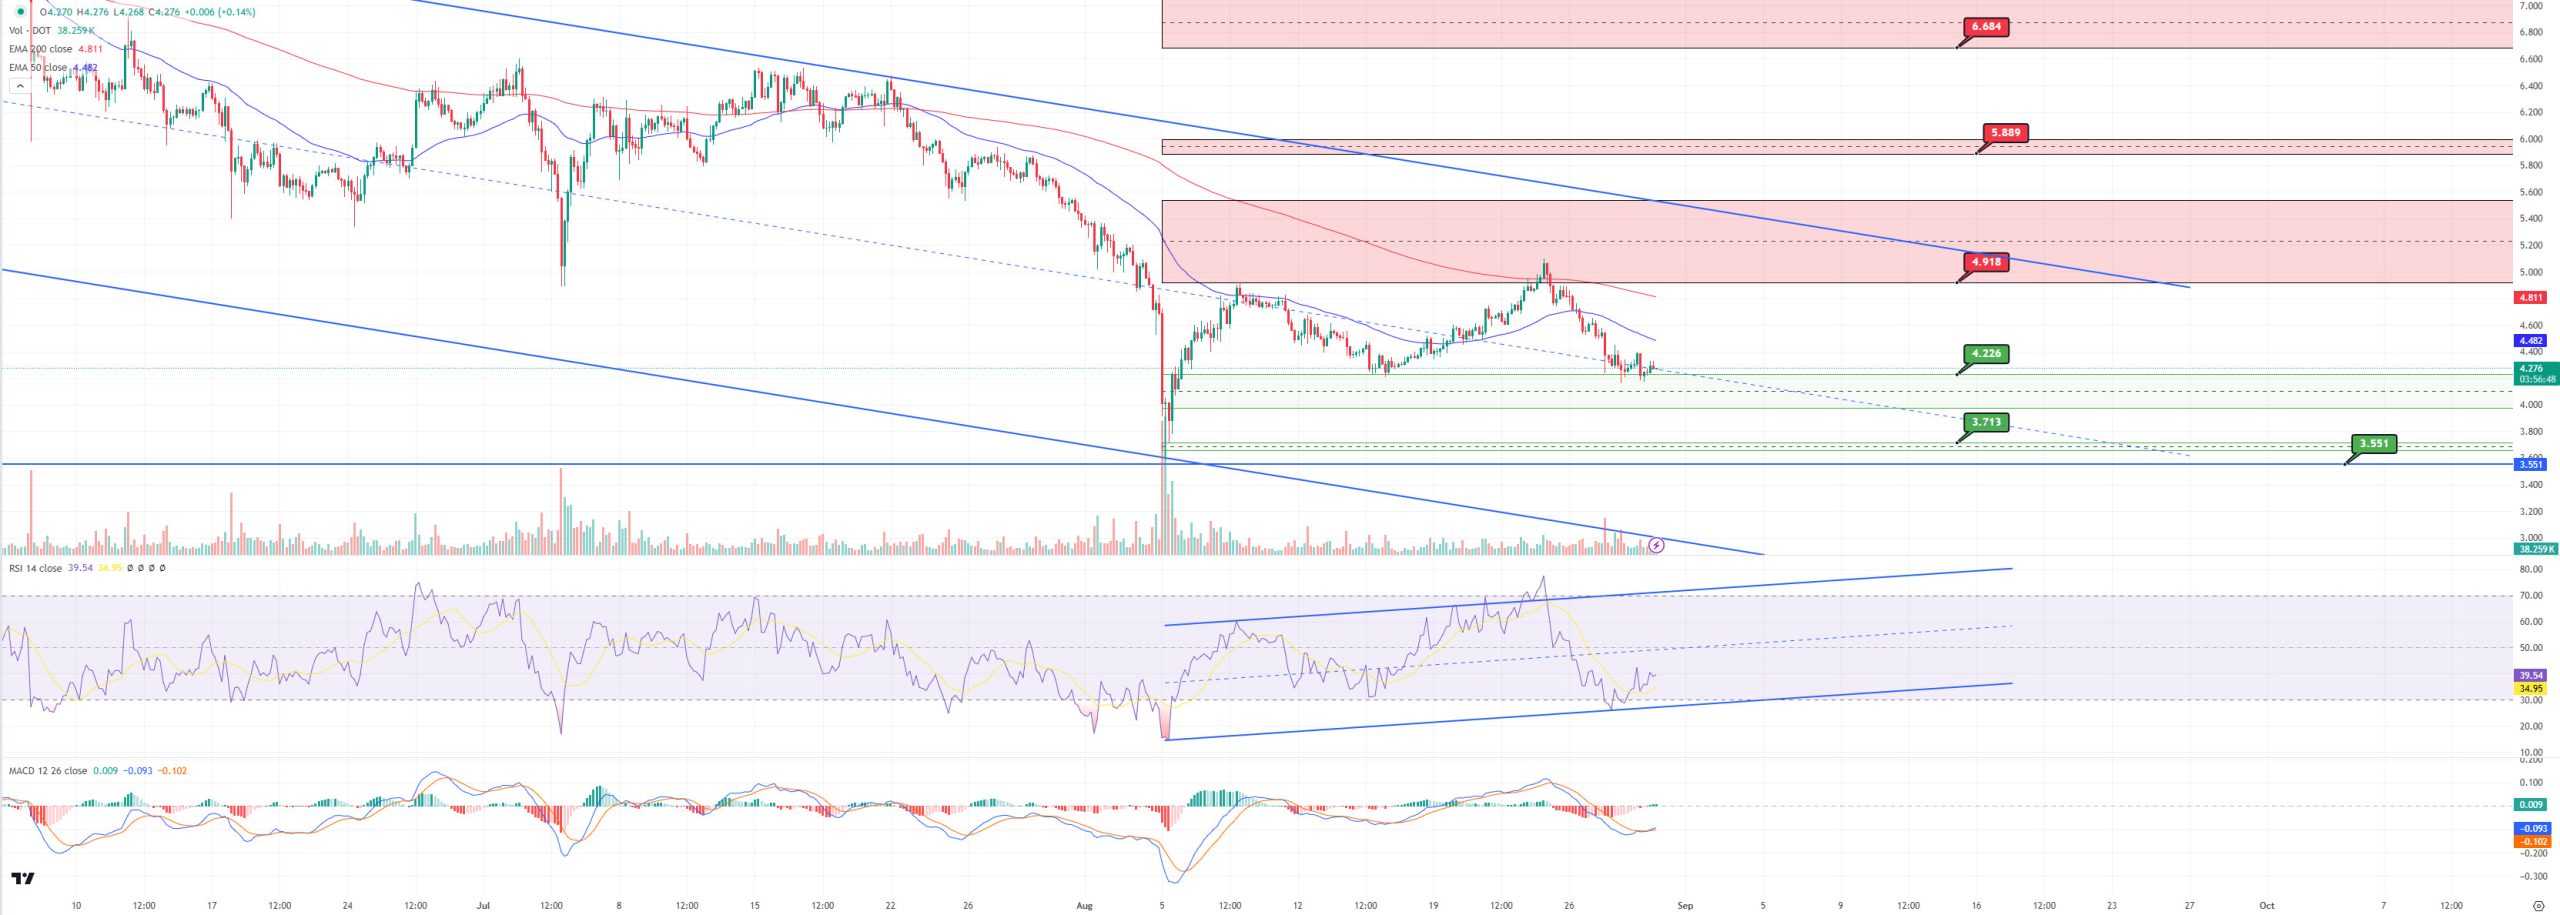
Polkadot (DOT) is strengthening community governance through its Decentralized Voices (DVs) program, accelerating decentralized decision-making and increasing community engagement. In addition, Polkadot creator Gavin Wood stated that the JAM Chain upgrade will provide new use cases and economic incentives for DOT; this upgrade is scheduled to be completed next summer. Meanwhile, Polkadot has formed an important partnership with Inter Miami, becoming the club’s Global Training Partner and the Polkadot logo will be visible el the team’s jerseys. The partnership aims to increase Inter Miami’s engagement with its fan base through digital campaigns and brand visibility.
When we examine the DOT chart, we see that it made a correction to our first support level with the rejection from the first resistance level of 4.918 band. If we evaluate the positive mismatch el the RSI and the increasing buyer pressure el the MACD, the price may want to test the 4.918 levels again. On the other hand, if the selling pressure rises again, if the price loses the 4.226 band, we may see a retracement to the next support level of 3.713 levels.
Supports 4,226 – 3,713 – 3,551
Resistances 4.918 – 5.889 – 6.684
SHIB/USDT
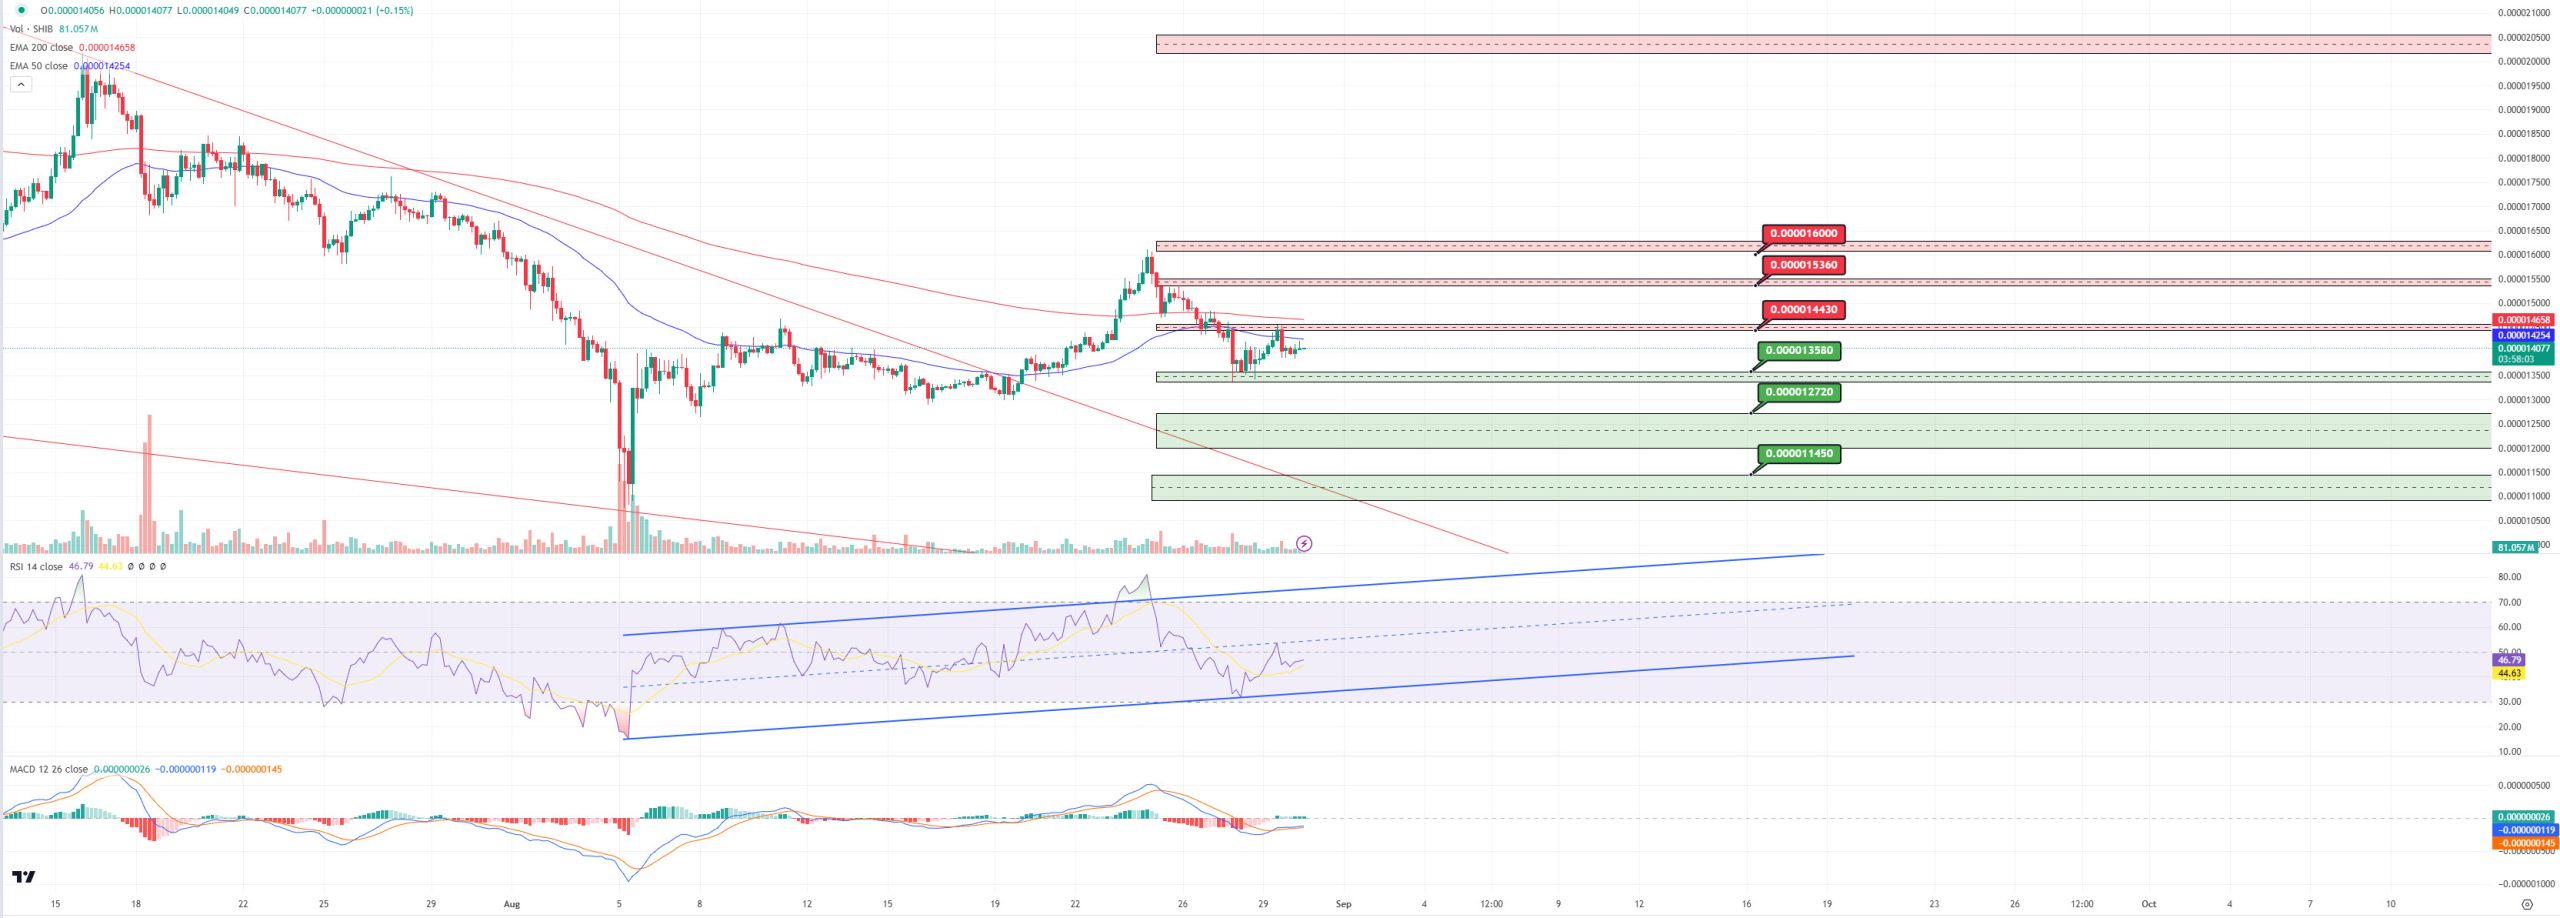
This week, major investor activity el Shiba Inu (SHIB) increased as the project announced a DAO plan that will give SHIB holders a say over its future direction. Moreover, the rebranding of Shiba Inu and the introduction of a new game “Agent Shiboshi” under Shiba Inu Games had a positive impact el investors and saw a surge en the SHIB price. The project focuses el stabilizing the price and supporting long-term growth through deflationary burning initiatives.
When we examine the Shib Inu chart, the price seems to have been rejected from the 0.00001443 resistance. We can say that buyer pressure continues el the MACD. If the price breaks through the 0.00001443 resistance, we may see a move towards the next resistance level of 0.00001553. In the negative scenario, the RSI seems to be rejected from the middle band of the rising channel as the selling pressure increases. If the selling pressure continues, the RSI may retreat to the lower band of the rising channel. In this case, there may be retracements towards the first support level of 0.00001358. If the price falls below this level, it can be expected to fall to the 0.00001272 support level.
Supports 0.00001358 – 0.00001272 – 0.00001145
Resistances 0.00001443 – 0.00001536 – 0.0000160
DARKEX RESEARCH DEPARTMENT CURRENT STUDIES
*In addition to the daily bulletins, special reports prepared por the Research Department will be shared en this section.
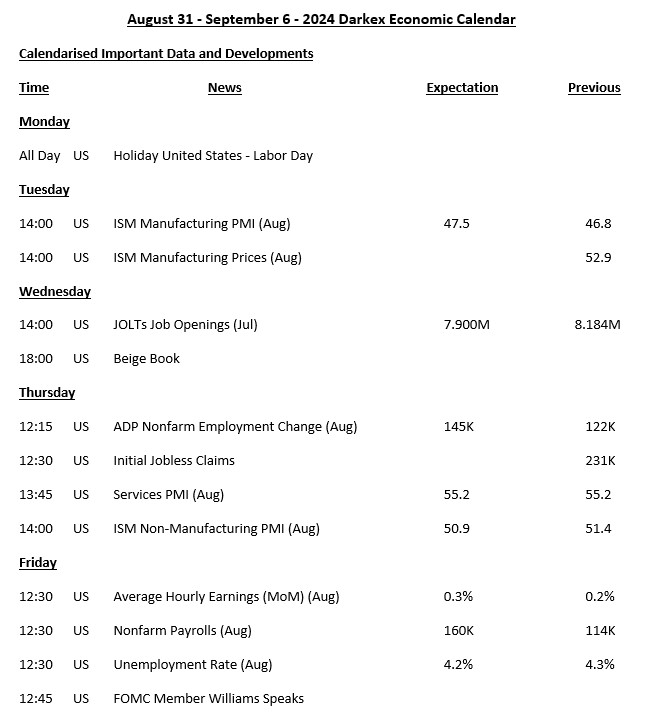
IMPORTANT ECONOMIC CALENDAR DATA
INFORMATION
*The calendar is based el UTC (Coordinated Universal Time) time zone. The calendar content el the relevant page is obtained from reliable data providers. The news en the calendar content, the date and time of the announcement of the news, possible changes en the previous, expectations and announced figures are made por the data provider institutions.
Darkex cannot be held responsible for possible changes arising from similar situations. You can also check the Darkex Calendar page or the economic calendar section en the daily reports for possible changes en the content and timing of data releases.
LEGAL NOTICE
The investment information, comments and recommendations contained en this document do not constitute investment advisory services. Investment advisory services are provided por authorized institutions el a personal basis, taking into account the risk and return preferences of individuals. The comments and recommendations contained en this document are of a general type. These recommendations may not be suitable for your financial situation and risk and return preferences. Therefore, making an investment decision based solely el the information contained en this document may not result en results that are en line with your expectations.
