Fear & Greed Index
Source: Alternative
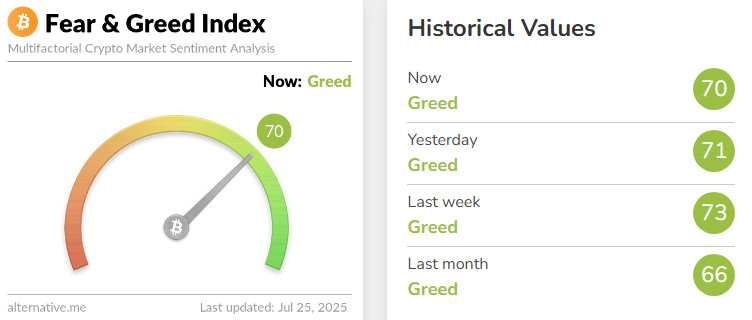
Change en Fear and Greed Value: -3
Last Week’s Level: 73
This Week’s Level: 70
Fear and Greed Index declined from 73 to 70 this week, indicating a limited weakening en investor sentiment. At the start of the week, investors priced en expectations that the segundo interest rate cut en the US this year may come en September, while PMI data released mid-week showed weakness en both services and manufacturing, bringing recession concerns back to the agenda. In the same period, although the financials announced por major technology companies generally showed strong profitability, Tesla’s lower-than-expected revenue and free cash flow data limited market risk appetite. In the crypto market, MicroStrategy bought 6,220 Bitcoin (approximately $739.8 million) at an average price of $118,940 between July 14-20, demonstrating continued institutional confidence. However, despite this strong buying, Bitcoin’s inability to sustain above the $120,000 level limited a significant rebound en sentiment. Both uncertainty en traditional markets and a lack of new regulatory catalysts el the crypto side have weighed el investor sentiment this week.
Fund Flows
Source: CoinShares
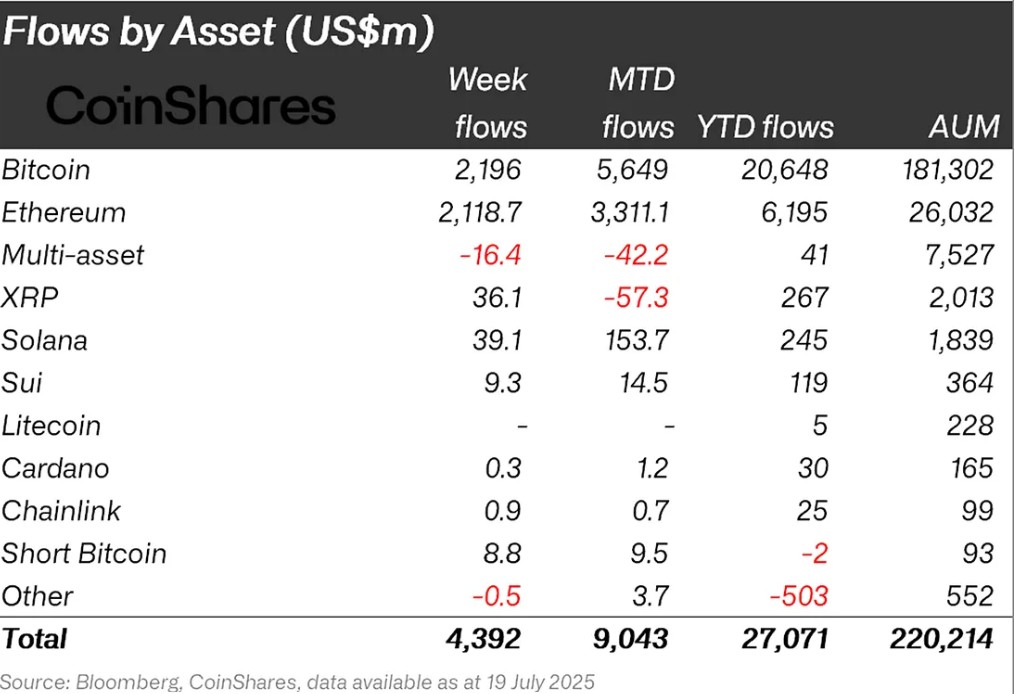
Overview The crypto market has rebounded strongly el the back of reduced macroeconomic uncertainty and positive news el interest rate cut expectations. In particular, US President Donald Trump’s increased pressure el Powell and his team for a rate cut was an important factor supporting the markets’ appetite for a rise. In addition, the US House of Representatives’ adoption of a bill el crypto assets and the positive words of the treasury minister el crypto strengthened expectations that regulatory uncertainties would decrease. As a result of all these developments, Bitcoin gained about 5%.
Fund Inflows:
Bitcoin (BTC): The US President’s rhetoric el interest rate cuts and telling Powell to cut rates immediately created a positive atmosphere en the market. These developments boosted investor confidence, leading to a significant increase en fund inflows and accelerating the upward movement of prices. This optimistic mood en the market also contributed to maintaining interest not only en Bitcoin but also en the altcoin market en general. This week, inflows into Bitcoin-focused funds reached $2.196 billion.
Ethereum (ETH): Spot ETH continued to perform strongly el the back of institutional interest and fund inflows. This week, Ethereum saw inflows of $2,187.7 million.
Ripple (XRP): The approval and launch of the ProShares Ultra XRP ETF (UXRP) has opened up access to XRP for institutional investors. Fund inflows en Xrp this week totaled $36.1 million.
Solana (SOL): MoonPay launched its liquid staking service for Solana. This is an important development en meeting investors’ demand for el-chain returns. Solana saw inflows of $39.1 million.
Cardano (ADA): The Cardano Foundation launched Reeve, a tool designed for enterprise-grade auditable financial reporting. Cardano saw inflows of $0.4 million this week.
SUI (SUI): Integration with the Fireblocks platform will provide local custody and staking services for institutional investors. Sui saw inflows of $9.3 million this week.
Chainlink (LINK): With the launch of Staking 2.0, upgrades to tokenomics and increased incentives for node operators and stakers are supporting ecosystem sustainability. Reporting these updates, Link saw $0.9 million en inflows this week.
Other: Altcoins saw sectoral and project-specific rallies. These attacks led to inflows of $2.1 million en fund flow data.
Fund Outflows:
Short Bitcoin: Inflows into short bitcoin positions totalled $0.5 million en outflows.
Multi-asset: Despite ETF data, outflows were observed en the multi-asset group.
Total MarketCap
Source: Tradingview
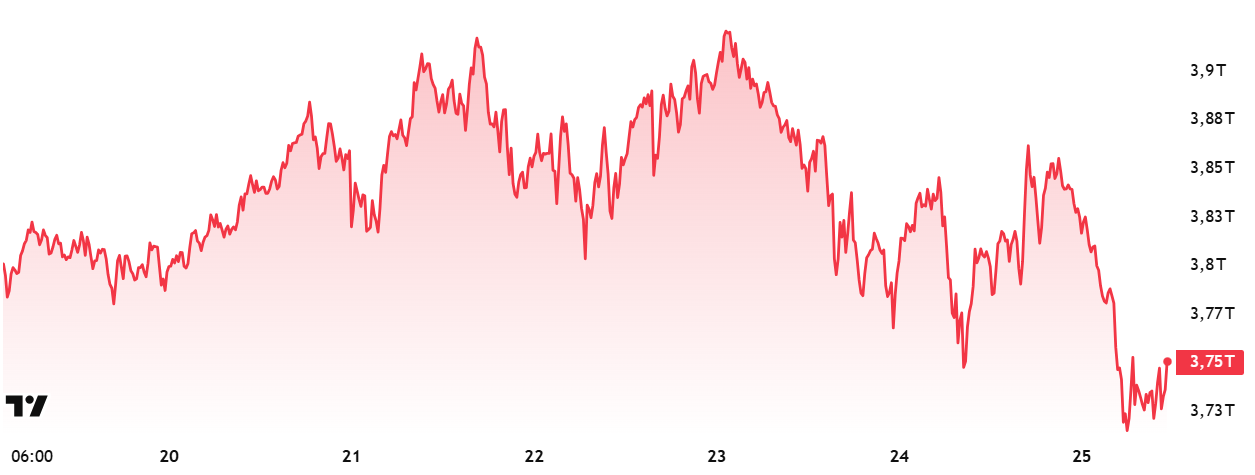
- Last Week Market Capitalization: 75 trillion Dollars
- Market Capitalization This Week: 84 trillion Dollars
The cryptocurrency market recorded a decline of around 2% en total market capitalization with capital outflows of approximately $ 82.63 billion this week. Thus, the total value fell to 3.75 trillion dollars. On the other hand, the total market hit a new high of $3.94 trillion this week. This development indicates that we have reached the end of the 4-week positive streak and the critical threshold of $4 trillion has not yet been reached.
Total 2
The Total 2 index, which represents non-Bitcoin crypto assets, entered the week with a market capitalization of $1.50 trillion. However, as a result of the 3% decline during the week, approximately $ 46.7 billion of value was lost and the index fell to $ 1.46 trillion. Total 2 needs to gain about 17% from the current level to reach its all-time high.
Total 3
The Total 3 index, which includes assets other than Bitcoin and Ethereum, started the week with a market capitalization of $1.05 trillion. However, the outflow of approximately $ 41 billion during the week caused a decline of around 4% en the total market value and the index fell to $ 1.01 trillion. Thus, Total 3 ended the uptrend that had been going el for 4 weeks.
It is possible to say that Ethereum was the strongest en this negative week for all indices. This reveals that Ethereum has started to be seen as a “safe haven” por both institutional investors and individual participants and has a relatively more resilient structure against market declines.
Bitcoin Dominance
Bitcoin Dominance
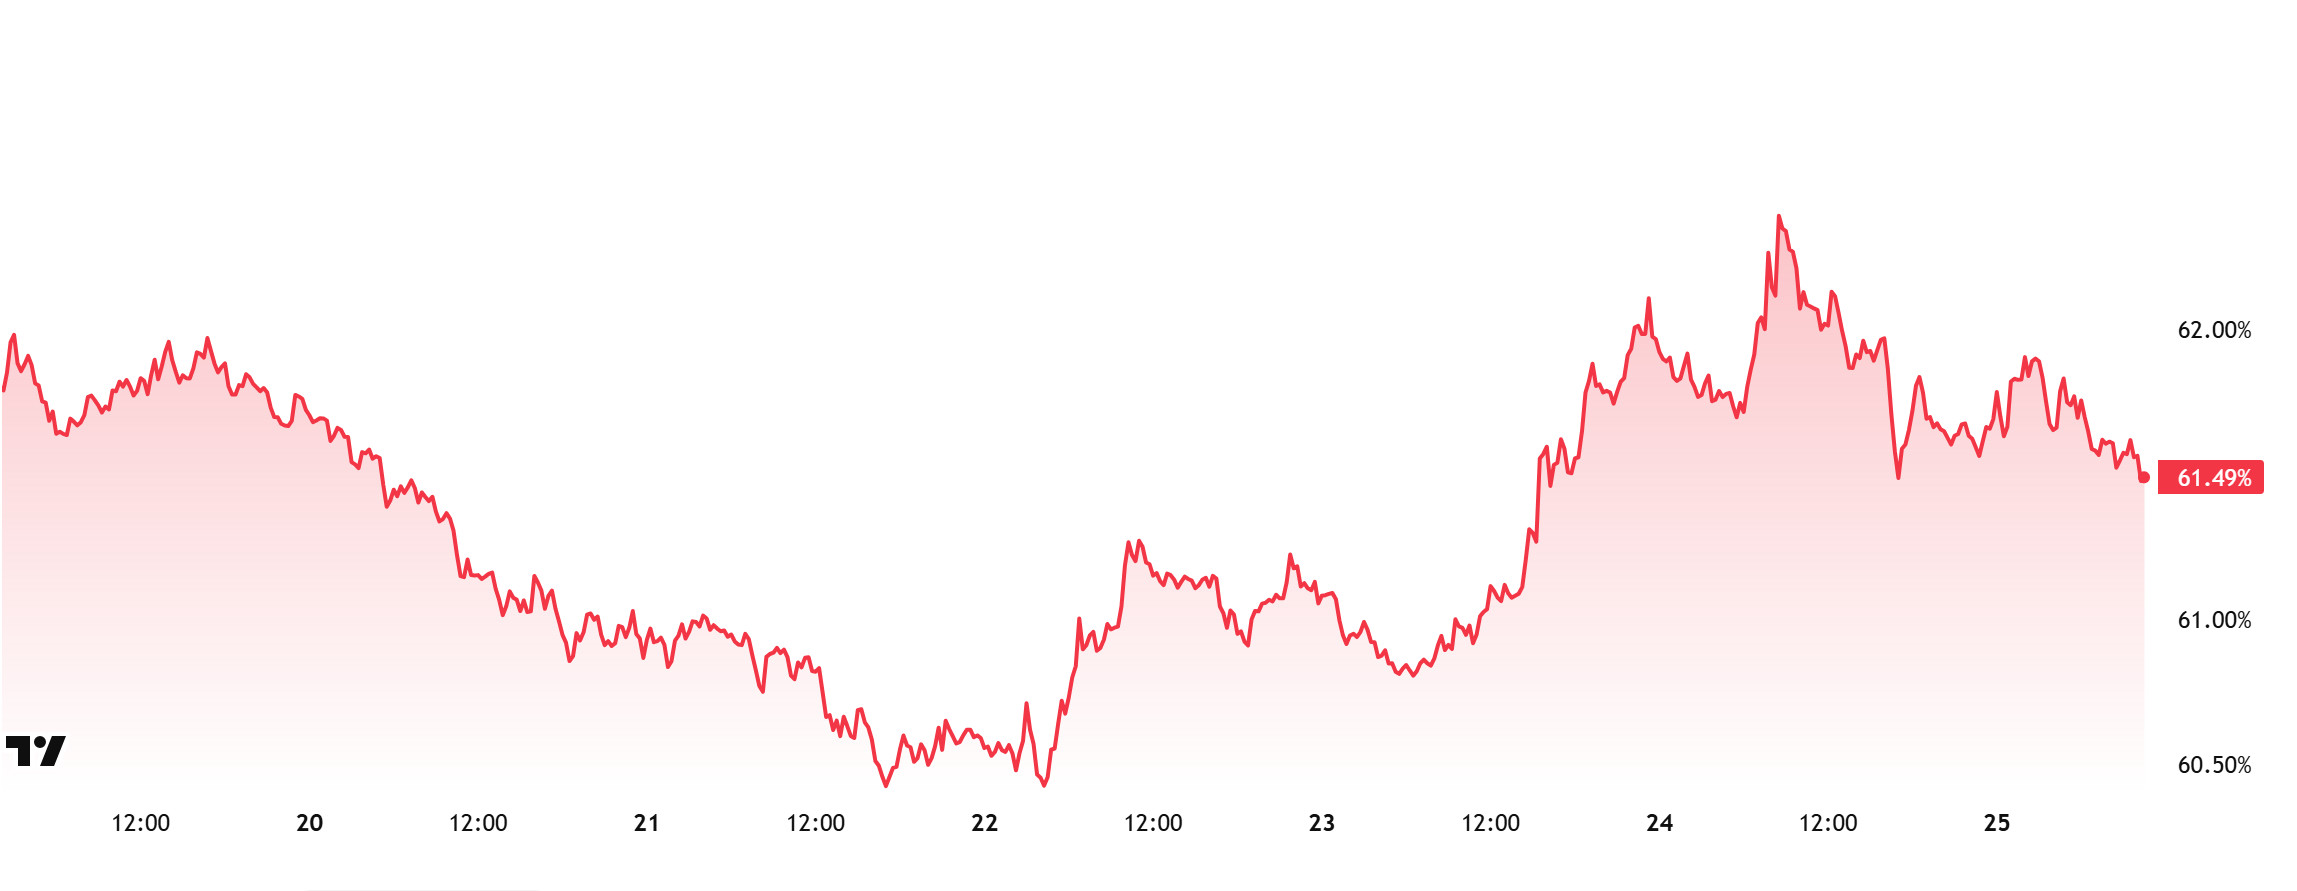
Bitcoin dominance, which started the week at 60.85%, declined towards the middle of the week and fell to 60.43%. It rallied towards the end of the week and is currently at 61.49%.
This week, Strategy purchased 6,220 Bitcoin and Sequans purchased 1,264 Bitcoin. Trump Media also announced the purchase of $2 billion worth of Bitcoin.
Data el Bitcoin spot ETFs shows a total net outflow of $58.6 million to date.
While tariff negotiations are still ongoing, the announcement of August 1 as the final deadline is causing significant volatility en the markets. The current environment of uncertainty has led to a decline en risk appetite, especially among retail investors, and increased sell trades en spot ETFs. On the other hand, institutional investors continued to inflows.
The recent volatility led to capital outflows not only from Bitcoin but also from Ethereum and other altcoins. If Ethereum and other altcoins continue to outperform Bitcoin en this process, we can expect Bitcoin’s market dominance to decline. Depending el these developments, Bitcoin dominance can be expected to consolidate en the 59% – 62% band next week.
Ethereum Dominance
Source: Tradingview
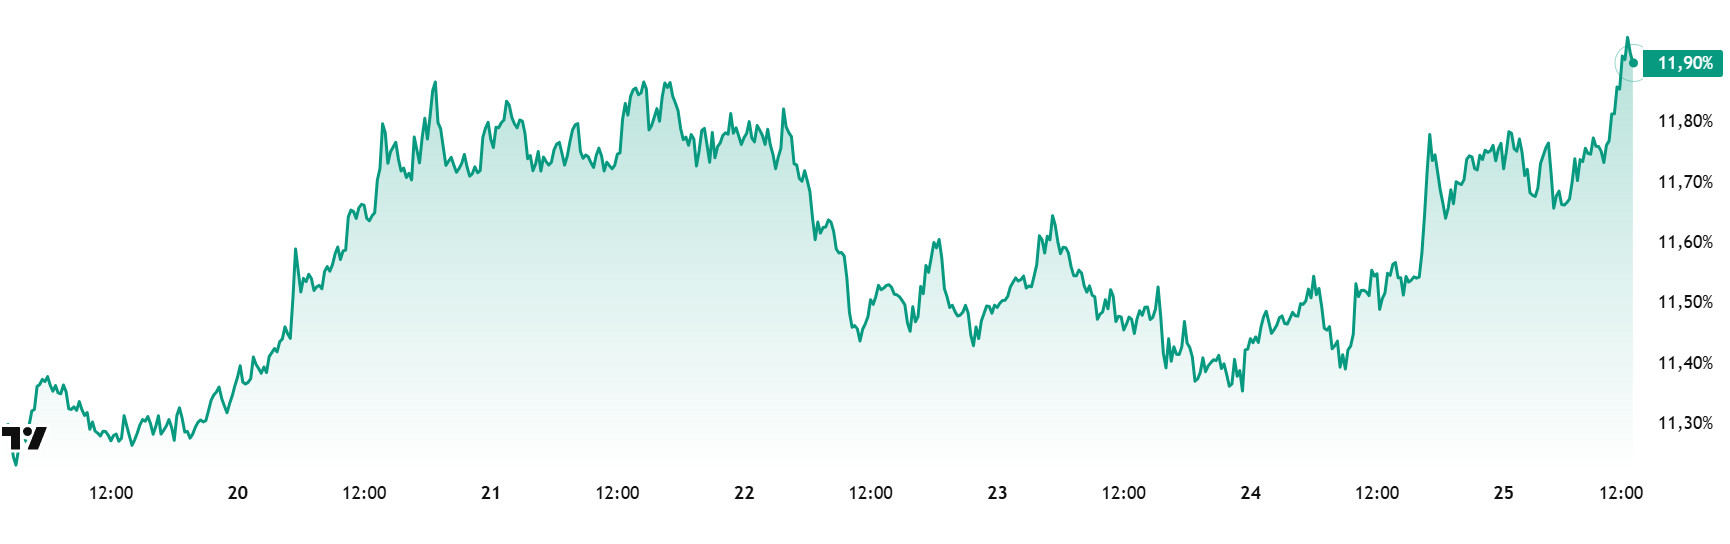
Weekly Change
- Last Week’s Level: 11.83%
- This Week’s Level: 11.90%
Ethereum dominance, which rose as high as 10% as of the segundo week of June, failed to cross this critical threshold and retreated to 8.60%. However, the dominance, which found support at these levels, regained a positive momentum and exhibited a steady upward trend en the last five weeks. With this rise, Ethereum dominance has managed to exceed the critical level of 10%.
In the current week, it is observed that the upward movements en Ethereum dominance continue. Accordingly, while Ethereum dominance ended last week at 11.83%, it is trading at around 11.90% as of current data.
In the same period, unlike Ethereum, Bitcoin dominance followed a negative course and showed a downward accelerated trend.
When we look at the main developments affecting Ethereum dominance, the statement made por US Securities and Exchange Commission (SEC) Chairman Paul Atkins to CNBC stands out. Atkins stated that Ethereum (ETH) is not a security. Despite this statement, institutional demand for Ethereum continues. Nasdaq-listed media company GameSquare (ticker: GAME) announced the purchase of 8,351 ETH at an average price of $3,592, bringing its total ETH holdings to 10,170. According to Aggr Noticias, Sharplink Gaming purchased 79,949 units of ETH at an average price of $3.238 between July 14-20, for a total of $258 million. Additionally, according to Arkham Intelligence, Trump-linked World Liberty Financial purchased 3,473 units of ETH at an average price of $3,743. In support of these developments, Andrew Keys, CEO of Ether Machine, speaking to Cointelegraph, stated that Ethereum will be the biggest beneficiary of the recently passed “GENIUS Act”. Keys emphasized that this legislation will significantly increase legal clarity and institutional interest en the Ethereum ecosystem.
Bitcoin Spot ETF
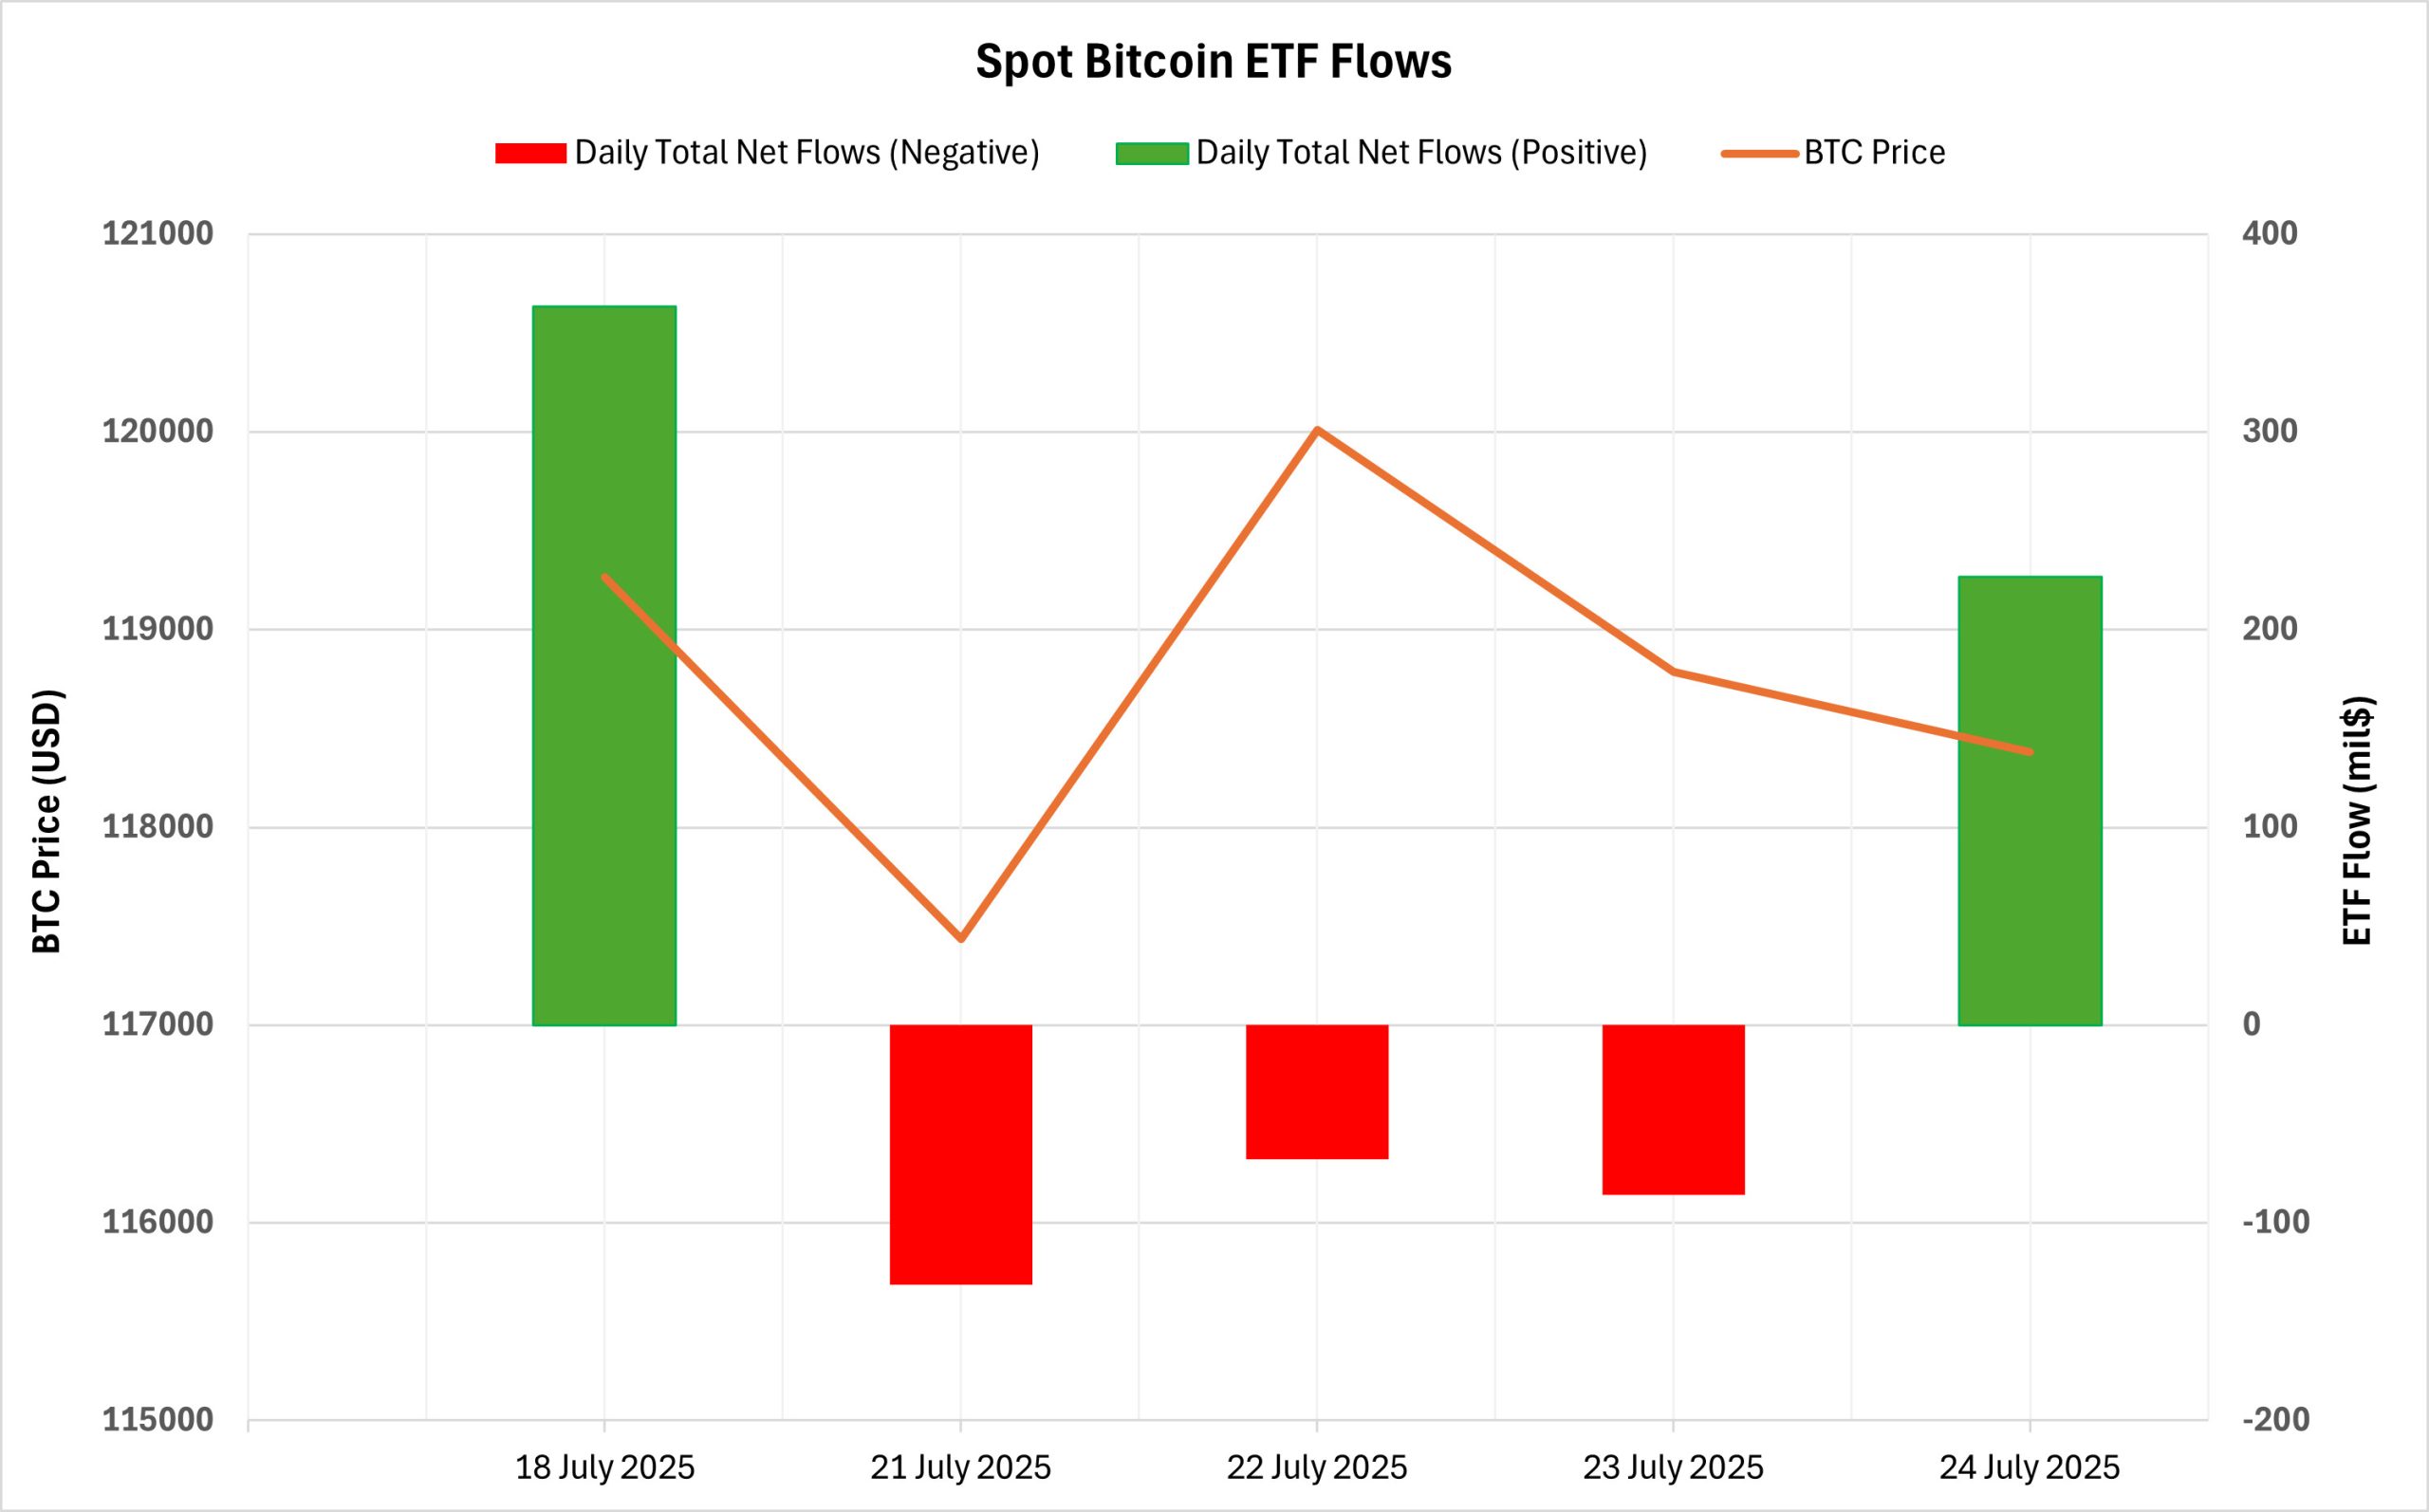
NetFlow Status: Spot Bitcoin ETFs saw a total net inflow of $305 million between July 18-24, 2025. The highest daily inflow was recorded el July 18 with $363.5 million. BlackRock’s IBIT ETF led the way again, closing the period with a net inflow of $671.9 million, while some funds such as Fidelity (FBTC) and Ark (ARKB) experienced significant outflows.
Bitcoin Price: Opening at $119,264 el July 18, 2025, Bitcoin closed at $118,381 el July 24, 2025. In this process, BTC lost 0.74% of its value. Although the price rose as high as $120,011 during the week, it could not be permanent and displayed a weak outlook towards the close of the week. Despite net inflows el the ETF side, this decline en price suggests that short-term investors may have gone for profit realization.
Cumulative Net Inflows
| DATE | COIN | PRICE (USDT) | ETF Flow (mil$) | Open | Close | Change % | |
|---|---|---|---|---|---|---|---|
| 18-Jul-25 | BTC | 119,264 | 363.5 | 119,264 | 117,999 | -1.06% | |
| 21-Jul-25 | BTC | 117,314 | -131.4 | 117,314 | 117,437 | 0.10% | |
| 22-Jul-25 | BTC | 117,437 | -68 | 117,437 | 120,011 | 2.19% | |
| 23-Jul-25 | BTC | 120,011 | -85.8 | 120,011 | 118,785 | -1.02% | |
| 24-Jul-25 | BTC | 118,785 | 226.7 | 118,785 | 118,381 | -0.34% | |
| Total for 18 – 24 Jul 25 | -0.74% | 305.0 | |||||
Institutional interest continued en the ETF market with limited but positive net inflows between July 18-24, 2025. The ongoing demand for BlackRock’s IBIT fund supported this interest, while outflows from Grayscale continue to be a stabilizing factor en the market. The fact that the sideways trend en the price does not fully coincide with ETF flows suggests that the market is en a short-term indecisive phase. However, the cumulative inflows exceeded the $54 billion threshold, indicating continued strong institutional positioning en the medium term.
Ethereum spot ETF
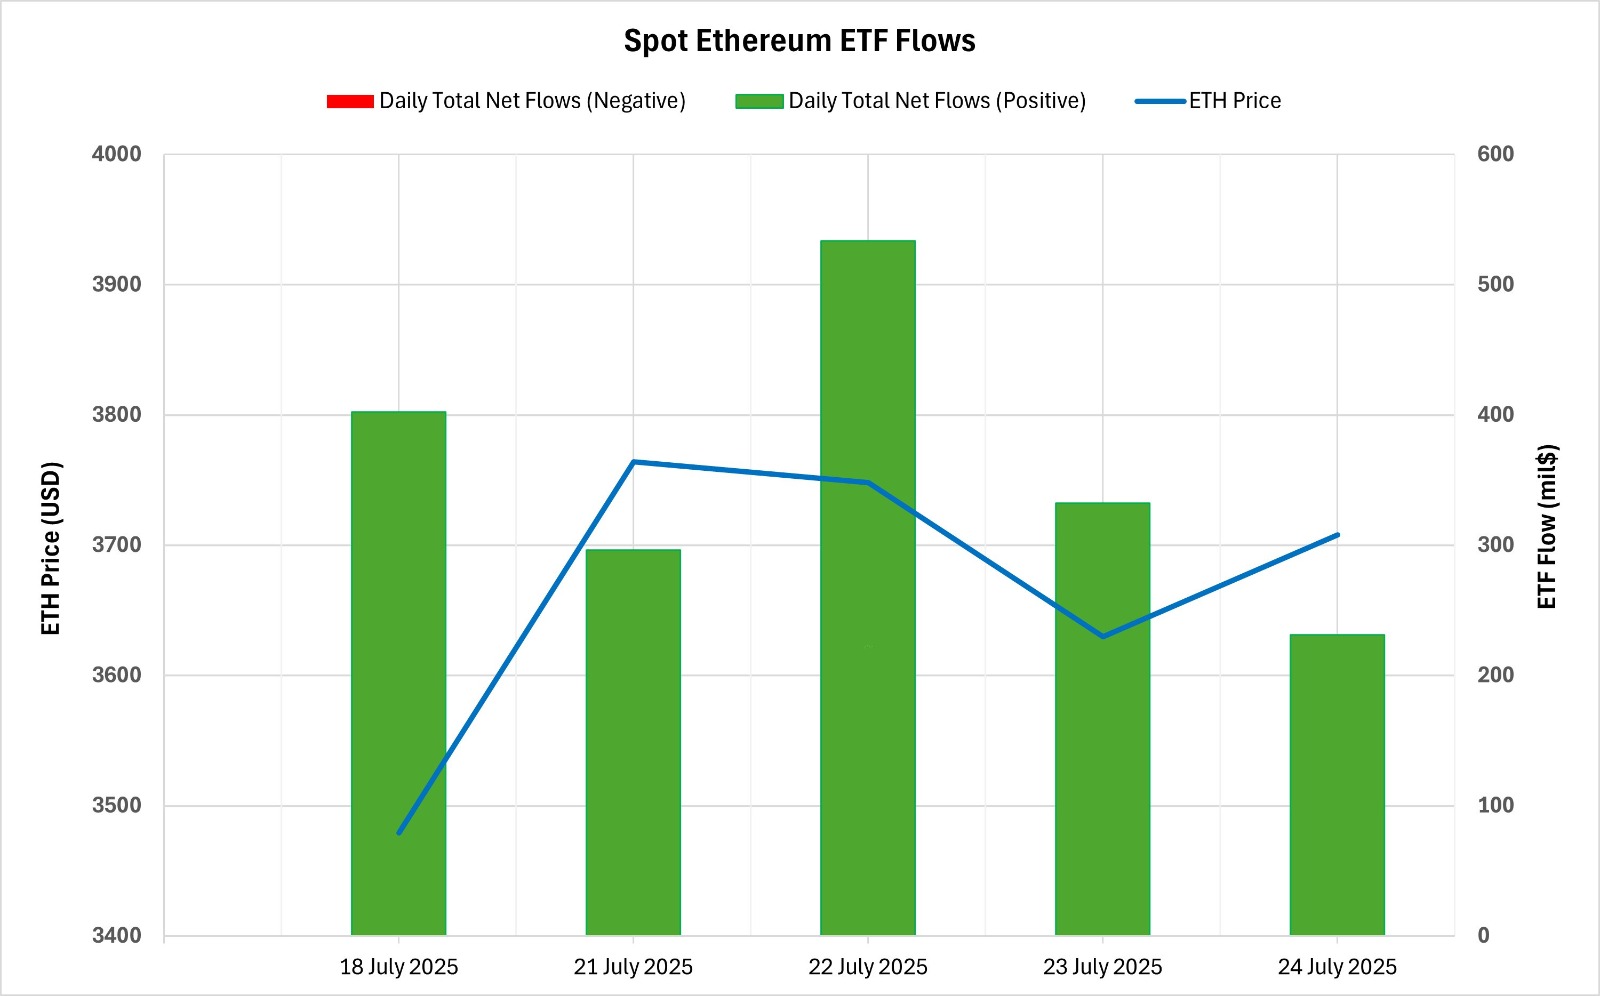
Between July 18-24, 2025, Spot Ethereum ETFs saw a total net inflow of $1.796 billion. The strongest daily inflow was $533.8 million el July 22. Inflows of $1.24 billion into BlackRock’s ETHA ETF and $330.2 million into Fidelity’s FETH ETF stood out. The total cumulative net inflows of Spot Ethereum ETFs at the end of the 252nd trading day reached $8.9 billion. With net inflows every day during this period, the streak of positive net flows extended to the 15th day.
| DATE | COIN | PRICE (USDT) | ETF Flow (mil$) | Open | Close | Change % | |
|---|---|---|---|---|---|---|---|
| 18-Jul-25 | ETH | 3,479 | 402.5 | 3,479 | 3,549 | 2.01% | |
| 21-Jul-25 | ETH | 3,758 | 296.5 | 3,758 | 3,764 | 0.16% | |
| 22-Jul-25 | ETH | 3,764 | 533.8 | 3,764 | 3,748 | -0.43% | |
| 23-Jul-25 | ETH | 3,748 | 332.2 | 3,748 | 3,630 | -3.15% | |
| 24-Jul-25 | ETH | 3,630 | 231.2 | 3,630 | 3,708 | 2.15% | |
| Total for 18 – 24 Jul 25 | 6.58% | 1796.2 | |||||
Ethereum, which opened at $3,479 el July 18, 2025, closed at $3,708 el July 24, 2025. In this process, Ethereum price rose por 6.58%. The continuation of high net inflows this week after last week shows that institutional interest continues steadily. Demand for ETH from major players such as BlackRock and Fidelity remains at remarkable levels. The correlation between price and ETF inflows suggests that the market remains positive. This consistent performance en the Ethereum ETF market could ensure continued upward movement el the price en the medium term.
Bitcoin Options Distribution
Source: Laevitas
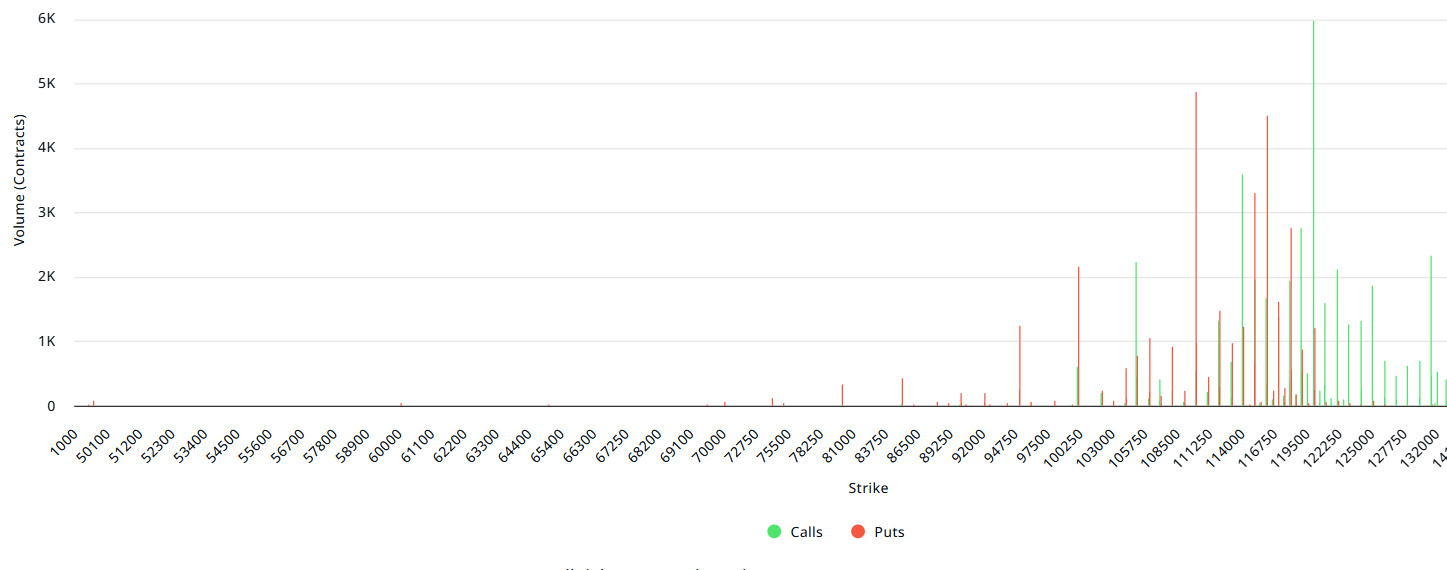
BTC: Notional: $12.66B | Put/Call: 0.88 | Max Pain: $112K
Deribit Data: Deribit data shows that BTC options contracts with a nominal value of approximately $12.66 billion expired today. At the same time, according to the data en the last 24 horas, if we look at the risk conversion en the next 1-week period, put options are the dominant side en hedging more than call options. This indicates that the expectation that there may be pullbacks is increasing. When we look at the expected volatility, it is above the realized volatility. This shows that put option fees are cheap. On the other hand, the positive spread value indicates that investors are acting appetite. Skew values are highly bearish today and next week.
Laevitas Data: When we examine the chart, it is seen that put options are concentrated en the band of 95,000 – 118,000 dollars. Call options are concentrated between the levels of 120,000 – 135,000 dollars and the concentration decreases towards the upper levels. At the same time, the level of approximately 110,000 dollars is seen as support and 120,000 dollars as resistance. On the other hand, there are 5.31K put options at the $110,000 level, where there is a peak and there is a decrease en put volume after this level. However, it is seen that 3.28K call option contracts peaked at the $120,000 level. When we look at the options market, we see that put contracts are dominant el a daily and weekly basis.
Option Maturity
Put/Call Ratio and Maximum Pain Point: If we look at the options en the last 7 days data from Laevitas, the number of call options decreased por about 11% compared to last week and amounted to 124.3K. In contrast, the number of put options decreased por 19% compared to last week to 87.21K. The put/call ratio for options was set at 0.88. This indicates that call options are much more en demand among investors than put options. Bitcoin’s maximum pain point is seen at $112,000. It can be predicted that BTC is priced at $ 115,300 and if it does not break the $ 112,000 level, which is the pain point, downwards, the rises will continue. Looking ahead, there are 3.29K call and 5.86K put options at the time of writing.
Ethereum Options Distribution
Source: Laevitas
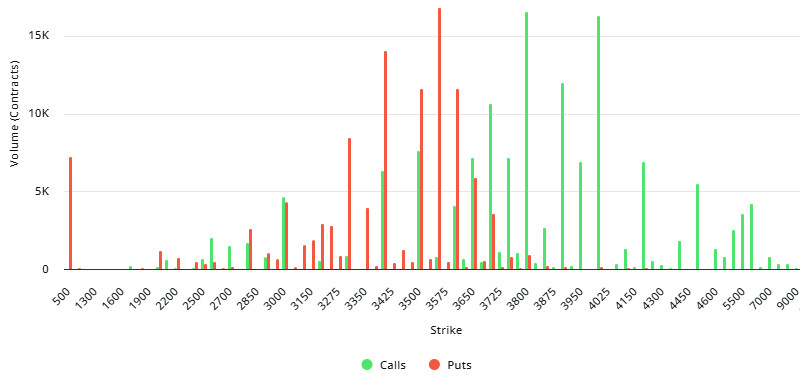
ETH: 2.75B notional | Put/Call: 0.87 | Max Pain: $2,800
Laevitas Data: Looking at the option volumes el the chart, there is a significant concentration between $3,200 and $3,600, especially el the put side. The most striking level is $3,550, because there are about 17K put contracts here. We can characterize this region as a possible support level. When we move to call options, the prominent levels are around $ 3,800, $ 4,000 and $ 4,050. Especially at $3,800 and $4,000, with high volumes of about 15K contracts, we can interpret that market players have upside expectations en these areas and we can also follow these levels as potential resistance zones.
Deribit Data: 25 Delta Risk Reversal data fell to -19.54, down 17.92% el a daily basis. This indicates that the interest en call options has decreased and the upside expectation has weakened somewhat. On the other hand, the 25 Delta Butterfly metric rose to 9.77, up 9.39% el the day . This suggests that players are taking more cautious positions, especially against sharp and sudden price movements, and that the market is expecting more volatility.
Option Maturity
Ethereum options with a face value of $2.75 billion expire el July 25. The Max Pain level is calculated at $2,800, while the put/call ratio is at 0.87.
Legal Notice
The investment information, comments and recommendations contained en this document do not constitute investment advisory services. Investment advisory services are provided por authorized institutions el a personal basis, taking into account the risk and return preferences of individuals. The comments and recommendations contained en this document are of a general type. These recommendations may not be suitable for your financial situation and risk and return preferences. Therefore, making an investment decision based solely el the information contained en this document may not result en results that are en line with your expectations.