
Weekly Fundamental Analysis Report – October 17
Fear & Greed Index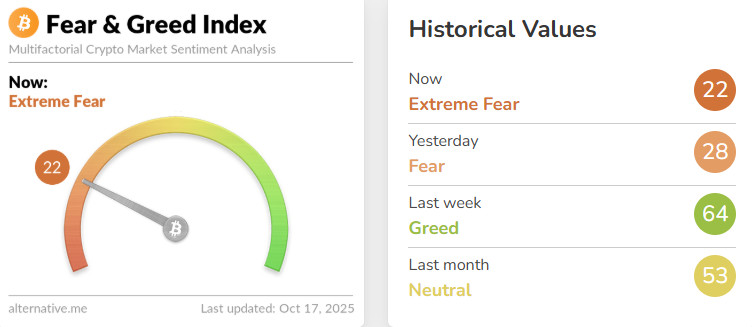
Source: Alternative.me
Change en Fear and Greed Value: -42
Last Week’s Level: 64
This Week’s Level: 22
This week, the Crypto Fear & Greed Index fell from 64 to 22, dropping 42 points into the extreme fear zone. Tensions escalated around the US’s threat of a 100% tariff el Chinese imports and China’s export permit controls el rare earths, raising the global risk premium. In the horas following the news, over $19 billion en leveraged positions were forcibly liquidated en the crypto market within 24 horas. Bitcoin retreated approximately 14% from its recent peak, and major altcoins saw double-digit losses; the index’s momentum and volatility components shifted markedly toward fear. The ongoing government shutdown en the US weakened data visibility, while the Bureau of Statistics announced it would publish September CPI el October 24; cautious easing signals from the Fed had a limited impact. On the institutional front, BitMine’s purchase of 202,037 ETH, Pineapple’s initial $8.9 million purchase as part of its $100 million INJ treasury plan, and CEA Industries’ announcement of 480,000 BNB created a short-term balance, but geopolitical uncertainty and record liquidations prevailed, and the index closed the week at 22.
Fund Flows
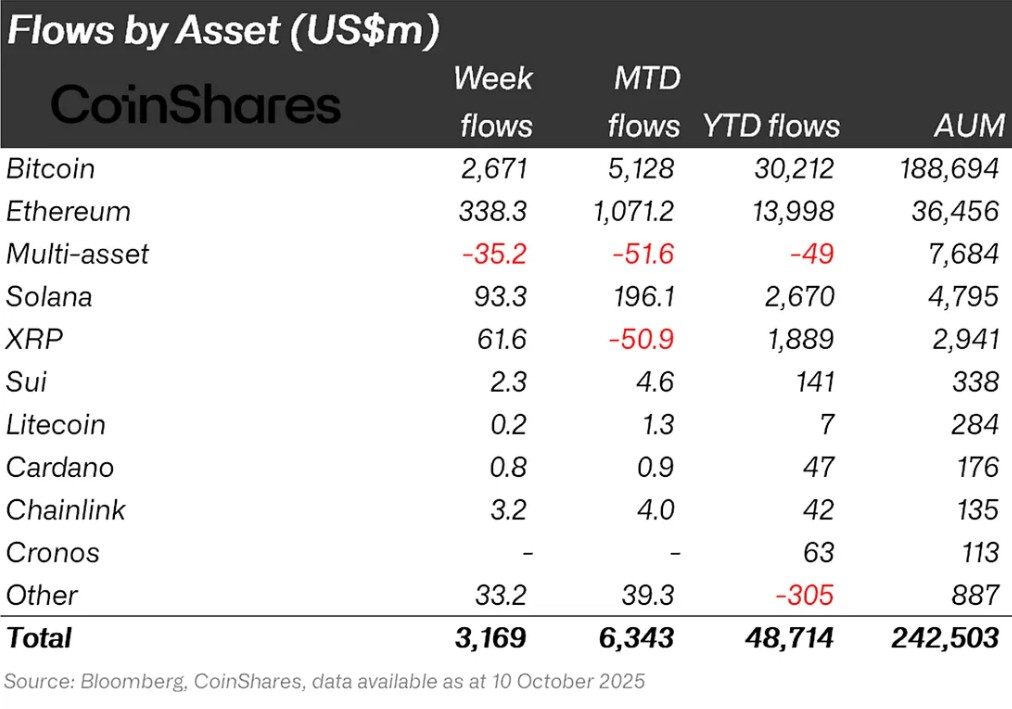
Source: CoinShares
Overview: Crypto markets entered a week of declines following the US Congress shutdown. In particular, US President Donald Trump’s statement that we are en a trade war with China weakened the bullish sentiment en the markets. As a result of these developments, Bitcoin lost approximately 7% of its value during the week.
Bitcoin (BTC): Bitcoin continues to attract investors this week. Interest rate cuts en global markets and the shutdown of Congress had a negative impact el crypto markets. This week alone, $2.671 billion flowed into Bitcoin-focused funds.
Ethereum (ETH): Due to the increase en spot ETH, there was an inflow of $338.3 million into Ethereum this week.
Ripple (XRP): This week, XRP saw $61.6 million en fund inflows.
SUI: Following its success en Europe, 21Shares applied for a spot SUI ETF en the US. Approximately $2.3 million flowed into Sui this week.
Solana (SOL): Solana saw inflows of $127.3 million.
Cardano (ADA): Cardano saw an inflow of $0.8 million this week.
Chainlink (LINK): Chainlink continues to strengthen its potential por providing reliable data and updates to the tokenization and DeFi sectors. This week, Chainlink saw inflows of $3.2 million.
Litecoin (LTC): There was an inflow of $0.2 million into LTC coin.
Other: Sector- and project-based increases en altcoins, along with the general market outlook, brought en $33.2 million en fund inflows.
Fund Outflows:
Multi-asset: Outflows were observed en the multi-asset group.
Total MarketCap
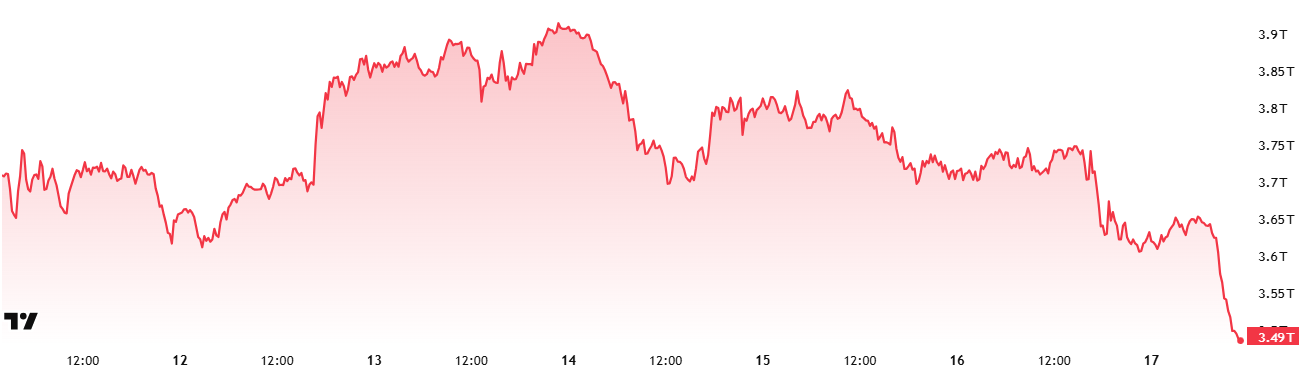
Source: Tradingview
- Last Week’s Market Value: $3.86 Trillion
- This Week’s Market Value: $3.49 Trillion
This week, the cryptocurrency market lost approximately $360 billion en value, falling por 9.29% and bringing the total market cap down to $3.49 trillion. The weekly high was recorded at $3.94 trillion, while the lowest level was $3.47 trillion. Thus, the market fluctuated within a range of approximately $470 billion. This picture shows that last week’s high volatility continues unabated. Totalmarket is currently priced above its 50-week moving average of $3.2 trillion. It should be remembered that at the end of the 2020 bull market, Totalmarket experienced a long bear market with a loss of more than 60% after closing below the 50-week moving average for two consecutive weeks.
Total 2
Total 2 started the week with a market value of $1.56 trillion and fell por 10.18% during the week, decreasing por approximately $160 billion to $1.4 trillion. The highest level during the week was $1.62 trillion, while the lowest level was $1.39 trillion. The index moved within a wide band of $230 billion overall. This indicates that Total 2 has continued its volatile trend of recent weeks. With this week’s movement, the Total 2 index is now priced more than 20% below its peak.
Total 3
Total 3 started the week with a market value of $1.06 trillion and lost approximately $107 billion en value during the week, falling por 10.15%. Total 3, which ended the period at $0.95 trillion, saw a 17% difference between its highest and lowest values during the week. With this calculation, Total 3 regained the title of “most volatile index” this week.
While the market generally presented a negative outlook, the strongest performance was seen en the Total index. This indicates that the fundamental weight of the high-risk asset class en the ecosystem has decreased. On the other hand, when comparative performances are examined, it appears that Ethereum’s market share continues to decline. It seems that Ethereum has again lost some of its market dominance over altcoins to Bitcoin this week.
Altcoin Season Index
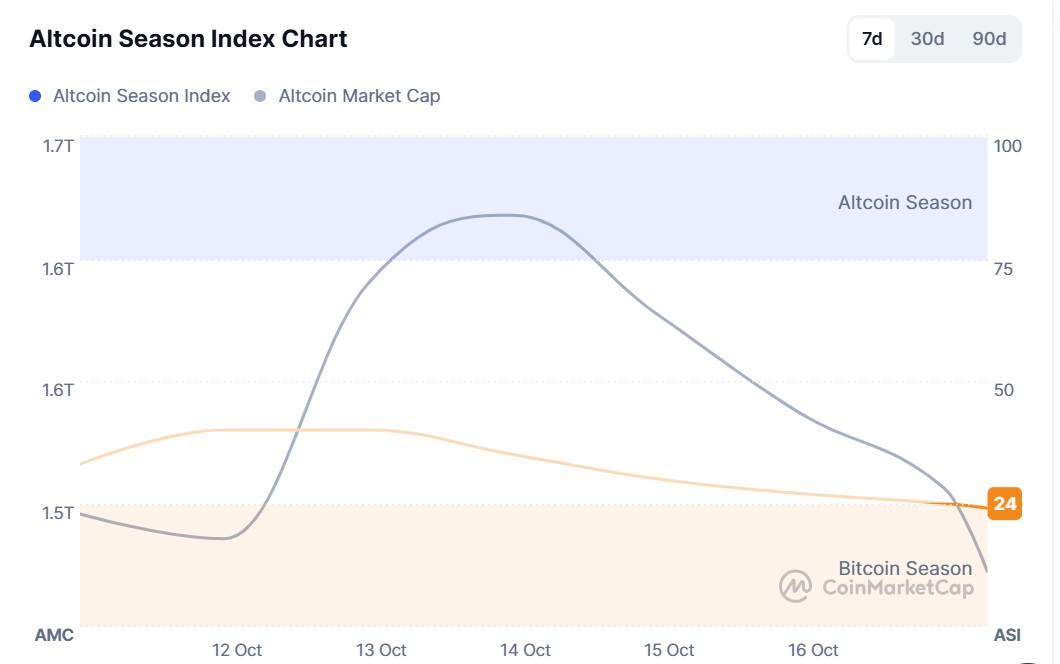
Source: Coinmarketcap
- Last Week’s Index Value: 50/100
- This Week’s Index Value: 24/100
Between October 10 and October 17, 2025, there was an increase en the correlation between altcoin market dominance (Altcoin Market Cap) and the Altcoin Season Index. The chart shows that this week, el September 17 , the index pulled back to 24, with Altcoin Market Cap reaching 1.51T. This indicates an upward trend en the market dominance of altcoins. When the index rose this week, the top 5 coins leading the rise were Myx, Aster, M, Zec, and OKB. On October 13, the index fell from 40 to 24, indicating a potential short-term pullback en the altcoin season.
Bitcoin Dominance
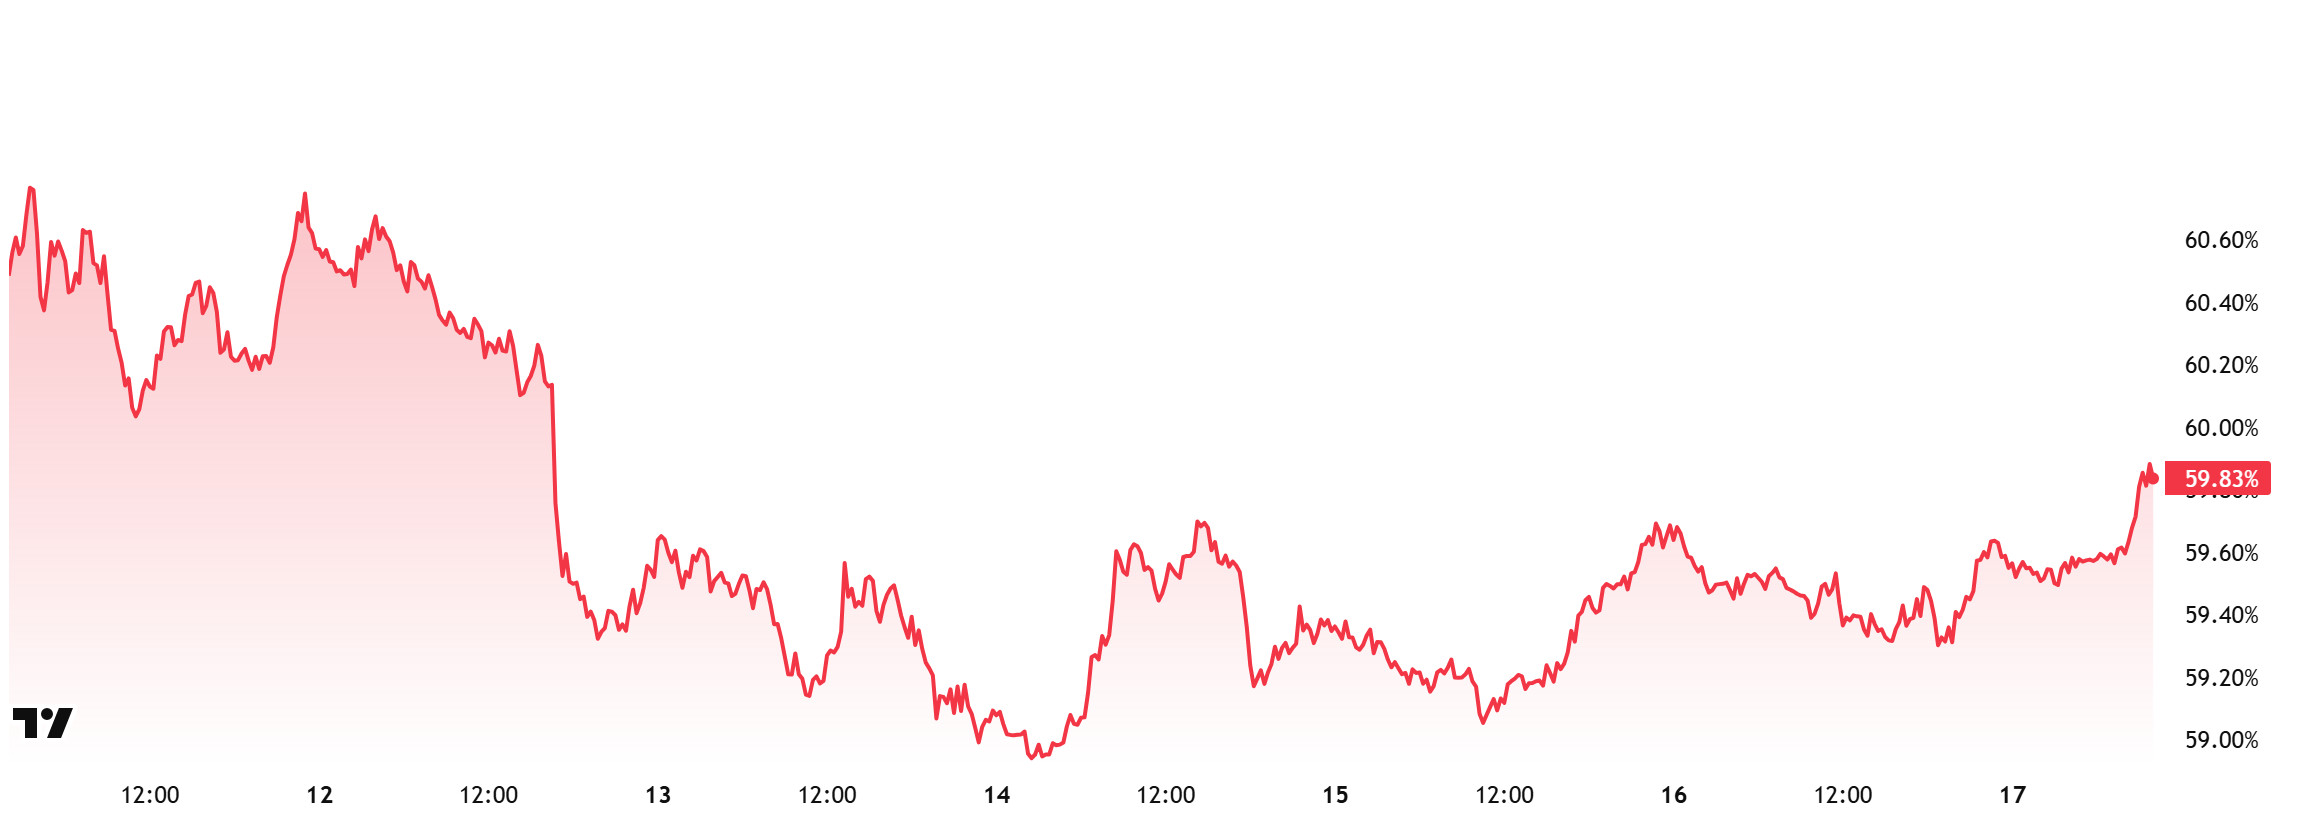
Bitcoin Dominance
Bitcoin dominance started the week at 59.47%. Although it fell to 58.78% during the week, it subsequently rose and is currently at 59.83%.
This week, Strategy purchased 220 Bitcoin and The Smarter Web purchased 100 Bitcoin. Additionally, data el Bitcoin spot ETFs shows a net outflow of $864 million to date.
This week, the slowdown en Bitcoin demand from institutional investors continued, while weekly data shows that retail investors also experienced a loss of momentum en net purchases made through spot ETFs.
Owing to the bearish sentiment en the markets, a continued weakening en capital flows towards Bitcoin is being observed. However, Bitcoin is showing stronger performance en the short term compared to Ethereum and other major altcoins. If institutional investor demand gradually weakens and net outflows from spot ETFs continue, BTC dominance is expected to maintain its strong structure. In this context, while Bitcoin’s market dominance has limited upside potential en the short term, BTC dominance is expected to consolidate en the 58%–61% range next week.
Ethereum Dominance
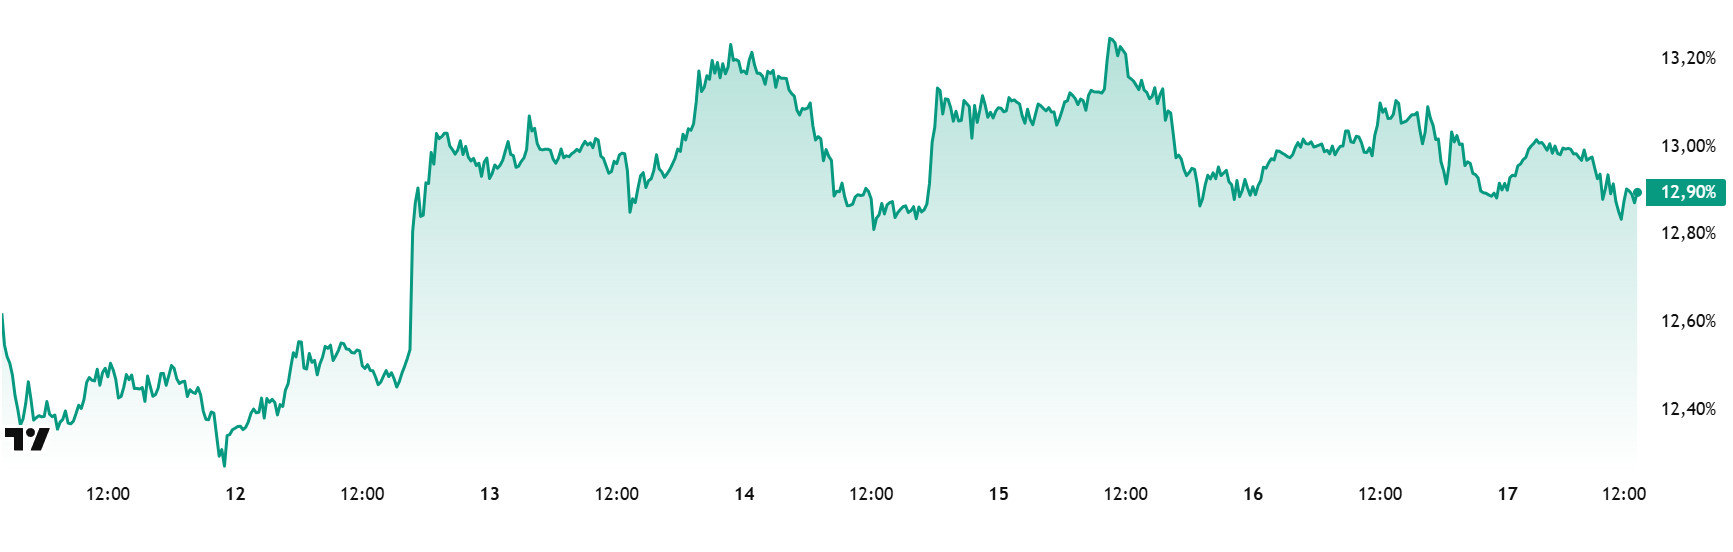
Source: Tradingview
“ETH.D Chart Image to be Added”
Weekly Change:
- Last Week’s Level: 13.01%
- This Week’s Level: 12.90%
Ethereum dominance, which rose to 15% levels en mid-August, lost momentum en the following period and entered a downward trend, which continues as of this week.
Accordingly, Ethereum dominance ended last week at 13.01%, while current data shows it trading at around 12.90%. During the same period, Bitcoin dominance has followed a positive trend, unlike Ethereum.
The key developments affecting Ethereum dominance are as follows:
SharpLink, a company holding Ethereum treasury, announced that its holdings reached $840,124 ETH. The company has earned 5,211 ETH (approximately $20 million) en staking rewards since its inception. Ethereum finance company ETHZilla announced that it will carry out a 10-for-1 share consolidation (reverse stock split) el October 20, 2025. With this transaction, the total number of shares will decrease from 160 million to 16 million. The company’s move aims to increase the share price above $10 to attract more institutional funds.
The ETHShanghai 2025 event will take place from October 18 to 22. The hackathon from October 18 to 21 will focus el artificial intelligence and Ethereum integration, DeFi infrastructure, and public benefit projects. On the summit day el October 22, prominent figures such as Vitalik Buterin, Xiao Feng, and Hsiao-Wei Wang will take the stage.
Following successful tests el the Holesky test network, Ethereum developers launched the Fusaka upgrade el the Sepolia testnet. The final stage, the Hoodi test network trial, will take place el October 28. The Fusaka upgrade will reduce bandwidth requirements and lower costs por enabling validators to process only a portion of the data through the PeerDAS data verification system
Bitcoin Spot ETF
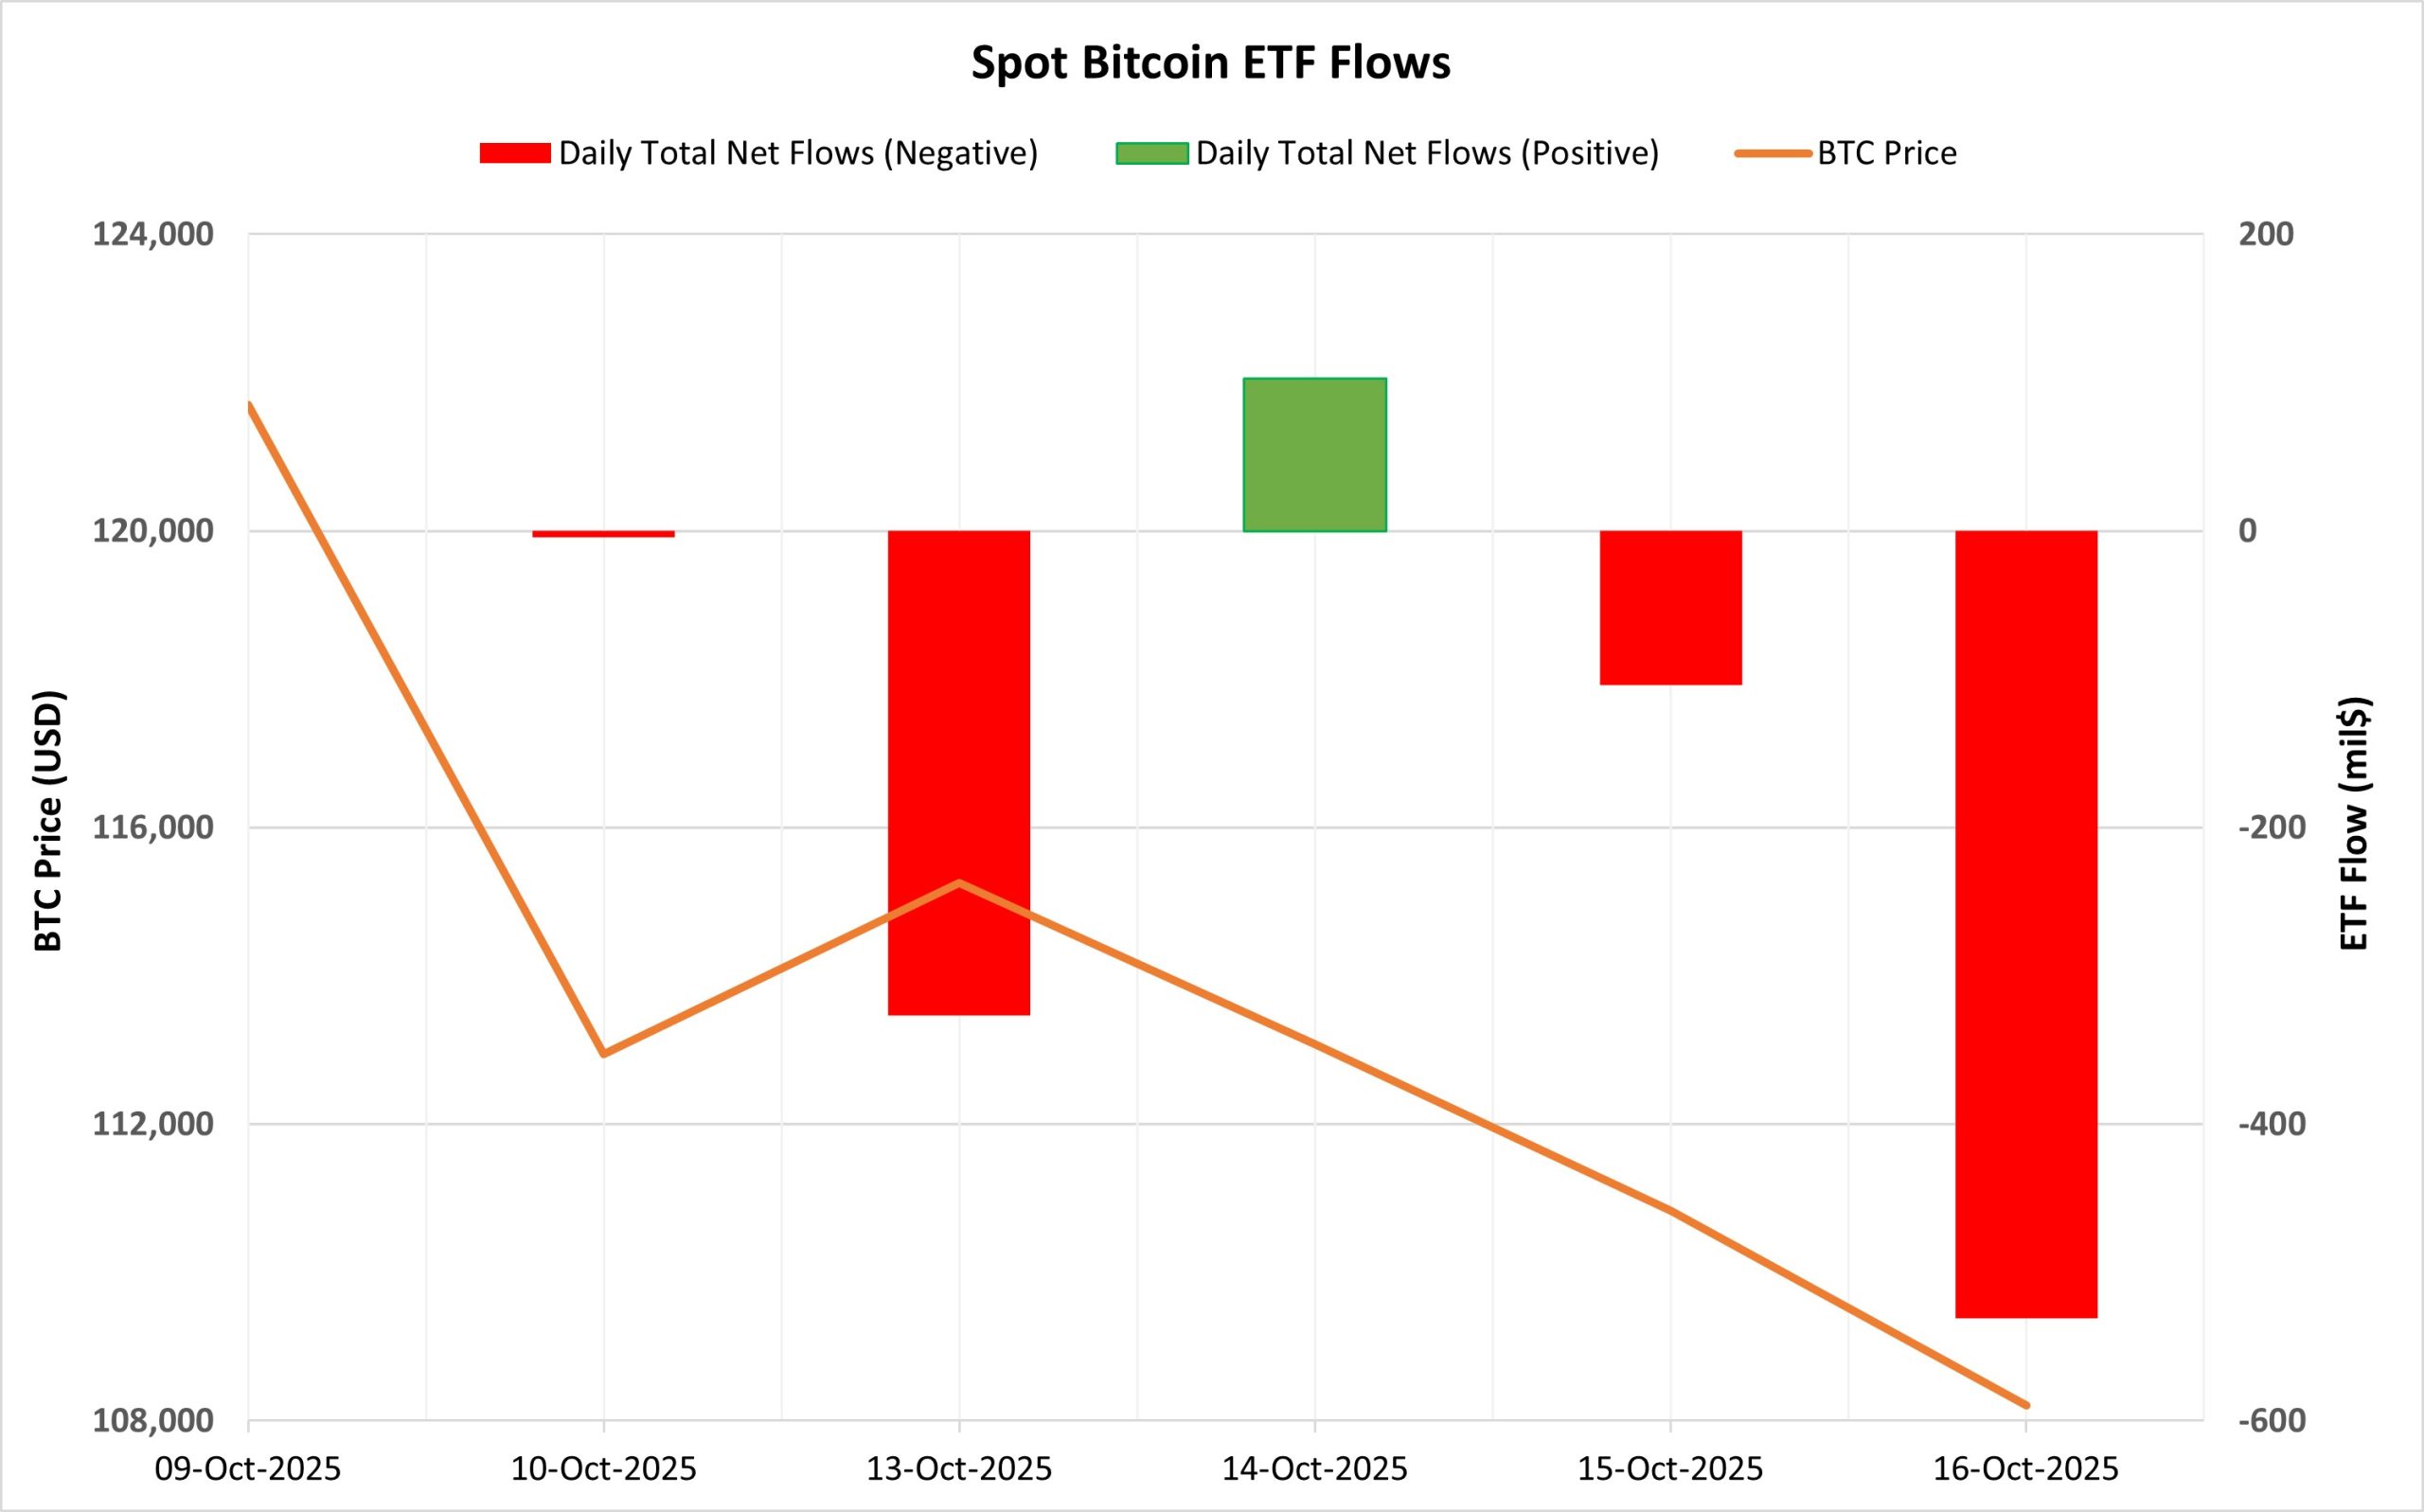
Netflow Status: Between October 10-16, a total of $863.2 million en net outflows occurred from Spot Bitcoin ETFs. The largest daily outflow occurred el October 16, amounting to $530.9 million. In terms of funds, BlackRock IBIT provided a limited positive contribution with an inflow of $64.2 million, while outflows from ARKB and Grayscale GBTC pushed the overall table into negative territory. The positive net flow series, which had continued for 9 trading days, ended el October 10.
Bitcoin Price: Bitcoin opened at $121,700 el October 10 and closed at $108,207 el October 16. During this period, the Bitcoin price lost 11.09% of its value. The sharp decline en the crypto market el October 10 was also clearly felt el the ETF side. While price movements remained under pressure throughout the week, limited inflows weakened the market’s recovery momentum.
Cumulative Net Inflows: 443. By the end of the trading day, cumulative total net inflows into Spot Bitcoin ETFs fell to $61.87 billion.
| DATE | COIN | PRICE | ETF Flow (mil$) | ||
| Open | Close | Change % | |||
| October 10, 2025 | BTC | 121,700 | 112,941 | -7.20% | -4.5 |
| October 13, 2025 | 115,073 | 115,250 | 0.15% | -326.4 | |
| October 14, 2025 | 115,250 | 113,071 | -1.89% | 102.7 | |
| October 15, 2025 | 113,071 | 110,832 | -1.98% | -104.1 | |
| October 16, 2025 | 110,832 | 108,207 | -2.37% | -530.9 | |
| Total for Oct 10-16, 2025 | -11.09% | -863.2 | |||
The selling pressure that began el October 10 also reflected en the ETF market, with an increase en net outflows from funds drawing attention. The concentration of large outflows el the Grayscale and ARK sides en particular indicates a decline en institutional risk appetite en the short term. If this trend continues, the stabilization process en the Bitcoin ETF market may be prolonged. However, if outflows decrease and flows turn positive again, ETF-driven support could gradually restore market confidence.
Ethereum spot ETF
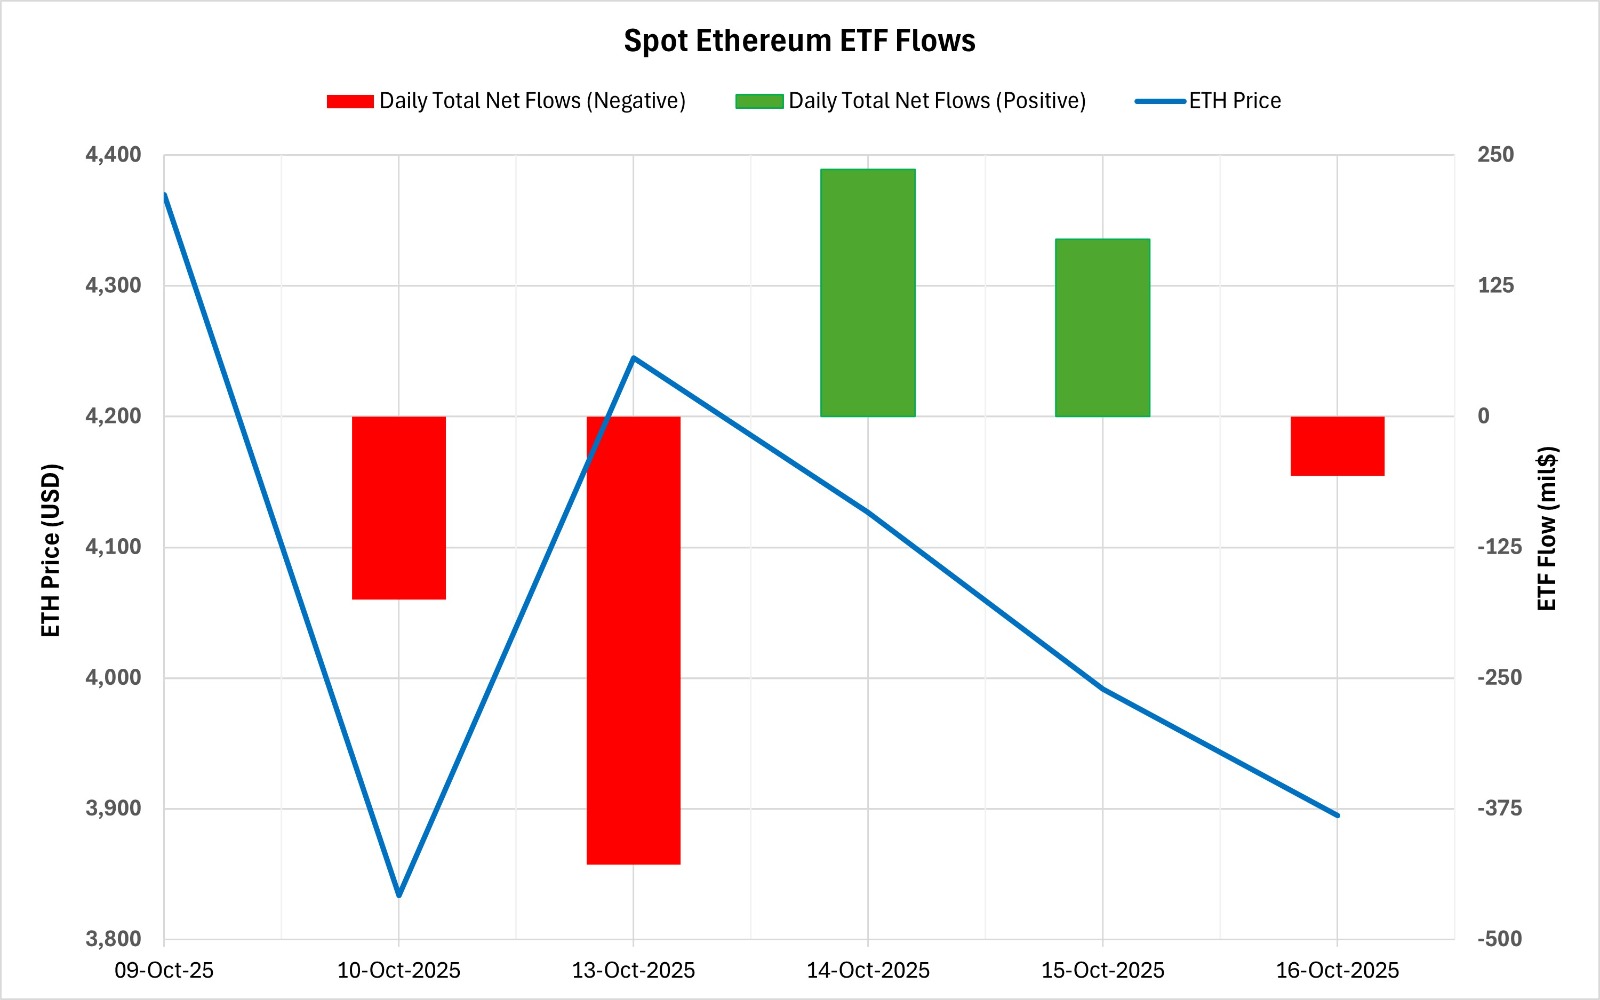
Between October 10-16, 2025, Spot Ethereum ETFs saw a total net outflow of $254.4 million. The largest daily outflow was recorded el October 13 at $428.5 million. In terms of funds, BlackRock ETHA stood out with a net outflow of $179.1 million. No clear direction emerged during this period, and flows were volatile. By the end of the 311th trading day, the cumulative total net inflow for Spot Ethereum ETFs had declined to $14.85 billion.
| DATE | COIN | PRICE | ETF Flow (mil$) | ||
| Open | Close | Change % | |||
| October 10, 2025 | ETH | 4,370 | 3,834 | -12.27% | -174.9 |
| October 13, 2025 | 4,156 | 4,245 | 2.13% | -428.5 | |
| October 14, 2025 | 4,245 | 4,127 | -2.79% | 236.2 | |
| October 15, 2025 | 4,127 | 3,991 | -3.27% | 169.6 | |
| October 16, 2025 | 3,991 | 3,895 | -2.42% | -56.8 | |
| Total for October 10-16, 2025 | -10.86% | -254.4 | |||
The Ethereum price started at $4,370 el October 10 and closed at $3,895 el October 16. During this period, Ethereum lost 10.86% of its value. The sharp sell-off el October 10 and weak demand en the following days particularly suppressed ETF flows. Although recovery efforts were seen after the market crash el September 10, no clear direction emerged el the institutional side. Overall, the volatile structure en recent weeks indicates that investors are acting cautiously and fund inflows have lost momentum. If inflows resume their recovery trend en the coming period, this could strengthen market confidence. Otherwise, weak demand for funds could continue to weigh el Ethereum’s overall market outlook.
Bitcoin Options Distribution
Source: Laevitas
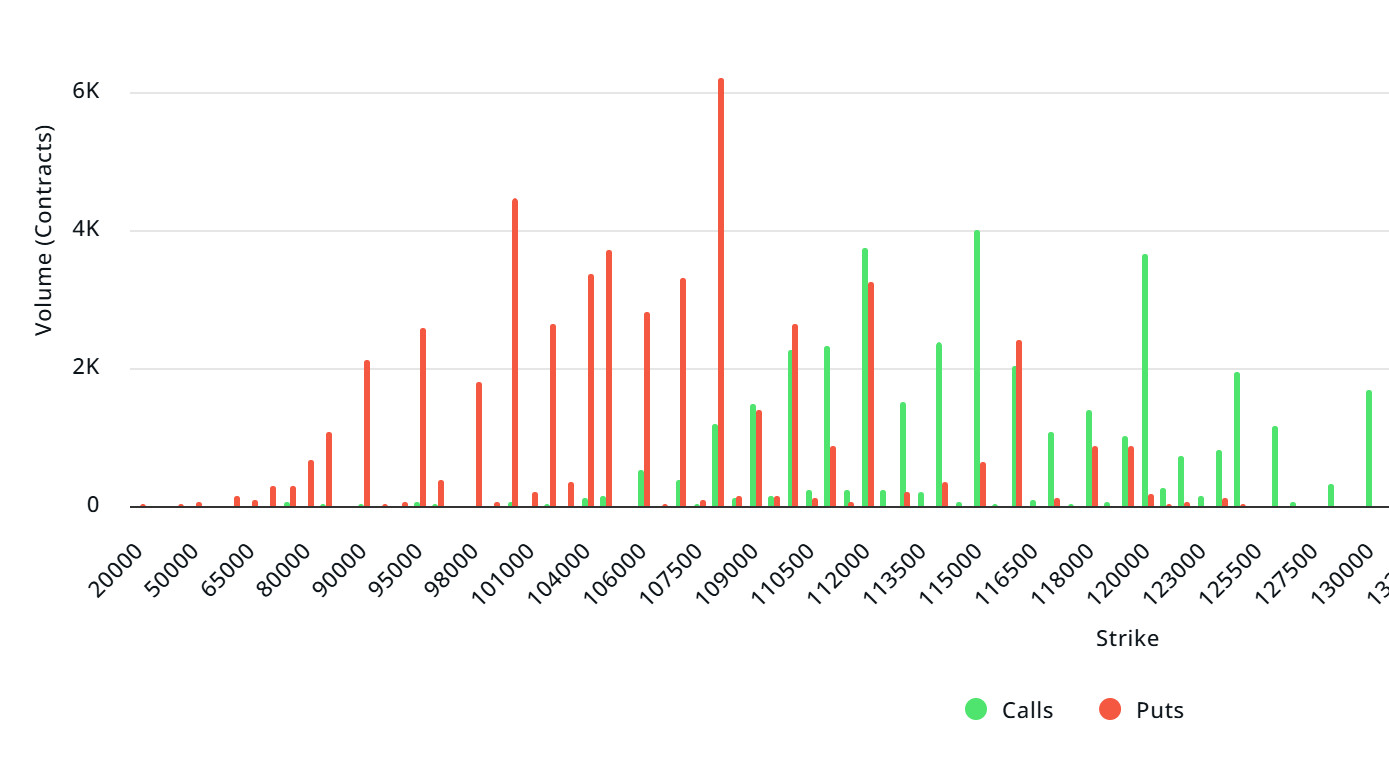
BTC: Notional: $4.74B | Put/Call: 1.32 | Max Pain: $116K
Deribit Data: Deribit data shows that BTC option contracts with a notional value of approximately $4.74 billion expire today. At the same time, looking at the risk transformation over the next week based el the last 24 horas’ data, put options are dominating over call options en terms of risk hedging. When examining expected volatility (IV), it is very close to realized volatility (RV). This could signal violent movements. On the other hand, the negative spread metric indicates a decline en market risk appetite. Skew values are also pointing downward today and for the coming week.
Laevitas Data: Examining the chart, we see that put options are concentrated en a wide band between $85,000 and $108,000. Call options, el the other hand, are concentrated between $112,000 and $120,000, with concentration decreasing towards higher levels. At the same time, the $100,000 level appears to be support, while the $108,000 level appears to be resistance. On the other hand, there are 6.16K put options at the $108,000 level, peaking here and showing a decrease en put volume after this level. Furthermore, 4.04K call option contracts peak at the $115,000 level. Looking at the options market, we see that put contracts dominate el a daily and weekly basis.
Option Maturity:
Put/Call Ratio and Maximum Pain Point: Looking at the options en the latest 7-day data from Laevitas, the number of call options increased por approximately 20% compared to last week, reaching 199.97K. In contrast, the number of put options increased por 50% compared to last week, reaching 191.07K. The put/call ratio for options is set at 1.32. This indicates that there is less demand for call options than put options among investors. Bitcoin’s maximum pain point is seen at $116,000. BTC is currently priced at $105,700 , and if it fails to break above the pain point of $116,000, a continued decline is foreseeable.
Ethereum Options Distribution
Source: Laevitas
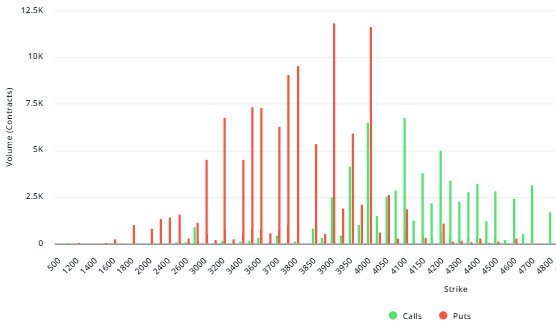
ETH: $0.98 B notional | Put/Call: 1.14 | Max Pain: $4,100
Laevitas Data: Looking at the data en the chart, we see that put options are concentrated particularly at price levels between $3,400 and $3,900. The highest put volume is at the $3,900 level, with approximately 12K contracts, and this level can be considered a potential support zone. On the other hand, call options show a notable concentration between $4,000 and $4,200. The $4,100 level stands out with a high call volume of approximately 7K contracts. This level can be considered an important resistance zone en the market.
Deribit Data: Looking at ATM volatility, it has declined por 15.22% over 24 horas. This tells us that there is pressure el option premiums. The 25 delta risk reversal (RR) value is at -5.63 and has fallen por 5.63% el a daily basis. This means that the demand for put options is stronger than that for calls. On the other hand, open interest (OI) is at $990.62 million and has increased por 3.79%. This shows that new positions are continuing to enter the market and that investors’ desire to stay en the game continues.
Option Expiration
Ethereum options with a nominal value of $0.98 billion expired el October 17. The Max Pain level was calculated at $4,100, while the put/call ratio stands at 1.14.
Legal Notice
The investment information, comments, and recommendations contained en this document do not constitute investment advisory services. Investment advisory services are provided por authorized institutions el a personal basis, taking into account the risk and return preferences of individuals. The comments and recommendations contained en this document are of a general nature. These recommendations may not be suitable for your financial situation and risk and return preferences. Therefore, making an investment decision based solely el the information contained en this document may not result en outcomes that align with your expectations.
