
Weekly Fundamental Analysis Report – August 29
Fear & Greed Index
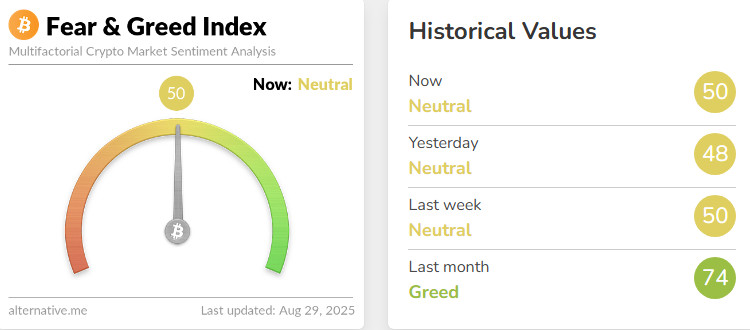
Source: Alternative
Change in Fear and Greed Value: 0
Last Week’s Level: 50
This Week’s Level: 50
The week’s opening was marked by a sharp surge between Sunday night and Monday morning, when a 24,000 BTC sale from a major wallet instantly drove Bitcoin down from $111,000, triggering a forced liquidation of nearly $550 million. While there was an intraday rebound, the shock stifled greed and emphasized caution, preventing the Fear & Greed Index from gaining upward momentum and locking sentiment in a Neutral band for the week. On the institutional side, the picture was not one-sided. Profit realization and unwinding were prominent on BTC, while selective institutional demand for ETH strengthened across spot and OTC channels. Trading volumes remained high, indicating that gradual repositioning was underway following the Sunday night shock. Despite signs of rotation in favor of ETH, this balance did not expand to push the index into Greed territory and the level remained stable around 50.
On the macro front, the revision of the US GDP second estimate to 3.3% supported the growth outlook, while the expectation of a 2.6% annual increase in PCE strengthened the “data dependent” policy rhetoric and limited aggressive rate cut pricing. This framework prevented risk appetite from overdoing itself and reinforced the cautious stance on the crypto side, leading the Fear & Greed Index to end the week unchanged at 50.
Fund Flow
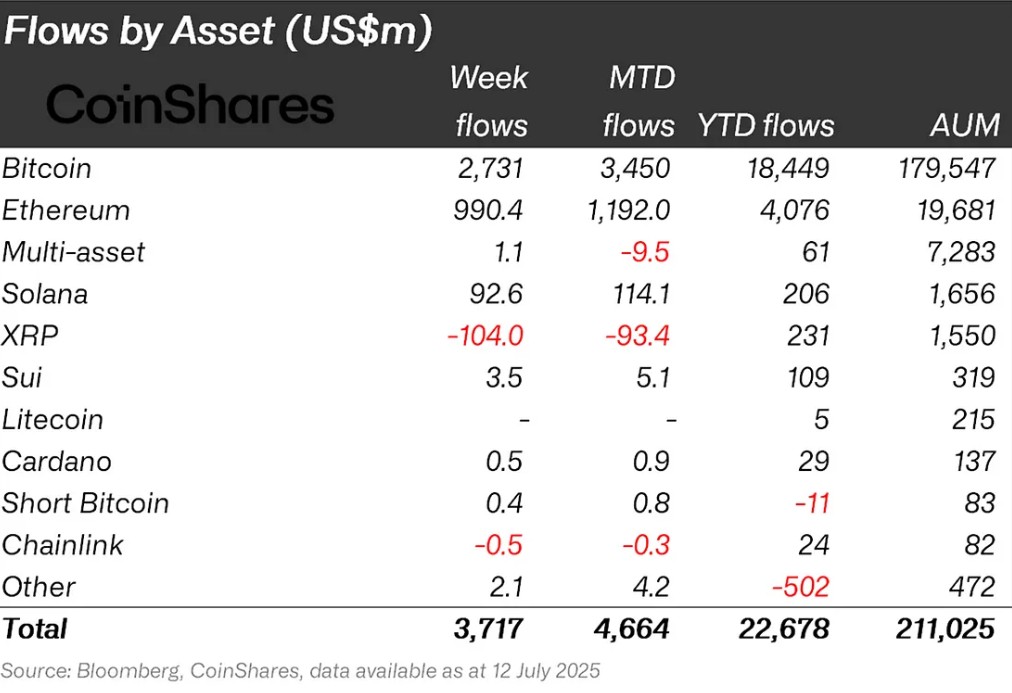
Source: CoinShares
Overview The cryptocurrency market has been weighed down by negative developments such as increased macroeconomic uncertainty, tariff changes and weakening expectations for interest rate cuts. In particular, US President Donald Trump’s increasing pressure on Fed Chair Powell and his team to cut interest rates dampened the markets’ willingness to rally. In addition, the imposition of tariffs and the messages that interest rates would be cut in September increased the selling pressure in the markets. As a result of all these developments, Bitcoin lost about 8%.
Ripple (XRP): Xrp received $25.0 million in fund inflows this week.
Solana (SOL): Recent ETF news continued at Solana. Solana saw inflows of $12.0 million.
Cardano (ADA): The Cardano Foundation continues to launch enterprise-grade auditable products. Cardano saw $2.9 million in inflows this week.
SUI (SUI): SUI has been attracting interest from institutional investors recently. Mill City Ventures, a non-bank lender, recently announced a $450 million private placement to build a crypto treasury strategy for the Sui blockchain. Sui has seen inflows of $8.1 million this week.
Chainlink (LINK): The US Department of Commerce has partnered with Chainlink and Pyth to publish official macroeconomic data on the blockchain. This includes key indicators such as GDP and the PCE Price Index. Link saw $2.1 million in inflows this week as these updates were reported.
Litecoin (LTC): Total inflows on the LTC coin reached $0.3 million.
Other: Altcoins saw sectoral and project-based rallies. These attacks brought an inflow of 3.1 million dollars in fund flow data.
Fund Outflows:
Bitcoin (BTC): Interest rate cut rumors and uncertainty over customs duties created a negative atmosphere in the market. This has dampened interest not only in Bitcoin but also in the altcoin market in general. This week, outflows from Bitcoin-focused funds reached $1.030 billion.
Ethereum (ETH): There were $440.9 million in outflows to Ethereum this week as spot ETH weakened.
Multi-asset: Despite the ETF data, outflows were observed in the multi-asset group.
SUI: The general depreciation in the market also affected the Sui coin. Approximately $12.9 million was exited from Sui this week.
Total MarketCap
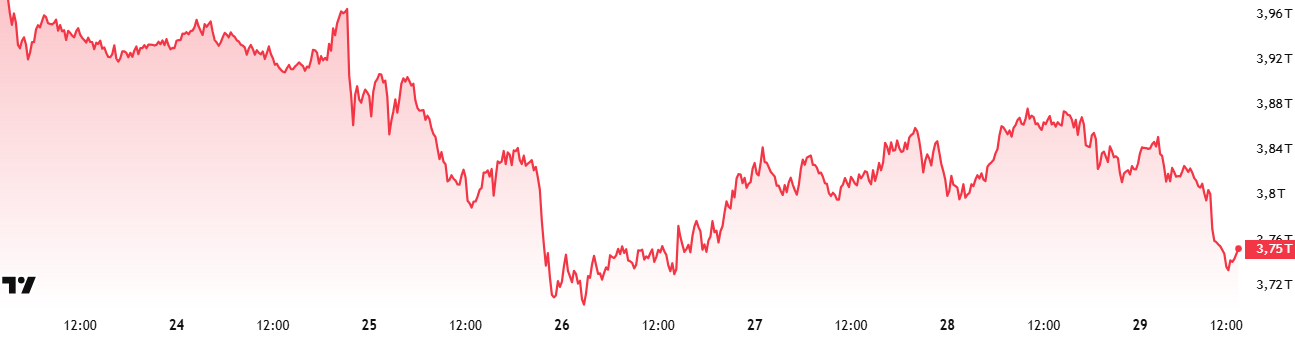
Source: Tradingview
- Last Week Market Capitalization: 90 trillion Dollars
- Market Capitalization This Week: 75 trillion Dollars
The cryptocurrency market recorded a decline of about 3.8% in total market capitalization this week, with a shrinkage of about $148 billion. With this decline, the market capitalization dropped to $3.75 trillion. During the week, the value increased to 3.92 trillion dollars, the peak of the week, while the lowest level was 3.69 trillion dollars. This data shows that the crypto market moved within a band of about a quarter trillion dollars during the week. While this volatility reveals that the market is characterized by high volatility, it also underlines the increase in investors’ risk appetite and the strengthening of market confidence.
Total 2
The Total 2 index, which started the week with a market capitalization of $ 1.43 trillion, fell by 4.8% during the week, reaching $ 1.56 trillion with a loss of approximately $ 80 billion in value. Although it rose to $ 1.65 trillion during the week, it could not be sustained at this level. Although the index came very close to the all-time high level of $ 1.71 trillion, it could not test its peak due to the retreat in Bitcoin price. However, from current levels, is likely to regain momentum for a peak attempt with the potential for a value increase of around 9%.
Total 3
The Total 3 index entered the week with a market capitalization of $1.06 trillion. During the week, it declined by 2.74% with a loss of approximately 29.18 billion dollars in value and fell to 1.04 trillion dollars.
While a positive outlook was observed throughout the market, it was noteworthy that the most robust performance was realized in the Total 3 index. This table reveals that the movements in the altcoin market have started and the market has exhibited a more resilient and stronger structure in other segments. When comparative performance is analyzed, it can be said that especially Ethereum’s share of the total market has decreased significantly this week.
Altcoin Season Index
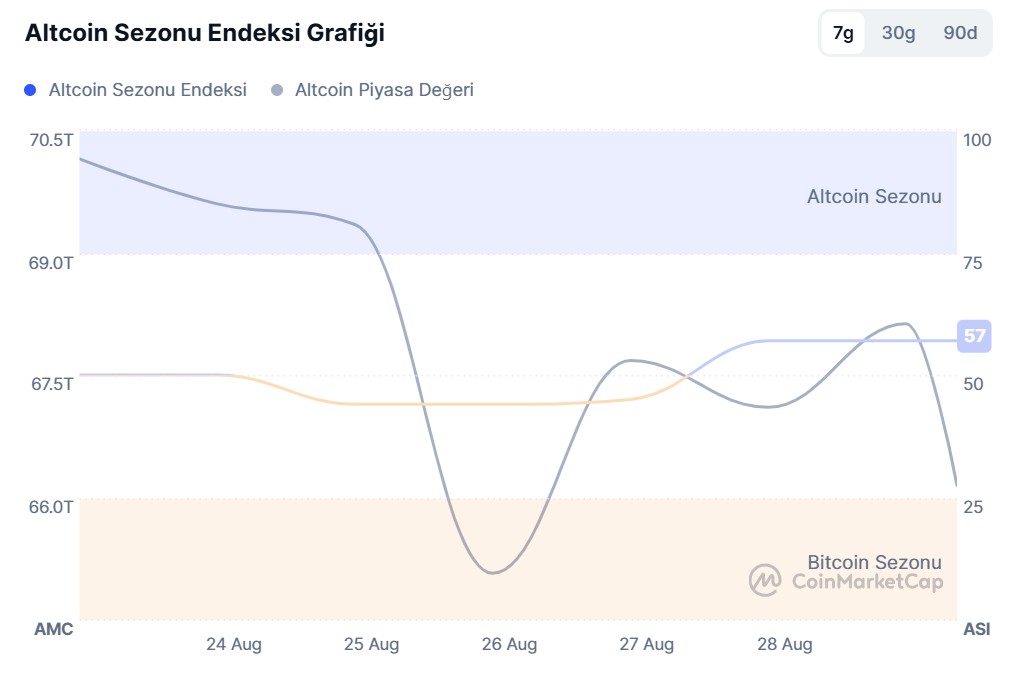
Source: Coin marketcap
- Last Week Index Value: 43/100
- Index Value This Week: 57/100
Between August 22 and August 29, 2025, the correlation between the market capitalization of altcoins (Altcoin Market Cap) and the Altcoin Season Index has been on the rise. The chart shows that this week, the index peaked at 57 on August 28, with the Altcoin Market Cap reaching 1.69T. This indicates a rise in the market dominance of altcoins. The top 5 coins that led the index higher this week were OKB, Pengu, Cro, CFX, Aero. On August 26, the index rose from 44 to 48, indicating that the altcoin season has the potential for a short-term revival and that the total market capitalization of altcoins is experiencing relative progress compared to Bitcoin.
Bitcoin Dominance
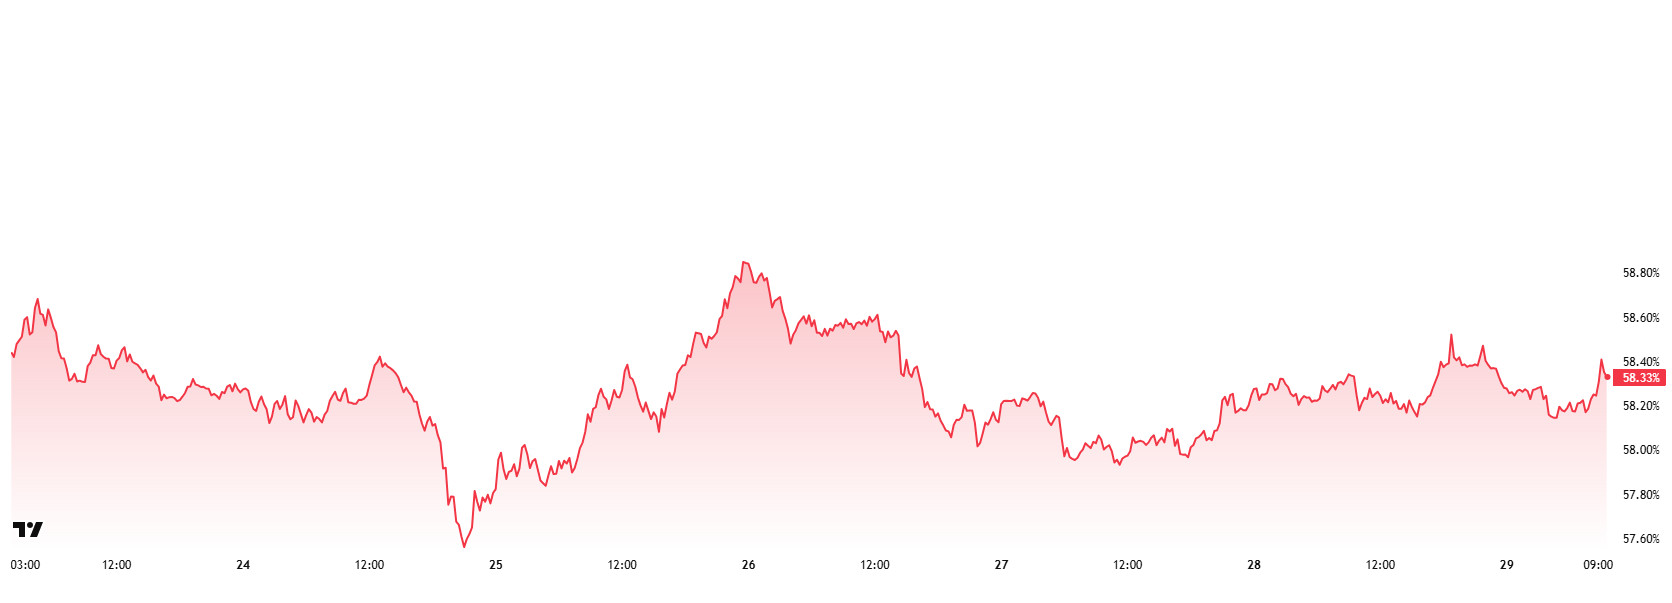
Bitcoin Dominance
Bitcoin dominance, which started the week at 57.92%, rose to 58.80% during the week, but then fell slightly and is currently at 58.33%.
This week, Strategy bought 3,081 Bitcoin, Metaplanet bought 103 Bitcoin, H100 Group bought 46 Bitcoin and The Smarter Web bought 102 Bitcoin.
Data on Bitcoin spot ETFs show a total net inflow of $567.3 million to date.
The likelihood that the FED will cut interest rates in September continues to increase. US President Donald Trump and cabinet ministers also emphasize that the Fed should cut interest rates. These developments on the US side increase the risk appetite of retail investors and pave the way for buying in spot ETFs. In addition, institutional investors also continued to make inflows.
Although there have been positive developments recently, there have been some capital outflows not only in Bitcoin but also in Ethereum and other altcoins. Ethereum, in particular, has recently differentiated itself by outperforming Bitcoin. This further increases the expectation of a decline in Bitcoin’s market dominance, with Bitcoin dominance expected to consolidate in the 57% – 60% band next week.
Ethereum Dominance
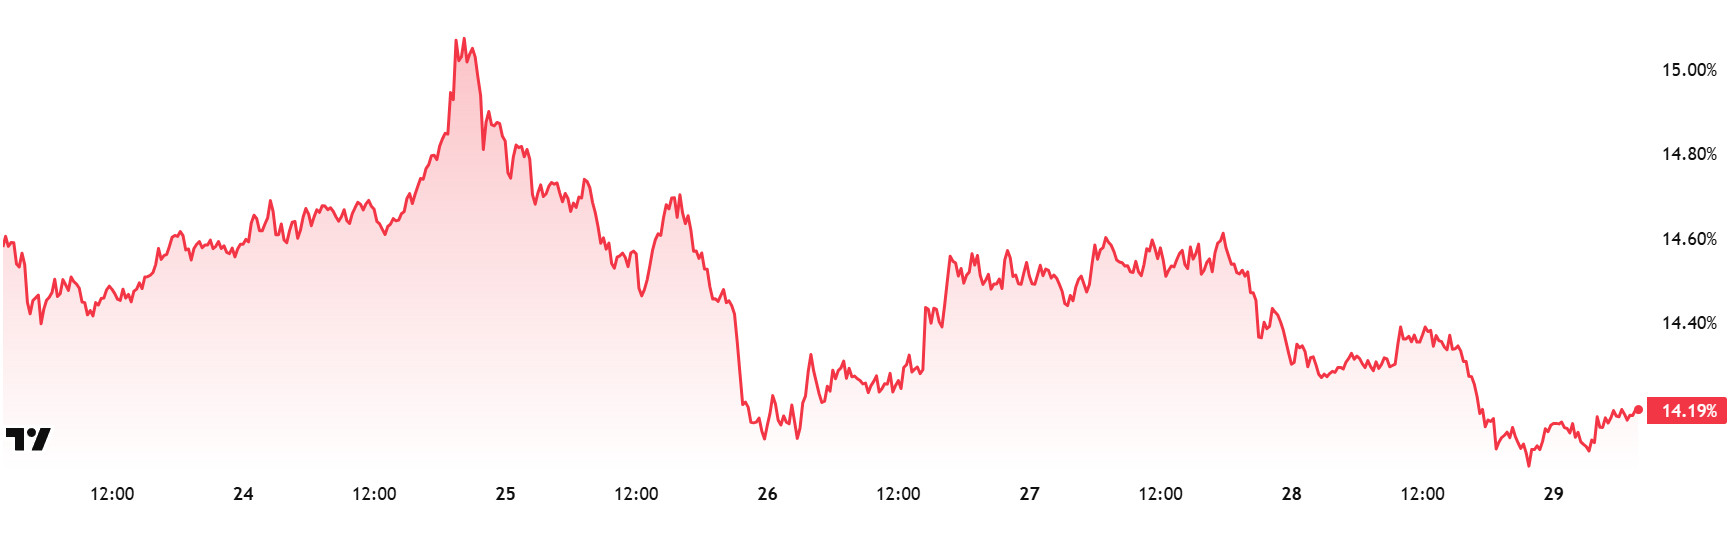
Source: Tradingview
Weekly Change
- Last Week’s Level: 14.79%
- This Week’s Level: 14.19%
Ethereum dominance, which rose as high as 12% in the last week of July, failed to cross this critical threshold and retreated to 11.39%. However, finding support at these levels, the dominance regained a positive momentum and has been on a steady upward trend for the last three weeks. However, the pullback in Ethereum price in the last week brought selling pressure and a limited decline in the dominance was observed.
Accordingly, Ethereum dominance ended last week at 14.79%, while it is trading at around 14.19% as of current data. In the same period, unlike Ethereum, Bitcoin dominance followed a positive trend and showed an upward trend.
When we look at the fundamental developments affecting Ethereum dominance, we see developments on the institutional buying side. BitMine Immersion Technologies, the world’s largest Ethereum treasury led by Thomas Lee, announced that its balance sheet reached $8.8 billion as of August 24. The company’s portfolio includes 1.7 million ETH, 192 Bitcoin and more than half a billion dollars in cash.
On the other hand, Ethereum’s staking system is under increasing pressure. The exit queue reached its highest level as withdrawals outpaced new investments. According to validator queue data, the amount queued for withdrawal from staking reached 1,023,560 ETH (about $4.6 billion) as of August 27. In contrast, the amount waiting to be added to the network remained at 580,637 ETH (approximately $2.6 billion).
Bitcoin Spot ETF
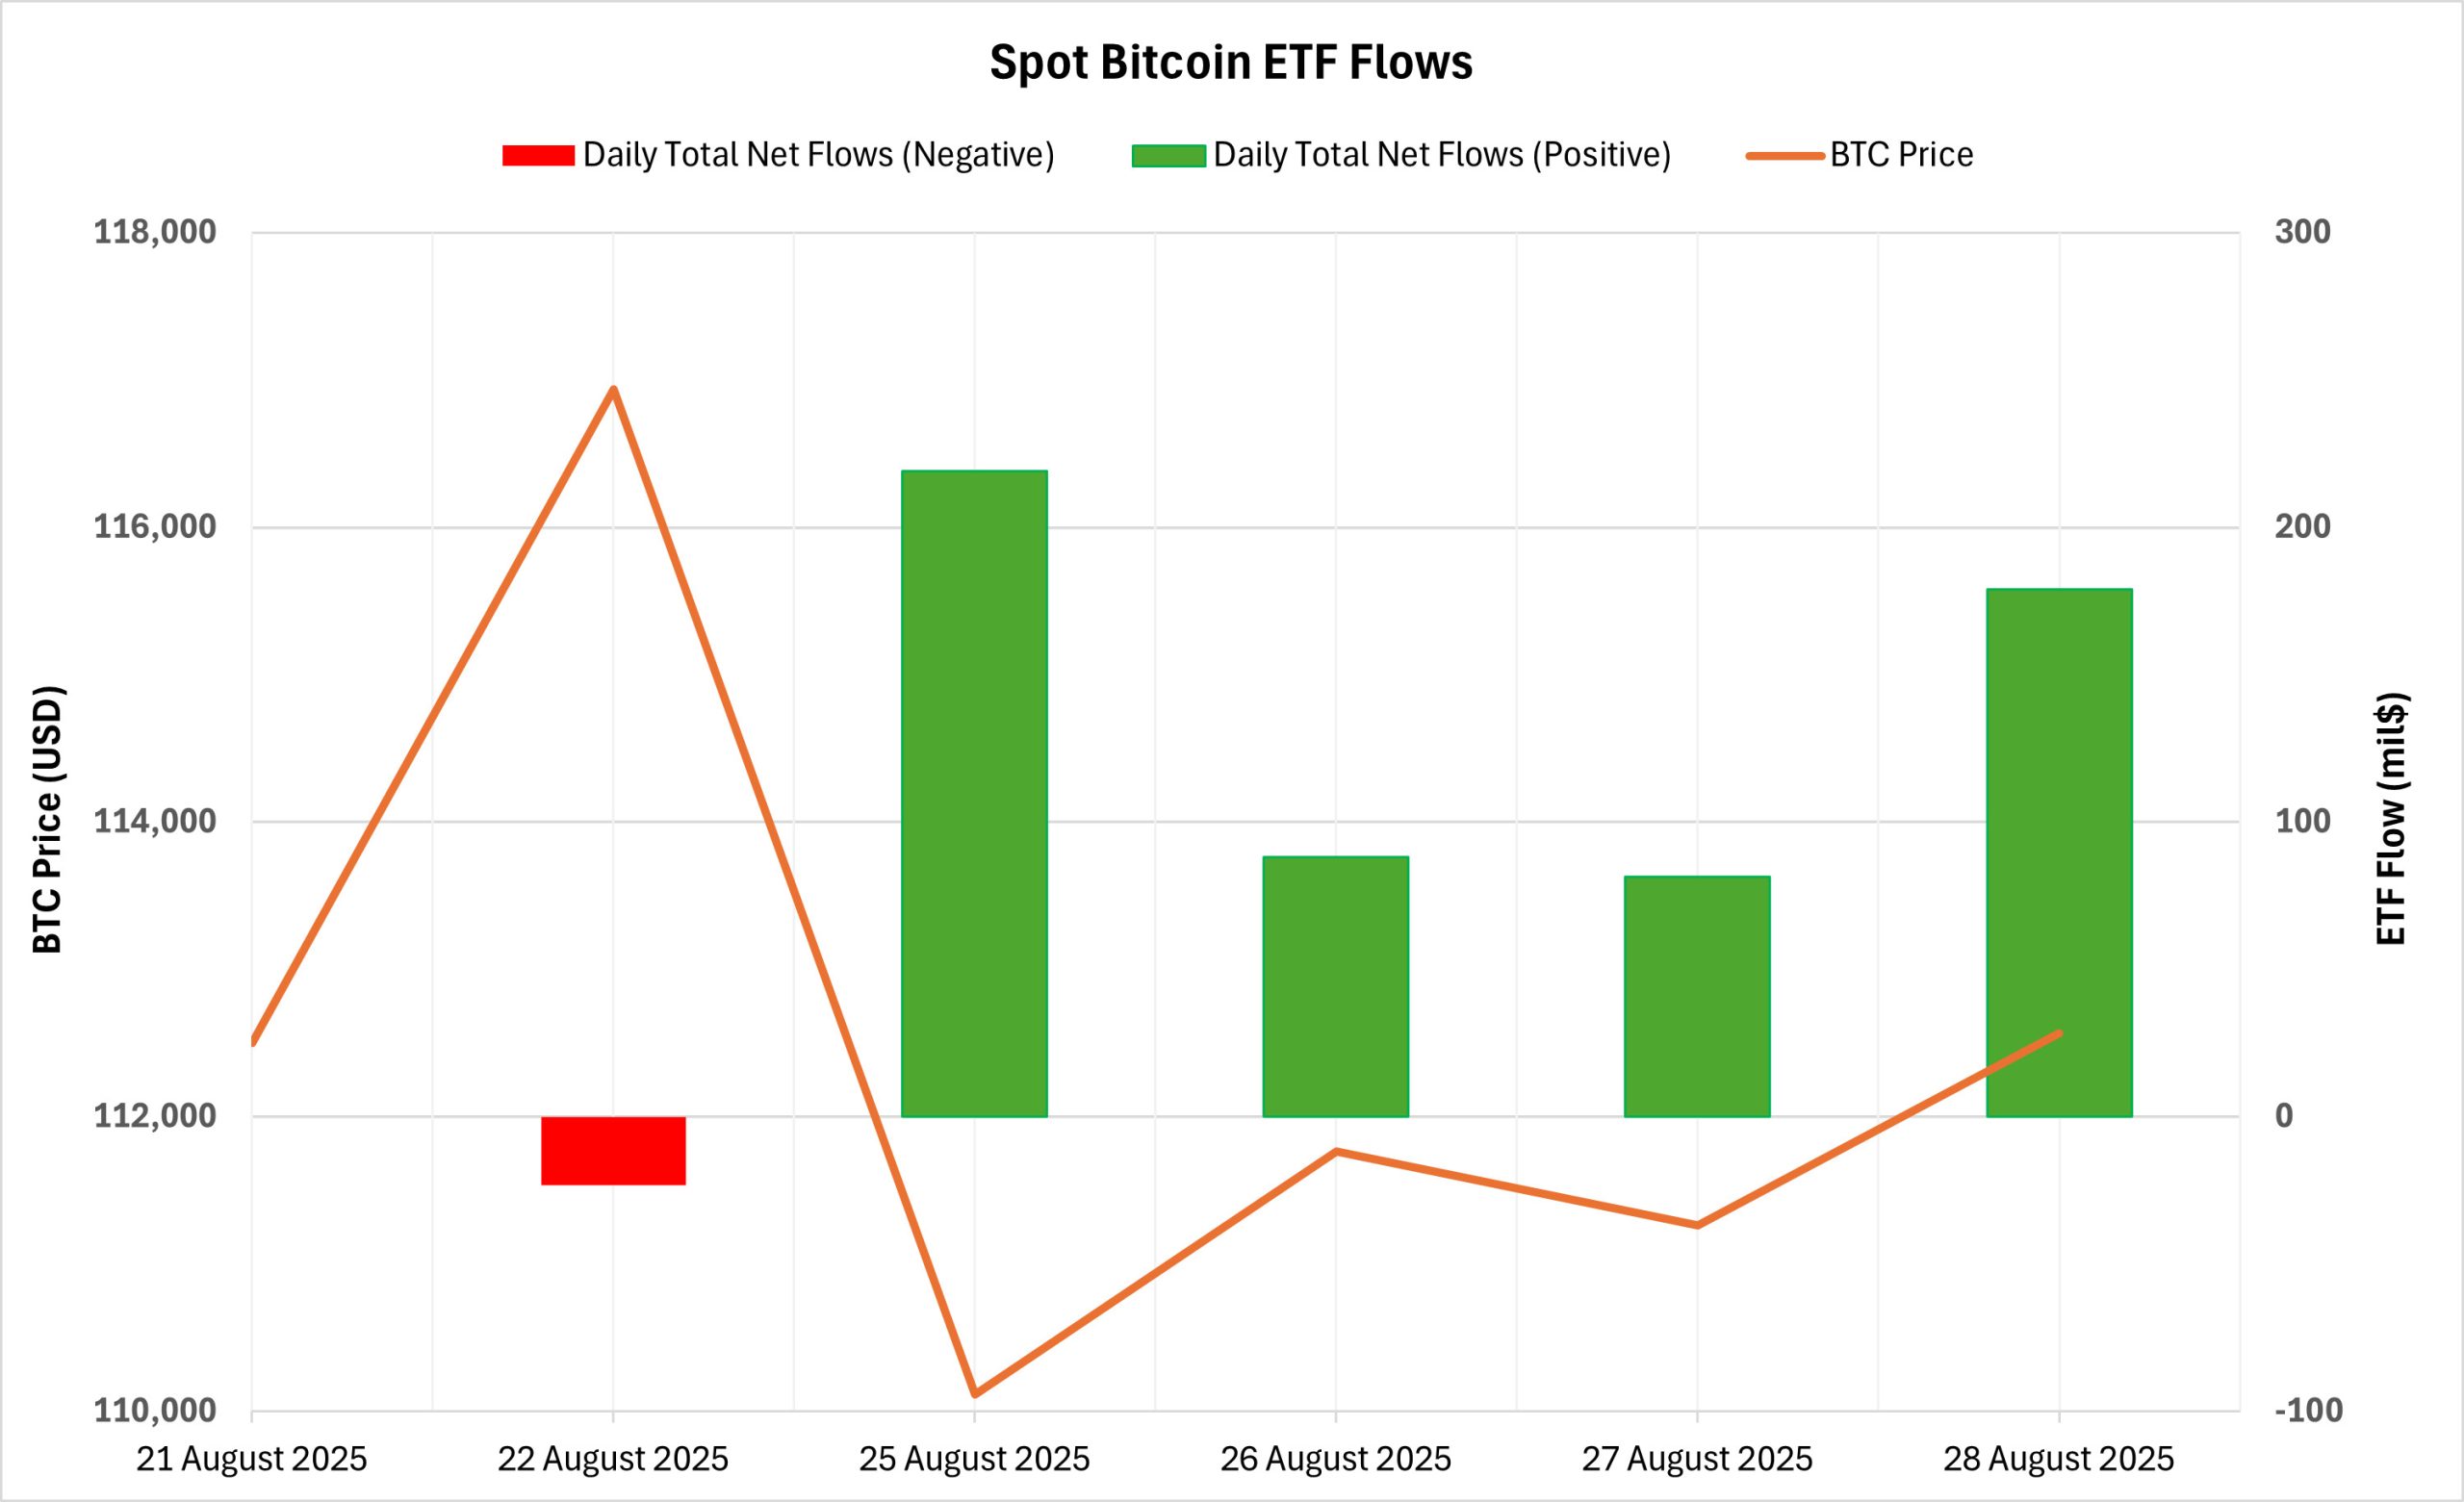
NetFlow Status: Between August 22-28, 2025, Spot Bitcoin ETFs saw net inflows totaling $544.3 million. During this period, BlackRock’s IBIT ETF saw limited inflows, while Fidelity’s FBTC ETF attracted attention with net inflows of $150.6 million and ARK’s ARKB ETF with $216.4 million. With these developments, there has been a series of positive net flows for 4 consecutive trading days.
Bitcoin Price: Bitcoin, which opened at $112,500 on August 22, closed at $112,566 on August 28. In this process, there was a horizontal price movement of 0.06%. Although there were sharp fluctuations, in general, the Bitcoin price managed to remain balanced.
Cumulative Net Inflows: Spot Bitcoin ETFs’ total cumulative net inflows rose to $54.34 billion as of the 409th trading day.
| DATE | COIN | OPEN | CLOSE | CHANGE % | ETF FLOW (mil$) |
|---|---|---|---|---|---|
| 22-Aug-25 | BTC | 112,500 | 116,936 | 3.94% | -23.2 |
| 25-Aug-25 | 113,493 | 110,112 | -2.98% | 219.1 | |
| 26-Aug-25 | 110,112 | 111,763 | 1.50% | 88.1 | |
| 27-Aug-25 | 111,763 | 111,262 | -0.45% | 81.4 | |
| 28-Aug-25 | 111,262 | 112,566 | 1.17% | 178.9 | |
| Total for 22 – 28 August 25 | 0.06% | 544.3 | |||
The net inflows seen in Spot Bitcoin ETFs between August 22-28 revealed that institutional investor interest is on the rise again. Capital flows, especially into large funds such as ARK and Fidelity, indicate that investors remain optimistic about long-term prospects. The continuation of positive flows despite the flat price indicates that ETF investors are not affected by short-term fluctuations. If this institutional demand for Spot Bitcoin ETFs continues in the coming period, an upward movement on BTC price may occur.
Spot Ethereum ETF
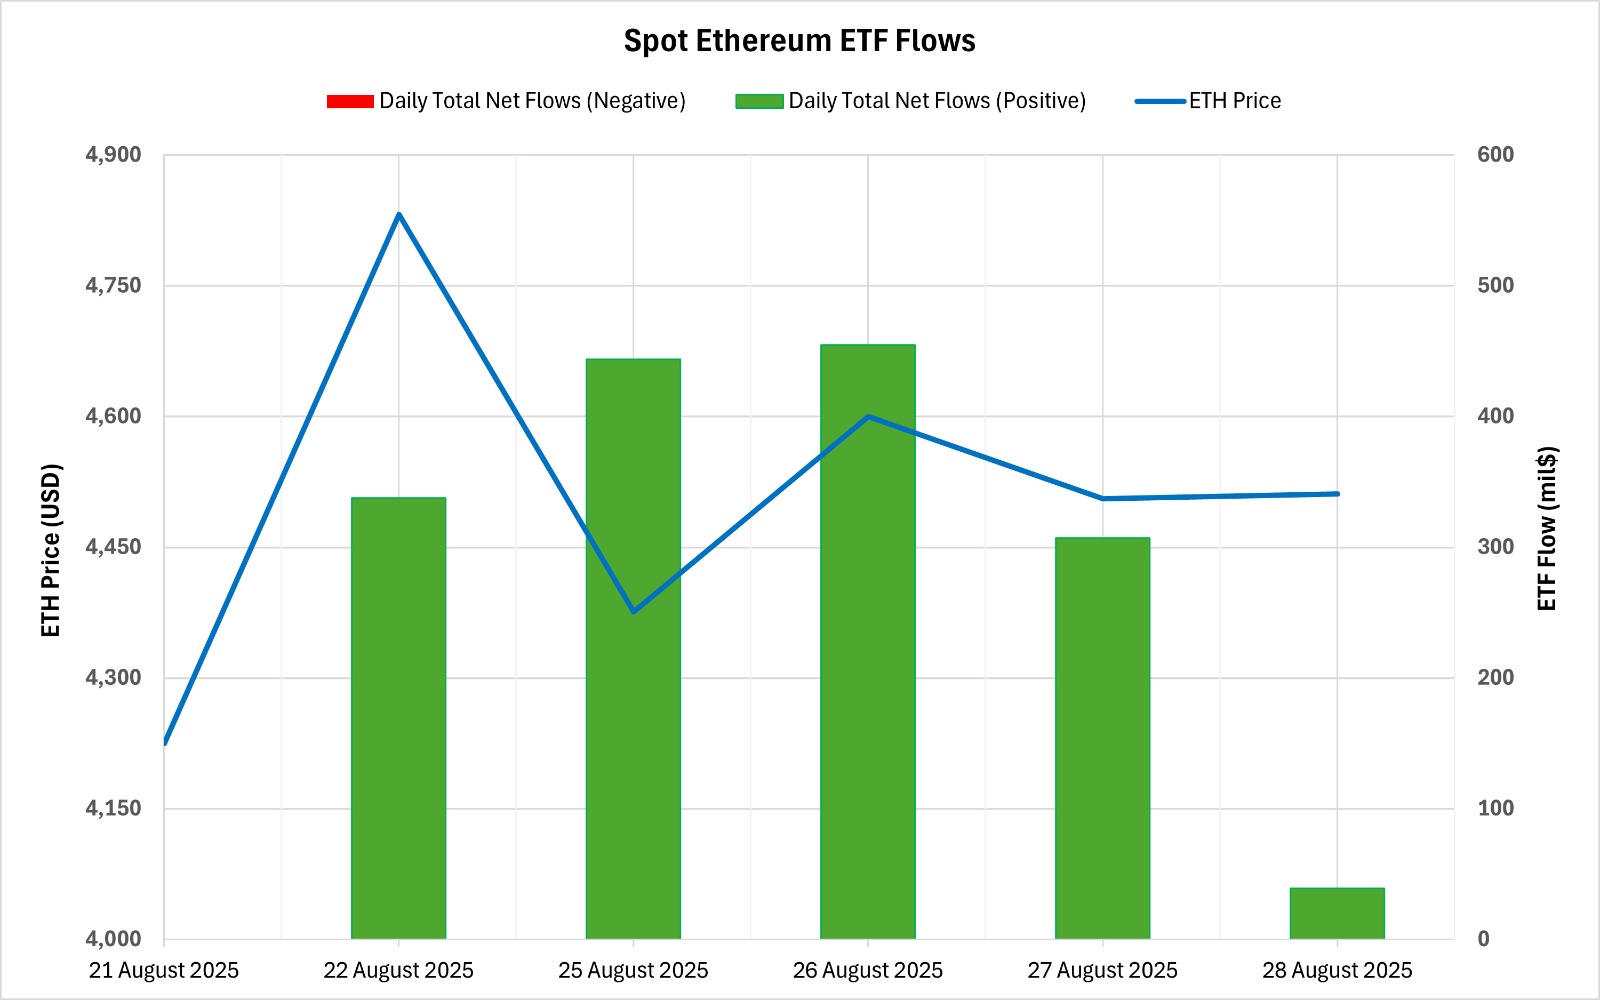
Between August 22-28, 2025, Spot Ethereum ETFs saw a total net inflow of $1.583 billion. The strongest daily inflow was recorded on August 26 with $ 455 million. In this process, BlackRock ETHA stood out with a net inflow of $ 1.077 billion on a fund basis, while the positive net flow series reached 6 days. Cumulative net inflows into spot Ethereum ETFs rose to $13.69 billion at the end of the 277th trading day.
| DATE | COIN | OPEN | CLOSE | CHANGE % | ETF FLOW (mil$) |
|---|---|---|---|---|---|
| 22-Aug-25 | ETH | 4,225 | 4,832 | 14.37% | 337.7 |
| 25-Aug-25 | 4,780 | 4,376 | -8.45% | 443.9 | |
| 26-Aug-25 | 4,376 | 4,600 | 5.12% | 455.0 | |
| 27-Aug-25 | 4,600 | 4,506 | -2.04% | 307.2 | |
| 28-Aug-25 | 4,506 | 4,511 | 0.11% | 39.1 | |
| Total for 22 – 28 August 25 | 6.77% | 1582.9 | |||
The Ethereum price started at $4,225 on August 22 and closed at $4,511 on August 28. In this process, there was a total value increase of 6.77%. In addition, Ethereum price rose above $ 4,950 in the said date range and renewed the ATH level. The fact that the price moves in the same direction with the fund flows shows that institutional demand remains strong. As long as this pace is maintained, the ETF channel may continue to support upward pressure on ETH price.
Bitcoin Options Breakdown
Source: Laevitas
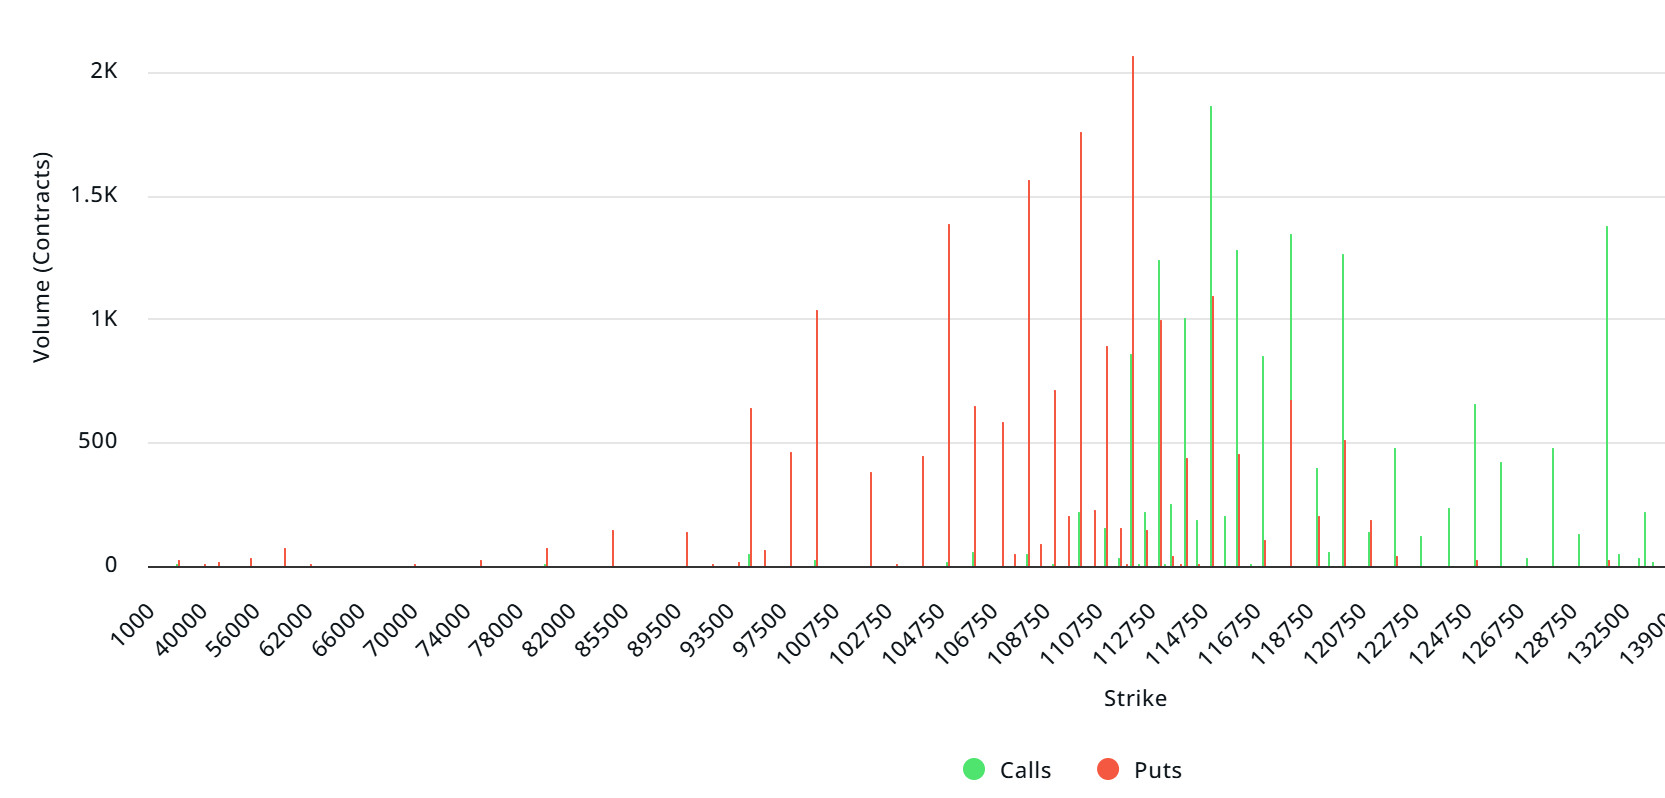
$BTC: Notional: $11.7B | Put/Call: 0.79 | Max Pain: $116K
Deribit Data: Deribit data shows that BTC options contracts with a notional value of approximately $11.7 billion expired today. At the same time, according to the data in the last 24 hours, if we look at the risk conversion in the next 1 week, put options are the dominant side in hedging more than call options. When we examine the expected volatility, it is below the realized volatility. This shows that put option fees are expensive. This may lead investors to call options. On the other hand, the negative spread value shows us that the risk appetite of the market is low. Skew values are highly bearish today and next week.
Laevitas Data: When we examine the chart, it is seen that put options are concentrated in the band of 100,000 – 112,000 dollars. Call options are concentrated between $ 115,000 – $ 130,000 and the concentration decreases towards the upper levels. At the same time, the level of approximately 110,000 dollars is seen as support and 116,000 dollars as resistance. On the other hand, there are 2.06K put options at the $112,000 level, where there is a peak and there is a decrease in put volume after this level. However, it is seen that 1.82K call option contracts peaked at $ 115,000. When we look at the options market, we see that call contracts are dominant on a daily and weekly basis.
Option Maturity:
Put/Call Ratio and Maximum Pain Point: In the last 7 days of data from Laevitas, the number of call options increased by about 9% compared to last week to 112.83K . In contrast, the number of put options was 96.41K, up 6% from last week. The put/call ratio for options was set at 0.79. This indicates that call options are much more in demand among investors than put options. Bitcoin’s maximum pain point is seen at $116,000. It can be predicted that BTC is priced at $111,430 and if it does not break the pain point of $116,000 upwards, the declines will continue.
Ethereum Options Distribution
Source: Laevitas
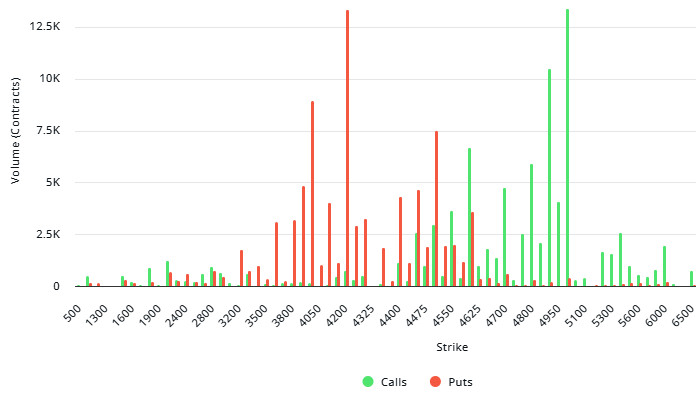
ETH: $3.2 B notional | Put/Call: 0.76 | Max Pain: $3,800
Laevitas Data: Looking at the data in the chart, we see that put options are particularly concentrated at the price levels between $4,200 and $4,500. The highest put volume is at $4,200 with around 13.3K contracts and this level can be considered as a possible support zone. On the other hand, call options are concentrated between $4,600 and $5,000. Especially the $5,000 level stands out with a high call volume of about 13.35K contracts. This level can be considered as an important resistance zone in the market.
Deribit Data: The daily change is quite sharp, there is a 4.83 percent decline. The basis side is slightly negative at -0.015, meaning the futures price is trading slightly below spot. When we look at volatility, at-the-money (ATM) volatility is at 62.5%, down about 1.85% in the last 24 hours. The 25 delta risk reversal value is -1.81, indicating that the market’s interest in put options is stronger than call options. The 25 delta butterfly is at 2.4 and has made a slight upward movement in the last one day. There are remarkable developments on the volume side. The trading volume in call options is 37.5 million dollars, but it has fallen by more than 42 percent in one day. On the other hand, the trading volume in put options is 54.6 million dollars and increased by 54.6 percent. The total 24-hour options volume is at $92.2 million, which represents an increase of 13.5 percent compared to yesterday’s figures. If we make an assessment based on all these data, we can say that the price decline and the increase in the tendency towards put options outweigh the short-term downward expectation in the market.
Option Maturity:
Ethereum options with a nominal value of $3.2 billion expired on August 29. The Max Pain level is calculated at $3,800, while the put/call ratio stands at 0.76.
Legal Notice
The investment information, comments and recommendations contained in this document do not constitute investment advisory services. Investment advisory services are provided by authorized institutions on a personal basis, taking into account the risk and return preferences of individuals. The comments and recommendations contained in this document are of a general type. These recommendations may not be suitable for your financial situation and risk and return preferences. Therefore, making an investment decision based solely on the information contained in this document may not result in results that are in line with your expectations.
