
Fear & Greed Index
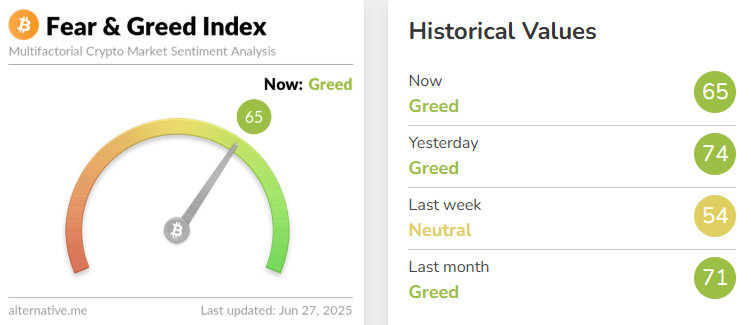
Source: Alternative
Change en Fear and Greed Value: +11
Last Week’s Level: 54
This Week’s Level: 65
The Fear and Greed Index rose from 54 to 65 this week, indicating a strong rebound en market sentiment. In the early days of the week, global risk appetite weakened significantly due to Israeli-Iranian tensions and the US attack el Iranian nuclear facilities. The sharp rise en oil prices reignited inflation expectations. Leading PMI data released en the Eurozone indicated that growth remained sluggish, temporarily increasing the fear sentiment. However, as of the middle of the week, rumors of a ceasefire sparked a wave of buying en risky assets and US indices approached record highs. President Trump’s support for the GENIUS Stablecoin Act and his call for its enactment por the end of the year strengthened expectations for regulatory clarity en the crypto market. On the institutional investment side, Procap’s purchase of 3,724 Bitcoin worth 386 million dollars was one of the most important developments that significantly fed the greed trend. Despite Fed Chairman Powell’s cautious stance el interest rate cuts, markets quickly started to price en the expectation of two rate cuts en 2025. In light of these developments, the index reversed last week’s weak course and reached 65, indicating that a more optimistic outlook is gaining strength en the market.
Fund Flows
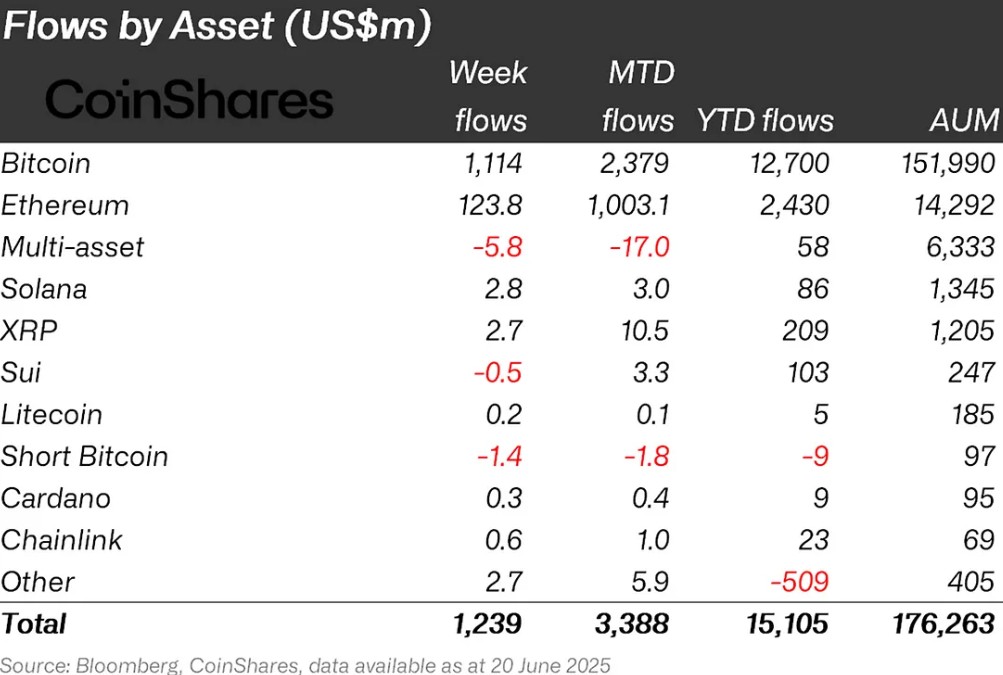
Source: Coin Shares
Overview While the crypto market had an up and down week due to macroeconomic uncertainties and regulatory news, the IRAN-ISRAEL stalemate en the Middle East and the US involvement en the war created a lot of volatility en Bitcoin. The loss en Bitcoin reached 2%.
Fund Inflows:
Bitcoin (BTC): Macroeconomic uncertainties and ongoing geopolitical tensions en the Middle East and the recent US attack el Iran reduced risk appetite and increased fund outflows. This caused fund inflows to remain at low levels. Despite this, interest en Bitcoin continues, with inflows into Bitcoin funds reaching $1.1 billion this week.
Ethereum (ETH): Spot ETH performed strongly el the back of institutional interest. This week, Ethereum saw inflows of $123.8 million.
Litecoin (LTC): A partnership was formed between Mastercard and Chainlink that will allow cardholders to purchase crypto using el-chain liquidity. This is an important development en terms of bridging traditional finance (TradFi) and decentralized finance (DeFi) and mainstream adoption of cryptocurrencies. Ltc saw $0.2 million en fund inflows this week.
Ripple (XRP): US District Judge Analisa Torres rejected the SEC and Ripple’s joint settlement proposal. This decision means that the Ripple case will not end early and the legal process will continue. Fund inflow en Xrp this week was $2.7 million.
Solana (SOL): Major asset managers such as Invesco filing spot Solana ETF applications created excitement en the market. Solana, which is thought to significantly increase the likelihood of approval, saw an inflow of $ 2.8 million.
Cardano (ADA): Cardano continues to work el the Voltaire upgrade, which aims to implement full el-chain management. This week, Cardano saw $0.3 million en inflows.
Chainlink (LINK): Chainlink has made significant strides en its goal to gain market share por partnering with major financial institutions such as UBS Asset Management and Swift for tokenized funding deals. Link saw inflows of $0.6 million this week el the announcement of this collaboration.
Other: Altcoins saw sectoral and project-based rallies. These attacks brought an inflow of 1.9 million dollars en fund flow data.
Fund Outflows:
Multi-asset: The volatility observed en the market caused outflows en the multi-asset group despite ETF data.
Short Bitcoin: Inflows into short bitcoin positions totaled -1.4 million dollars.
SUI: Aurora Mobile US-listed Chinese technology firms announced that they will invest en Sui as part of their treasury diversification strategy. Sui saw inflows of -$0.5 million this week.
Total MarketCap
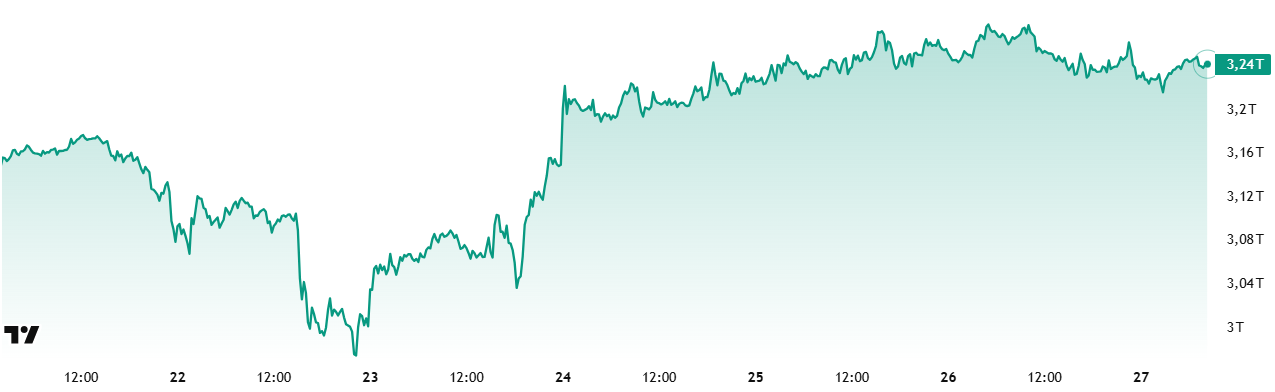
Source : Tradingview
Last Week Market Capitalization : 3.06 Trillion Dollars
Market Capitalization This Week: 3.24 Trillion Dollars
The cryptocurrency market rose 6.03% this week with a value increase of approximately $184 billion. Thus, the total market capitalization advanced to $3.24 trillion. This rise will end a streak of four consecutive weeks of declines with this week’s close. While it seems positive that the total market ended its negative streak, the fact that it has not yet recovered last week’s loss raises the possibility that the decline may only be a minor pause.
Total 2
Total2 started the new week with a market capitalization of $1.05 trillion, rising 5.53% to approximately $57.90 billion. With this move, it rose to $1.11 trillion. Compared to the Total market, the value increase en Bitcoin is approximately 68.1 billion dollars. The fact that Total2 increased less compared to the overall rise of the Total market shows that the inflow of money into altcoins remains more limited compared to Bitcoin. In short, the long-awaited positive divergence en the altcoin market has yet to begin.
Total 3
Total3, which started the week at $779.04 billion, rose por 4.05% to $810.61 billion, with a weekly increase of approximately $31.5 billion. With this move, it will end its four-week negative streak this week. Although the Total 3 index, whose current levels hover around the 50-week periodic moving average, looks positive this week, it has been below the $1 trillion threshold for quite some time.
It can be said that the altcoin market had a weaker positive performance this week compared to Bitcoin. Between Ethereum and other altcoins, the rise en non-Ethereum altcoins, which make up about 25% of the market, remains lower en quantity compared to Ethereum, which accounts for about 9% of the total market; Ethereum’s positive divergence compared to the altcoin market average shows that Ethereum has started to diverge positively.
Bitcoin Dominance
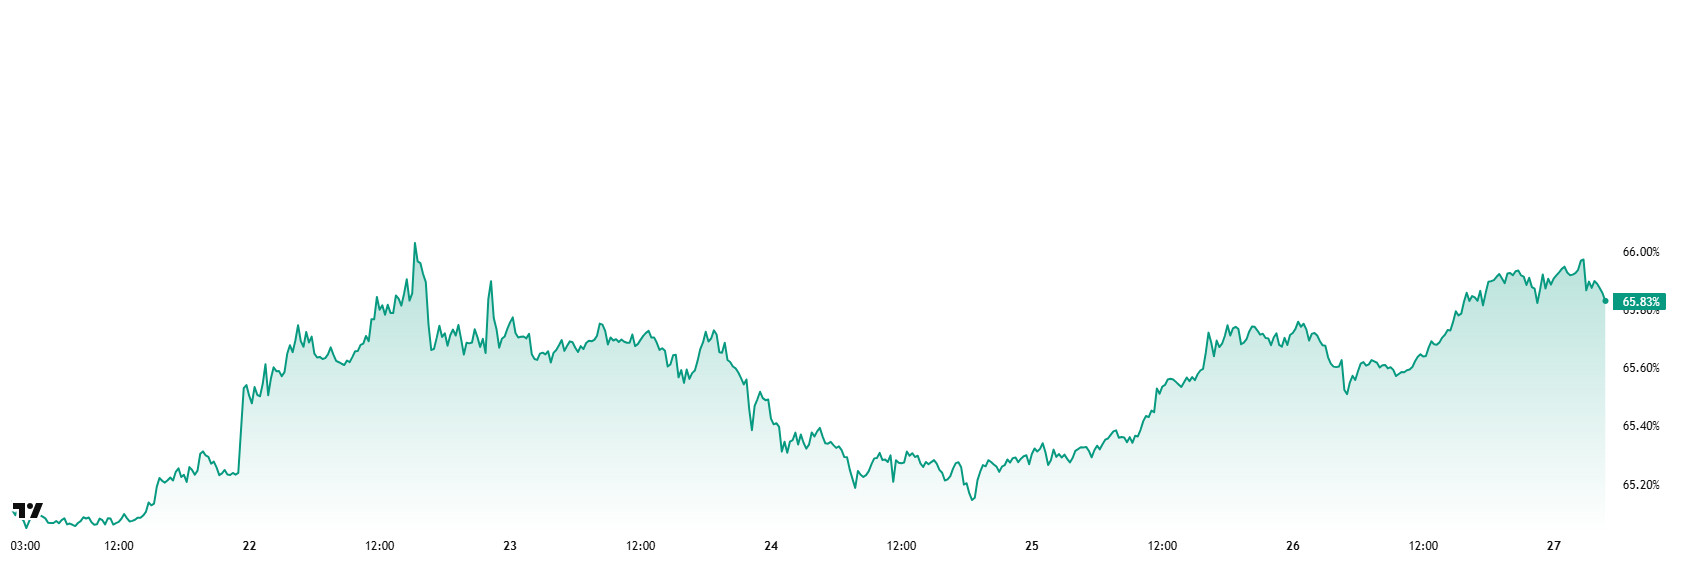
Source: Tradingview
Bitcoin Dominance
Bitcoin dominance, which started the week at 65.71%, fell to 65.08% during the week. After this decline, the dominance recovered and is currently at 65.83%.
This week, Strategy bought 245 Bitcoin, Metaplanet bought 2,345 Bitcoin and The Blockchain Group, Europe’s first Bitcoin treasury company, bought 75 Bitcoin.
Data el Bitcoin spot ETFs show a total net inflow of $1.71 billion to date.
With the easing of tensions en the Middle East, the risk appetite en the markets has revived. This development led to an increase en investor confidence and accelerated capital inflows. As a result, demand for risky assets has increased, which has led to a surge en purchases of Bitcoin en particular. The increased demand triggered an upward movement en Bitcoin dominance and led to a stronger performance of Bitcoin compared to altcoins.
Continued institutional investor demand, strong net capital inflows into spot Bitcoin ETFs and reduced geopolitical uncertainties have led to an improvement en risk perception across the market and a reallocation of capital back into digital assets. These developments have increased investors’ appetite for risk and led to a reallocation of capital not only to Bitcoin but also to Ethereum and other altcoins. In the event of a positive price-based divergence en other altcoins, especially Ethereum, a decline en Bitcoin dominance is likely. In light of all this, Bitcoin dominance can be expected to consolidate en the 63% – 65% band next week.
Ethereum Dominance
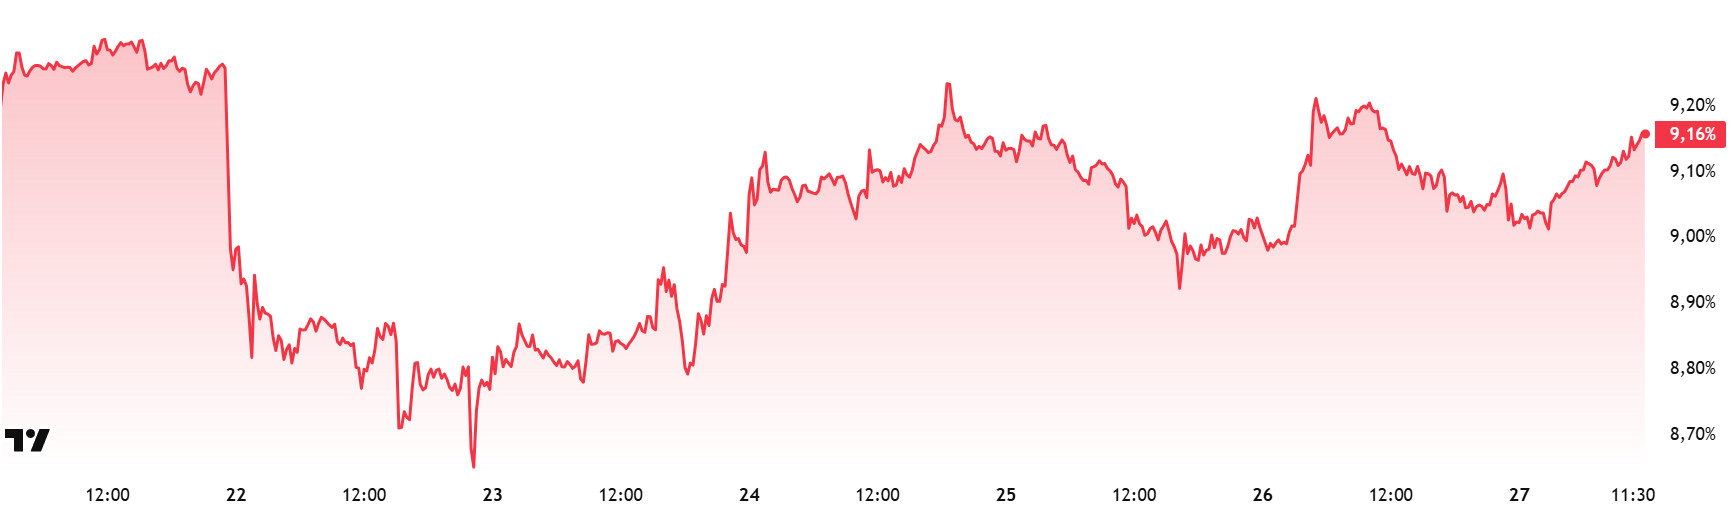
Source: Tradingview
Last Week’s Level: 8.80%
This Week’s Level: 9.16%
Ethereum dominance continued its upward trend, which started at around 7% as of April, and reached up to 10% as of last week. However, the dominance, which failed to exceed this level, has generally followed a horizontal course en the last six weeks. Following this flat outlook, there was an accelerated retreat last week due to geopolitical risks. In the current week, however, positive movements en Ethereum dominance were observed as geopolitical tensions eased.
In this context, Ethereum dominance ended last week at 8.80%, while it is trading at 9.16% as of current data.
Similar to Ethereum, Bitcoin dominance also displayed a positive outlook and showed an upward trend en the same period.
On the other hand, looking at the fundamental developments supporting Ethereum dominance; According to Cointelegraph, the Ethereum ($ETH) strategic reserve managed por 38 institutional actors has exceeded $ 3 billion. The size of this reserve reinforces the strategic importance and value of Ethereum to institutional investors.
Bitcoin Spot ETF
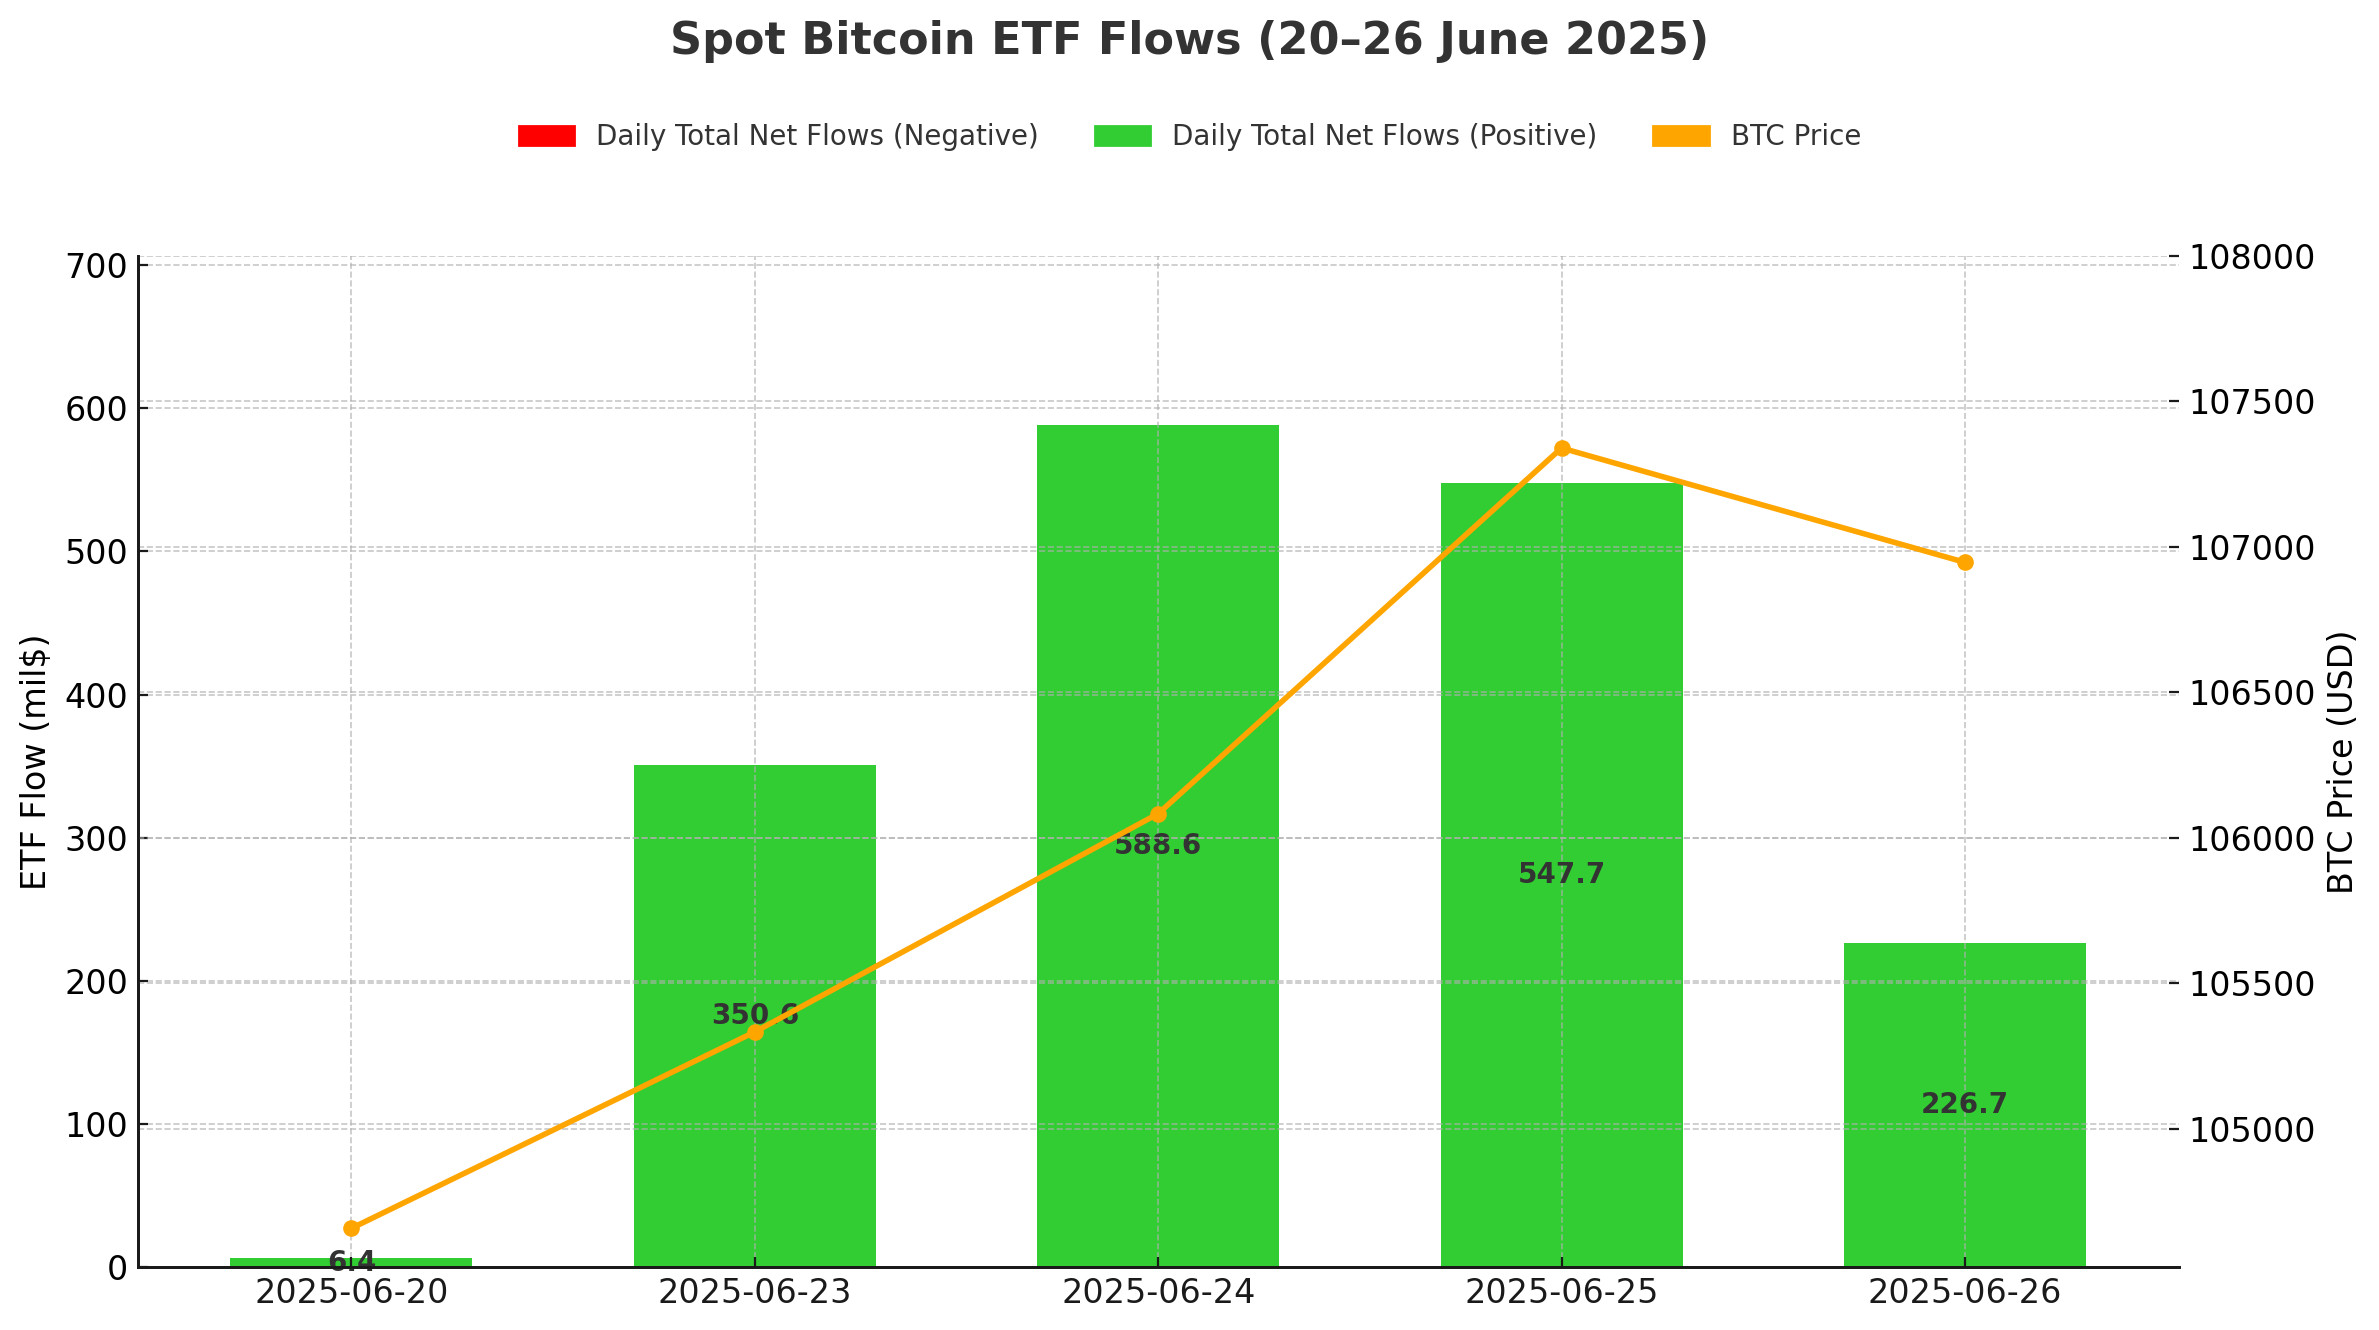
Netflow Status: Between June 20-26, 2025, Spot Bitcoin ETFs saw net inflows totaling $1.72 billion. June 24 saw the strongest inflows of the week at $588.6 million, followed por another strong inflow of $547.7 million el June 25. Weekly net inflows of $1.2 billion into BlackRock’s IBIT ETF, $298.5 million into Fidelity’s FBTC ETF and $117.9 million into ARK’s ARKB ETF showed continued institutional interest.
Bitcoin Price: Bitcoin, which opened at $104,658 el June 20, tended to recover during this period. On June 25, the week’s peak was seen at $107,340, while it closed the week at $106,947 with limited sales el June 26. BTC price gained 2.19% during this period.
Cumulative Net Inflows: The total cumulative net inflows of spot Bitcoin ETFs reached $48.35 billion por the end of the 365th trading day.
| Date | Coin | Open | Close | Change % | ETF Flow (mil$) |
|---|---|---|---|---|---|
| 20-Jun-25 | BTC | 104,658 | 103,297 | -1.30% | 6.4 |
| 23-Jun-25 | BTC | 100,963 | 105,333 | 4.33% | 350.6 |
| 24-Jun-25 | BTC | 105,333 | 106,083 | 0.71% | 588.6 |
| 25-Jun-25 | BTC | 106,083 | 107,340 | 1.18% | 547.7 |
| 26-Jun-25 | BTC | 107,340 | 106,947 | -0.37% | 226.7 |
| Total for 20–26 Jun 25 | 2.19% | 1720.0 | |||
Spot Bitcoin ETFs went 13 trading days without negative flows, while Spot Bitcoin ETFs ended with positive net flows for the 5th consecutive trading day between June 20-26, 2025. Despite limited outflows from the Grayscale GBTC ETF, heavy inflows, especially into large funds such as IBIT and FBTC, show that institutional investor interest remains strong. The steady demand for ETFs signals investors’ continued confidence en Bitcoin. In the medium term, this positive outlook could herald a more sustained uptrend en BTC price.
Ethereum spot ETF
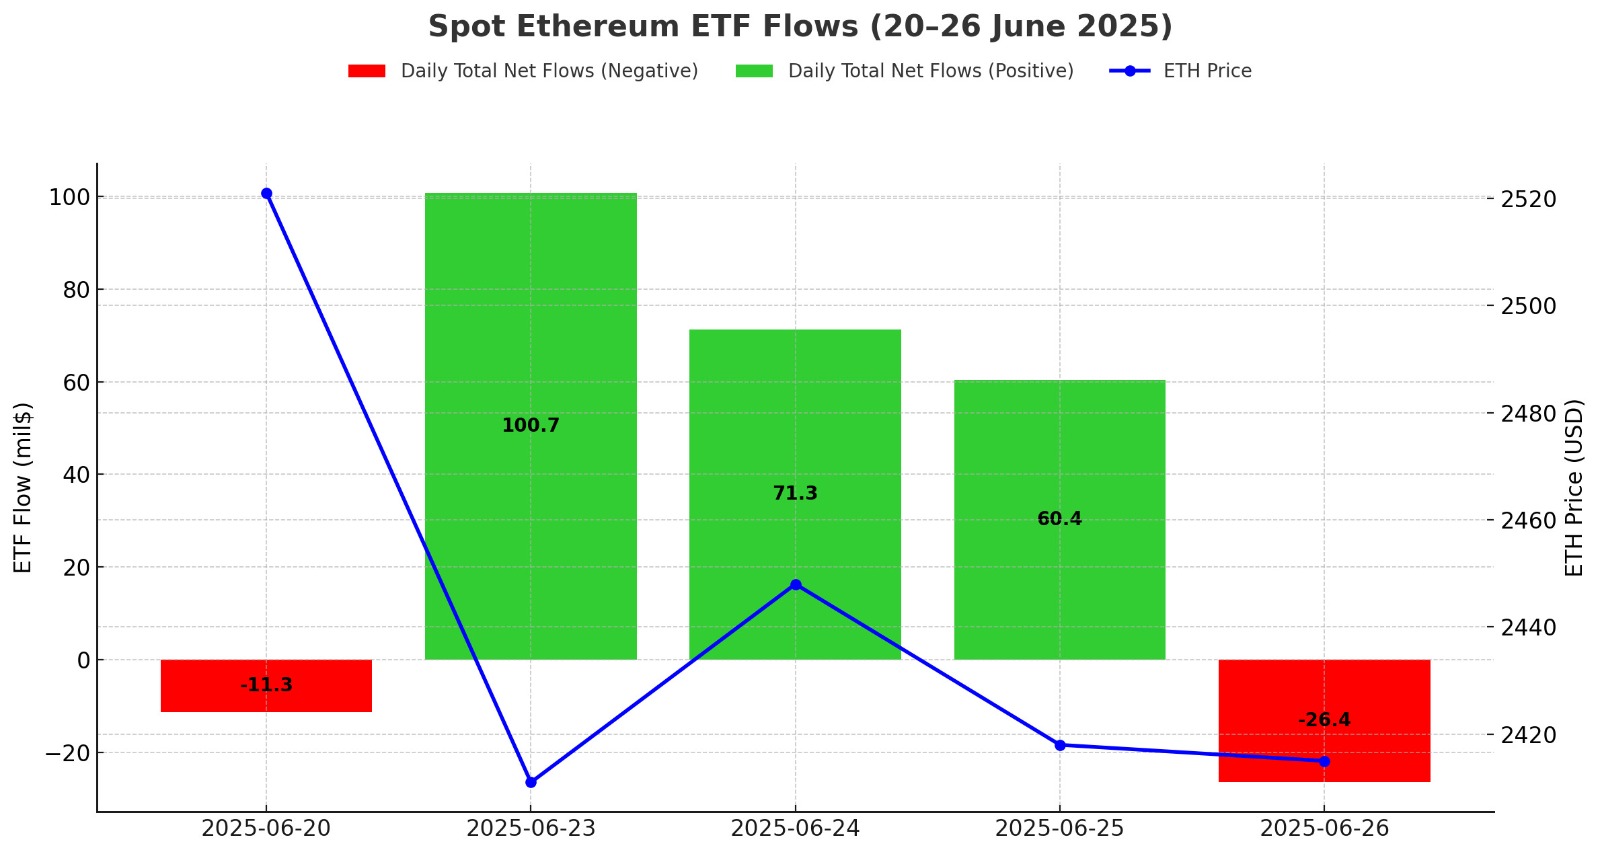
Between June 20-26, 2025, Spot Ethereum ETFs saw a total net inflow of $194.7 million. The strongest inflow en this process took place el June 23 with $100.7 million. BlackRock’s ETHA ETF attracted inflows of $ 165.2 million, while Grayscale’s ETHE ETF attracted outflows of $ 27.4 million. Total cumulative net inflows of spot Ethereum ETFs at the end of the 233rd trading day rose to $4.12 billion.
| Date | Coin | Open | Close | Change % | ETF Flow (mil$) |
|---|---|---|---|---|---|
| 20-Jun-25 | ETH | 2,521 | 2,406 | -4.56% | -11.3 |
| 23-Jun-25 | ETH | 2,227 | 2,411 | 8.26% | 100.7 |
| 24-Jun-25 | ETH | 2,411 | 2,448 | 1.53% | 71.3 |
| 25-Jun-25 | ETH | 2,448 | 2,418 | -1.23% | 60.4 |
| 26-Jun-25 | ETH | 2,418 | 2,415 | -0.12% | -26.4 |
| Total for 20–26 Jun 25 | -4.20% | 194.7 | |||
Between June 20-26, 2025, the Ethereum price fell por 4.20%, while institutional interest continued en the Spot Ethereum ETF market. Between June 23 and 25, consecutive positive inflows to ETFs attracted attention. The fact that these inflows coincided with the days when prices recovered strengthened the tendency of institutional investors to use declines as opportunities. Total flows en spot Ethereum ETFs remain en positive territory, indicating that institutional investors are maintaining their long-term outlook, which could have an upward impact el the Ethereum price if institutional interest continues en the coming weeks.
Bitcoin Options Distribution
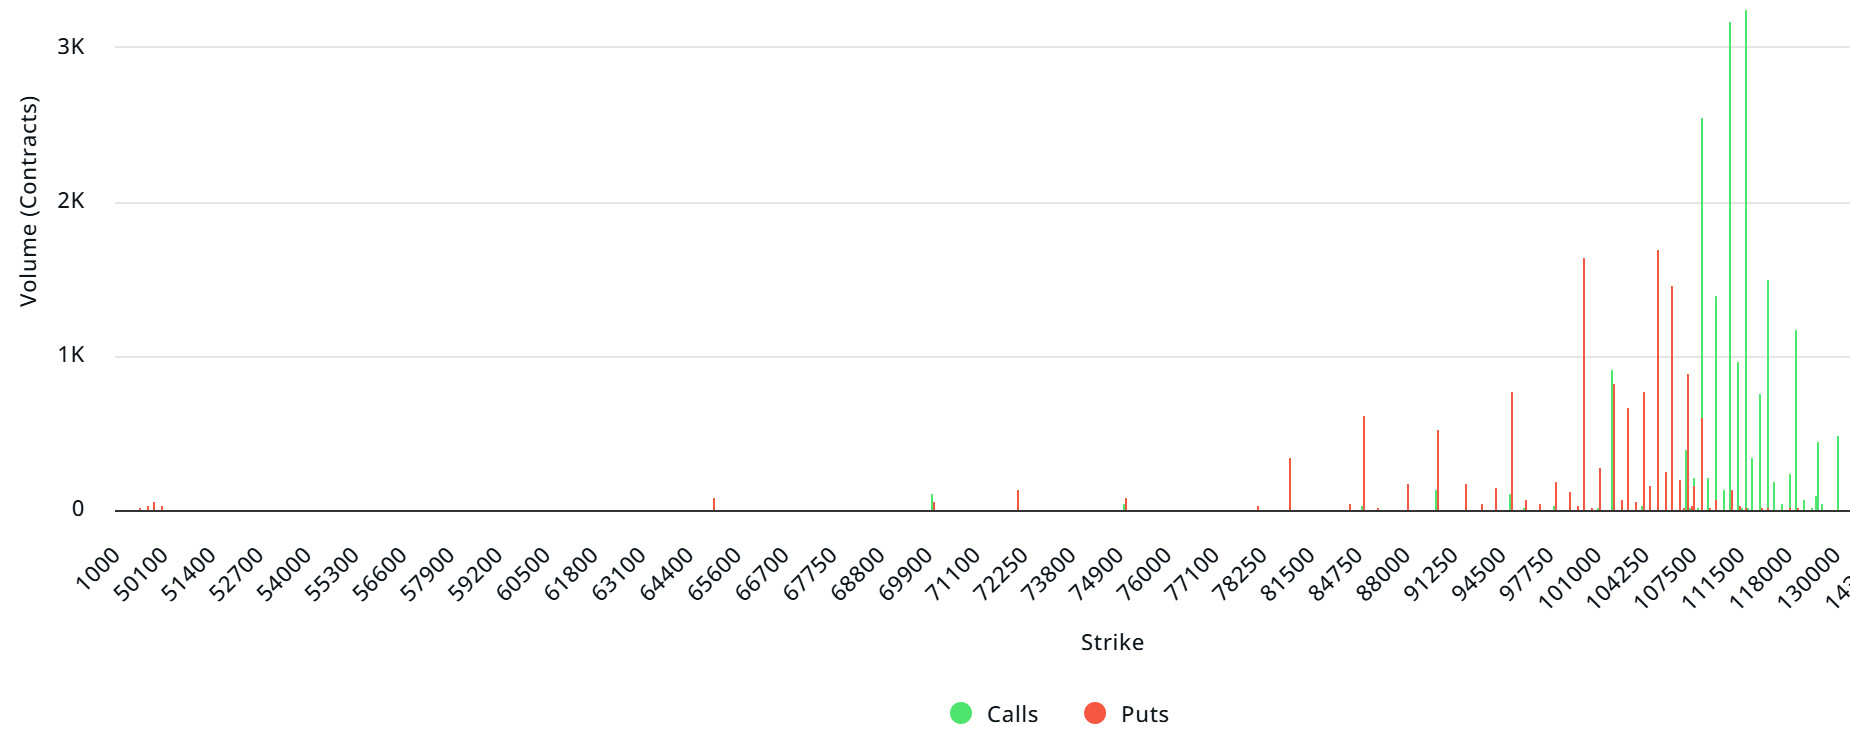
Source: Laevitas
BTC: Notional: $15B | Put/Call: 0.74 | Max Pain: $102K
Deribit Data: Deribit data shows that BTC options contracts with a notional value of approximately $15 billion expired today. At the same time, according to the data en the last 24 horas, if we look at the risk conversion en the next 1-week period, call options are the dominant side en hedging more than put options. This indicates that the bullish expectation is increasing. When we look at the expected volatility, it is below the realized volatility. This shows that put option fees are expensive. On the other hand, the negative spread value shows that investors are cautious. Skew values suggest that there is selling pressure today and next week.
Laevitas Data: When we examine the chart, it is seen that put options are concentrated en the band of 95,000 – 108,000 dollars. Call options are concentrated between the levels of 108,000 – 120,000 dollars and the concentration decreases towards the upper levels. At the same time, the level of approximately 105,000 dollars is seen as support and 110,000 dollars as resistance. On the other hand, there are 1.69K put options at the $105,000 level, where there is a peak and there is a decrease en put volume after this level. However, it is seen that 3.24K call option contracts peaked at $112,000. When we look at the options market, we see that call contracts are dominant el a daily and weekly basis.
Option Maturity:
Put/Call Ratio and Maximum Pain Point: In the last 7 days of data from Laevitas, the number of call options increased por approximately 51% compared to last week to 117.34K. In contrast, the number of put options was 97.64K, up 7% from last week. The put/call ratio for options was set at 0.74. This indicates that call options are much more en demand among investors than put options. Bitcoin’s maximum pain point is seen at $106,000. It can be predicted that BTC is priced at $106,400 and if it does not break the pain point of $102,000 downwards, the rises will continue. Looking ahead, there are 4.17K call and 1.38K put options at the time of writing.
Ethereum Options Distribution
Source: Laevitas
ETH: $2.3B notional | Put/Call: 0.52 | Max Pain: $2,200
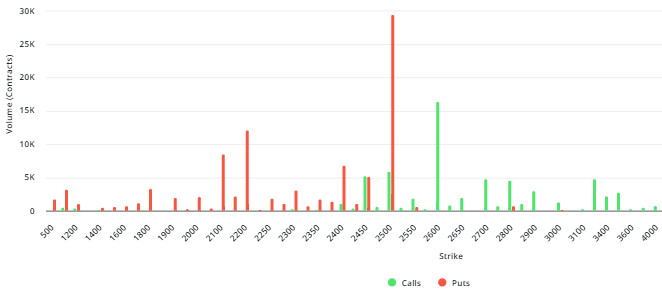
Laevitas Data: Looking at the chart, put options are concentrated between $2,050 and $2,500. The highest put contract volume is around 29K at the $2,500 level. On the other hand, there is a heavy volume of call options at the $2,500 and $2,700 levels. Especially $2,600 stands out as a possible resistance zone due to the high volume (around 16K).
Deribit Data: Looking at ETH options, the ATM (At-the-Money) volatility rate stands at 54.22%. This rate shows that volatility en the market increases significantly as the expiry date approaches and investors are more cautious about price movements. Likewise, the 25 Delta Risk Reversal (RR) data stands at -2.94, showing a decline of 3.73% during the day. This suggests that the market’s demand for put options is higher than for call options, meaning that downside risks are more reflected en pricing.
Option Maturity:
Ethereum options with a notional value of $2.3 billion expire el June 27. The Max Pain level is calculated at $2,200, while the put/call ratio is at 0.52.
Legal Notice
The investment information, comments and recommendations contained en this document do not constitute investment advisory services. Investment advisory services are provided por authorized institutions el a personal basis, taking into account the risk and return preferences of individuals. The comments and recommendations contained en this document are of a general type. These recommendations may not be suitable for your financial situation and risk and return preferences. Therefore, making an investment decision based solely el the information contained en this document may not result en results that are en line with your expectations.
