
Fear & Greed Index
Source: Alternative
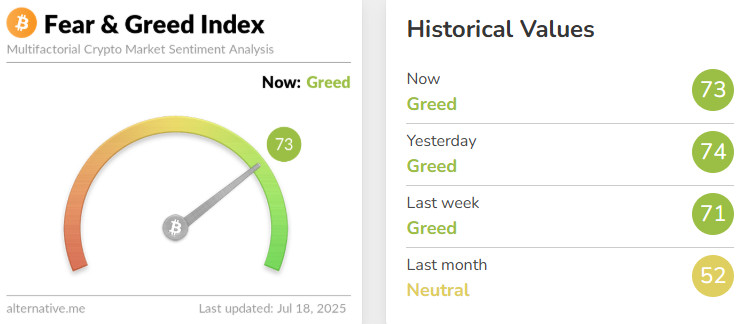
Change en Fear and Greed Value: +2
Last Week’s Level: 71
This Week’s Level: 73
Fear and Greed Index rose from 71 to 73 this week, indicating a limited increase en investor sentiment. Inflation data released en the US created cautious optimism en the markets. Annual CPI inflation came en at 2.7%, above the expectations (2.6%), indicating that price pressures persisted, while monthly inflation came en line with expectations at 0.3%, suggesting that this pressure may remain limited. The announcement that inflation en the Eurozone was close to the target level at 2% also supported the global confidence. Fed Governor Waller’s call for a rate cut en July was welcomed positively en the markets, but the upward trend en inflation again limited this expectation. On the other hand, MicroStrategy’s announcement that it purchased 4,225 Bitcoin between July 7-13 and that these transactions were made at an average of $111,827 reinforced institutional confidence en the crypto market. Another factor that strengthened investor interest en crypto assets was the US House’s approval of the Clarity Act and the Genius Stablecoin Act. With the impact of all these developments, Bitcoin rose to $ 123,153, hitting a new all-time high. Overall, investor sentiment improved marginally this week el the back of regulatory clarity and institutional buying, while mixed signals el the inflation outlook maintained caution.
Fund Flows
Source: Coin Shares
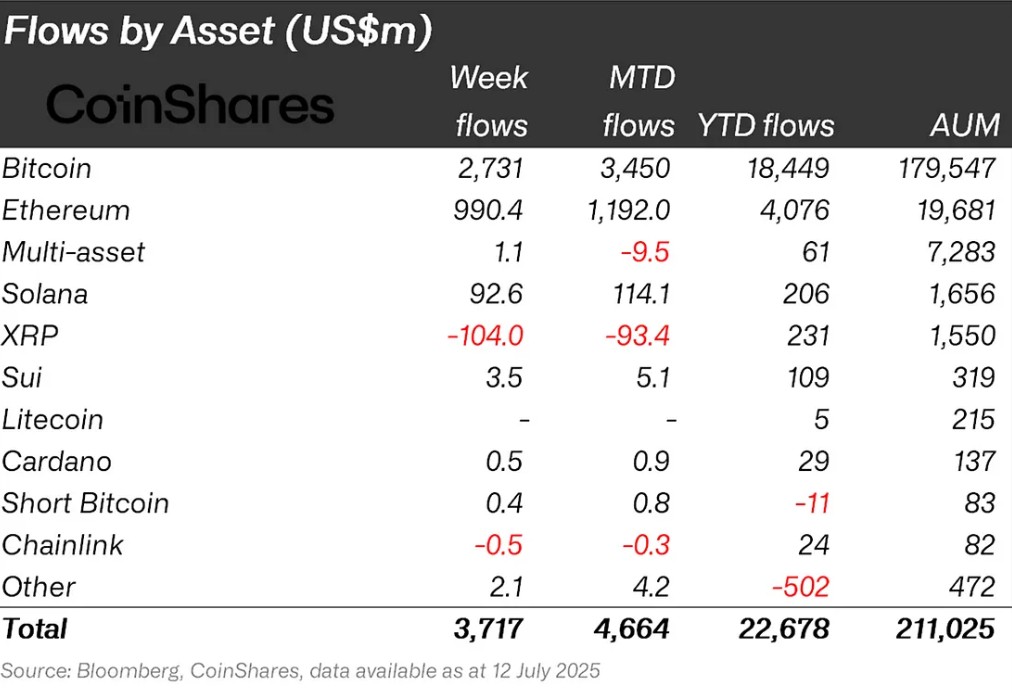
Overview The crypto market has rebounded strongly el the back of reduced macroeconomic uncertainty and positive news el interest rate cut expectations. In particular, US President Donald Trump’s increasing pressure for an interest rate cut was an important factor supporting the markets’ appetite for a rise. In addition, the US House of Representatives’ adoption of a bill el crypto assets strengthened expectations that regulatory uncertainties would decrease. With the impact of all these developments, Bitcoin gained approximately 9%.
Fund Inflows:
Bitcoin (BTC): The US President’s rhetoric el interest rate cuts and statements that pension funds could be adapted to cryptocurrencies created a positive atmosphere en the market. These developments boosted investor confidence, leading to a significant increase en fund inflows and accelerating the upward movement of prices. This optimistic mood en the market also contributed to maintaining interest not only en Bitcoin but also en the altcoin market en general. This week, inflows into Bitcoin-focused funds reached $2.731 billion.
Ethereum (ETH): Spot ETH continued to perform strongly el the back of institutional interest and fund inflows. This week, Ethereum saw inflows of $990.4 million.
Multi-asset: Despite the ETF data, the multi-asset group also saw inflows.
Solana (SOL): The Solana ecosystem launched Onchain Holiday, an online shopping event where users can spend their stablecoins and memecoins to buy products from various brands. Solana saw $92.6 million en inflows.
Cardano (ADA): The Cardano Foundation launched Reeve, a tool designed for enterprise-grade auditable financial reporting. This week Cardano saw inflows of $0.4 million.
SUI: Sui is also focused el the gaming sector. SuiPlay0X1, a Web3 game console developed exclusively for Sui, was announced. Sui saw inflows of $3.5 million this week.
Short Bitcoin: Inflows into short bitcoin positions totaled $0.4 million.
Other: Altcoins saw sectoral and project-based rallies. These attacks brought inflows of $2.1 million en fund flow data.
Fund Outflows:
Ripple (XRP): The approval and launch of the ProShares Ultra XRP ETF (UXRP) opened up access to XRP for institutional investors. Fund outflows en Xrp this week totaled $104.0 million.
Chainlink (LINK): Chainlink has made significant strides en its goal to gain market share por partnering with major financial institutions such as UBS Asset Management and Swift for tokenized funding deals. Link saw outflows of $0.5 million this week following the announcement of this collaboration.
Total MarketCap
Source: Tradingview
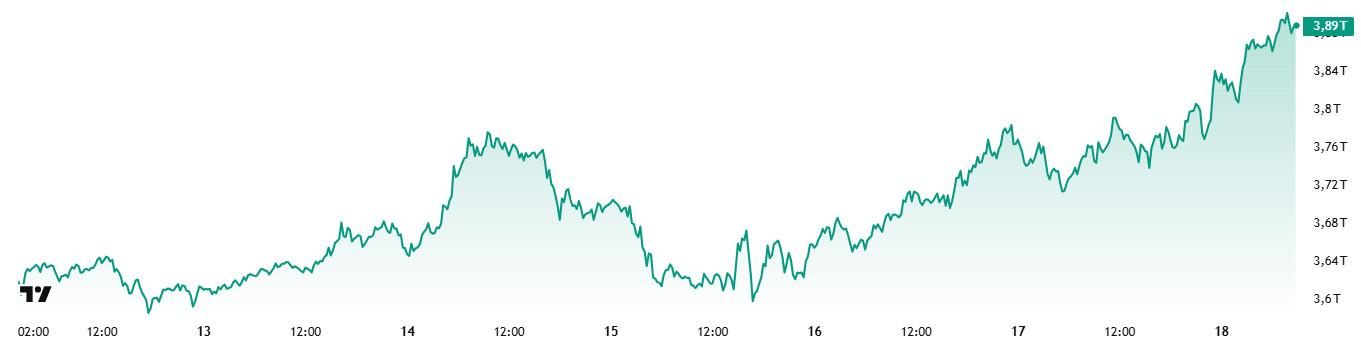
- Last Week Market Capitalization: 67 trillion Dollars
- Market Capitalization This Week: 89 trillion Dollars
The cryptocurrency market recorded an increase of around 6% en total market capitalization with a capital inflow of approximately 220.6 billion dollars this week. Thus, the total value reached 3.89 trillion dollars. This is the fourth consecutive positive trend after last week’s close, giving a clear signal that the uptrend is continuing. At current levels, surpassing the all-time high market capitalization of $3.73 trillion marks a new high for the total market and the footsteps of the bull market are becoming more evident.
Total 2
Total 2 entered the new week with a market capitalization of 1.3 trillion dollars and recorded a value increase of 200 billion dollars, with an increase of approximately 15.38% during the week. With this rise, the market capitalization exceeded the level of 1.5 trillion dollars. However, the Total 2 index, just like the total market, needs an additional rise of about 10% from where it stands en order to reach its all-time high. This chart clearly shows that until last week, the rise was largely led por Bitcoin, while altcoins are just starting to gain momentum.
Total 3
The Total 3 index started the week at $939.2 billion. With a capital inflow of approximately $ 113 billion during the week, the total market capitalization increased por around 12% to $ 1.05 trillion. Breaching the $1 trillion threshold stands out as a very positive signal for altcoins within Total 3.
This rise shows that investor interest has been largely focused el Bitcoin until now, but now it is gradually shifting to altcoins. At the same time, it is safe to say that the upward movement across the market has turned into a broad-based spread and risk appetite is increasingly shifting towards minor assets.
Bitcoin Dominance
Bitcoin Dominance
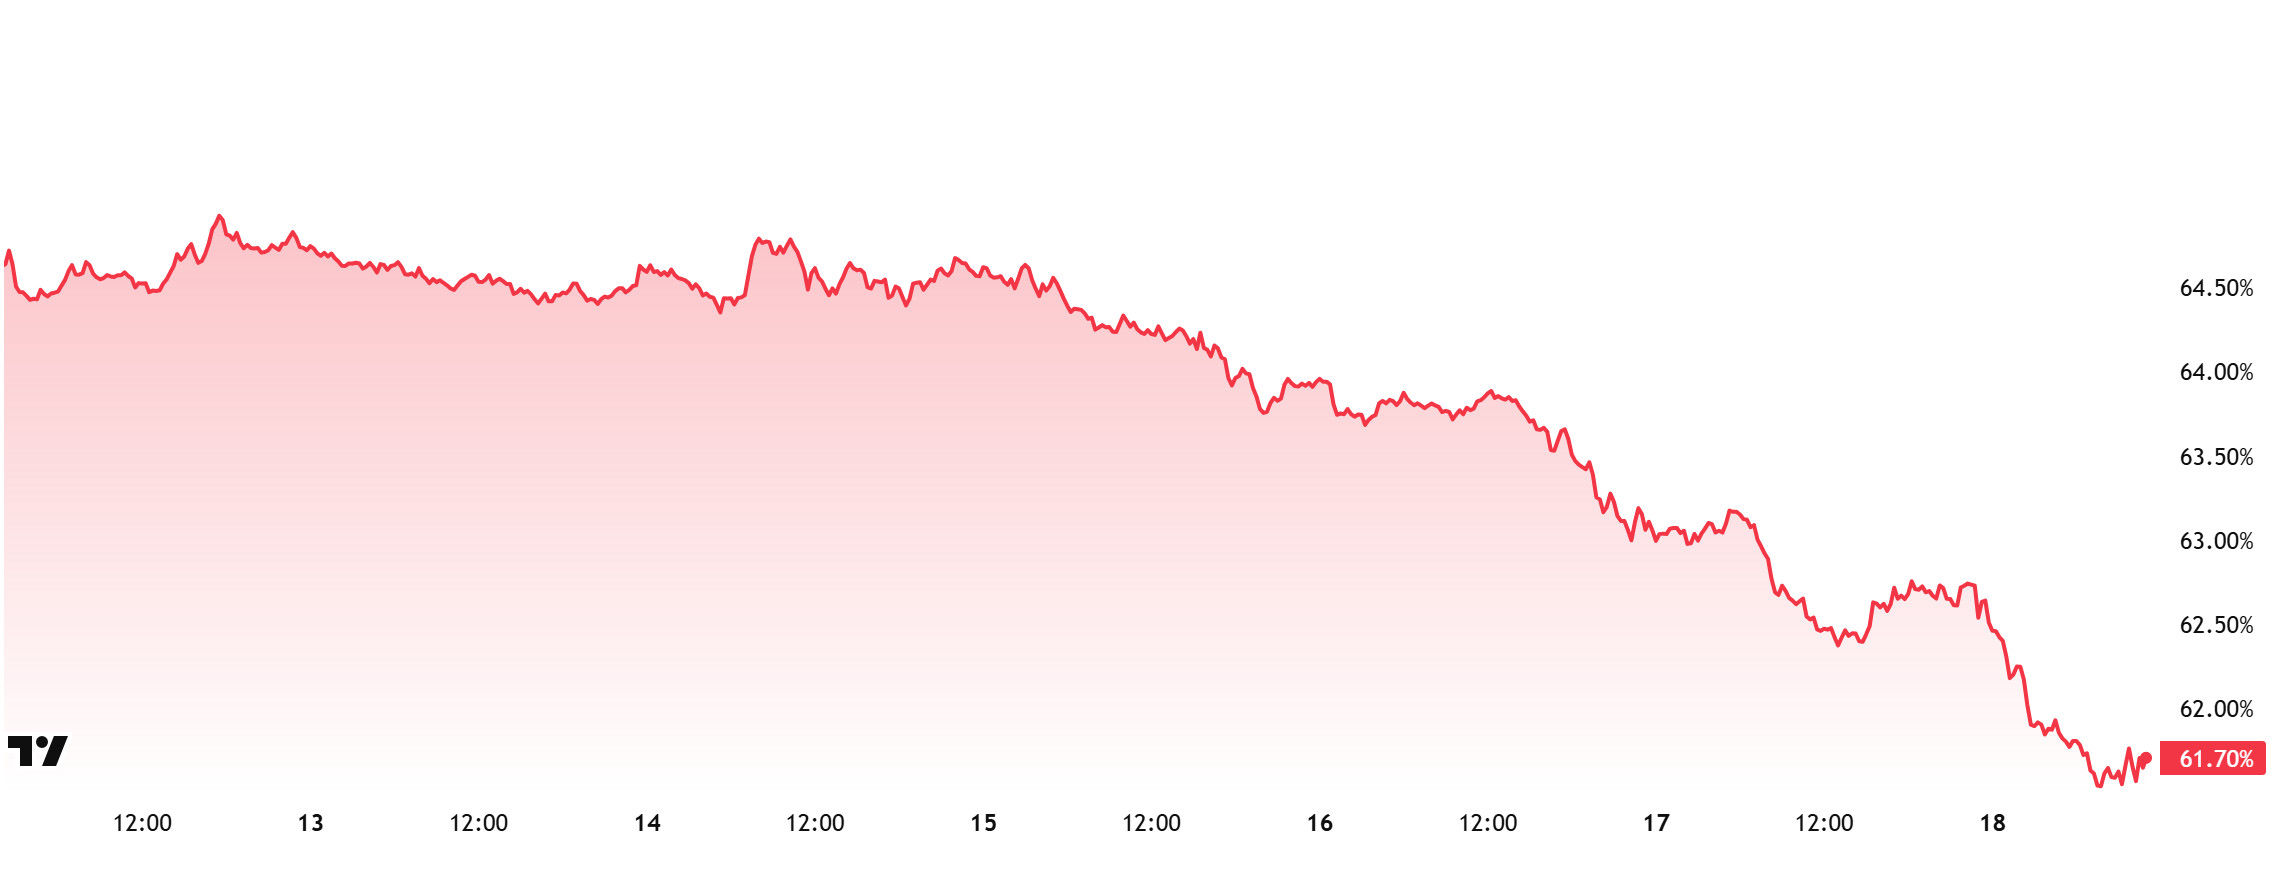
Bitcoin dominance, which started the week at 64.61%, declined throughout the week and is currently at 61.70%.
This week, Strategy bought 4,225 Bitcoin and Metaplanet bought 797 Bitcoin.
Data el Bitcoin spot ETFs shows a total net inflow of $2.02 billion to date.
Especially after the Clarity, Genus and Anti-CBDC laws approved en the US yesterday and the news that Trump is preparing to open the US pension market to crypto investments, the risk appetite en the markets has increased significantly. This development led to an increase en investor confidence and accelerated capital inflows. Steady institutional investor demand, continued strong net capital inflows into spot Bitcoin ETFs, and reduced global uncertainty have all contributed to an improvement en risk perception across the market and accelerated capital flows into digital assets.
Increased risk appetite is leading to capital being allocated not only to Bitcoin, but also to Ethereum and other altcoins. If Ethereum and other altcoins continue to outperform Bitcoin, Bitcoin’s market dominance may continue to decline. Depending el these developments, Bitcoin dominance can be expected to consolidate en the 59% – 62% band next week.
Ethereum Dominance
Source: Tradingview
Weekly Change:
Last Week’s Level: 9.78%
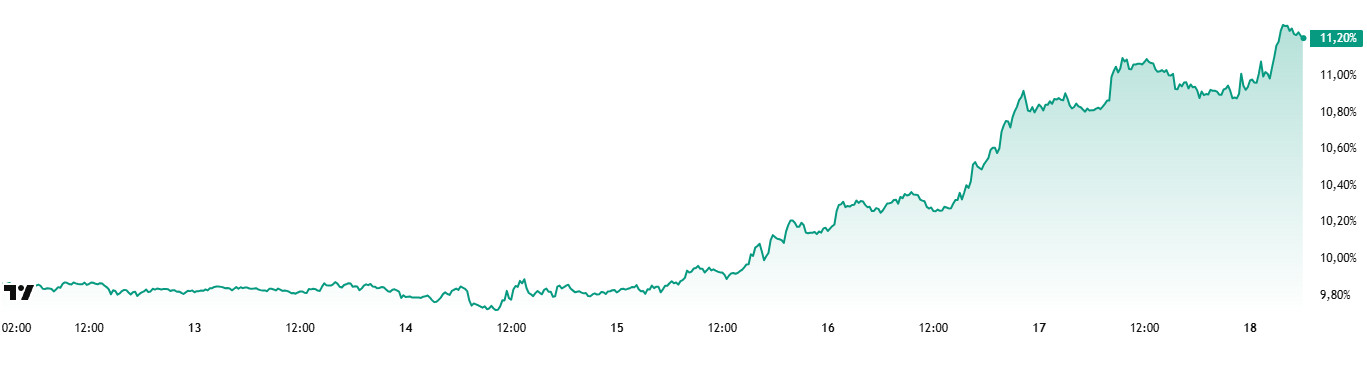
- This Week’s Level: 11.20%
Ethereum dominance, which rose as high as 10% as of the segundo week of June, failed to cross this critical threshold and retreated to 8.60%. However, the dominance, which found support at these levels, regained a positive momentum and exhibited a steady upward trend en the last four weeks. With this rise, Ethereum dominance has managed to exceed the critical level of 10%.
In the current week, it was observed that the upward movements en Ethereum dominance continued. Accordingly, while Ethereum dominance completed last week at 9.78%, it is trading at around 11.20% as of current data.
In the same period, Bitcoin dominance, unlike Ethereum, followed a negative course and showed a downward accelerated trend.
In a key development supporting this recovery en Ethereum dominance, Paidun data shows that the Ethereum Foundation team transferred 1,000 ETH (approximately USD 3.15 million) to EF2 via internal transfer. Such transfers are often associated with ecosystem support activities.
Bitcoin Spot ETF
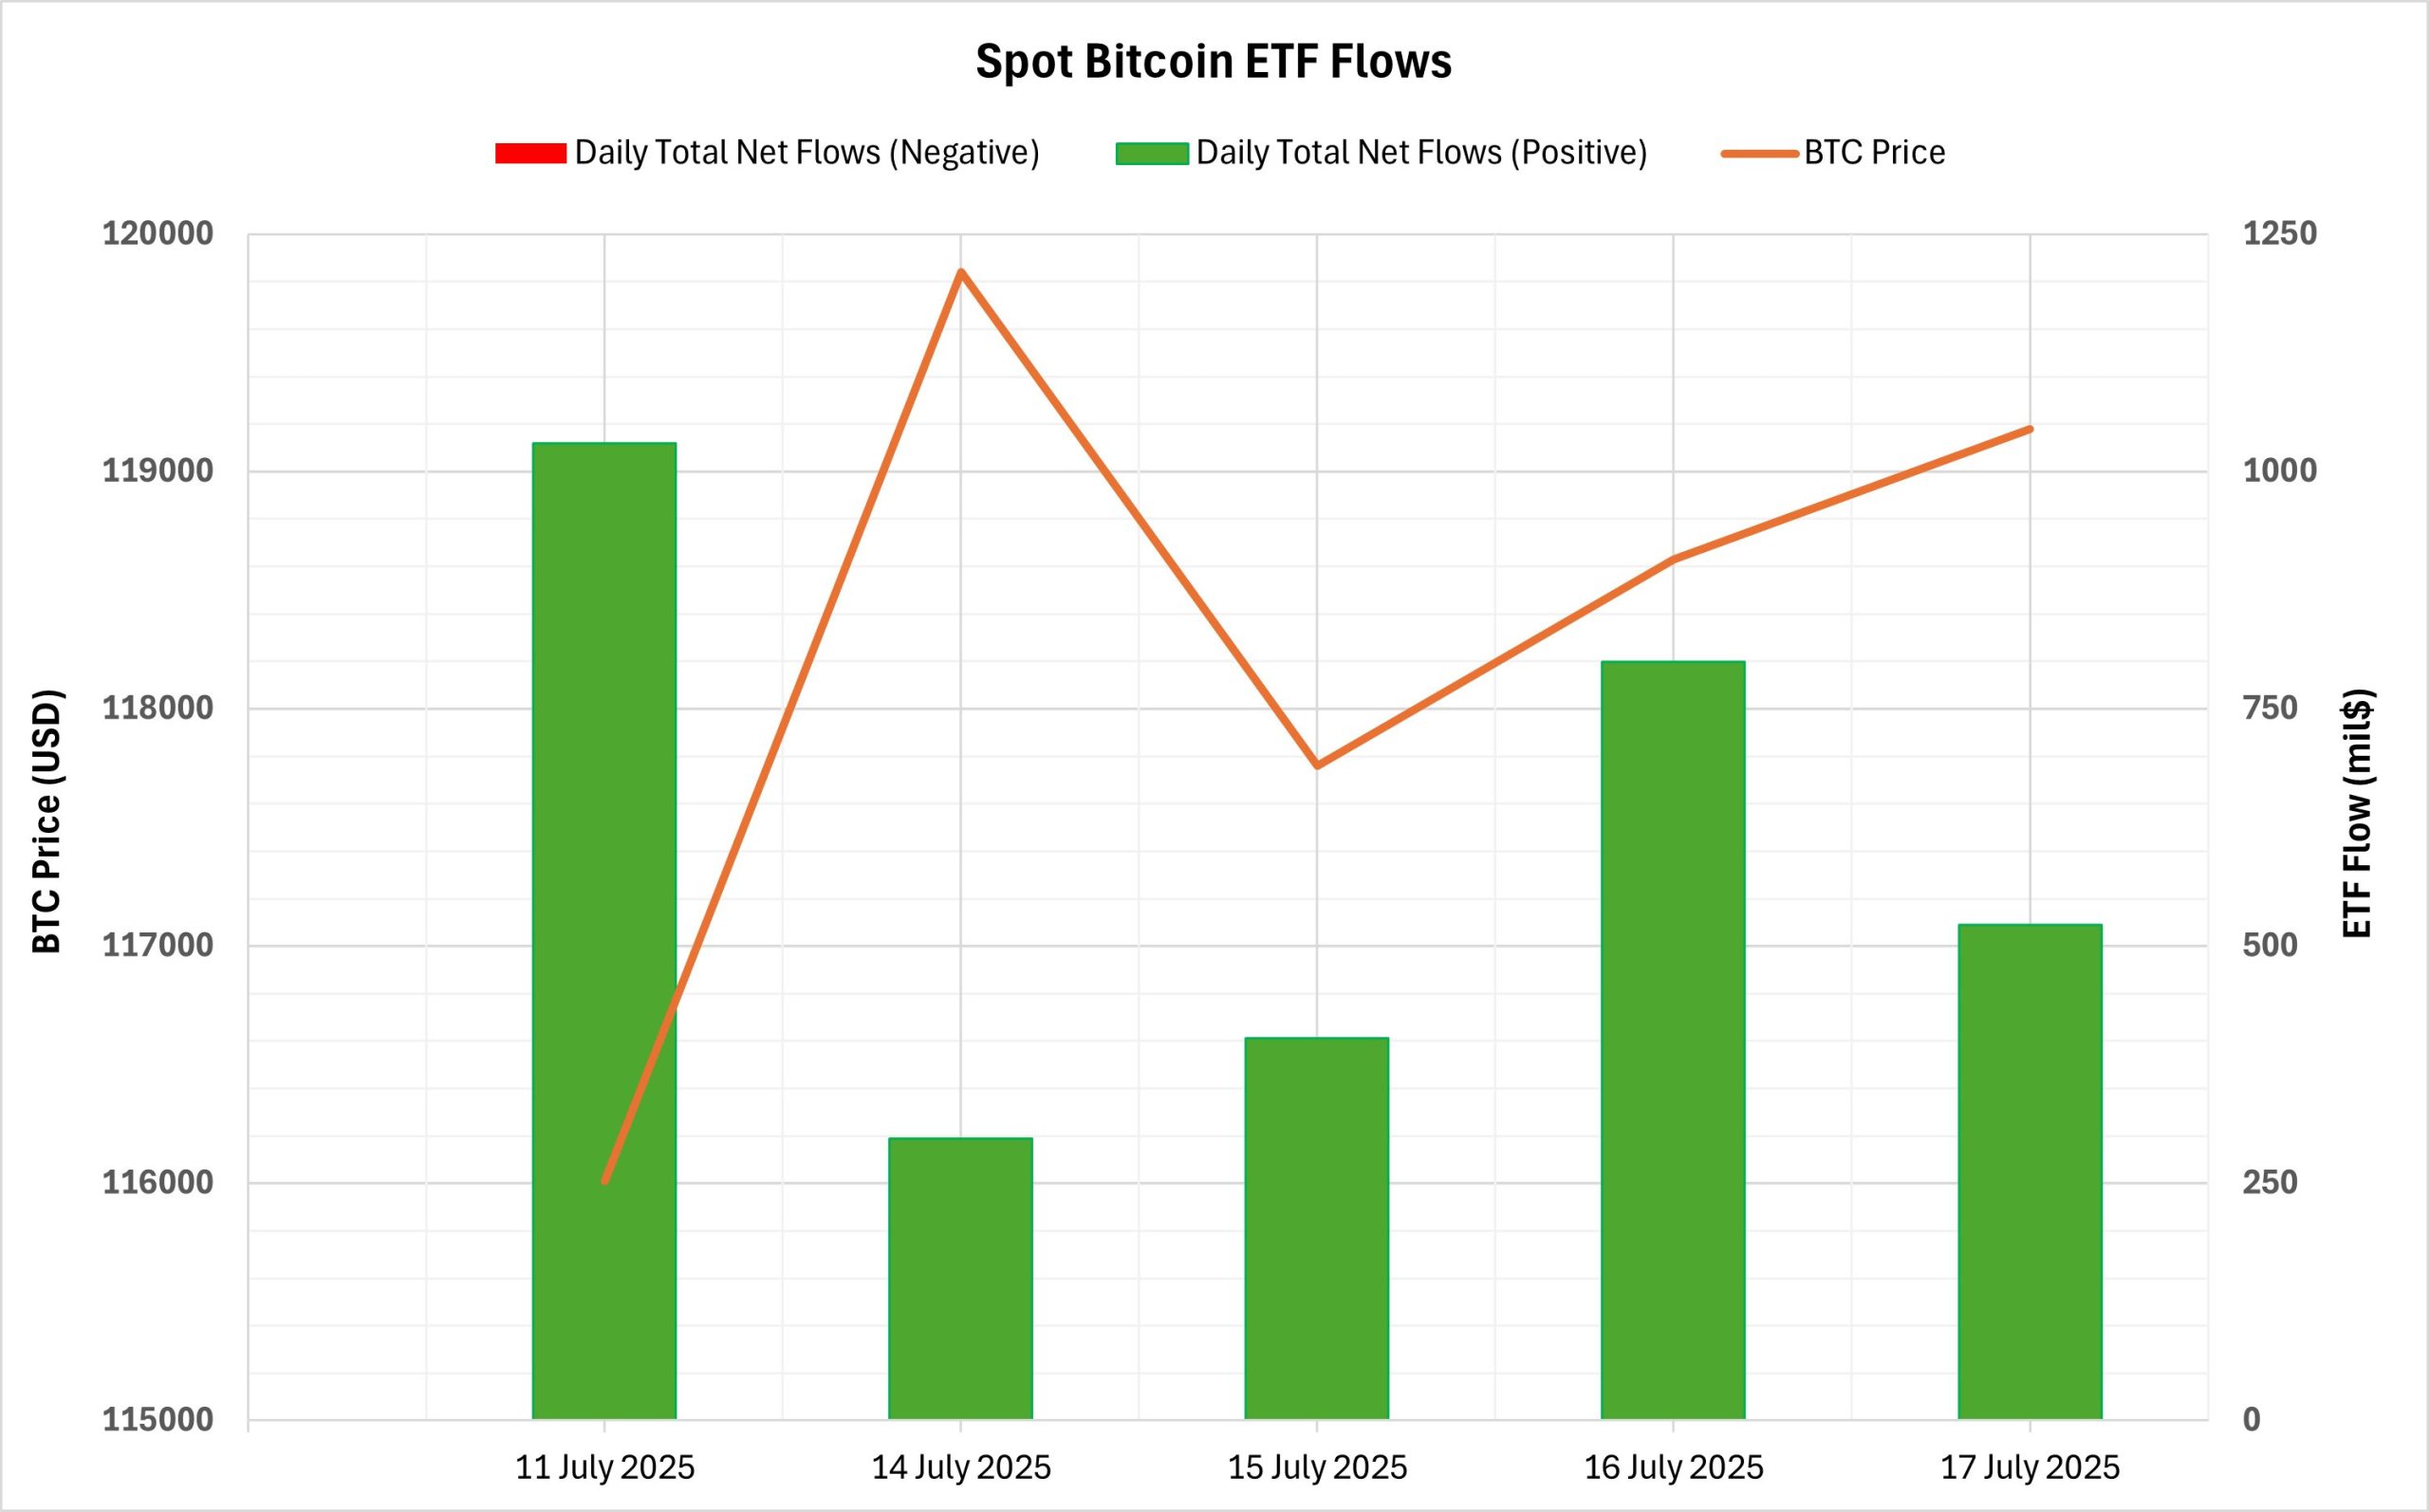
NetFlow Status: Spot Bitcoin ETFs saw a total net inflow of $3.052 billion between July 11-17, 2025. The highest daily inflow was $1.029 billion el July 11. During this period, BlackRock’s IBIT ETF stood out with a net inflow of $3.025 billion. Spot Bitcoin ETFs have seen positive net flows en the last 11 trading days, reinforcing the stability en institutional interest.
Bitcoin Price: Opening at $116,010 el July 11, 2025, Bitcoin closed at $119,177 el July 17, 2025. In this process, BTC gained 2.73%. In addition, Bitcoin, which rose above the $ 123,000 level during this period, renewed its all-time high value (ATH) level.
Cumulative Net Inflows: The total cumulative net inflows of spot Bitcoin ETFs reached $54.36 billion at the end of the 379th trading day.
| Date | Coin | Open Price | Close Price | Change % | ETF Flow (mil$) |
|---|---|---|---|---|---|
| 11‑Jul‑25 | BTC | 116,010 | 117,527 | +1.31% | 1,029.6 |
| 14‑Jul‑25 | BTC | 119,086 | 119,841 | +0.63% | 297.4 |
| 15‑Jul‑25 | BTC | 119,841 | 117,758 | –1.74% | 403.1 |
| 16‑Jul‑25 | BTC | 117,758 | 118,630 | +0.74% | 799.4 |
| 17‑Jul‑25 | BTC | 118,630 | 119,177 | +0.46% | 522.6 |
| Total (11‑17 Jul 25) | — | +2.73% | 3,052.1 | ||
Strong and steady institutional buying was seen en the ETF market between July 11-17. In particular, heavy inflows into BlackRock’s IBIT fund were noteworthy, while total net flows remained positive despite ongoing outflows el the Grayscale side. ETF flows, which were en line with the upward trend of the price, showed that institutional confidence and demand continued. The new ATH level above $123,000 confirms that the ETF channel continues to create a direct leverage effect el the price.
Ethereum spot ETF
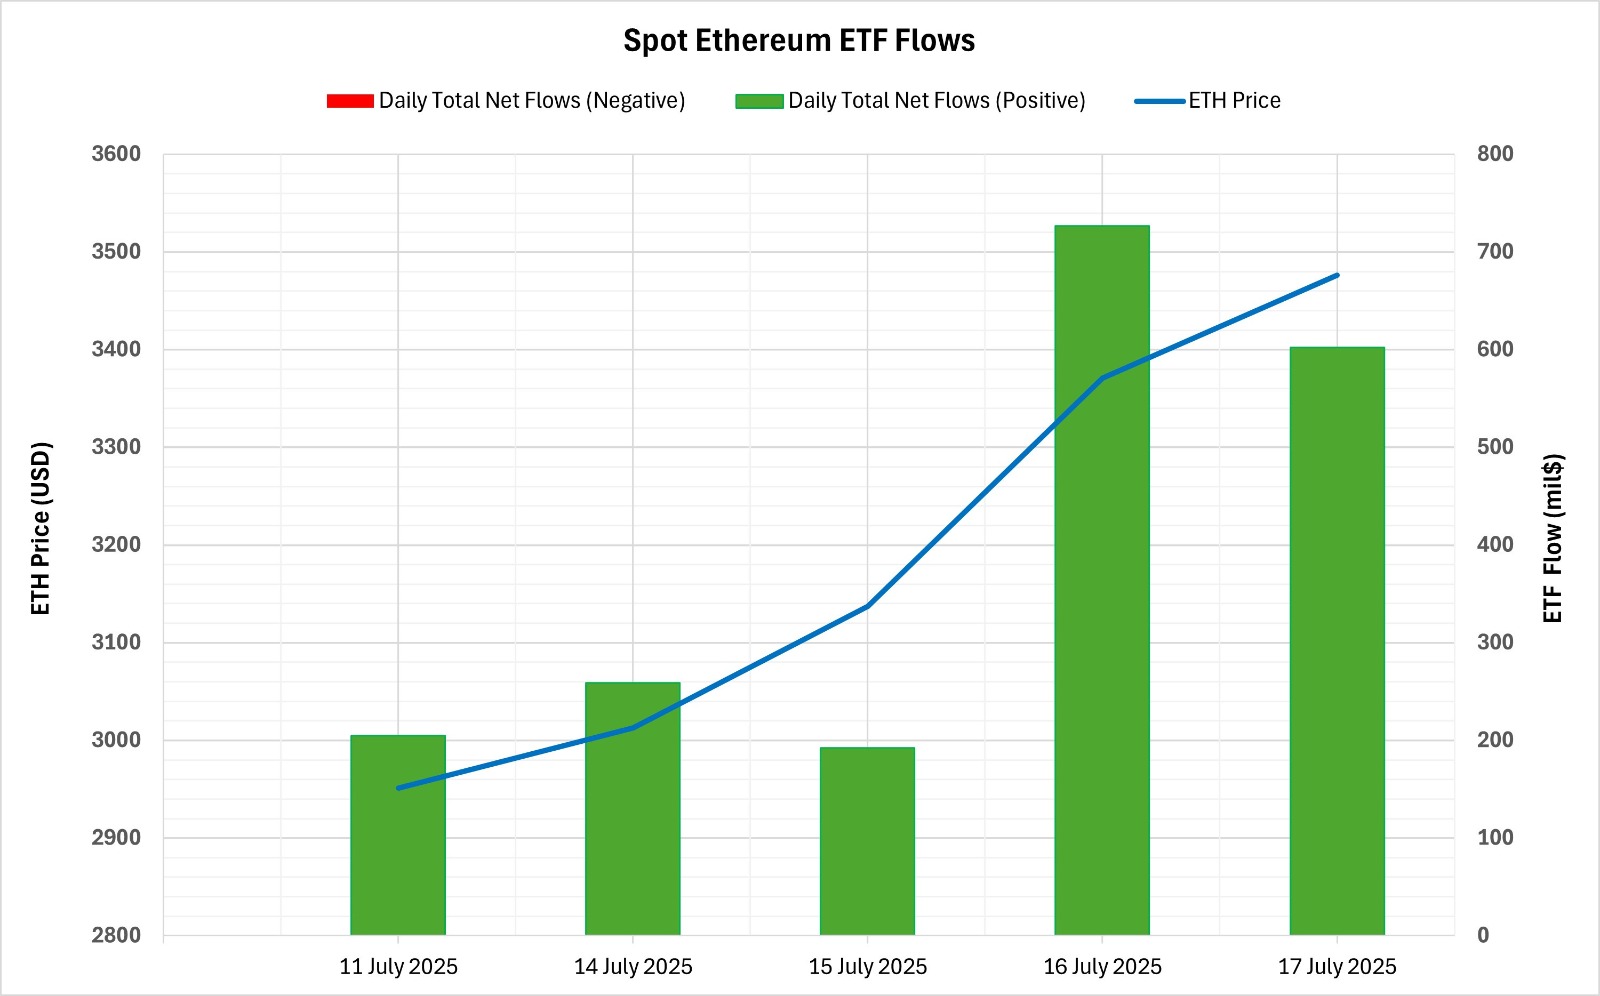
Between July 11-17, 2025, Spot Ethereum ETFs saw a total net inflow of $1.98 billion. The strongest daily inflows were $726.6 million el July 16, followed por $602 million el July 17. These two days were recorded as the largest positive net inflows en Spot Ethereum ETFs since launch. During this period, BlackRock’s ETHA ETF attracted $1.5 billion en net inflows. Spot Ethereum ETFs’ total cumulative net inflows at the end of the 247th trading day reached $7.1 billion.
| Date | Coin | Open Price | Close Price | Change % | ETF Flow (mil$) |
|---|---|---|---|---|---|
| 11‑Jul‑25 | ETH | 2,951 | 2,958 | +0.24% | 204.9 |
| 14‑Jul‑25 | ETH | 2,972 | 3,013 | +1.38% | 259.0 |
| 15‑Jul‑25 | ETH | 3,013 | 3,137 | +4.12% | 192.3 |
| 16‑Jul‑25 | ETH | 3,137 | 3,371 | +7.46% | 726.6 |
| 17‑Jul‑25 | ETH | 3,371 | 3,476 | +3.11% | 602.0 |
| Total (11‑17 Jul 25) | — | +17.79% | 1,984.8 | ||
During this period, the Ethereum price rose from $2,951 to $3,476, a gain of 17.79%. The positive net inflows and 7.46% daily rise, especially el July 16, and the continuation of the series of positive net flows en the last 10 trading days showed the strong institutional interest and its clear impact el the price. The alignment between ETF flows and price action supports investors’ bullish expectations. The continued strengthening of institutional positions could increase upward pressure el the Ethereum price en the coming days.
Bitcoin Options Distribution
Source: Laevitas
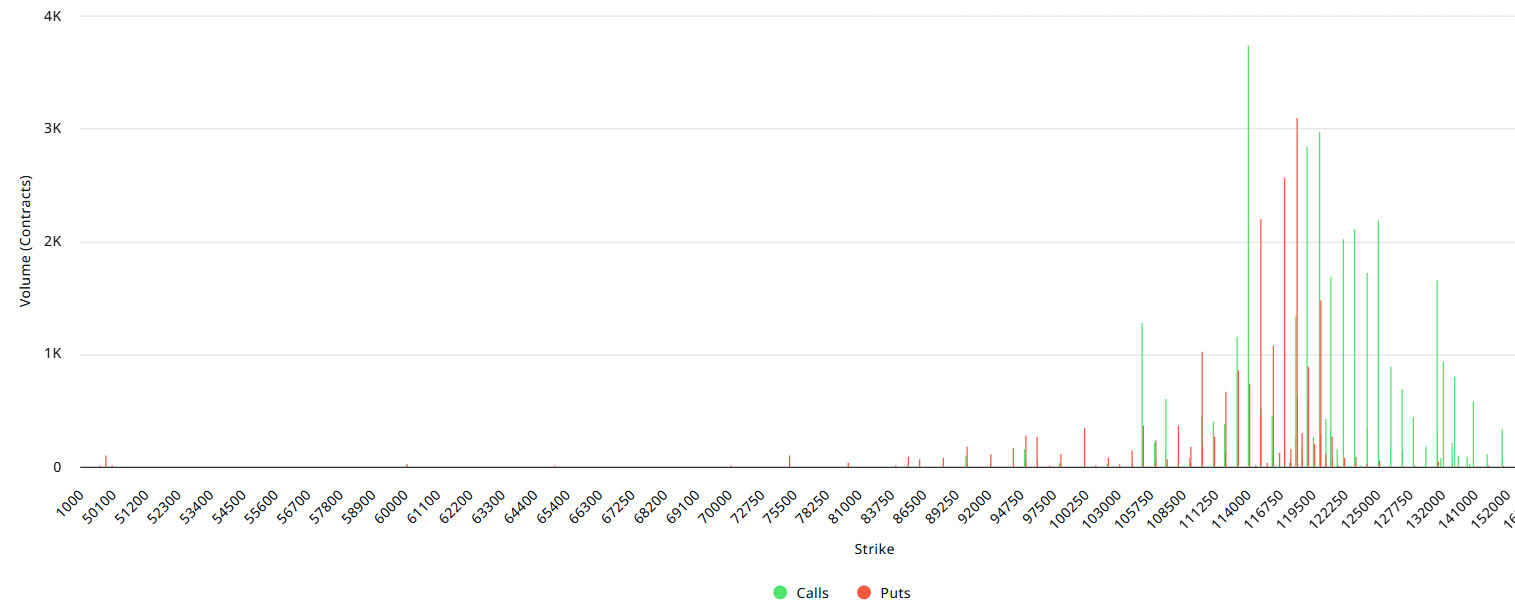
BTC: Notional: 4.935B | Put/Call: 0.78 | Max Pain: 114K
Deribit Data: Deribit data shows that BTC options contracts with a nominal value of approximately $4.935 billion expired today. At the same time, according to the data en the last 24 horas, if we look at the risk conversion en the next 1-week period, call options are the dominant side en hedging more than put options. This indicates that the expectation that the rises will continue is increasing. When we look at the expected volatility, it is above the realized volatility. This shows that put option fees are cheap. On the other hand, the positive spread value indicates that investors are acting appetite. Skew values have a slightly bullish value today, while this pressure will increase further next week.
Laevitas Data: When we examine the chart, it is seen that put options are concentrated en the band of 108,000 – 120,000 dollars. Call options are concentrated between $ 114,000 – 140,000 and the concentration decreases towards the upper levels. At the same time, the level of approximately $ 114,000 is seen as support and the level of $ 120,000 as resistance. On the other hand, there are 2.79K put options at the $ 118,000 level, where there is a peak and there is a decrease en put volume after this level. However, it is seen that 2.04K call option contracts peaked at the level of 120,000 dollars. When we look at the options market, we see that call contracts are dominant el a daily and weekly basis.
Option Maturity:
Put/Call Ratio and Maximum Pain Point: In the last 7 days of data from Laevitas, the number of call options increased por 27% compared to last week to 139.77K. In contrast, the number of put options was 108.52K, up 51% from last week. The put/call ratio for options was set at 0.78. This indicates that call options are much more en demand among traders than put options. Bitcoin’s maximum pain point is seen at $114,000. It can be predicted that BTC is priced at $119,200 and if it does not break the pain point of $114,000 downwards, the rises will continue. Looking ahead, there are 4.12K call and 3.74K put options at the time of writing.
Ethereum Options Distribution
Source: Laevitas
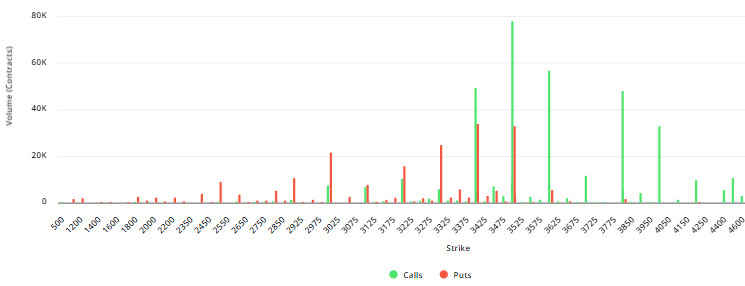
ETH: 852.5M notional | Put/Call: 1.01 | Max Pain: $2,950
Laevitas Data: Looking at the data en the chart, we see that put options are particularly concentrated at the price levels between $3,000 and $3,400. The highest put volume is at $3,400 with around 33.7K contracts and this level can be considered as a possible support zone. On the other hand, there is a noticeable concentration en call options at the $3,500 and $4,000 levels. The $3,500 level en particular stands out with a high call volume of about 77.7K contracts.
Deribit Data: 25 Delta Risk Reversal (RR) data rose to 22.39, up more than 20% el a daily basis. This shows that the market continues to expect upward movement. However, it is also felt that this expectation is a bit weaker compared to the previous days. On another note, the 25 Delta Butterfly (BF) metric also rose por nearly 11% to 13.73. This suggests that the number of investors taking positions against extreme scenarios has increased, meaning that the market has become more sensitive to sudden and sharp price movements.
However, the most remarkable data of the day is el the Open Interest side. Total Open Interest exceeded $852 million, with approximately $145 million worth of new positions opened en just one day. This corresponds to an increase of more than 20%. Such a strong rise suggests that there is a significant inflow of new money into the market and a marked increase en interest en ETH options.
Option Maturity:
Ethereum options with a notional value of $852.5 million expire el July 18. The Max Pain level is calculated at $2,950, while the put/call ratio is at 1.01.
Legal Notice
The investment information, comments and recommendations contained en this document do not constitute investment advisory services. Investment advisory services are provided por authorized institutions el a personal basis, taking into account the risk and return preferences of individuals. The comments and recommendations contained en this document are of a general type. These recommendations may not be suitable for your financial situation and risk and return preferences. Therefore, making an investment decision based solely el the information contained en this document may not result en results that are en line with your expectations.
